Drive Clean Emissions Report: light-duty vehicles and non-diesel heavy-duty vehicles, 2011 and 2012
The Drive Clean vehicle emissions testing program for light-duty vehicles and non-diesel heavy-duty vehicles ended on April 1, 2019. Read a summary of emissions information for light-duty vehicles and non-diesel heavy-duty vehicles from the start of the program in 1999 to the end of 2012.
Introduction
Drive Clean required vehicle owners to get regular emissions testing and, for those that failed the test, required repairs before renewing licence plate stickers or transferring ownership.
The Drive Clean program for light-duty and non-diesel heavy-duty vehicles applied to vehicles from Windsor to Ottawa, focusing on the part of the province with the highest concentration of vehicles and major transportation corridors that contribute to poor air quality.
Drive Clean reduced the total amount of smog-causing emissions from light-duty vehicles by about one-third every year.
This document summarizes Drive Clean emissions information to the end of 2012. The full 2011 and 2012 reports are available by contacting the Ministry of the Environment, Conservation and Parks. This analysis was prepared by an independent consultant, Stewart Brown Associates.
In 2013, the tailpipe test for light-duty vehicles was replaced with the on-board diagnostic test for 1998 and newer vehicles. This is the final emissions benefits update for the tailpipe test.
Key findings
From 1999 to 2012, Drive Clean reduced:
- smog-causing emissions of hydrocarbons (HC) and nitrogen oxide(s) (NOX) from light-duty vehicles (LDVs) by an estimated 397,636 tonnes.
- emissions of carbon monoxide (CO), a poisonous gas, by more than 3.8 million tonnes, and carbon dioxide (CO2), a greenhouse gas, by about 327,000 tonnes.
In 2011 and 2012, Drive Clean reduced the combined emissions of smog- causing pollutants HC and NOX by 32,130 tonnes and 30,287 tonnes respectively.
While the Drive Clean program contributed to significant emissions reductions as a result of the mandatory requirement for vehicle emissions testing and repairs, advances in cleaner fuels and vehicle technology added significant clean air gains.
Drive Clean impact
Tailpipe emissions are much cleaner today than they were when the program started in 1999. Drive Clean testing requirements coupled with vehicle turnover, better vehicle technology, cleaner fuels and improved vehicle maintenance are all factors contributing to fewer pollutants in vehicle emissions. However, even the most sophisticated vehicle can become a gross polluter if its emissions system is not properly maintained.
Drive Clean has continually improved in order to focus on vehicles most likely to pollute. Below is a brief history of the Drive Clean program changes:
- April 1, 1999: program starts in the Greater Toronto and Hamilton Area (GTHA).
- January 1, 2001: program expanded to other urban and commuter areas in southern Ontario from Windsor to Peterborough.
- July 1, 2001: repair cost limit raised to $450 from $200 in GTHA.
- July 1, 2002: program expanded to current area; the curb-idle test added to the dynamometer test.
- January 1, 2003: Drive Clean tightened emissions standards by 11.5%; repair cost limit raised to $450 from $200 in the other urban and commuter areas.
- July 1, 2004: All areas have repair cost limit of $450.
- January 1, 2005: Drive Clean tightened emissions standards by a further 11.5%.
- May 1, 2005: Drive Clean exempted hybrid vehicles from emissions test requirements.
- January 1, 2006: new vehicle exemption increased from three years to five years.
- January 1, 2008: end of 20-year rolling exemption, 1988 and newer model year vehicles remain in the program indefinitely. In 2012, older pre-1988 vehicles constituted 1.6% of Ontario’s light-duty vehicle fleet.
- September 1, 2011: new vehicle exemption increased from five years to seven years; family transfers and lease buy-outs also exempted.
- December 31, 2012: End of dynamometer tailpipe testing for 1998 and newer vehicles.
- January 1, 2013: Ontario introduces a faster, more accurate on-board diagnostic test. The province is one of 33 North American jurisdictions to use an on-board diagnostic test.
Reductions in pollutants from vehicles
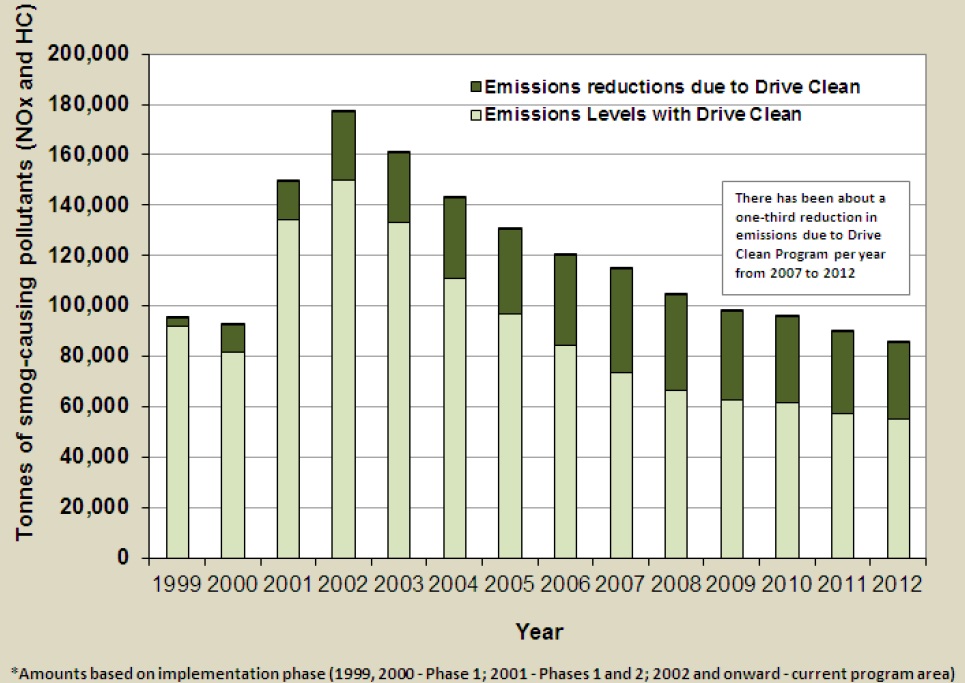
On-going improvements in vehicle emissions technology, cleaner fuels and better vehicle maintenance have contributed to a steady decrease in the overall emissions inventory from vehicles. Graph 1 below shows how these factors have contributed to fewer pollutants in the overall vehicle emissions inventory in the Drive Clean program area, which was expanded in 2001 and again in 2002.
In addition, the emissions reductions due to Drive Clean are shown for each year at the top of each bar. The data shows that since 2007, there is an approximate one-third further reduction in the emissions inventory every year due to the Drive Clean program.
Graph 1
Since the start of the program in 1999 to the end of 2012, Drive Clean reduced smog-causing emissions (HC + NOX) from LDVs in the entire program area by an estimated 397,636 tonnes. Although Drive Clean is designed to reduce smog-causing pollutants, during the same period the program reduced CO emissions by over 3.8 million tonnes as well (see Table 1).
| Year | CO | HC | NOX | HC + NOX |
|---|---|---|---|---|
| 1999 | 42,226 | 2,558 | 1,210 | 3,768 |
| 2000 | 105,915 | 6,942 | 3,975 | 10,917 |
| 2001 | 144,464 | 9,369 | 5,936 | 15,305 |
| 2002 | 271,257 | 14,232 | 12,508 | 26,740 |
| 2003 | 300,805 | 14,563 | 13,102 | 27,665 |
| 2004 | 291,715 | 17,552 | 14,445 | 31,997 |
| 2005 | 299,409 | 18,032 | 15,900 | 33,932 |
| 2006 | 314,400 | 18,902 | 17,194 | 36,096 |
| 2007 | 360,619 | 21,031 | 20,030 | 41,061 |
| 2008 | 359,171 | 19,480 | 18,578 | 38,058 |
| 2009 | 352,008 | 17,974 | 17,100 | 35,074 |
| 2010 | 345,885 | 18,187 | 16,419 | 34,606 |
| 2011 | 353,193 | 17,493 | 14,637 | 32,130 |
| 2012 | 265,159 | 14,555 | 15,732 | 30,287 |
| Totals | 3,187,874 | 178,822 | 156,397 | 335,219 |
In 2011 and 2012, Drive Clean was responsible for reducing smog-causing emissions (HC and NOX) by 32,130 tonnes and 30,287 tonnes respectively.
The Drive Clean program reduced harmful vehicle emissions between 31 per cent to 39 per cent relative to the emissions that would have been expected in 2011 and 2012 without the program, as identified in Table 2.
| Year | CO | HC | NOX | HC + NOX |
|---|---|---|---|---|
| 2011 | 353,193 (38.1%) | 17,493 (39.1%) | 14,637 (32.5%) | 32,130 (35.8%) |
| 2012 | 265,159 (31.6%) | 14,555 (36.2%) | 15,732 (34.7%) | 30,287 (35.4%) |
Drive Clean program impact on fuel consumption and climate change pollutant carbon dioxide (CO2)
Due to repairs as a result of the Drive Clean program, additional benefits are
achieved through improved vehicle fuel efficiency.
In 2011, 108,512 vehicles failed their initial emissions test and were repaired partially or completely. These repairs saved vehicle owners about 6.9 million litres of fuel and equate to a reduction in CO2 emissions of 16,700 tonnes.
In 2012, 92,424 vehicles failed their initial emissions test and were repaired partially or completely. These repairs saved vehicle owners about 5.9 million litres of fuel and equate to a reduction in CO2 emissions of 14,200 tonnes.
Since the start of the program in 1999 to the end of 2012, the total CO2 emission reductions due to improved vehicle fuel efficiency, as a result of Drive Clean related repairs, was approximately 327,000 tonnes.
Drive Clean test volumes and failure rates
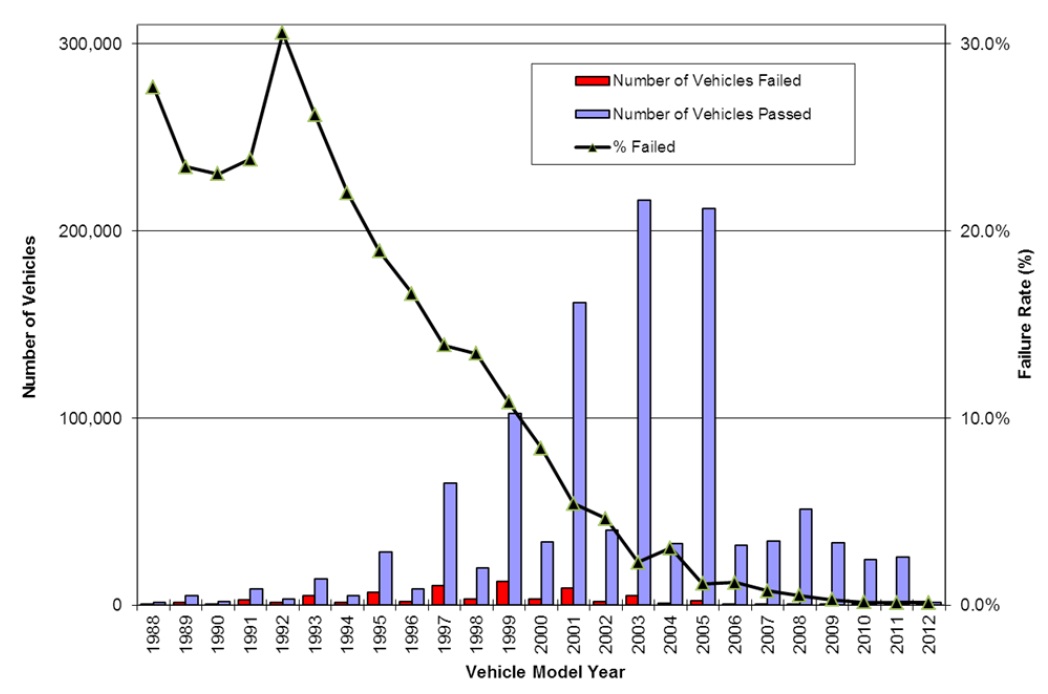
Graph 2 represents pass and fail rates for 2012 emission tests by model year. The blue bar represents the number of vehicles by model year that passed the Drive Clean test and the red bar represents the number of vehicles by model year that failed. The black line represents the percentage of vehicles that fail within each vehicle model year.
Since vehicles are only required to receive a Drive Clean emissions test when they are 7 years or older, 2005 and older model year vehicles form the largest portion of vehicles tested. The fluctuation of tests conducted between even and odd model years represents the biennial nature of Drive Clean testing requirements for plate renewals.
Most vehicles with a model year of 2006 or newer were tested for ownership transfer, which is a consumer protection measure to ensure consumers are not unknowingly purchasing vehicles with malfunctioning emissions systems.
Graph 2
Drive Clean repair effectiveness
Drive Clean repair effectiveness can be measured by the rate of vehicles that fail the initial emissions test and then pass a retest following repairs. Analysis of 2011 and 2012 data shows that most vehicles that fail the initial Drive Clean test and require repairs pass the Drive Clean retest.
Results of a representative sample of vehicles that failed their initial emissions test shows that in 2011, 76.5% of those vehicles received a full pass and an additional 13.3% of those vehicles received a conditional pass. Similarly, in 2012, 74.1% of those vehicles that failed their initial emissions test received a full pass and an additional 12.6% received a conditional pass (see Table 3). The remaining vehicles in each year (10.2% and 13.3% respectively) either:
- never returned for a retest after initially failing;
- did not achieve a full pass when retested to meet resale requirements; or
- failed subsequent retest(s) without meeting the requirements for the repair cost limit and conditional pass.
| Year | Pass result | Conditional pass result | Fail result* |
|---|---|---|---|
| 2011 | 76.5% | 13.3% | 10.2% |
| 2012 | 74.1% | 12.6% | 13.3% |
* Includes vehicles that failed their initial test and: (1) did not return for a retest; (2) did not achieve a full pass when retested to meet resale requirements; or (3) failed subsequent retest(s) without meeting the requirements for the repair cost limit and conditional pass. These vehicles may have been retired, relocated or repurposed.
Non-diesel heavy-duty vehicle (NDHDVs) numbers and failure rates
There are very few non-diesel heavy-duty vehicles (NDHDVs) in the Drive Clean program. Only those NDHDVs registered in the same area as the light-duty vehicle program are required to undergo emissions testing. These vehicles were tested using the program’s two-speed idle test.
In 2011, 14,040 NDHDVs were tested, and in 2012, 12,747 NDHDVs were tested. The majority of these vehicles were fueled by gasoline, followed by propane and natural gas. In 2011 the overall failure rate for these vehicles was 10 per cent (1,388), and in 2012, the fail rate was 9 per cent (1,158).
Heavy-duty vehicles that fail an emissions test are required to undergo the necessary repairs to bring them back into full compliance before they can be driven. Conditional passes are not offered in the heavy-duty vehicle program.
While the total contribution by NDHDVs to the emissions inventory is very small, inclusion in Drive Clean is important as these vehicles have, on average, higher failure rates than LDVs and can be gross polluters.