Poverty Reduction Strategy (2015 Annual Report)
Ontario is working to ensure that everyone in the province has an opportunity to reach their full potential. We’re working to make that happen through our Poverty Reduction Strategy. This Annual Report highlights the progress we made together in 2015, and outlines the work ahead.
Minister’s message
This annual report gives us an important opportunity to reflect on the progress we’ve made together over the past year – and since the initial launch of the Poverty Reduction Strategy in 2008 – to reduce poverty in Ontario. While much remains to be done, I’m proud to say that we’ve taken significant steps forward over the past year.
One of the highlights of the year was the launch of the Local Poverty Reduction Fund, a $50 million investment over six years to support innovative and sustainable community-driven initiatives that measurably improve the lives of those most affected by poverty.
With this fund, we are doing things differently and developing a new means to fight poverty that’s based in evidence. Our aim is to find out what works and use the evidence gathered from these projects to expand successful solutions and apply best practices across the province.
We had an overwhelming response to the first round of funding and, in the fall, I had the pleasure of announcing the 41 successful projects in 20 communities across Ontario. These include innovative projects like the Not in Education, Employment or Training Youth program at the Community Innovation Lab in Durham, which connects at-risk youth with local business and academic mentors and provides them with business skills training.
Another highlight of 2015 was the convening of the Expert Advisory Panel on Homelessness – a key step in helping us define, measure and set targets to reduce – and ultimately end – homelessness. We received their final report last fall and have started acting on their recommendations, including setting an ambitious target of ending chronic homelessness in 10 years.
As part of our plan to deliver on that commitment, we launched the updated Long-Term Affordable Housing Strategy in March 2016. The updated Strategy will provide more supports to help people find and stay in their homes and more flexibility and freedom to choose where they want to live.
As part of our commitment to breaking the cycle of poverty for children and youth, we increased the Ontario Child Benefit, bringing the maximum benefit to $1,336 per child under 18, and indexed it to the Consumer Price Index (CPI) so that it keeps pace with the cost of living now and in the future. We also increased the minimum wage and indexed it to the CPI. As of October 2015, the minimum wage increased from $11 to $11.25.
Tracking our progress toward our poverty reduction targets and measuring improvement is crucial to our success. Since we launched the first Poverty Reduction Strategy in 2008, we’ve made progress on a number of our poverty reduction indicators. For example, the proportion of Ontario families with children living in poverty has been declining since 2008 and, most significantly, we have made this progress in the face of a recession. In addition, high school graduation rates have increased from 79% in 2008-09 to 84% in 2013-14.
It’s an exciting time. There is a real sense of momentum building and an important shift happening, both here in Ontario and across Canada. Instead of talking about problems, we’re talking about solutions, and recognizing that we all have a part to play in driving change and ending poverty. We are all working together and focusing on making a real difference for our most vulnerable people. There is increasingly an understanding that we are all better off when the lives of our most vulnerable are improved and that we can make real progress when we all work together.
We know there is more work to do to ensure that all Ontarians can reach their full potential. That’s why we will continue to develop a body of evidence about what works, make strategic investments to improve outcomes for people and track our progress against our poverty reduction indicators. In doing so, we are working across government and with municipalities and service providers to collect the data and information we need to be the most effective we can be.
The good news is we now have a new federal partner who is committed to making continued progress on reducing poverty. We look forward to working with them to reduce poverty across Canada, including commitments to introduce the Canada Child Benefit, develop a national poverty reduction strategy, invest in affordable housing and restore the long-form census. Working together with our all our partners, I know that we are going to continue to make real progress on our poverty reduction targets.
Introduction
In September 2014, Ontario launched the second Poverty Reduction Strategy, Realizing Our Potential, 2014-19. In doing so, the province made four key commitments:
- to recommit to the original Strategy’s goal of lifting 25 % of Ontario children out of poverty in five years;
- to move towards employment and income security for vulnerable groups (including women, single parents, people with disabilities, youth, newcomers, visible minorities, seniors and Indigenous people);
- to end homelessness; and
- to build the evidence base required to guide effective poverty reduction policies and programs.
A year and a half later, our government can report that we have made meaningful advances in the areas of child poverty, employment and homelessness. Highlights include indexing the Ontario Child Benefit to inflation to help families deal with the rising cost of living, raising the minimum wage and indexing it to inflation, investing in employment and training for youth and other vulnerable populations, and committing to ending chronic homelessness in ten years.
We also remain committed to measuring the outcomes of our Poverty Reduction Strategy by tracking a series of 11 indicators (see Figure 2 in Chapter 4 for indicator definitions). This report outlines the progress we have made on our indicators to date, since the release of the first strategy in 2008. Measuring these results helps us to demonstrate our progress and identify where we must focus our efforts moving forward.
In 2015, Ontario also successfully launched the Local Poverty Reduction Fund, a $50 million, six-year initiative designed to support and evaluate local efforts to prevent and reduce poverty and to build a made-in-Ontario body of evidence of what works. There are now 41 projects in over 20 communities across Ontario benefitting from the first round of grants. These projects will not only support our most vulnerable people, they will also help us build a body of evidence about what works so we can apply best practices across the province and focus on funding programs that are proven to work and can expand over time.
Breaking the cycle of poverty for children and youth
Our government wants to give all children in Ontario the best possible start in life. That is why we deliver a number of programs that provide high-quality child care and health care, a world-leading education and the support and attention children and youth need to be healthy and successful.
The investments Ontario makes in children’s physical, mental and emotional well-being have an impact on their readiness to learn, help them do well in school, and ultimately, set the stage for success throughout life.
1.1 Making a difference
In 2015, we made improvements to various provincial programs that are:
- helping families raise healthy children;
- helping students learn and supporting their long-term success;
- helping Indigenous communities support their children and youth to reach their full potential; and
- helping youth in care achieve academic success and transition to life on their own.
Helping families raise healthy children
In 2015, Ontario made meaningful progress in a number of program areas that help Ontario families raise healthy children:
- The Ontario Child Benefit provides support to hundreds of thousands of low- to moderate-income Ontario families with children under the age of 18. The benefit was central to supporting children and families across Ontario as we experienced the economic downturn. Since it took effect in 2008, the benefit has more than doubled, to a maximum annual payment of $1,336 per child. Most recently, in 2015 we indexed it to inflation to help families keep up with the rising cost of living. Tying future increases to the Ontario Consumer Price Index will ensure that the Ontario Child Benefit keeps pace with inflation now and in the future.
- Healthy Smiles Ontario is an oral health program for children in low-income families created in 2014 out of the consolidation of six former programs. An improved enrolment process and administrative efficiencies meant that by the end of 2015, nearly 45,000 children and youth had enrolled in the program. Approximately 6,700 children enrolled were newly eligible for free dental care as a result of an increase in financial eligibility.
- Child care and early years programming are additional ways through which Ontario supports children and families. In 2015, the government brought into effect the Child Care and Early Years Act, which expanded access to licensed child care by allowing providers to offer an additional space in their program (six spaces can now be offered instead of five). The legislation also broadens the province’s enforcement powers, allowing it to shut down a provider to protect children when their safety may be at risk.
- Since 2015, the government has allocated funding for 2,901 new licensed child care spaces in schools across Ontario. These additional spaces will give children the opportunity to transition from child care into Full-Day Kindergarten under one roof. And not only does Full-Day Kindergarten provide the building blocks for lifelong learning, it also assists families with the costs of raising children: it has been estimated that the program saves Ontario families on average $6,500 a year in child care costs.
Ontario’s Tele-Mental Health Service expanded access to specialized mental health assessments for children and youth in rural and remote communities using videoconferencing. In 2014-15 the service provided more than 2,800 psychiatric consults and provided children and youth with specialized services, reducing travel time and costs for low-income families.
Helping students learn and supporting their long-term success
Student success begins in the early years and must be supported across the school years. In 2015, Ontario has invested in programs that support school achievement and the transition of young people from school to higher education, training or the world of work, for example:
- In the 2014-15 school year, full-day kindergarten became available to all four- and five-year-old children in Ontario, reaching about 260,000 students at 3,600 publicly funded schools. Research shows that children who have participated in Full-Day Kindergarten are better prepared to enter Grade 1 and be more successful in school.
- In 2015, Ontario expanded its support for the province’s Student Nutrition Program, which funds volunteer-run nutritious breakfast, snack, and lunch programs at schools and community locations across Ontario.
- In addition to focusing on the early years, Ontario is investing in programs that help increase high school graduation rates. The urban and priority high schools initiative funds after-school sports programming, summer camps, additional teachers and social workers. A review showed that students in participating schools are successfully completing more grade 9 and 10 credits – a predictor of high school graduation.
Student nutrition program

Accessible description of infographic 1
To combat summer learning loss, an issue that is particularly prevalent among students who come from socio-economically disadvantaged backgrounds, the province offers the Summer Learning Program. The program develops literacy and numeracy skills through educational and recreational programming offered to academically vulnerable primary and junior school students during the summer months. Over 10,000 students across the province participated in the 2015 Summer Learning Program.
Raven Chopowick dreamed of opening up her own bakery but didn’t know where to start. The 25-year-old mother of three wanted to do something that would make life better for her and her family but she worried about not being able to be there for her children while she pursued her dream. Fortunately, she didn’t have to make that choice. The Hope Ventures program offered by the Salvation Army Bethany Hope Centre in Ottawa enabled her to do both. Hope Ventures teaches young parents how to start and run a small business through in-class and one-on-one support. On-site child care, bus tickets and lunch is provided to program participants. “With free child care on site, I…never had to worry about whether my child’s needs were being met,” says Chopowick. Chopowick is now the proud owner of The Crunchy Cabin home-based bakery. With support from Ontario’s Local Poverty Reduction Fund, the centre is evaluating how young parents like Chopowick are benefiting from the Hope Ventures program.
Working together : Local Poverty Reduction Fund
Keeping youth in education, employment and training: Cooking up a bright future
Young people in the Culinary Training for Youth program in Brampton are slicing, dicing and whisking their way to success. Catholic Family Services of Peel-Dufferin offers the program through its Good Food Brampton Community Kitchen. The 16-week program teaches food industry skills to young people aged 15 to 29 who are unemployed or underemployed. Program participants learn how to plan menus and prepare food from a certified chef in a commercial kitchen with state-of-the-art equipment. They also get help writing resumes and they test out their skills in a work placement. “The goal is to get them out of poverty situations and into employment, where they can thrive,” says Tom Gancarz, the Community Kitchen manager. The program is highly successful at doing just that – about 80 % of graduates are now working full-time in the food services industry. With the help of Ontario’s Local Poverty Reduction Fund, the program is expanding and hiring a youth advocate who will connect participants with the community services they need. The funding will also help the organization evaluate how participants benefit from the program. Gancarz says the program shows how food can be a powerful force for positive change in people’s lives, helping them to form strong bonds with each other and gain new confidence in themselves. “They’ve got a real glow to them when they leave here, compared to the first day they walk through our doors,” he says.
Helping indigenous communities support their children and youth to reach their full potential
Through the Aboriginal Education Strategy, Ontario continues to support First Nation, Métis and Inuit students’ educational achievement and well-being and to close the achievement gap between Indigenous students and other students. The government continues to work to improve achievement among Indigenous students in provincially funded schools and to support life-long learning through transition from elementary to secondary school and from secondary to postsecondary school, training or workplace opportunities.
Helping youth in care achieve academic success and transition to life on their own
We also offer a range of supports to help young people in the care of children’s aid societies so that they can access education, training and employment opportunities that help them transition to living on their own.
- We deliver innovative education programs to children and youth in the care of or receiving services from the Children’s Aid Society. These programs increase engagement through creative and relevant learning opportunities and enriched academic support, as well as ensuring students have a “caring adult” who may be a teacher, guidance counsellor or youth worker – someone who can provide support as a trusted advisor, guide or mentor. In the second semester of the 2014-15 school year, 12 new programs were offered for secondary school students in 12 school boards. In summer 2015, 14 programs for elementary and/or secondary students were offered in 12 school boards.
- The Youth-in-Transition Worker program connects young people with health and legal services, skills training, employment and education resources. There are a total of 60 Youth in Transition Workers across Ontario, with about a third of the workers dedicated to helping Indigenous youth. In 2015, over 1,500 young people participated in the program.
Helping youth in transition
Amelia* had just moved into her first apartment in Guelph when she experienced a manic episode. The 20-year-old grew up in the child welfare system and this was the first time she was living on her own. But she was not alone. With the help of a Youth in Transition Worker, Amelia received the mental health treatment she needed and was safely discharged back into the community. Today, she is living independently with close friends and is on her way to graduating from high school.
*Name has been changed
1.2 Moving forward
The government will continue making it easier for families to access child and family programs by integrating four existing programs to create Ontario Early Years Child and Family Centres. The centres will offer a suite of high-quality early years programs including drop-in programs for children and family programs and workshops, along with services customized to meet local needs. The centres will be in place by 2018 to create a more seamless and integrated system of services and supports for Ontario’s children and families.
We know that postsecondary education improves opportunities for low-income young people, helping to close the educational achievement gap and break the cycle of poverty. Although the postsecondary participation rates of Ontario youth are higher than the rest of Canada, students from lower-income families participate at much lower rates than those with higher incomes (see Figure 1). That is why we are addressing non-financial barriers to accessing postsecondary education and making changes to the Ontario Student Assistance Program to make average college and university tuition free for students with financial need from families with incomes of $50,000 or less.
Changing lives: Good food, good company feeds student success and leads to high school graduation
Bruce Bellefeuille has seen firsthand how food has the power to fuel someone’s potential. Bellefeuille is a teacher at Stamford Second Chance, an alternative education program located in a formerly abandoned storefront in downtown Niagara Falls. Students in the program are at risk of not graduating from high school. Some are living on their own and working full-time jobs to support themselves. At Stamford, they get an opportunity to catch up on credits in small classes and they receive meals thanks to Niagara Nutrition Partners, which is funded by Ontario’s Student Nutrition Program through Haldimand-Norfolk Research, Education and Counselling Help (REACH). Bellefeuille says preparing and eating the food together creates a real sense of community. “When you show attention and care, it draws people in,” says Bellefeuille. Bellefeuille says in that atmosphere it is easier to connect with students and talk to them about finishing school, setting academic goals and leading healthier lifestyles. Most students in the program go on to graduate high school and some go on to college and university. Bellefeuille says the nutrition program is a key ingredient to their students’ success both inside and outside the classroom.
“Because of the combined efforts of all involved, these students are able to feel a sense of equality, pride and importance that encourages them to continue to better themselves, and in turn, our community,” Bellefeuille says.
Currently, government support for students’ educational costs is largely provided through a combination of grants and loans through the Ontario Student Assistance Program and tax credits through the Personal Income Tax system. To help more students qualify for grants and access the student loan system, the government will create a single major upfront grant — the Ontario Student Grant, starting in the 2017–18 school year. This will be done by redirecting 100% of the funding from the 30% Off Ontario Tuition grant, Ontario Student Opportunity Grant, Ontario Access Grants and other grants offered by the Ontario Student Assistance Program. The government also proposes to eliminate the tuition and education tax credits, and all of the additional revenue would be used to support the Ontario Student Grant or other postsecondary, education, training and youth job programs. These changes will ensure that financial support is transparent, timely and targeted to those students with the greatest financial need.
Figure 1 – Postsecondary participation rates by parental income (18-21 year olds)
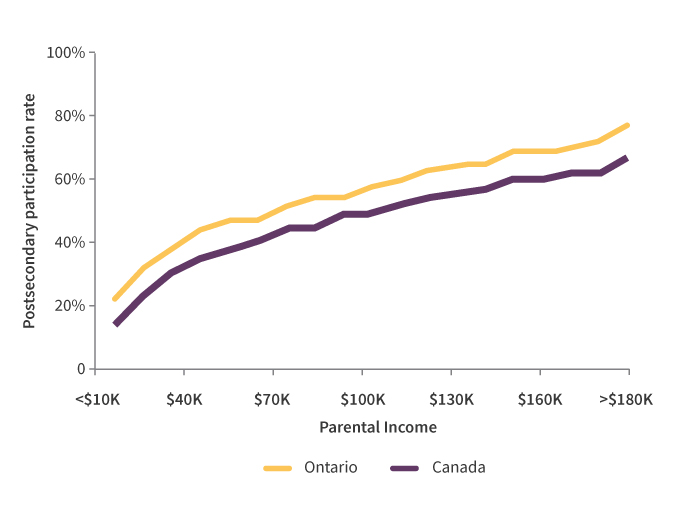
Accessible description of figure 1
Source: Statistics Canada, custom data prepared using tax data, 2013
This year, we will continue to move forward on our commitment to provide additional health benefits to children and youth in low-income families so they can receive the services they need, such as prescription drugs, vision care and mental health supports. We know that these benefits support families that are looking to leave poverty behind.
Through the Moving on Mental Health action plan, we have identified 31 of 33 lead agencies that will be responsible for the delivery of core mental health services to children and young people across the province. Those agencies will collaborate with each other and with other service providers such as schools, hospitals, primary health care providers and child welfare authorities so that families get coordinated support when and where they need it.
The government is also investing $333 million over five years to redesign and consolidate autism services in Ontario so that more children and youth receive critical interventions sooner and achieve improved outcomes through services that are better matched to their needs. Additionally, we are also making it easier for children with special needs to get help. Through the provincial Special Needs Strategy, children with complex special needs will get help from a service planning coordinator who can connect them to the services and support they need. The 2016 Budget announced that the government is investing $17.8 million in the strategy over the next three years.
Together, these measures will help us support higher levels of student achievement and long-term success through higher graduation rates and fewer youth who are not in education, employment or training.
We look forward to working with the new federal government to achieve our shared objectives for children and youth. This includes maximizing the impact of the Canada Child Benefit that is being introduced in July 2016 as we continue to deliver the Ontario Child Benefit, a key initiative under the Poverty Reduction Strategy. Together, these initiatives will help us lift more Ontario children and their families out of poverty.
Progress in 2015: Breaking the Cycle of Poverty for Children and Youth
Supporting Children & Families
- Indexed the Ontario Child Benefit to inflation which increased the maximum annual benefit to $1,336 per child
Improving Educational Progress
- Provided Full-Day Kindergarten to the province’s public schools to prepare children for educational success
- Supported secondary schools in high needs urban neighbourhoods so that more vulnerable youth graduate high school
Building Evidence
Local Poverty Reduction Fund
- Supporting 15 projects that strengthen the well-being of children and youth, reduce their barriers to learning and work and help them access employment, education and training to break the cycle of poverty
Transformation
- Integrated and expanded six oral health programs under the new Healthy Smiles Ontario program
- Announced the launch of Ontario Early Years Child and Family Centres that will offer early years programs
Measuring Results: Progress since 2008
Six indicators allow us to track progress on preventing and reducing child and youth poverty
- Birth weight (steady)
- School readiness (steady)
- High school graduation rates (progress)
- Education progress (progress)
- Child poverty target - LIM-50 (progress)
- Depth of poverty - LIM-40 (progress)
Helping people achieve employment and income security
Ontario provides employment and training services and income security supports to help people improve their financial stability, live a meaningful life and participate more fully in their communities.
Employment earnings are the most important tool we have to increase incomes and help our citizens leave poverty behind. We want our programs to have an impact by reducing the number of Ontarians living in poverty, reducing the incidence of poverty among vulnerable populations and lowering the number of adults experiencing long-term unemployment and youth who are not in education, employment or training.
2.1 Making a difference
In 2015, we provided a variety of supports to enhance employment and income security for Ontarians. These programs:
- provide access to employment, education and training;
- support economic development in Indigenous communities; and
- enhance earnings and income support.
Providing access to employment, education and training
In 2015, Ontario continued to provide core job search, matching and placement services to hundreds of thousands of people looking for work. In addition, we renewed our commitment to helping young people create their own opportunities and access education and training to gain a foothold in the labour market.
- In 2015, Employment Ontario provided services that helped a million Ontarians to train for and/or find jobs both online and in person at more than 300 sites across the province.
- As part of the Ontario government’s renewed Youth Jobs Strategy, in October 2015 the Youth Job Connection program was launched. This program helps youth aged 15 to 29 who are experiencing multiple or complex employment barriers by providing supports beyond traditional job search and placement opportunities. For example, participating youth who are not working, in school or in training may receive paid pre-employment training and job and mentorship opportunities.
- Over the last year, we continued to support the Ontario Youth Entrepreneurship Fund, facilitating the start-up of nearly 900 youth-led businesses. Provincial entrepreneurship programs like this one benefited 3,500 young people in 2015, with nearly half of those enrolled identifying as vulnerable or coming from high-needs communities.
- In 2015, we also expanded the programs we offer through the Ontario Youth Action Plan to help 37,500 more youth in high need communities, reaching a total of 65,000 youth each year. For example, we introduced a new Youth Mentorship Program that connects at-risk young people with mentors who can help them succeed at school, find a job or start a business and take on a leadership role in their community.
Ontario Youth Innovation Fund: by the numbers

The Private Sector Jobs and Mentorship Initiative, a partnership between the province and the non-profit CivicAction, is helping youth in the Greater Toronto and Hamilton areas address barriers to employment. Youth participate in training and mentorship programs that build professional networks and provide employment opportunities. During the most recent phase of the program, 104 new partnerships were formed between the non-profit and private sector organizations and 128 youth-serving agencies were engaged. Additionally, over 300 youth were directly served, and over 200 frontline youth-serving staff received training.
Supporting economic development in indigenous communities
In 2015, the government continued to work with Indigenous businesses, communities and organizations to create economic opportunity and improve social outcomes.
- The Aboriginal Economic Development Fund provides grants and financing to Indigenous communities, businesses and organizations, with a view to diversifying Indigenous economies. The fund is helping to create employment and training opportunities for Indigenous people, assist Indigenous entrepreneurs in starting and expanding small and medium-sized businesses, and to forge economic partnerships between Indigenous communities and the private sector. By the end of 2015, 50 projects had received support through the fund. Increasing economic opportunities for this vulnerable population is important to help lift more Indigenous people out of poverty.
- The Métis Voyageur Development Fund, an independent Métis-controlled economic development corporation, is using provincial funding under the Métis Economic Development Fund to provide grants and loans to Métis entrepreneurs and businesses in resource-based sectors. The program helps Métis individuals, communities and businesses access financing to support economic and business development. In 2014-15, 25 applications and over $1.8 million in grants and loans were approved.
- Additionally, the government released the Long-Term Strategy to End Violence against Indigenous Women and is responding to the recommendations of the Truth and Reconciliation Commission of Canada.
Helping Indigenous students access education, training and employment
Samantha James wanted to take her career underground. “I had lots of family in mining so I knew it was something I wanted to get into,” says the member of the Dokis First Nation. James wanted to take the miner certification program at Northern College in Timmins, but she couldn’t afford the tuition. Thanks to support from Ontario’s Aboriginal Economic Development Fund, James was able to follow in her family’s mining footsteps. The fund supports a partnership between Northern College, Primero Mining and the Wahgoshig First Nation, making tuition free for Indigenous students who want to attend the college’s basic miner certification program. The Wahgoshig First Nation covers daily transportation costs to and from the Primero training site. James graduated from the program in December and is already working as a miner. “I’m really lucky to have this job,” she says. “I wouldn’t have this position if I hadn’t received help to complete the certification program.
Enhancing earnings and income support
In the last year, Ontario has moved to improve the earnings of low-income working families and to strengthen income support for the most vulnerable among us. By enhancing employment earnings, the government is helping to increase the financial stability of hardworking Ontarians. This is critical because we know that an adequate family income is one of the biggest factors that determine a child’s future wellbeing.
- Since 2003, the provincial minimum wage has risen by 64 %. In 2015, the government contributed to this trend by increasing the minimum wage from $11 to $11.25. Ontario has also tied it to the Ontario Consumer Price Index, which means that as the cost of living increases, so, too, will the minimum wage.
- Over the course of 2015, the government also announced the first step in a two-phase wage increase for staff/providers in child care and personal support services. The first wage increases occurred in 2015, which will be followed by further wage increases in 2016:
- Early Childhood Educators and other child care program staff working in licenced centres or agencies are now eligible to earn up to $1 more an hour, plus benefits; an additional $1 hourly wage increase will follow in 2016 for eligible staff, bringing the total wage enhancement up to $2 per hour, plus benefits.
- Home child care providers working with a licensed child care agency are eligible for an increase of up to $10 a day; an additional $10 per day increase will follow in 2016 for eligible providers, bringing the total enhancement up to $20 per day.
- Personal support workers (PSWs) providing publicly funded care at home and in the community have received two annual increases of $1.50 more an hour, with another $1.00 increase coming in 2016 for those PSWs earning less than $19,00/hour.
- In 2015, we strengthened our support for the most vulnerable Ontarians with a $25 per month rate increase for single adults without children on Ontario Works, a 1 % increase for families receiving Ontario Works, and a 1 % increase for individuals with disabilities who rely on the Ontario Disability Support Program. We also continue to help social assistance recipients connect with and maintain jobs by offering employment assistance and supports.
Changing lives : Helping young entrepreneurs access employment and training supports that make their dreams a reality
Kitchener-Waterloo’s Masood Rehman loves everything about skateboards. “I’ve been drawing skateboard designs since grade nine, when I first started skateboarding,” he says. As a teenager, Rehman experienced what he calls a “dark time” when he got involved in street life. He credits skateboarding for helping him to turn his life around. “I decided to take my passion for skateboarding and start a business that could give back to the community in a meaningful way,” he says. Rehman was able to make his dream of a socially conscious skateboard company a reality thanks to the help of Ontario’s Summer Company program. The program offers young people aged 15-29 grants to start and run their own summer businesses. Participants also receive coaching from local business leaders. With the funding and guidance Rehman received from the program, he created Khandor Brand Skateboards. Since launching in 2014, the company has sold over 1,000 skateboards. A share of the company’s profits is donated to charities that help at-risk and homeless youth in Kitchener-Waterloo. Rehman says he not only gained valuable insights from the program’s experienced mentors but also from other students in the program who were going through the same growing pains as they started their own businesses. “I wouldn’t have been able to launch the business as successfully as I did without their help – absolutely not.”
Working together: Local Poverty Reduction Fund
Creating employment opportunities and achieving financial stability: Thinking outside the box to help entrepreneurs
When Kevin Lee saw shops located in shipping containers on the street while visiting Ghana – a light bulb went on. “I thought, we can do that in Toronto,” recalls the executive director of Scadding Court Community Centre. Lee envisioned a shipping container marketplace as a way to help low-income entrepreneurs who would not otherwise be able to start and run their own businesses. So he set about creating the Business Out of a Box model. For just $11 – $26 a day low-income entrepreneurs can rent a refurbished shipping container equipped with running water and electricity. The idea quickly caught on. Five years ago, eight businesses set up shop in shipping containers in a once desolate stretch of sidewalk in front of the community centre. Now, Market 707, as it is known, is home to 18 vendors selling everything from rotis and crepes to clothing and haircuts. With the help of Ontario’s Local Poverty Reduction Fund, the Community Centre is going to measure how Business Out of a Box benefits participants and the community. It is also going to explore how the model can be improved and expanded to help more low-income entrepreneurs achieve financial stability. The goal is to establish and evaluate the success of shipping container markets in two more Toronto neighbourhoods later this year.
2.2 Moving forward
In 2016, the government will be taking a number of steps to improve income security and labour protections for some of the province’s most vulnerable workers. Over the next year, we will develop a provincial employment strategy for people with disabilities that will:
- establish a cohesive made-in-Ontario vision with goals, priorities and desired outcomes to ensure Ontarians have access to a continuum of employment and training services;
- provide a better service experience through streamlined access to employment services that recognize the varied needs and employment goals of individual clients; and
- engage employers as active partners in breaking down employment barriers for people with disabilities and promoting inclusive workplaces.
From rapid technological change and globalization to the increasing trend toward temporary and part-time work, we recognize that today’s workplaces are much different from the ones that existed decades ago. To ensure that Ontario’s labour and employment laws effectively address those challenges, the province launched a Changing Workplaces Review. Ontarians can look for the final report and its recommendations this fall. Additionally, this year, through the development of a Gender Wage Gap Strategy, we will outline the steps we are going to take to work towards closing the wage gap for women in Ontario. We have also introduced a bill that, if passed, will strengthen protection for low-income consumers using alternative financial services (e.g. payday loans) and consumers with debts in collection. But that is not enough. The 2016 Budget announced up to $1 million annually over five years to increase support for financial empowerment initiatives that will help low-income individuals and families improve their credit scores, increase savings, and develop long-term financial management plans.
This spring, the province is launching a summer component of the Youth Job Connection program that will support vulnerable youth in the province. The program will offer summer, part-time and after-school job opportunities for high school students facing challenging life circumstances and who may need support transitioning between school and work. We are helping Ontario’s vulnerable youth achieve their full potential by investing in programs that support their access to meaningful education, training and employment opportunities.
The 2016 Budget announced that, over the next year, the government will introduce changes to social assistance rules so that families receiving social assistance who receive child support payments can benefit from more of this income. The Budget also announced that the government will build on its previous investments in social assistance by increasing rates by 1.5 % for families receiving Ontario Works and for people with disabilities relying on the Ontario Disability Support Program. The government will also provide a $25 increase per month to those with the lowest social assistance rates — singles without children receiving Ontario Works — bringing their total increase to $100 per month since 2012.
As we grow our economy, we are committed to leaving no one behind. Through ongoing discussions, there emerged a clear consensus on the need to move the conversation on social assistance reform beyond rates to include some aspects of the broader income security system. We will continue to engage with delivery partners, clients and sector advocates to chart the path to a comprehensive system that effectively reduces poverty, supports people in their efforts to participate in the economy, and provides human services in a way that makes sense to the people who need them.
Under its Green Investment Fund, Ontario will invest $92 million into social housing retrofits. $82 million of this investment will fund energy retrofits for high-rise social housing towers of 150 units or more and $10 million will help improve electricity efficiency in approximately 1,300 single social housing homes, which are often found in smaller and rural communities. Not only will these investments help the environment, they will reduce monthly electricity bills for residents and make a difference for many low-income Ontario families.
We will work with communities, researchers and other stakeholders to determine how best to design and implement a basic income pilot. The pilot will test whether a basic income could provide more consistent and predictable support in the context of today’s dynamic labour market. It would also test whether a basic income would provide a more efficient way of delivering income support, strengthen the attachment to the labour force, and achieve savings in other areas, such as health care and housing supports.
The federal government will also be a key partner in the province’s efforts to improve Ontarians’ employment and income security. We look forward to working with the federal government and other partners to make progress on our common goals.
For 20 years, La Passerelle I.D.É. has provided career and skill-building programs aimed at supporting Francophone newcomer/visible minority youth in Toronto. One of its programs, Tremplin Emploi (Springboard to Employment) is a bilingual training program offered in partnership with Seneca College that prepares youth for customer service careers in the financial sector. Anne-Solange Malicka Keita is a graduate of the three-month training program who is now working at TD Bank Canada Trust. “Thanks to the skills I gained through Tremplin Emploi, I feel confident I can rise to this challenge,” she says. With support from Ontario’s Local Poverty Reduction Fund, La Passerelle I.D.É is evaluating the impact of the continuum of services it provides to Francophone young people.
Progress in 2015: Helping People Achieve Employment and Income Security
Supporting Employment & Training
- Helped over 1 million Ontarians secure jobs and earn an income through Employment Ontario
- Offered programs, employment, training and education opportunities specific to the unique needs and circumstances of Indigenous people
Improving Earned Income
- Helped low-income earners and families by further increasing the minimum wage and tying it to inflation
Building Evidence
Local Poverty Reduction Fund
- Supporting 17 projects that provide employment, education and training opportunities that help vulnerable Ontarians leave poverty behind
Transformation
- Implemented a suite of youth employment and training programs to help support their long-term success
- Engaged with stakeholders to inform the province’s long-term plan for social assistance reform
Measuring Results: Progress since 2008
Three indicators allow us to track progress on achieving employment and income security
- Youth not in employment, education or training (decline)
- Long-term unemployment (progress)
- Vulnerable groups with high poverty rates (steady)
Ending chronic homelessness in Ontario
We know that when people have a safe place to call home, they are healthier and better able to work and contribute to their communities. It is for these reasons that the province has committed over $4 billion to affordable housing since 2003.
3.1 Making a difference
In 2015, we continued our commitment to improve access to stable, affordable housing by:
- investing in affordable and supportive housing;
- supporting efforts to address the local nature of homelessness; and committing to prevent and end chronic homelessness.
Investing in affordable and supportive housing
- Over the last year, we built and repaired more than 1,800 affordable housing rental units and provided rental and down payment assistance to more than 2,700 households in need.
- In 2015, we also invested in more than 620 new supportive housing units to provide people with mental health and addictions challenges not only a place to live, but also access to services and supports. This investment is delivering on the commitment made through the Poverty Reduction Strategy to create 1,000 new supportive housing units over three years.
Supporting efforts to address the local nature of homelessness
In 2015, the government continued its commitment to the Community Homelessness Prevention Initiative (CHPI), a program initially launched in January 2013 that offers communities the flexible funding required to prevent and alleviate homelessness in ways that suit local needs.
- In March 2015, the government announced that it will provide $587 million over two years through CHPI to help families and individuals experiencing homelessness or those who are at risk of homelessness attain and retain housing.
- Data show that in 2015, the program helped a total of more than 30,500 people and families experiencing homelessness to find a home and helped prevent homelessness by keeping more than 104,400 at risk of homelessness in their homes.
Community homelessness prevention initiative: 2014-2015
stay in their homes

Accessible description of infographic 5
Committing to Prevent and End Chronic Homelessness
When we launched the renewed Poverty Reduction Strategy in 2014, the government acknowledged the critical role that homelessness plays in perpetuating and deepening poverty in Ontario. This is why we established the Expert Advisory Panel on Homelessness, a 14-member advisory body that we asked to help us define, measure and set targets to prevent, reduce and eliminate homelessness.
Homelessness describes a range of housing circumstances, with people being without shelter at one end, and being insecurely housed at the other. This could include: unsheltered, emergency sheltered, provisionally accommodated and at-risk-of homelessness.
Chronic homelessness refers to people, often with disabling conditions (e.g. chronic physical or mental illness, substance abuse problems), who are currently homeless and have been homeless for six months or more in the past year (i.e. have spent more than 180 cumulative nights in a shelter or place not fit for human habitation).
Report of Ontario’s Expert Panel on Homelessness, 2015
Based on the Expert Advisory Panel’s advice, Ontario has committed to establish a bold target to end chronic homelessness in 10 years. To achieve this ambitious goal, we are taking advice from the Expert Advisory Panel and will be:
- developing an approach to measuring the number of chronically homeless people in Ontario and collecting data to help us better understand the origins of and solutions to chronic homelessness;
- moving forward with an indicator framework to track our progress on tackling chronic homelessness; and
- focusing on groups particularly vulnerable to chronic homelessness, including youth, Indigenous people and those transitioning out of provincial institutions and service systems.
In 2015, following the release of the Expert Panel’s report, we also announced that in 2016 and 2017 we will be providing up to $10 million through the Local Poverty Reduction Fund to support and evaluate the effectiveness of projects that prevent and end homelessness.
Changing lives: Seeing a brighter future and having a place to call home
Single mom Rebecca* felt like she was treading water, just trying to stay afloat to support herself and her two sons. Then the lights went out because she couldn’t afford to pay the hydro bill. “I knew it was now or never and that I had to do something or we were not going to make it as a family,” she says. Rebecca received the helping hand she needed just in time through Home Suite Hope’s Homeward Bound Halton program. The program provides affordable housing, a child care subsidy and a fully funded college education and internship to single parent mothers facing homelessness. Ontario’s Local Poverty Reduction Fund is supporting Homeward Bound to evaluate the program’s impact. Rebecca says being welcomed into the program felt like “winning the lottery” and now her family is thriving. “Sometimes we just need a little help and people around who believe in us.”
* Name has been changed
Working together: Local Poverty Reduction Fund
Tackling homelessness: Providing a helping hand and making connections to services
Every night during the frigid winter months in Sudbury, people without a home take refuge in the Out of the Cold emergency shelter. The shelter welcomes anyone who needs a place to stay, including those who may be rejected elsewhere because they do not have ID or they are under the influence of drugs or alcohol. Salvation Army Major Karen Hoeft, who helps run the shelter, adds that some people who wind up there are seniors suffering from dementia that has gone undiagnosed because they do not have family or friends to help look after them. “Gradually, they slip out of the system, because they can’t advocate for themselves and no one else is there to advocate for them,” she says. The City of Sudbury’s Out of the Cold shelter users now have someone to turn to for help. With funding from Ontario’s Local Poverty Reduction Fund, the city is hiring and evaluating the impact of two new client navigators. They will connect shelter users with the health care and housing services they need. That might include accompanying them to appointments, getting prescriptions filled, replacing identification, connecting them with mental health and addictions supports and helping them find a safe and affordable place to live. One of the client navigators is bilingual, the other Indigenous, reflecting the demographics of the city and its homeless population. While Out of the Cold only operates a few months of the year, the client navigators will provide year-round support. Hoeft says the proof of the program’s success will be in the number of people who no longer need to walk through the shelter’s doors. “Ultimately our goal is to help people become as independent as they can,” she says.
3.2 Moving forward
In 2016, the government released an updated Long-Term Affordable Housing Strategy, which was first launched in 2010 to transform Ontario’s housing and homelessness system with a focus on flexible and portable benefits that respond to individuals’ changing housing needs. Ontario’s updated Long-Term Affordable Housing Strategy is a plan that puts people, and the communities that serve them, first. It lays out the steps we are taking to create more affordable housing, to give people more choice in where they live and to make it easier to navigate the housing system.
In 2015, we conducted public consultations to identify how we could continue to improve Ontario’s affordable housing system. We used that feedback to introduce a series of bold reforms. These include legislation for inclusionary zoning that, if passed, would allow municipalities to require affordable housing units be provided within development projects, as well as developing a framework for a portable housing benefit that would give people more flexibility to choose where they want to live.
As part of our Long-Term Affordable Housing Strategy update, we are investing $178 million over three years, and making a long-term commitment to stable funding that will continue the transformation of the housing system. Building on the 2016 Ontario Budget, funding includes:
- More than $17 million over three years to pilot a portable housing benefit targeted towards survivors of domestic violence that would eventually assist up to 3,000 households.
- Up to $100 million in operating funding for housing allowances and support services to support up to 4,000 households in new supportive housing over the next three years. Over the long-term, capital funding will support the construction of up to 1,500 new supportive housing units, with operating assistance eventually assisting up to 6,000 households.
- Increasing funding for our Community Homelessness Prevention Initiative by $45 million over three years.
- Up to $2.5 million over three years to create an Innovation, Evidence and Capacity Building Fund to support research, evaluation and capacity building initiatives.
While these investments and measures are very important, the government recognizes that it alone cannot address Ontario’s housing needs. As such, we look forward to working with other levels of government to reduce, prevent and end homelessness.
Esther, a newcomer to Canada, lived at a YWCA women’s shelter while she studied to be a nurse. Esther graduated with honours from nursing school but could only find irregular on-call work and earned less than $1,000 a month. With coaching and support through the Up With Women career development program, Esther was able to not only find a job at a hospital – she also started her own part-time financial services business. “I went from living way below the poverty line to earning about $5,000 a month,” she says. “I had never dreamt of that when I lived at the shelter.” Up With Women is a non-profit organization in Toronto dedicated to helping recently homeless and at-risk women build sustainable, prosperous careers and businesses that enable them to leave poverty behind for good. With support from Ontario’s Local Poverty Reduction Fund, the organization is evaluating how its clients are benefiting from the program.
Progress in 2015: Ending Chronic Homelessness in Ontario
Preventing Homelessness
- Helped over 104,000 at-risk of homelessness remain in their homes through the Community Homelessness Prevention Initiative, supporting proactive and permanent solutions
Providing Housing Supports
- Built and repaired almost 2,000 units and provided rental and down payment assistance to 2,500+ households through the Investment in Affordable Housing
- Created more than 620 new supportive housing units for people with mental health and addictions challenges
Building Evidence
Local Poverty Reduction Fund
- Committed to providing up to $10 million in funding to prevent and end homelessness
- Supporting 8 projects that help vulnerable Ontarians find affordable housing and remain housed
Transformation
- Responding to recommendations from the Expert Advisory Panel on Homelessness
- Updated the 2010 Long-Term Affordable Housing Strategy
Measuring Results: Progress since 2008
Two indicators allow us to track progress on preventing and reducing homelessness
- New chronic homelessness indicator (under development)
- Ontario Housing Measure (steady)
Measuring our success
When Ontario renewed the Poverty Reduction Strategy in 2014, we reaffirmed our commitment to evidence-informed policy-making in two important ways:
- we launched the innovative Local Poverty Reduction Fund, which supports community-led poverty-reduction projects in an effort to spur innovation and to build a made-in-Ontario body of evidence about what works; and
- we committed to developing a provincial indicator for chronic homelessness.
4.1 Making a difference
Seeding what works
In 2015, we ran the first of three annual calls for proposals for the Local Poverty Reduction Fund, which will provide $50 million over six years to local organizations that measurably improve the lives of Ontarians experiencing poverty. In addition to evaluating local efforts to prevent and reduce poverty, successful projects have demonstrated:
- How their project assists one of the target populations under the Strategy (women, single parents, people with disabilities, youth, newcomers, visible minorities, seniors, and First Nations, Métis, Inuit and urban Indigenous people).
- How the project is expected to positively impact one or more of the 11 Poverty Reduction Strategy indicators.
In fall 2015, the government announced recipients of the first round of funding, totalling over $12.6 million for up to three years across 41 organizations in over 20 communities. All of the projects help groups disproportionately affected by poverty.
Local poverty reduction fund
- expressions of interest356
- call for proposal applications232
- funded projects41in over 20 communities
- funding$12.6million
We also engaged with a variety of Indigenous communities and organizations across the province, gathering input on the design elements of the fund to make it more accessible and responsive to unique Indigenous contexts. Based on this feedback, in 2016, the province is launching a dedicated stream of the fund for Indigenous applicants valued at a minimum of $2 million.
Understanding the provincial poverty reduction strategy indicators
Ontario’s Poverty Reduction Act, 2009 requires the government to report annually on the progress of the Strategy, as demonstrated by measurement of the provincial poverty reduction indicators (the current indicators are listed in Figure 2).
The Strategy’s indicators measure things that are either indicative of the state of poverty in Ontario today (e.g., child poverty rate) or that are proven risk factors that increase a person’s chances of experiencing poverty at some point in life. For example, lower high school graduation rates are a result of poverty but raising academic achievement can help to break the cycle of intergenerational poverty. In any given year, the provincial poverty reduction indicators provide a snapshot of the state of poverty and key poverty prevention efforts in the province. Over time, movement in the indicators tells us whether our efforts to prevent and reduce poverty are working or need course correction.
Measuring progress
By tracking progress against a set of indicators, we are able to identify if our poverty reduction efforts are succeeding and pinpoint where we must focus moving forward to continuously improve outcomes for Ontarians. Progress on Ontario’s poverty reduction indicators is described below.
Figure 2: Ontario’s poverty reduction strategy indicators
Ontario’s poverty reduction strategy indicators
1. Child poverty target (Fixed LIM-50) - Progress
Why it matters: Children living in poverty are less likely to perform well in school and grow up to find stable employment, and are more likely to experience physical and mental health issues. The government set a target in 2008 to reduce child poverty by 25% in five years.
2. Depth of poverty (Fixed LIM-40) - Progress
Why it matters: Children living in deep poverty are among the most vulnerable and face the most barriers to exiting poverty.
Measure: Percentage of children under 18 living in a family with a household income of less than half of the median household income, fixed to a baseline of 2008. [Note: A lower number represents progress.]
3. Birth weight - Steady
Why it matters: Babies born to low-income families are more likely to be below or above normal weight, and babies with birth weights outside the normal range may face risk factors that can increase their chances of poverty later in life.
Measure: Percentage of newborns born at what is considered to be a healthy weight. [Note: A higher number represents progress.]
4. School readiness - Steady
Why it matters: Children have a better chance to succeed as students and later in life when they attend school ready to learn.
Measure: The Early Development Instrument (EDI) measures the percentage of children aged five to six who demonstrate they are on track across five domains of child development and are ready to learn at school. [Note: A higher number represents progress.]
5. Educational progress - Progress
Why it matters: Students who achieve early success in school are more likely to continue to perform well academically, go on to postsecondary education and secure meaningful employment.
Measure: Percentage of students in Grades 3 and 6 who score in the highest two levels on province-wide reading, writing and math tests. [Note: A higher number represents progress.]
6. High school graduation rates - Progress
Why it matters: Students who graduate high school are more likely to find meaningful employment and will have greater earning potential throughout their lives compared to those who do not graduate.
Measure: Percentage of students entering high school at the same time who graduate within five years of having started Grade 9. [Note: A higher number represents progress.]
7. Ontario housing measure - Steady
Why it matters: Children without a stable place to call home are less likely to succeed in school and may experience stress and other mental health challenges.
Measure: Percentage of households with children under 18 that have incomes below 40% of the median household income and spend more than 40% of their income on housing. [Note: A lower number represents progress.]
8. Youth not in education, employment or training - Decline
Why it matters: Young people who are not in school or training and who do not have a job are at risk of becoming stuck in a cycle of poverty.
Measure: Percentage of young people aged 15-29 who are not in education, employment or training. [Note: A lower number represents progress.]
9. Long-term unemployment - Progress
Why it matters: A person’s ability to find a job becomes increasingly difficult the longer that they remain unemployed, making it difficult to overcome poverty.
Measure: Percentage of adults in the labour force aged 25-64 who have been unemployed for 27 weeks or more. [Note: A lower number represents progress.]
10. Poverty rates of vulnerable populations - Steady
Why it matters: Vulnerable populations represent more than half of the people in Ontario living in poverty.
Measure: Percentage of adults in five populations considered to be vulnerable who have a household income of less than half the median. The vulnerable groups include: newcomers, persons with disabilities, female lone parents, unattached individuals aged 45 to 64 and Indigenous people living off-reserve. [Note: A lower number represents progress.]
11. Homelessness indicator (In development)
Why it matters: This indicator will track progress on our goals to eliminate chronic homelessness in Ontario in 10 years.
Measure: In process of being defined, following advice from the Expert Advisory Panel on Homelessness.
PRS indicator #1: Child poverty target (low-income measure -50)
The Poverty Reduction Strategy measures child poverty through a measurement method called the PRS fixed Low-Income Measure (PRS LIM-50). PRS LIM-50 measures the percentage of children under 18 living in a family with a household income of less than half of the median household income, benchmarked to 2008, the year the government set its target to reduce child poverty by 25 % in 5 years.
Unfortunately, reporting on the child poverty target over time is challenging given the changes in data collection methodology by Statistics Canada. These changes make comparison between 2008-11 and 2012-13 difficult (See discussion on methodological issues measuring child poverty text box below)
The long-term trends in the overall incidence of child poverty (PRS LIM-50) in both the 2008-11 and 2012-13 data series show that the proportion of Ontario families with children living in poverty has been declining since the first strategy launched. Analysis based on revised Statistics Canada data now shows that between 2008 and 2011, we lifted about 16,000 Ontario children out of poverty (see Table 1.1). And between 2012 and 2013, approximately 21,000 children were lifted out of poverty (see Table 1.2), with the child poverty rate standing at 17.1 %.
Table 1.1: Child poverty in Ontario (Fixed LIM-50) 2008-2011
Source: Ontario Ministry of Finance, using Statistics Canada’s revised dataset for Canada’s Survey of Labour and Income Dynamics (2008 to 2011)
| Year | Number of Children |
|---|---|
| 2008 | 416,000 |
| 2009 | 417,000 |
| 2010 | 403,000 |
| 2011 | 399,000 |
| Change 2008 to 2011 | -16,000 |
Table 1.2: Child poverty in Ontario (Fixed LIM-50) 2012-2013
Source: Ontario Ministry of Finance, using Statistics Canada’s Canadian Income Survey (2012 to 2013)
| Year | Number of Children |
|---|---|
| 2012 | 477,000 |
| 2013 | 456,000 |
| Change 2012 to 2013 | -21,000 |
Notes: There is a break in the data series between 2011 and 2012 due to methodological differences in surveys. Numbers may not add up due to rounding.
These figures are estimates based on a survey of a sample of the population, so results should be interpreted in light of confidence intervals, which are used to express the precision of the estimate. For example: a 90% confidence interval means that if the survey were repeated many times, 90% of the samples would contain the true estimate within the confidence ranges. In the case of child poverty results in Ontario, the approximate 90% confidence interval ranges from 394,000 to 518,000 for 2013.
As shown in Figure 3, Ontario has been successful in protecting children from falling into poverty in the 2008 recession, compared to the two previous recessions (which began in 1981 and 1989, respectively) which both saw increases in levels of child poverty.
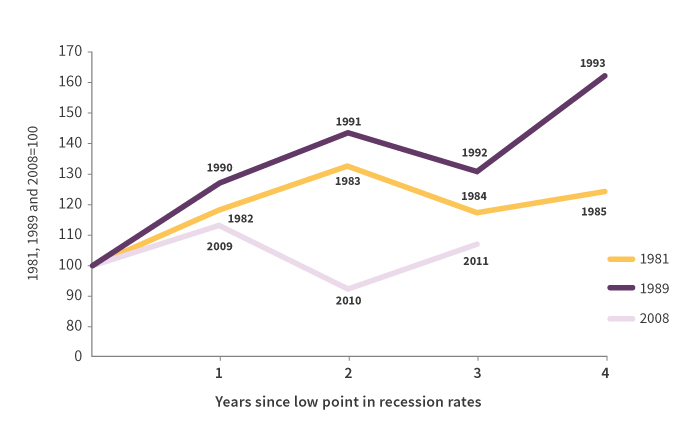
Accessible description of figure 3
Source: Ontario Ministry of Finance using Statistics Canada’s Income Surveys
Note: Progress in 2012 is unknown due to break in the data series
Discussion on methodological issues in measuring child poverty
From 2008 to 2011, the data required to measure child poverty was collected through the Survey of Labour and Income Dynamics (SLID). The survey changed in 2012 and the data are now collected through the Canadian Income Survey (CIS). In December 2015, Statistics Canada released a revised data set for the 2006 to 2011 period in an attempt to try and align data collected under the two different surveys. In its accompanying analysis, Statistics Canada notes that “a noticeable upward or downward shift in the data” as the CIS was implemented in 2012 would be a break in the data that “represents a change in the estimates which is attributable to the two surveys having difference which could not be fully adjusted for in this revision."
We recognize that these methodological issues are complex, and with barely three months passed since the revised data release from Statistics Canada, more work needs to be done to assess implications and establish a go forward approach to reporting on the government’s overall target for child poverty reduction. For example, some may suggest that it would be appropriate to add results from the two data series (excluding the 2011-12 year) and report over time on the 2008 baseline. Others may suggest that the baseline needs to be revisited in light of the available data. In addition, the new federal government’s social policy agenda, and its interest in collecting data in support of social policy objectives may raise other opportunities and considerations.
As a result the government will be reaching out to independent experts and stakeholders over the next few months to solicit advice on a longer-term approach to addressing the methodological, baseline and child poverty target issues that the new Statistics Canada data raises. Our objective will be to continue with an approach that stands by the principles of collaboration and transparent, regular public reporting against a specific target that is embedded in the Poverty Reduction Act, 2009.
PRS indicator #2: Depth of child poverty (low-income measure-40)
The PRS fixed Low-Income Measure-40 (PRS LIM-40) tells us how many children are living in households earning less than 40 % of median household income, benchmarked to 2008. This indicator is important to track because children living in deep poverty face challenges across many dimensions of life.
During the first three years of the most recent recession, between 2008 and 2011, Ontario reduced the number of children living in deep poverty from 9 % to 8.4 % – a reduction of about 19,000 children (see 2.1). Progress was also made between 2012 and 2013 during which time 38,000 children were lifted out of deep poverty (see Table 2.2).
Note: LIM-40 has the same methodological challenges as LIM-50 with two data series. Results should take into consideration an approximated 90% confidence interval of 204,000 to 294,000 for 2013.
Table 2.1: Children living in deep poverty in Ontario (Fixed LIM-40) 2008-2011
Source: Ontario Ministry of Finance, using Statistics Canada’s revised dataset for Canada’s Survey of Labour and Income Dynamics (2008 to 2011)
| Year | Number of Children |
|---|---|
| 2008 | 245,000 |
| 2009 | 197,000 |
| 2010 | 198,000 |
| 2011 | 226,000 |
| Change 2008 to 2011 | -19,000 |
Table 2.2: Children living in deep poverty in Ontario (Fixed LIM-40) 2012-2013
Source: Ontario Ministry of Finance using Statistics Canada’s Canadian Income Survey (2012 and 2013)
| Year | Number of Children |
|---|---|
| 2012 | 286,000 |
| 2013 | 294,000 |
| Change 2012 to 2013 | -38,000 |
Notes: There is a break in the data series between 2011 and 2012 due to methodological differences in surveys. Numbers may not add up due to rounding.
PRS indicator #3: Birth weight
In 2015, 80.5 % of Ontario babies were born at a healthy birth weight – a rate that has remained steady over the last five years. The data we are collecting tells us, however, that there are significant regional differences in birth weights across Ontario: small for gestational age birth weights range from 6.2 % to 12.6 % of births depending on place of birth, and large for gestational age birth weights range from 7.1 % to 16.8 % of births depending on location (see Table 3). Data showing regional discrepancies such as these are important because they signal the need to review how programs are operating at a local level and to understand how the prevalence of particular risk factors may vary across regions.
Table 3: Percentage of small and large birth weights in Ontario by region
| Region* | Small for Gestational Age (%) | Large for Gestational Age (%) |
|---|---|---|
| Erie St. Clair | 8.4 | 11.2 |
| Central | 10.4 | 7.5 |
| Central East | 10.2 | 9.8 |
| Central West | 12.6 | 7.1 |
| Champlain | 7.5 | 11.4 |
| Hamilton Niagara Haldimand Brant | 8.4 | 12.4 |
| Mississauga/Halton | 10.8 | 7.8 |
| North East | 8.2 | 12.5 |
| North Simcoe Muskoka | 8.6 | 11.4 |
| North West | 6.2 | 16.8 |
| South East | 9.7 | 13.1 |
| South West | 8.1 | 11.9 |
| Toronto Central | 10.1 | 8.1 |
| Waterloo Wellington | 8.2 | 11.4 |
| Ontario | 9.4 | 10.1 |
Source: BORN Ontario, Fiscal Year 2009-14. Note: *Region is based on Local Health Integration Network of residence
PRS indicator #4: School readiness
Since 2004, Ontario has been using the Early Development Instrument (EDI) once every three years to assess five areas of a child’s development to determine whether a student in senior kindergarten is ready to enter Grade 1: 1) physical health and well-being; 2) social competence; 3) emotional maturity; 4) language and cognitive development; and 5) communication and general knowledge. EDI questionnaires are completed by teachers at approximately six months into the senior kindergarten year, providing teachers with a sufficient amount of time with students prior to completing the questionnaires.
Overall, the percentage of children on track declined slightly from 72.4 % in 2011-12 to 70.6 % in 2014-15. As shown in Table 4, however, we see that Ontario kindergartners had actually improved during this period in the two developmental domains that are the most significant indicators of school readiness: communication and general knowledge; as well as language and cognitive development skills. At the same time, there were declines in the other three domains.
Table 4: School readiness among children in senior kindergarten in Ontario
| Percentage of children vulnerable in one domain | 2007-09* | 2010-12* | 2014-15 |
|---|---|---|---|
| Language and Cognitive Development | 8.9 | 7.6 | 6.7 |
| Communication and General Knowledge | 12.3 | 11.5 | 10.2 |
| Physical Health and Well-Being | 14 | 14.2 | 16.1 |
| Social Competence | 9.2 | 9.1 | 10.7 |
| Emotional Maturity | 10.4 | 10.1 | 12.3 |
Source: The Offord Centre for Child Studies at McMaster University
*Note: The 2007-09 and 2010-12 EDI results reflect data collected over a 3-year cycle. 2014-15 was the first province-wide EDI collection in a single year.
It is possible that changes to data collection in 2015 may have contributed to these results, perhaps by uncovering previously unidentified vulnerabilities. We will continue to work with school boards, community partners and our data partner at the Offord Centre for Child Studies to monitor school readiness results over the next cycle and consider what remedial steps we might take as we advance programs for young children and their families.
Note: 2015 was the first province-wide EDI collection in a single year combined with more time in the kindergarten classroom and a new staffing model following from the implementation of Full-Day Kindergarten.
We know that the first few years of a child’s life are very important and that children have a better chance to succeed as students when they go to school ready to learn. That’s why the government has invested in early years programming, including Full-Day Kindergarten and child care modernization, and is now working to transform family support programs by creating Ontario Early Years Child and Family Centres that will integrate flexible, adaptable programs that align with community needs to support healthy child development.
PRS indicator #5: Educational progress at grade 3 and 6:
The Poverty Reduction Strategy tracks grade school literacy and numeracy because of its relevance to poverty prevention later in life.
In 2013-14, 72 % of the Education Quality and Accountability Office (EQAO) assessments of student performance in reading, writing and mathematics in Grades 3 and 6 met or exceeded the provincial standard. This is an increase of 14 percentage points from 58 % in 2003-04. There are no provincial results available for the 2014-15 school year. However, as demonstrated in Figure 4, the trend since 2003-04 been positive, with more students achieving early success in school, which sets the stage for them to perform well in high school and beyond.
Figure 4: Educational progress in elementary schools in Ontario
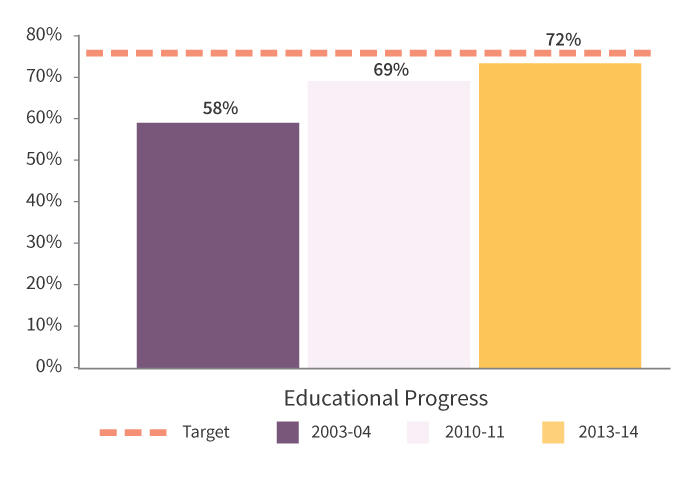
Accessible description of figure 4
Source: Education Quality and Accountability Office
PRS indicator #6: High school graduation
High school graduation rates are a key predictor of success in economic and social terms across the life course. The most recent high school graduation data for Ontario are from the 2013-14 school year and show that 84 % of Ontario students now graduate from high school within five years of starting Grade 9, up from 79 % in the 2008-09 school year. Ontario is now just below its 85 % high school graduation target.
We know that investing in the skills and education of our young people helps ensure that Ontario’s workforce continues to be among the most skilled in the world and is equipped to adjust to a dynamic labour market.
Figure 5: High school provincial graduation rate in Ontario
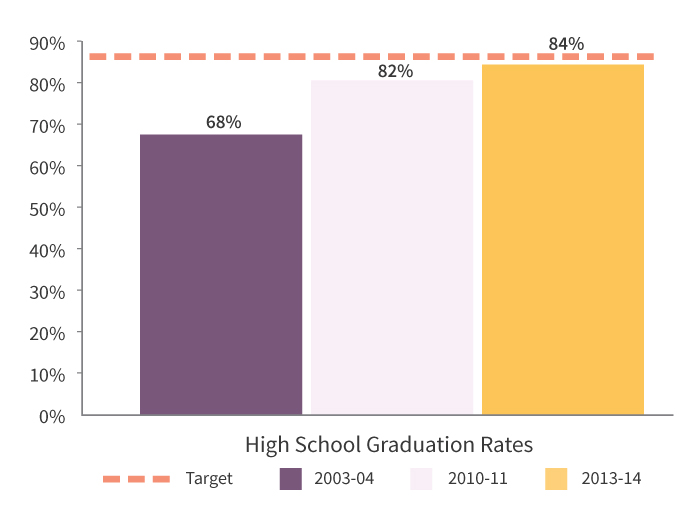
Accessible description of figure 5
Source: Ministry of Education
PRS indicator #7: The Ontario Housing Measure
The Ontario Housing Measure tells us the percentage of households with children under 18 that have incomes below 40 % of the median household income and spend more than 40 % of their income on housing. This measure allows us to understand the particular pressure that the cost of housing places on the most vulnerable families in Ontario.
As with the strategy’s child poverty measures, a change in the survey tool has meant reporting two data series for the Ontario Housing Measure – from 2008 to 2011 and 2012 onwards. Between 2008 and 2011 the trend remained relatively flat (see Table 5). The most recent data tell us that in 2013, 7.3 % of Ontario households living in deep poverty spent more than 40 % of their income on housing (see Table 5.2). Between 2012 and 2013, an additional 4,000 families in Ontario (a 0.2 % increase) experienced greater hardship paying for shelter. This occurred during the same period that saw a net decline in deep poverty. This means that the cost of shelter got more expensive for these families who had already been living in deep poverty, signalling the significant impact that the rising cost of housing has on the most vulnerable Ontarians.
Percentage of families living in deep poverty experiencing housing affordability problems (the Ontario Housing Measure)
Table 5.1: Ontario Housing Measure 2008-2011
Source: Statistics Canada’s revised dataset for Statistics Canada’s Survey of Labour and Income Dynamics (2008 to 2011), custom tables
| Year | Percentage of households |
|---|---|
| 2008 | 5.9 |
| 2009 | 5.1 |
| 2010 | 4.5 |
| 2011 | 6 |
Table 5.2: Ontario Housing Measure 2012-2013
Source: Statistics Canada’s Canadian Income Survey (2012 and 2013), custom tables
| Year | Percentage of households |
|---|---|
| 2012 | 7.1 |
| 2013 | 7.3 |
Note: There is a break in the data series between 2011 and 2012 due to methodological differences in surveys.
PRS indicator #8: Youth not in education, employment or training
The period of life between the ages of 15 and 29 is a critical time to establish labour market skills and gain a foothold in the workforce. People who fail to obtain job skills and/or work experience during this period are at a greater risk of experiencing poverty later on. This is why it is important to understand how many Ontario youth are not developing these skills – these are young people who are captured in the “youth not in education, employment or training” (NEET) indicator.
The percentage of youth in Ontario not in education, employment or training increased from 11.5 % in 2013 to 11.9 % in 2015, or an increase of nearly 12,000 young people. This trend was driven by a growing number of youth not in the labour force. Though this trend is negative, it is important to put this number in context. Ontario is still outperforming most other provinces and many comparable jurisdictions internationally (see Table 6). Additionally, if we compare this recent recession to prior recessions, we can see that Ontario’s youth are actually faring better now than they were before. The peak NEET rate for the last three recessions was 12.2 % in 2010, 14.8 % in 1993 and 17.1 % in 1983.
Table 6: Jurisdictional comparison - Rate of youth not in employment, education or training
| Jurisdiction | NEET Rate (2014) |
|---|---|
| France | 16.3 |
| Germany | 9.2 |
| Italy | 27.7 |
| Spain | 25.9 |
| United Kingdon | 14.4 |
| United States | 15 |
Source: Organization for Economic Co-operation and Development (OECD) database, 2016
In the spring of 2016, we are launching a summer component of the Youth Job Connection program focusing on youth with multiple barriers. It will provide summer, part-time and after-school job opportunities for high school students facing challenging life circumstances who may need support transitioning between school and work. These investments in programs that support education and training, leading to employment, will help to make the future of Ontario’s youth a brighter one – one where they are able to achieve their potential.
PRS indicator # 9: Long-term unemployment
The percentage of adults looking for a job for longer than six months fell to 1.3 % in 2015 from 1.8 % in 2013 when we began measuring progress on this indicator. This is a drop of nearly 25 % from 105,500 in 2013 to 80,100 in 2015. This also represents 52,100 fewer adults than at peak levels in 2010 and 20,400 fewer adults than in 2014.
Detachment from the labour market for periods longer than six months is associated on a personal level with the loss of present and future opportunities, financial problems, social exclusion, loss of self-esteem and health problems. Therefore, reductions in long-term unemployment have a positive impact on the capacity of Ontarians to secure an earned income over the long run. In economic terms, labour force detachment could lead to a decrease in tax revenues, lessened productivity because of loss of acquired skills and an increase in the costs of social and health care programs.
Ontario’s employment and training programs, such as those offered through Employment Ontario, are helping more people connect with jobs. And, the province is continuing to consult with clients and service delivery partners as we work to integrate, modernize and improve the way we deliver employment and training services to help people access the supports that help them secure stable employment. For tens of thousands of Ontario families, progress on this indicator means we are bringing opportunity in and supporting economic growth that realizes results for all.
PRS indicator #10: Vulnerable groups with high poverty rates
When the Poverty Reduction Strategy was renewed in 2014, we made a commitment to focus on groups disproportionately affected by poverty: newcomers, people with disabilities, female lone parents, unattached individuals aged 45-64, and Indigenous persons living off-reserve. The rate of vulnerable Ontarians living in poverty (as measured by the LIM-50) remained steady between 2012 and 2013 at 32 %, or about 589,000 people.
Figure 6: Vulnerable groups in Ontario with high poverty rates
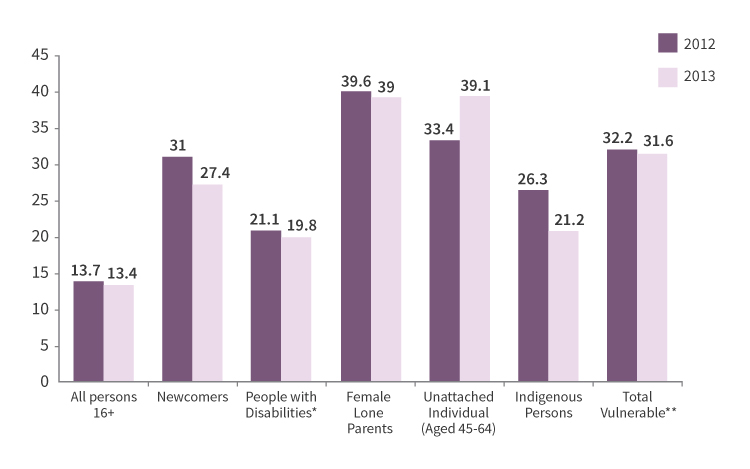
Accessible description of figure 6
Source: Statistics Canada, Canadian Income Survey, relative LIM-50
* In 2013, activity limitation questions were only asked of one household members and questions changed. This may have caused a break in series between 2012 and 2013.
** This total does not include people with disabilities.
There is considerable variation in poverty rates between these vulnerable population groups (see Figure 6). For instance, female lone parents and unattached individuals aged 45-64 are more likely to experience deep poverty than others. We also see variation across the five populations when reviewing the poverty rates for vulnerable people living in deep poverty (LIM-40)
The province is taking these trends into consideration moving forward, for example, developing a whole of government employment strategy to help Ontarians with disabilities connect to the labour market. The government also provides funding for a variety of programs and services that help newcomers integrate successfully into communities and workplaces, including language training, settlement services, and bridge training programs that help both internationally trained individuals and highly skilled newcomers get licensed and find work in their field.
4.2 Moving forward
In 2016, the government will continue to support the building of Ontario-specific evidence about what it takes to prevent and reduce poverty, as well as to foster capacity for data collection and knowledge mobilization at the provincial and local levels.
Continuing to build the Ontario evidence base
In the spring of 2016, the call for proposals will go out for the second of three annual granting cycles under the Local Poverty Reduction Fund. In this year’s process, we will:
- build on the process established last year, which asks applicants to indicate how their poverty reduction projects assist members of our vulnerable populations and how they plan to evaluate progress;
- add a new Indigenous application stream, which will better meet the needs of our Indigenous partners; and
- launch our Knowledge Mobilization Strategy, which envisions taking the first round of evaluation results and using them to distill and disseminate leading practices that could inform efforts to prevent and reduce poverty across the province.
Working with partners to build capacity in data collection
In the first half of 2016, the province will engage with communities across Ontario to build stronger partnerships around data and poverty indicators at the local level. This dialogue will help us all improve our ability to measure and align our poverty reduction efforts across the province. Engaging communities in this way is also part of our commitment to Open Government, and what we learn from the process will support the development of a Public Engagement Framework for Ontario to engage more Ontarians in meaningful ways using innovative tools and methods.
Supporting community hubs
The government is supporting the development of community hubs. These hubs make public services more convenient and accessible by using a public space for many community purposes.
The province has accepted all the recommendations contained in Community Hubs: A Strategic Framework and Action Plan and is moving forward with an initiative to build local capacity by investing in a resource network for community partners, including an interactive and online resource centre to provide access to information, best practices and data for community organizations.
Developing our homelessness indicator
An important component of our evidence-building work in 2016 will focus on developing a provincial indicator for chronic homelessness to help Ontario track its commitment to end chronic homelessness in 10 years. Following the advice of the Expert Advisory Panel on Homelessness, the province will:
- build on data collection already underway or planned across Ontario;
- plan to require enumeration at the local level to gather data about homelessness; and
- identify strategies to move towards greater standardization of data collection province-wide.
As we move forward with requiring local enumeration of homelessness, we will be in a better position to further explore the opportunities for tracking data on other variables such as homeless deaths more consistently at the local and provincial levels.
Conclusion
The government’s efforts to fight poverty in this province are making a difference in people’s lives. But we know there is much more work to do. Two things are critical to the province’s success moving forward: collaboration and evidence.
We in government have an important role to play – a lead role – in lifting people out of poverty in Ontario. But we know we do not have all the answers and this problem is far too complex to tackle on our own. The only way forward is for all of us – governments, citizens, front-line service providers, non-profit groups and the private sector – to work together. By leveraging our strengths and aligning our efforts we will achieve a much bigger impact then we ever could on our own. We certainly look forward to working with our new federal partner to explore how together we can help the most vulnerable people in the province.
As we move forward, we will also continue to collect and analyze data and information on the impact the government’s policies, programs and services are having on the people they are designed to help. We will then use that evidence to change what we are doing and how we are doing it so we can achieve even better results. We will closely monitor our indicators to measure the progress we are making and to track whether we are achieving our goals and meeting our targets. We will continue to publicly report on our progress each year as part of our commitment to be open, transparent and accountable to you.
Ontario’s greatest strength is its people. We want everyone in this great, diverse province to be able to flourish here, to pursue their passions and to realize their dreams. By working together with our partners and by building solutions based on evidence, we will build a stronger Ontario where everyone has an opportunity to reach their full potential.
Description
Infographic 1: Student Nutrition Program
This infographic highlights the expansion to the Student Nutrition Program in 2015. The Student Nutrition Program supports learning and development by offering healthy meals to more than 847,000 students across the province. It contributes to better educational progress and improved high school graduation rates. The program served an additional 91,000 students in 190 more schools during the 2014-2015 school year and is being expanded or enhanced in 120 schools and other educational settings in First Nations communities.
Infographic 2: Community Homelessness Prevention Initiative, 2014-15
This infographic explains that, in 2014-2015, the Community Homelessness Prevention Initiative helped more than 30,500 people and families experiencing homelessness find a home and helped more than 104,400 stay in their homes.
Infographic 5: Community Homelessness Prevention Initiative, 2014-15
This infographic explains that, in 2014-2015, the Community Homelessness Prevention Initiative helped more than 30,500 people and families experiencing homelessness find a home and helped more than 104,400 stay in their homes.
Figure 1: Postsecondary participation rates by parental income (18-21 year olds)
Description: This chart shows the proportion of families with at least one child in full-time postsecondary education, for families with at least one child 18 to 21 residing at home, comparing Ontario with the rest of Canada. For all family income levels, Ontario has a higher participation rate than the rest of Canada. Participation rates increase with income for both Ontario and the rest of Canada. In Canada, participation rates range from 13 % of Canadians among households making $10,000 per year to almost 70 % of Canadians among households making more than $180,000 per year. In Ontario, participation rates range from 20 % of Ontarians among households making $10,000 per year to more than 70 % of Ontarians among households making more than $180,000 per year.
Figure 3: Fewer Ontario children fell into poverty in the last recession compared to the previous two recessions – Growth in children’s LICO rates
Description: This chart shows data on child poverty during the 1981, 1989 and 2008 recessions, measured using Statistics Canada’s after-tax Low Income Cut-Off (LICO). It demonstrates that Ontario has protected children from falling into poverty during the 2008 recession, compared to the two previous recessions, which began in 1981 and 1989, respectively, and which both saw significant increases in the rate of child poverty. In 1984, three years into the 1981 recession, child poverty rates were 17.4 % above the most recent low point in rates. In 1992, three years into the 1989 recession child poverty rates were 30.5 % above the most recent low point in rates. In contrast, two years into the 2008 recession, child poverty rates were 7.1 % below the previous low point in rates and three years into the recession were 6.1 % above this low point in rates.
Figure 4: Educational progress in elementary schools in Ontario
Description: This chart shows that more of Ontario’s students are achieving early success in school, as measured through the Education Quality and Accountability Office (EQAO) assessments of student performance in reading, writing and mathematics in Grades 3 and 6. In 2003-04, 58 % of children scored in the highest two levels on province-wide reading, writing and math tests. This improved to 69 % in 2010-11 and 72 % in 2013-14, bringing the province closer to meeting its target of 75 %.
Figure 5: High school provincial graduation rate in Ontario
Description: This chart shows that more Ontario high school students are graduating within the first five years of starting grade nine. In 2003-04, 68 % of Ontario students graduated high school. This has since increased to 82 % in 2010-11 and 84 % in 2013-14. The province is one % away from meeting its target of an 85 % high school graduation rate.
Figure 6: Vulnerable groups in Ontario with high poverty rates
Description: This chart shows that the rate of vulnerable Ontarians living in poverty (as measured by relative LIM-50) fell slightly from 32.2 % in 2012 to 31.6 % in 2013. It also shows that in both 2012 and 2013, there is variation across the five vulnerable populations most susceptible to poverty: newcomers (2012 = 31 %, 2013 = 27.4 %), people with disabilities (2012 = 21.1 %, 2013 = 19.8 %), female lone parents (2012 = 39.6 %, 2013 = 39 %), unattached individuals aged 45-64 (2012 = 33.4 %, 2013 = 39.1) and Indigenous persons (2012 = 26.3, 2013 = 21.2). In comparison, the poverty rate of all persons 16 years old and over was 13.7 % in 2012 and 13.4 % in 2013.
Footnotes
- footnote[1] Back to paragraph . As a result of this challenge we are reporting two separate data series, baselined to the 2008 PRS LIM, as an interim approach to show the overall trends since the government launched its first strategy.
- footnote[2] Back to paragraph Figure 3 shows data on child poverty during past recessions, from 1982 to 2011, using the after-tax Low Income Cut-Off (LICO). The Poverty Reduction Strategy uses the fixed Low Income Measure (LIM) to measure child poverty. Both the fixed LIM and LICO are updated in the same way, so we expect to see similar trends in child poverty over time using both measures.
- footnote[3] Back to paragraph Statistics Canada. 2015. “Revisions to 2006 to 2011 income data”, Statistics Canada catalog number 75F0002M – No. 003.
- footnote[4] Back to paragraph Ibid
- footnote[5] Back to paragraph Tables 2.1 and 2.2 also illustrate that even more children have been lifted out of deep poverty (PRS LIM-40) than poverty (PRS LIM-50) during this time period. By raising more children out of deep poverty, we are helping some of the province’s most vulnerable children and breaking the cycle of poverty.