Lake Nipissing data review final report
The final, November 2012 report from the Lake Nipissing data review. Data ranges from 1967 - 2011.
George E. Morgan
Ontario Ministry of Natural Resources
North Bay
February 2013
Lake Nipissing Data Review 1967 to 2011
ISBN (.PDF)
This publication was produced by:
Ontario Ministry of Natural Resources
North Bay District Office
3301 Trout Lake Road
North Bay, Ontario
P1A 4L7
Online link to report can be found at: Ontario.ca/mnrf
This document is for fisheries research purposes and does not represent the policy or opinion of the Government of Ontario.
This technical report should be cited as follows:
Morgan, G.E. 2013. Lake Nipissing Data Review 1967 to 2011. Ontario Ministry of Natural Resources, North Bay. 46 pp.
Executive Summary
Morgan, G.E. 2012. Lake Nipissing Data Review 1967 to 2011. Ontario Ministry of Natural Resources, North Bay. 46pp.
In the 1970s and 1980s, harvest of Walleye on Lake Nipissing was very high, exceeding 100,000 kilograms per year throughout this period. In the 1990s, management reports identified that the annual Walleye harvest target from the combined recreational and commercial fisheries should not exceed 100,000 kilograms. Walleye harvests were reduced slightly through the 1990s to 100,000 kilograms a year on average. Despite this harvest reduction, the population declined in the 1990s, likely due in part to high exploitation in earlier decades. Concerns over this decline led to management actions in the mid-2000s to reduce the harvest to 66,000 kilograms per year. Nonetheless, Walleye numbers are continuing to decline, with the current population half of what it was in the 1980s. The loss of adult Walleye (more than five years old) has varied between 30 and 55 per cent over the last five decades. Changes in mortality have been attributed to management actions. For example, the decrease in mortality from the 1970s to the 1980s appears to be related to a delayed spring angling opening, and a similar decline in the 2000s has been attributed to the reduced limits and protected slot size. Low adult mortality suggests that the decline in the Lake Nipissing Walleye must be associated with changes in juvenile fish (younger than age five). The data show a troubling pattern in juvenile mortality, with a dramatic increase over the last decade. Estimates of juvenile mortality are only available since 1998, when the standard fall index netting program began. Today, with more juvenile mortality, the abundance of Walleye has declined to its lowest level and may continue to decline in the future. Why has juvenile mortality increased when angling is restricted by the size and number of Walleye that can be harvested and the commercial harvest is set by the quota and gill net mesh size? The answer lies in changes in Walleye growth. As the abundance of Lake Nipissing Walleye declined, their growth has increased. Walleye become vulnerable to harvest (by hook-and-line or gill net) at around 35 cm in length (13¾ in.). Since the early 1990s, the fish have reached this length at an earlier age. As a result, Walleye are now becoming vulnerable to fishing at a much younger age, which means much higher juvenile mortality rates and fewer adult Walleye in later years. In spite of increased growth, Walleye are not maturing earlier, so they are exposed to more years of fishing before they reproduce for the first time. The Lake Nipissing Walleye population is exhibiting many signs of a stressed fishery. Walleye abundance is too low to support the current harvest target of 66,000 kilograms per year. Although there have been other ecosystem changes, such as the colonization of Lake Nipissing by Double-crested Cormorants and the Spiny Water Flea, fishing has placed the Walleye population in a vulnerable state.
1.0 Introduction
Anthropogenic perturbations (both intentional and unintentional), fisheries regulation changes, and the spread of non-native species have contributed to the alteration of all aquatic ecosystems. The effects on native species may be negative but it is often difficult to identify any long-term effects these disturbances impose, primarily because of the limited availability of long-term data. Increased understanding of these relationships and effects can improve our chances for conserving native species and maintaining biodiversity within these ecosystems.
Since the 1970s, the Lake Nipissing ecosystem has undergone many substantial changes. Introduction of non-native species and increases in avian predators have the potential to influence ecosystem function in both offshore and nearshore areas. Rainbow Smelt (Osmerus mordax) became established in the late 1970s. This added prey resource could result in faster growth rates and improved condition for piscivorous fishes in Lake Nipissing. Population numbers of Double-crested Cormorants (Phalacrocorax auritus) have steadily increased in Lake Nipissing since the 1990s. Direct predation effects of Double-crested Cormorants have been noted in the Great Lakes however their overall effect on fish population dynamics remains unclear. (Diana et al. 2006; Fielder 2008; Diana 2010). The offshore crustacean zooplankton community has also changed; decreases in several cladoceran species and lower species richness were observed after the invasion of the predatory cladoceran bythotrephes spp. in the 2000s. Fish growth is primarily a function of food and temperature. Venturelli et al. (2010) determined that up to 96% of the variation in the length of immature Walleye (Sander vitreus) could be accounted for by an index of ambient thermal energy (growing degree-days). Future climate scenarios may influence predictions of growth.
Although several documented changes have occurred in Lake Nipissing since the 1970s, there is little information on the effect of these disturbances on the recreationally and economically important species that inhabit the lake. Walleye are of considerable interest as they are one of the top predators and provide important recreational angling and commercial fishing opportunities in Lake Nipissing. A data review conducted by Dunlop (1997) concluded that the Lake Nipissing Walleye population was probably being fished close to its sustainable level by the late 1990s. In addition to ecosystem changes in Lake Nipissing, fisheries management has also changed since the 1970s. Recreational angling and gill net fisheries have the potential to affect population size structure and result in overfishing of the targeted species. Since the late 1990s several changes have been implemented in both the angling and gill net fisheries to address concerns over Walleye sustainability.
Given the changes (i.e., ecological and management) that have transpired since the 1970s in Lake Nipissing, I sought to synthesize large amounts of information and characterize any observed changes in the Walleye population from historical time periods (1960s, 1970s, 1980s, and 1990s) to recent periods (2000s and 2010s). I examined differences between recent and historical time periods in Walleye biological indicators (abundance-based, length-based, weight-based, age-based, and reproductive). Where differences were detected between historical and recent Walleye population dynamics, I tried to relate changes to other documented ecosystem perturbations that have occurred in Lake Nipissing. The results of my study contribute to a more comprehensive understanding of how disturbances have affected the Lake Nipissing Walleye population. Because scientific information can never fully describe the complex systems found in nature, all of the data presented in this report incorporates inherent assumptions in order to make problems workable.
2.0 Methods
2.1 Study area
Lake Nipissing (46° 16’ 54”, 80° 0’ 0”) is a slightly basic (2003-04 pH 7.1) productive water body (classified as mesotrophic; 2003-04 total phosphorus 17.5 μg·L-1) located in north-central Ontario approximately 350 km north of the city of Toronto between the Ottawa River and Georgian Bay. It is Ontario’s seventh largest inland lake (87,325 ha) located in the sedimentary basin of ancient glacial Lake Algonquin at a mean elevation of 196m above sea level. The Lake Nipissing watershed (≈13,100 km2) is largely forested or rural and lies on Precambrian rock that is overlain in many areas by sand and clay deposits that is drained by 12 major rivers. Four of these rivers drain almost three- quarters of the total watershed area (Sturgeon River 37%, Amateewakea River 13%, South River 11%, and Veuve River 10%). The lake is shallow (Zmean = 4.5m) with a maximum depth of 52m close to the French River which is Lake Nipissing’s only outflow. Water levels are regulated by dams located on the French River (annual winter drawdown ≈1.2m) and water replacement time is less than one year (≈0.70 years)..
Lake Nipissing supports a diverse fish community (42 species) dominated by Walleye, Yellow Perch (Perca flavescens), Northern Pike (Esox lucius), and White Sucker (Catostomus commersoni) with a significant Coregonid component (Cisco, Coregonus artedi and Lake Whitefish, Coregonus clupeaformis). Other culturally significant species include Muskellunge (Esox masquinongy), Smallmouth and Largemouth Bass (Mircopterus dolomieu and Micropterus salmoides, respectively), and Lake Sturgeon (Acipenser fulvescens).
Two communities (North Bay, population ≈54,000; West Nipissing, population ≈14,000) use Lake Nipissing for recreation. There are over 125 tourist establishments on Lake Nipissing (located mainly on the eastern and southern shores, and Northwest Bay) that depend primarily on the fisheries resources for their livelihood. The Dokis First Nation (population ≈200) and the Nipissing First Nation (population ≈1,400) utilize the resources of the lake for sustenance and commercial purposes.
2.2 Historical fisheries assessment
Detailed fisheries assessment projects were conducted annually by the Lake Nipissing Fisheries Assessment Unit, Ontario Ministry of Natural Resources from 1967 until 1996 (when the unit was closed). All data collected by the Lake Nipissing Fisheries Assessment Unit are archived with the Ontario Ministry of Natural Resources in the Aquatic Data Repository Project (these include winter and open water angler surveys, Walleye spawning assessment and tagging projects (primarily at Wasi Falls, Chapman Chutes, and Iron Island spawning sites), index trawling projects, and summer index trap netting projects). In 1997 the North Bay District, Ontario Ministry of Natural Resources conducted the winter angler survey while the Anishinabek/Ontario Fisheries Resource Centre conducted a Walleye spawning assessment at Wasi Falls and Iron Island, and the open water angler survey. The Anishinabek/Ontario Fisheries Resource Centre also conducted Walleye spawning assessments at Iron Island in 1998 and 2002. For this report I used the archived spawning assessment, summer index trap netting, and the winter and open water angler survey data from the 1960s to the 1990s. Using this historical data I summarized angler characteristics (e.g., species preference, residency, base of operations, use of guide services, etc.) and estimated Walleye harvest, growth, mortality rates, and exploitable stock biomass. Ages from the historical period were interpreted from scale samples.
2.3 Recent fisheries assessment
From 1998 to 2011 fisheries data (primarily winter and open water angler surveys, and index netting projects) was collected through the combined efforts of the North Bay District, Ontario Ministry of Natural Resources, the Anishinabek/Ontario Fisheries Resource Centre, Dokis First Nation, Nipissing First Nation, and Lake Nipissing Partners in Conservation. Data used in stock assessments can be classified as fishery-dependent data or fishery-independent data. Fishery-dependent data is collected from the fishery itself, using both recreational and commercial sources. These surveys provide managers with estimates of harvest, effort, and user characteristics. Fishery-independent data is obtained in the absence of any fishing activity. The majority of this data is collected by management agencies. A wide variety of methods and gear types can be used to acquire fishery-independent data. Regardless of the method or approach, these surveys provide managers with an estimate of abundance and other life history traits (e.g., growth, condition, maturation, etc.). Stock assessments are often completed using both fishery- dependent and fishery-independent data.
2.3.1 Fisheries-dependent data
Roving angler surveys were used to collect information on recreational fishing effort, catch rates, harvest levels, and types of users. Lake Nipissing has been divided into 17 sampling sectors based primarily on historical Walleye fishing pressure. Winters angler surveys commenced on the opening day of the fishing season and were terminated at the end of the fishing season or earlier if the ice conditions deteriorated and it was unsafe to use snowmobiles on the lake (Note: The 1996 winter angler survey was terminated early due to the Ontario Public Service Employees Union strike so the estimates of effort, catch, and harvest were expanded to represent the entire fishing season). During the winter angler survey 13 sectors (Callander Bay, Manitou Islands, South Bay, North Bay shoreline, South Shore, Deepwater Point, Iron Island, Goose Islands, Hardwood Islands, French River to Cross Point, Cache Bay to the mouth of the Sturgeon River, West Bay, and West Arm sectors) were sampled and angling parties were interviewed while counts were made of the number of commercial ice huts, personal ice huts, and angler groups fishing on the ice. The fishing day varied in length over the winter season (08:00 to 17:00 in January and 09:00 to 18:00 in February and March). Two, three or, more rarely, four sectors were sampled each sampling day so each sector was sampled a minimum of 4 times (2 work days (Monday to Friday) and 2 non-work days (Saturday, Sunday or statutory holiday)) over the fishing season. A sub-sample of angling parties, which was proportional to the time available to cover a sampling sector, was interviewed by survey crews during each survey day. The total number of angler-hours fished per party, species preference, the residency of anglers, their visitor type, and base of operations (e.g., permanent resident or resort guest, use of guide services, etc.) were recorded. All fish kept by ice anglers were tallied and sub-sampled for total length measurements (minimum sampling target of 100 Walleye and Yellow Perch each month; all other species sampled as encountered over the winter season).
Open water angler surveys commenced on the opening day of the season and ended the week after Labour Day (early September) (Note: Due to budget constraints the 1992 open water angler survey was only conducted in July and August and the 1993 open water angler survey only covered a portion of the lake, therefore only partial estimates of effort, catch, and harvest were available for these years). Fourteen sectors (Callander Bay, Manitou Islands, South Bay, North Bay shoreline, South Shore, Northeast shoreline, Iron Island, Goose Islands, Hardwood Islands, French River to Cross Point, Cache Bay to the mouth of the Sturgeon River, Middle West Bay, West Bay, and Northwest shoreline sectors) were sampled. Three sectors were sampled each sampling day. The fishing day was stratified into an AM period (08:30 to 14:30 in May and June, and 09:30 to 15:30 from July to September) and PM period (14:30 to 20:30 in May and June, and 15:30 to 21:30 from July to September). Each sector was sampled a minimum of 8 times (2 time periods (AM and PM), 2 work days (Monday to Friday), and 2 non-work days (Saturday, Sunday or statutory holiday)) over the fishing season. A circuit was made of the sector and counts of the number of boats actively engaged in fishing were made. A sub-sample of angling parties, which was proportional to the time available to cover a sampling sector, was interviewed by survey crews during each survey day. The total number of angler-hours fished per party, species preference, the residency of anglers, their visitor type, and base of operations (e.g., permanent resident or resort guest, use of guide services, etc.) were recorded. All fish kept by boat anglers were tallied and sub-sampled for total length measurements (minimum sampling target of the first 75 Walleye, Yellow Perch, and Northern Pike encountered in each month). The major advantage of the present roving angler survey design (both winter and open water) has been its precision level at estimating catch and effort for the three most exploited species; Walleye, Northern Pike, and Yellow Perch (Rowe and Seyler 2000).
Nipissing First Nation began reporting its commercial Walleye harvests in 1995. Prior to 1995 there is no recorded information on the nature or extent of this fishery. Commercial Walleye harvests from 1995 to 1998 were estimated from voluntary information provided by commercial fishermen to Anishinabek/ Ontario Fisheries Resource Centre technicians who interviewed the fishermen at community docks or at their residences (McLeod 1999). It was estimated that 90% of Nipissing First Nation commercial fishermen reported their harvests during this program (Rowe and Seyler 2000). Estimates of Nipissing First Nation commercial Walleye harvest from 2001 to 2003 were based on fish sale records as well as anecdotal information from Nipissing First Nation fishermen and Nipissing First Nation technicians (Rowe 2007). The 2004 and 2005 estimates were provided by Ontario Ministry of Natural Resources enforcement officers (457 on-water reports of fishing effort and harvest information and 448 Walleye caught in the commercial nets were measured for length in 2004). Beginning in 2006 the Nipissing First Nation Fisheries Department has compiled daily harvest reports from Nipissing First Nation commercial fishermen to estimate the annual commercial Walleye harvest. The Nipissing First Nation Fisheries Department compiled 600 daily harvest reports and measured (for length) 114 Walleye in 2006, 604 daily harvest reports and measured (for length and/or weight) 1,079 Walleye from the commercial nets in 2007 and, 761 daily harvest reports and weighed 3,293 Walleye in 2008. Since 2009 the Nipissing First Nation Fisheries Department has provided the annual Walleye harvest estimate (in kilograms) to the large lake biologist at the North Bay District office of the Ontario Ministry of Natural Resources.
2.3.2 Fisheries-independent data
The annual Walleye population assessment begins in the autumn when water surface temperatures have cooled to 15°C (and stops when water temperatures decrease to <10°C) using a standard index netting method (Morgan 2002). Benthic multimesh monofilament gill nets (60m long by 1.8m deep) are set perpendicular to shore at haphazardly selected locations for 24 hours (the number of nets set in Lake Nipissing varied from 42 to 107 nets year-1 between 1998 and 2011). Each net has eight panels (7.6m long by 1.8m deep) with sequentially increasing mesh sizes (25, 38, 51, 64, 76, 102, 127, and 152 mm (stretched mesh)). Sets alternate with the large and small mesh ends of the net set closest to shore.
From 1998 to 2003 sampling was stratified by depth (“shallow” 2-5m and “deep” 5-15m) and area (creel sectors) resulting in annually varying proportions of shallow and deep sets (but good spatial coverage). Beginning in 2004 the minimum lake wide sampling effort target was set at 42 nets with depth stratification determined from lake bathymetry (by assigning one- third of sampling effort to the shallow stratum and two-thirds of sampling effort to the deep stratum) and to further guarantee spatial coverage there were a minimum of 3-4 sets in the West Arm sector, 3 sets in West Bay sector (shallow depth stratum), 3 sets in the Callander Bay sector, 4 sets in the South Bay sector, 4 sets in the French River sector. Finally in 2007 the minimum lake wide sampling effort target was increased to 48 nets (based on an analysis of sample size requirements for precision and statistical power using data collected from 1998 to 2006). This sampling effort met the relative abundance precision targets (20% relative standard error) for Walleye, Yellow Perch, Cisco, and White Sucker, the statistical power to detect a 50% change in Walleye or Yellow Perch abundance, and provided adequate numbers of Walleye and Yellow Perch to estimate life history traits (≥250 fish) within the requisite two week sampling period (Scott Kaufman, personal communication).
All fishes captured were identified to species, enumerated, and measured for fork and/or total length to the nearest millimetre (A list of all fish species caught in the fall index netting projects between 1998 and 2011 is in Supplementary Table S1 ). Sport fish (i.e., Walleye, Northern Pike, Muskellunge, Smallmouth Bass, and Largemouth Bass) had a more detailed sampling procedure. All individuals were measured for fork and total length, weighed to the nearest gram using an electronic balance. Walleye were internally examined to determine sex and state of gonad maturation (Duffy et al. 2000). Age structures were collected from sport fish (and in some years Cisco and Yellow Perch) for later interpretation (Note: A fish assigned age x years in the fall had completed x+1 growing-seasons). Scales were removed from below the lateral line in the area distal to the pectoral fin where it pressed against the body (after wiping away mucus and dirt) for Smallmouth Bass, Largemouth Bass, and Walleye <350 mm total length for age interpretation. For Walleye ≥350 mm total length dorsal spines and/or otoliths were removed, cleaned, and dried for age interpretation (Mann 2004). Cleithrum were removed from Northern Pike and Muskellunge, cleaned of all excess flesh, and allowed to dry for later age interpretation. In some years tissues were collected for age interpretation of Lake Whitefish, Lake Herring, and Yellow Perch. The biological records (length, weight, sex, maturity, tissues collected for age interpretation, and assigned age) for all Walleye sampled in the fall index netting between 1998 and 2011 are in Supplementary Table S2.
1 Requests for any of the data contained in the “Supplementary Tables” are to be in writing and sent to the Ontario Ministry of Natural Resources, North Bay District Office at 3301 Trout Lake Road, North Bay, Ontario P1A 4L7
3.0 Management history
3.1 Recreational fishing regulations
There have been many changes to the recreational Walleye fishing regulations on Lake Nipissing over the last 50 years. From 1960 until 1973 the Walleye fishing season on Lake Nipissing opened on the second Saturday in May and closed on March 31st the next year. In 1974 the season opener was changed to the third Saturday in May and in 1975 the season opener was delayed a further week and opened on the fourth Saturday in May. From 1976 to 1986 the season opened on the Wednesday after the Victoria Day weekend (May) and closed on March 15th the next year. Beginning in 1987 the season was split to reflect the calendar year format of the fishing regulation summary; January 1st to March 15th and the Saturday preceding Victoria Day (May) until December 31st. In 1992 and 1993 the winter season was from December 26th to March 15th (the next year) and the openwater season was from the Saturday preceding Victoria Day (May) until November 30th. The 1994 to 1998 season was January 1st to March 15th, the Saturday preceding Victoria Day (May) to November 30th, and December 25th to December 31st. Throughout this entire time period (1960 until 1998) there was no Walleye size limit and a daily catch-and-possession limit of 6 fish.
In 1999 the winter and open water seasons were shortened by two weeks (January 1st to March 7th and the Saturday preceding Victoria Day (May) to October 15th), Walleye between 40 to 60 cm could not be harvested (i.e., a protected slot size) during the open water season, and the catch-and-possession limit was reduced from 6 to 4 fish. The protected slot size was applied to the winter season beginning in 2005. A commercial licence system (permits issued annually) was put in place on January 1st 2005 for ice huts (A commercial operator is defined as a person who provides ice fishing hut accommodations for the purpose of fishing to anglers for a fee). The all-year protected slot (400 to 600 mm), catch-and-possession limit of 4 has remained in place since 2005 but in 2008 the winter season was increased one week (January 1st to March 15th).
3.2 Nipissing First Nation commercial fishing regulations
Chief and Council first mandated a spring gill net moratorium from April 1st to May 10th in 2004. Strict and active enforcement of this regulation began in 2008, with assistance from the Anishinabek Police Service, Ontario Provincial Police, and West Nipissing Police Service. Commercial spearing was banned in 2010 and a daily limit on non-commercial spearing of 20 Walleye per boat was implemented that same year. Starting in 2006 all commercial Nipissing First Nation fishermen were required to register prior to the opening of the fishing season (annually over 90% register prior to the season opening on May 10th). Fishermen complete daily harvest reports which include the numbers of all fish killed or harvested, whether they were sold or not. Fisheries technicians independently audit the harvest reports during days when they are biologically sampling a fishermen`s catch. The winter commercial fishing season opens on January 1st and closes March 31st. After the spring moratorium the open water commercial fishery opens (May 10th) and closes November 15th to 25th (depending on quota availability and weather conditions). Bottom set gill nets are restricted to 89 or 95 mm stretched mesh (3 ½ or 3 ¾ inches, respectively). It is estimated that 60-70% of the fishermen use 95 mm mesh and 30-40% use 89 mm mesh (Richard Rowe, personal communication). All gill nets are required to have a tag issued by the Nipissing First Nation Natural Resources Department attached below a buoy, marker or stake at each end of the net. An individual commercial fisherman is allowed a maximum of either 5 nets or 500m of net while a boat with 2 or more registered commercial fishermen is allowed either 10 nets or 1,000m of net. Nets are not to be set in; the Veuve River, South River, Duchesnay Creek, Sturgeon River, within 250m of Wasi Falls, within 250m of Lonely Island, within 500m of a commercial camp, within 30m of any dock, and in the French River between July 1st and August 31st. Walleye in excess of 57 cm total length cannot be sold because larger fish exceed mercury guidelines for human consumption.
Prior to 2007 there were no defined Walleye harvest targets of quotas. Nipissing First Nation Chief and Council set a commercial Walleye harvest “target” of 38,000 kg in 2007. The “target” was based on the previous year’s commercial Walleye harvest of 38,980 kg and favourable stock assessment (from the 2006 fall netting project).
In 2008 the word quota appeared in the regulations for the first time and Nipissing First Nation adopted the following quota adjustment protocol;
- If the Walleye stock is stable, quota will not be adjusted.
- If the Walleye stock is down, quota will be decreased by 10%.
- If the Walleye stock is up and quota is achieved (defined as >75% of the lake-wide quota harvested in the previous year), quota will be increased by 10%.
- If the Walleye stock is up and quota is not achieved, quota may be increased by 10% depending on circumstances for quota not being achieved (after discussion with Chief and Council).
- Where biological data are inadequate or unavailable for any reason, then quota will generally not be adjusted.
Based on favourable stock assessment (from the 2007 fall netting project), the 2008 quota was initially raised 10% to 41,800 kg. The estimated moratorium no-harvest (the average amount of Walleye that were gill netted between April 1st and May 10th in previous years) was added for a final quota of 46,300 kg in 2008. Rationale for the first official quota setting was to keep overall Walleye harvest (angling and gill netting) at two-thirds of the estimated maximum sustainable yield for a total harvest of 66,800 kg (implies an annual angler harvest of 20,500 kg). The quota remained unchanged in 2009. The 2009 fall netting project suggested that there had been a decline in the Walleye stock so the 2010 quota was reduced 10% to 41,670 kg. Walleye stocks showed further decline based on fall 2010 netting projects so the 2011 quota was reduced a further 10% to 37,500 kg.
The Chief and Council also set commercial quotas for Lake Whitefish (e.g., 11,791 kg plus incidental catch in 2011) and Northern Pike (e.g., 4,511 kg in 2011) and reserve the right to take management action, including closing of the fishery, if the Walleye fishery is seriously threatened.
4.0 Data analyses
Indicators of stock status refer to some measure of the biological properties of a population. Several intuitive indications of stock status can be derived from information on the numbers, weights, and ages of fish, as well as variables derived from them such as mortality, condition, and growth. Historical estimates were calculated from data in projects archived in the Aquatic Data Repository Project, Ontario Ministry of Natural Resources or unpublished grey literature (e.g., file reports from government and non-government agencies). Recent estimates were calculated from the 1998 to 2011 winter and open water creel surveys, and the annual fall index netting surveys. Although the fall index netting surveys were designed to provide statistically valid estimates for Walleye, other species are likely to be relevant to an ecosystem-based approach to management of the fisheries. Careful consideration is needed of whether catchability is likely to vary with species, location, time of year, size, age, or other environmental factors. For this report I have summarized the indicators into the following groups;
- Primary indicators of stock status
- 1. Fisheries performance
- Catch, harvest, and effort data from the angling fishery 1970 to 2011
- Harvest data from the gill net fishery 1995 to 2011
- Angler attributes 1982 to 2011
- Exploitable stock biomass and mortality rates 1970 to 2011
- 1998 to 2011 relative abundance (by number and weight) and interval mortality rate
- 1. Fisheries performance
- Secondary indicators of stock status - length- and weight-at-age, growth, condition, length-and age-at- maturity, sex ratio, and recruitment
- Ecosystem indicators - habitat (water quality and quantity, and climate), non-native species (Rainbow Smelt, Double-crested cormorant, and Bythotrephes), and Yellow Perch abundance (an important food source and competitor of Walleye)
4.1 Primary indicators of stock status
4.1.1 Fisheries performance
Long-standing angler catch-and-effort data started in the early 1970s and continue until today. Estimates of seasonal (winter and open water) fishing effort and harvest (numbers and weight for both angling and commercial fisheries) are summarized in Supplementary Table S3. Harvest estimates from the commercial gill net fisheries were available from 1995 to 2011 and are summarized in Supplementary Table S4. I compared the annual yield (kg·ha-1) of the combined fisheries to the 2007 to 2010 target (Roberts 2007); approximately two-thirds of the estimated maximum sustainable yield (1.13 kg·ha-1, 95% confidence interval 0.53 to 2.38 kg·ha-1; from Rowe (2007)) based on the thermal-optical habitat model of Lester et al. (2004a). Seasonal length measurements from the angler and gill net harvested Walleye are summarized in Supplementary Table S5 and S6, respectively. Summaries of angler characteristics such as place of residency, type of accommodation, use of guide or ice hut are in Supplementary Table S7.
4.1.2 Exploitable stock biomass and mortality rates
Since fishing pressure is believed to be a major driver of change in the Lake Nipissing Walleye population it was necessary to define the portion of the population (i.e., the exploitable stock) that was vulnerable to both the recreational and commercial fisheries. Length distributions from the harvested fish in the recreational and commercial fisheries indicated the Walleye ≥350 mm total length were vulnerable to both fisheries (Table 1; Figure 1).
Table 1. Total length measurements from Lake Nipissing angler harvested Walleye 1981 to 2011.
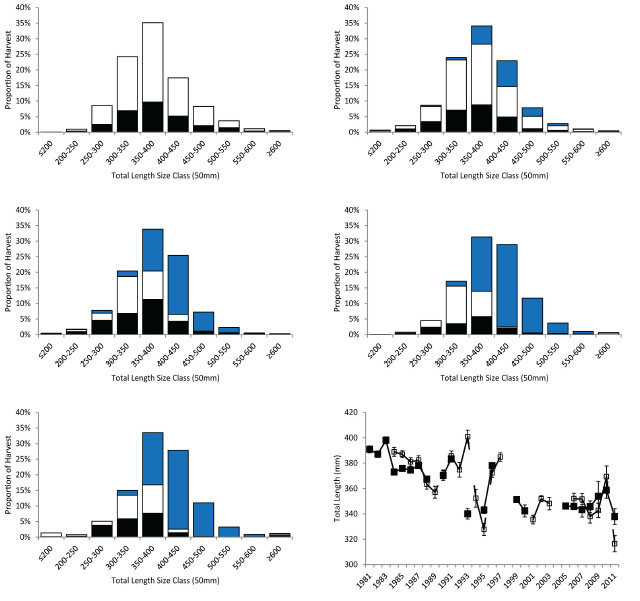
Figure 1. Size distribution of Walleye harvested by angling or commercial gill nets by decade. Filled black bars are the fish samples from the winter recreational fishery. Open black bars are the fish samples from the open water recreational fishery. The filled blue bars are the fish samples from the Nipissing First Nation commercial fishery. Bottom right panel average size of Walleye harvested with error bars (± 1 standard error). Filled black symbols connected by solid black line are data from the winter angler survey. Open black symbols connected by dashed black line are data from the open water angler survey.
There are many causes of death among the fish in a population: removals by humans (harvest and any effect directly linked to the fishing process) and natural causes such as predation, disease, parasites, old age, etc. (Ricker 1975). To isolate the effects of fishing (designated as F) we need an estimate of natural mortality (designated as M). Unfortunately, this parameter is also difficult to estimate. Direct estimates may be obtained from an unexploited stock, from tagging data, or from a regression of total mortality estimates in fishing effort (Guy and Brown 2007). In the absence of such data (as is the case for Lake Nipissing), natural mortality can be estimated from empirically derived life history relationships (e.g., longevity, maximum age, average life span, growth, age-at- maturity, and reproductive effort). I estimated Walleye natural mortality using data from historical spawning assessments (age-at-maturity), female reproductive effort (samples collected by Tom Johnston, Ontario Ministry of Natural Resources), and growth and age-at- maturity from fall index gill netting projects (Rikhter and Efanov 1976; Jensen 1996; Gunderson 1997; Jensen 1997). Estimates of natural mortality for female Walleye are summarized in Supplementary Table S8.
Total adult (≥5 years old) Walleye mortality rate (designated as Z) estimates were based on the catch at age data from single years (i.e., annual estimates) using the Robson and Chapman’s maximum likelihood estimator (Guy and Brown 2007). Total adult Walleye mortality rates from historical (observed) and recent time periods (adjusted for selectivity) are summarized by year in Supplementary Table S9. It was not possible to apply a cohort method (i.e., the method applied by Dunlop in his 1997 report using the open water angler survey Walleye harvest data) throughout the time series because there were gaps in the annual indices of abundance (e.g., no Walleye were aged in the open water angler surveys from 1998 to 2011). However there is good agreement between the estimates in Dunlop (1997) and this report for the 1973 to 1988 year classes (r = 0.60, p < 0.05, n =16; Supplementary Table S9). Fishing mortality was estimated from Z and M (i.e., F = Z-M) and exploitation rate (designated as u) was calculated as u = FA/ Z, where A = 1-e-Z (Ricker 1975). The exploitable Walleye stock biomass was estimated using the estimates of the combined (angling and commercial gill net fisheries) Walleye yield (kg·ha-1) and exploitation rate (i.e., biomass = Yield/u)
4.1.3 Relative abundance and interval mortality rates 1998 to 2011
Analysis of relative abundance was restricted to the 1998 to 2011 fall index gill net series using those net sets that met the sampling framework protocol (Morgan 2002). “Good” net sets were defined as those meeting the depth stratum (shallow: 2 to 5m or deep: 5 to 15m) and temperature (acceptable range ≤16.5° to ≥8.5°C) requirements. In 1999 all nets were set outside the temperature window which may introduce a bias in the time series. In 2002 one-half (29 of 58 sets) of the good net sets were clogged with aquatic debris (“slimed”) which may have affected catch rates (Good sets = 9.2 walleye·net-1, standard error = 1.26, n = 29; Slimed sets = 2.3 walleye·net-1, standard error = 0.42, n = 29). A similar situation occurred in 2003 where one-quarter of the sets were slimed (10 of 40 sets: Good sets = 8.3 walleye·net-1, standard error = 1.11, n = 30; Slimed sets = 2.5 walleye·net-1, standard error = 0.43, n = 10). A factorial analysis of variance was used to evaluate differences in mean Walleye relative abundance (log10 transformed values) between good and slimed nets. In both years the catches of Walleye decreased significantly in slimed nets (2002: F1, 54 = 16.21, p < 0.01; 2003 F1, 36 = 6.47, p = 0.02) in both depth strata (no interaction effect). It appears that Walleye avoided the areas with the slimed nets which may have increased the catches in other areas. I have included the slimed samples in my analyses recognizing the potential biases in the 2002 and 2003 catch information. The 1998 to 2011 fall index netting catch information (depth stratum, net status, and number of fish caught by species) is in Supplementary Table S10 (2012), the raw Walleye (and Yellow Perch) fall index gill net catches were adjusted for contact-retention selectivity (defined as a selectivity curve describing size selectivity from the population of fish making contact with the gear) using the number of fish in each 20 mm size class (fork length). The selectivity correction factors for Walleye and Yellow Perch are in Supplementary Table S11. Each year an age-length key (defined as a probability matrix of the proportion of individuals within each length class having a certain age) was used to estimate the number of Walleye in each age class. The historical (from open water angler survey and summer index trap netting projects) and 1998 to 2011 fall index netting Walleye age distributions (observed and adjusted for selectivity) are in Supplementary Table S12.
The weight (or biomass) of Walleye (and Yellow Perch) was derived from the number of fish in each 20 mm size class (fork length) and yearly fork length-to-weight regression models. Raw and selectivity-adjusted values are reported for relative abundance (number and biomass) and mortality (Note: I converted Walleye fork length (mm) measurements to total length (mm) using a regression model derived from the 1998 to 2011 fall index netting samples: Total Length (mm) = 1.0564(Fork Length) + 2.7855, R2 = 0.99, p < 0.01, n = 7,248). Walleye biomass estimates (observed and adjusted for selectivity) are summarized in Supplementary Table S13. Yellow Perch abundance and biomass estimates (observed and adjusted for selectivity) are summarized in Supplementary Table S14.
Using the 1998 to 2011 fall index gill netting data, interval mortality rates between consecutive years were estimated from changes in relative abundance (number·net-1) from ages 2-to-3, ages 3-to-4, and ages 4-to-5 using Heincke’s method (Guy and Brown 2007).
This mortality rate was determined as: – loge(Nx+1/ Nx)/t, where Nx is the relative abundance of age x Walleye in the fall sample and Nx+1 is the relative abundance of age x+1 Walleye in the next year’s sample. I adjusted for negative mortality estimates (i.e., greater than 100% survival from one year to the next) by taking the average of the preceding (yeart-1) and following year (yeart+1). The 1998 to 2011 Walleye interval mortality estimates (observed and adjusted for selectivity) using Heincke’s method are in Supplementary Table S15.
4.2 Secondary indicators of stock status
Walleye exhibit sexual size dimorphism (Henderson et al. 2003) so most life history traits were calculated separately for males and females from 1998 to 2011. Growth was described by: 1) an index using average total length- and weight-at-age 3 summarized in Supplementary Table S16 (table contains data from young-of-year to age 6), 2) a lifetime growth model (I used a Microsoft Excel© based application) to estimate the parameters in the von Bertalanffy growth function (Cope and Punt 2007) summarized in Supplementary Table S17, and 3) pre-maturation growth rate (Lester et al. 2004b) summarized in Supplementary Table S18. Condition (weight-at-length) was estimated from length-weight regressions (an ordinary least- squares regression model fitted to logarithmically transformed (base 10) length and weight data) and Fulton’s condition factor (Guy and Brown 2007).
Analysis of covariance was inappropriate for comparing the length-weight regressions because the data violated the assumption that there was homogeneity of within-group regressions (i.e., the regression lines associated with year and sex have a common slope or parallelism) (Guy and Brown 2007). Instead I generated separate regression models from each year’s male and female data to estimate weight- at-350 and 400 mm. The length-weight regressions are summarized in Supplementary Table S19. Fulton’s condition factor was estimated for male and female Walleye, and for Walleye <350 mm and ≥350 mm. These are summarized in Supplementary Table S20 along with the estimated weight-at-350 and 400 mm. Sexual maturity was estimated by fitting logarithmically transformed (base 10) size- and age-at-maturity schedules (i.e., the proportion mature in a length class or age group) to a logistic regression function. The logistic models and maturation schedules are summarized in Supplementary Table S21. To assess whether the fall index gill net catches could provide an index of future recruitment to the Lake Nipissing Walleye population, the relative abundance of young-of-year was compared to those of the same cohort (i.e., a group of fish born in the same year within a population) the following two years (age 1 and 2) using linear regression. Statistical significance was assessed using α = 0.05.
4.3 Ecosystem indicators
Data for ecosystem indicators came from a variety of government and non-government sources. Water quality information from the 1975, 1988 to 1990, and 2003-2004 was obtained from reports published by the Ontario Ministry of the Environment (summarized in Clark et al. 2010). Lake Nipissing water level elevations from 1998 to 2011 were provided by Public Works and Government Services, Canada and are summarized in Supplementary Table S22. Climate data was supplied by the Ontario Ministry of Natural Resources (growing-degree-days ≥5°C) and are summarized in Supplementary Table S23. Ice-out dates were acquired from the North Bay Nugget newspaper and are summarized in Supplementary Table S24.
Rainbow smelt information (presence/absence) came from archived Lake Nipissing Fisheries Assessment Unit index trawling projects (Aquatic Data Repository Project, Ontario Ministry of Natural Resources), the fall index netting projects, and anecdotal reports. Double- crested cormorant nest counts were available from 1993 to 1995 and 1999 to 2010 and are summarized on Supplementary Table S25. Bythotrephes was first collected in Lake Nipissing in 1998. The results from lake wide sampling programs conducted by the Lake Nipissing Partners in Conservation in 2000-2001 and 2009-2010 were available in unpublished grey literature (Filion 2010). Possible relationships between stock status indicators and ecosystem indicators (climate, water levels, ice-out dates and Yellow Perch abundance) were explored using linear regression. Statistical significance was assessed using α = 0.05.
5.0 Results and Discussion
5.1 Primary indicators of stock status
5.1.1 Fisheries performance
The Walleye target yield (for both fisheries) in the 2007-2010 Lake Nipissing fisheries management plan was set at two-thirds of the estimated maximum sustainable yield (Roberts 2007). This equates to ≈60,000 kg·yr-1 or ≈0.70 kg·ha-1·yr-1. Reported Walleye yields have been above this latest target since the beginning of the time series (late 1970s) until 2009 when yields dropped dramatically in 2010-2011 (Figure 2). Over two-thirds of the variation in the angling yield can be explained by variation in fishing intensity (angler-hours·ha-1·yr-1) over the time series (Angling Yield = 0.1422(Angling Intensity) – 0.4097, R2 = 0.69, p < 0.01). There are no effort estimates for the commercial fishery so the relationship between gill net effort and yield is unknown.
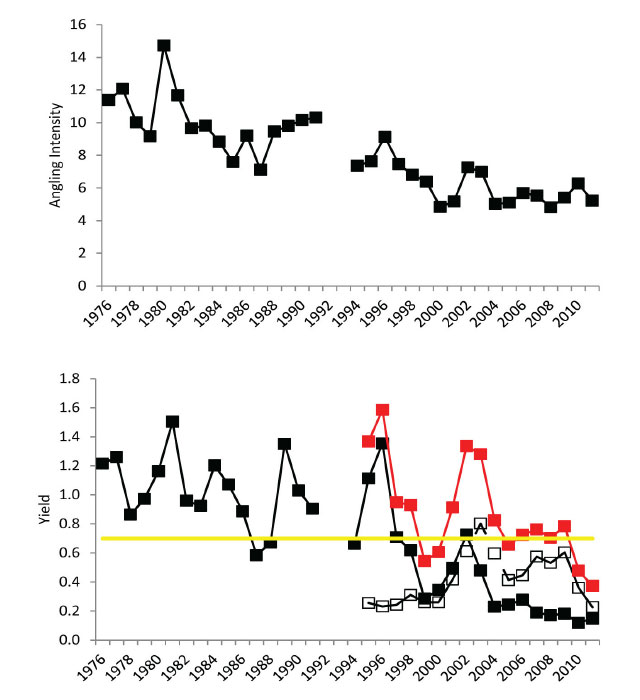
Figure 2. Time series of annual angling intensity (angler-hours·ha-1) 1976 to 2011 is in the upper panel. Time series of Walleye yield (kg·ha-1) for angling fishery (black filled symbols connected by solid black line), Nipissing First Nation commercial fishery (open black symbols connected by dashed black line), total yield (red filled symbols connected by solid red line), and 2007-2010 management plan target (solid yellow line) is in the lower panel.
Walleye were the most sought after species by anglers in all season, accounting for over 75% of the targeted effort through the time series. However there were seasonal differences in the anglers who fished Lake Nipissing. The single largest group of anglers identified during the winter surveys were local residents (living <50km from the shores of Lake Nipissing), representing over 70% of all winter anglers interviewed (the rest of the winter anglers were from Ontario with very few anglers outside Ontario travelling to ice fish Lake Nipissing) (Figure 3). The importance of Lake Nipissing to nearby residents in the winter is also reflected in their accommodations where over three-quarters of anglers interviewed resided on the lake with most of the remaining anglers (<20% of winter anglers interviewed) staying at lodges or using commercial ice huts. A significant proportion of winter anglers also employed guides (23% of those interviewed during winter compared to <3% during openwater angler surveys) and many of these guided winter anglers used commercial huts (21% of winter anglers used commercial huts, 67% personal huts, and 11% fished on the open ice).
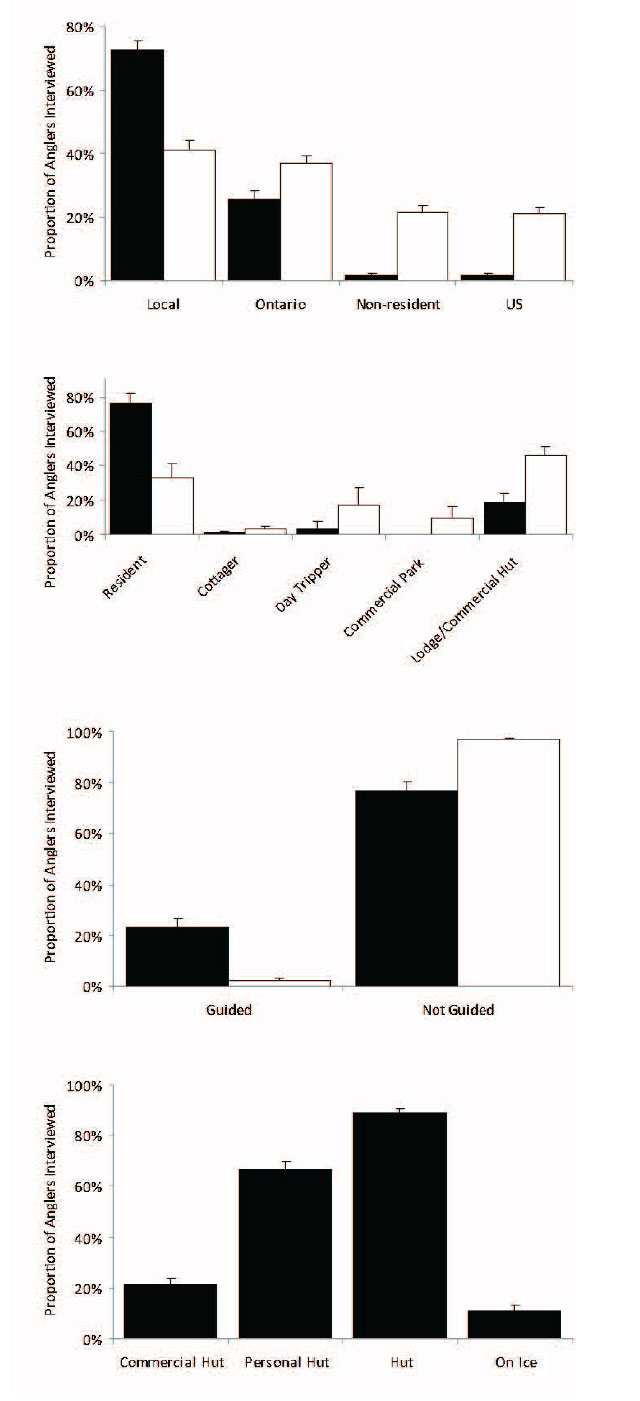
Figure 3. Residency of anglers interviewed during 1984 to 2011 winter (black filled bars with upper 95% confidence interval) and open water angler (open black bars with upper 95% confidence interval) surveys is in the upper panel. Accommodation used by anglers interviewed during the 1984 to 2011 winter and open water angler surveys is in the upper middle panel. Proportion of anglers interviewed using guides during the 1984 to 2011 winter and open water angler surveys is in the lower middle panel. Proportion of winter anglers interviewed using huts during the 1984 to 2011 winter angler surveys is in the bottom panel.
During the open water period Lake Nipissing attracted anglers from other parts of Ontario and the United States who use more commercial establishments during their stay. The open water recreational fishery appealed to fewer local residents (41% of anglers interviewed during the open water angler surveys compared to 72% during the winter angler surveys) but more Ontario residents (37% of those interviewed) and United States citizens (22% of those interviewed). Many of the open water anglers stayed at lodges (46% of those interviewed) or commercial parks (9% of those interviewed). A significant proportion of open water anglers were day-trippers (17% of those interviewed). The remaining one-third of openwater anglers resided on the lake.
5.1.2 Exploitable stock biomass and mortality rates
The estimated natural mortality rate for Lake Nipissing Walleye, based upon life history characteristics, is ≈ 0.24·yr-
- 1. Until the early 1990s stock assessment biologists were quite happy to prescribe a safe adult mortality objective of F = M (fishing mortality rate = natural mortality rate), where assessments lacked precise information on age selectivity, maturity, and recruitment (Walters and Martell 2002). This supposedly conservative starting point was seriously challenged (with real data) when declines of collapses were common when F > 0.6M. Results from a dramatic meta-analysis by Myers et al. (1999) obviously implied that F << M for most species. Lake Nipissing mortality rates (and exploitable stock biomass estimates) are summarized by decade from the 1970s to the 2010s in Table 2. Walleye mortality rate (Z) has been declining since the 1970s but F (Z-0.24) has exceeded M (0.24) since the start of the data collection. So F has exceeded all proposed reference points for optimal F (i.e., to maximize yield). With such high fishing mortality it is not surprising that the current exploitable stock biomass is less than one-half of that seen in the 1980s.
Table 2. Lake Nipissing Walleye mortality and exploitable stock biomass estimates by decade
| Time Period | Total Annual Mortality (Z) | Natural Mortality (M) | Fishing Mortality (F) | Annual Mortality (A) | Exploitation Rate (u) | Walleye Yield (kg ·ha-1) | Walleye Biomass (kg ·ha-1) |
|---|---|---|---|---|---|---|---|
| 1970s | 0.73 | 0.24 | 0.50 | 0.52 | 0.35 | 1.28 | 3.6 |
| 1980s | 0.63 | 0.24 | 0.40 | 0.47 | 0.29 | 1.30 | 4.4 |
| 1990s | 0.75 | 0.24 | 0.51 | 0.53 | 0.36 | 1.09 | 3.0 |
| 2000s | 0.57 | 0.24 | 0.33 | 0.43 | 0.25 | 0.86 | 3.4 |
| 2010s | 0.57 | 0.24 | 0.33 | 0.43 | 0.25 | 0.43 | 1.7 |
5.1.3 Relative abundance and interval mortality rates 1998 to 2011
There were differences between the observed, depth stratum weighted and selectivity adjusted Walleye relative abundance estimates (number·net-1). The annual differences between the observed and depth stratum weighted estimates very high variable but were on average ≈10% higher while differences between the observed and selectivity adjusted estimates (and depth stratified weighting) were less variable, but were ≈20% higher (Figure 4). For the rest of my analysis I will use the depth stratified, selectivity adjusted estimates.
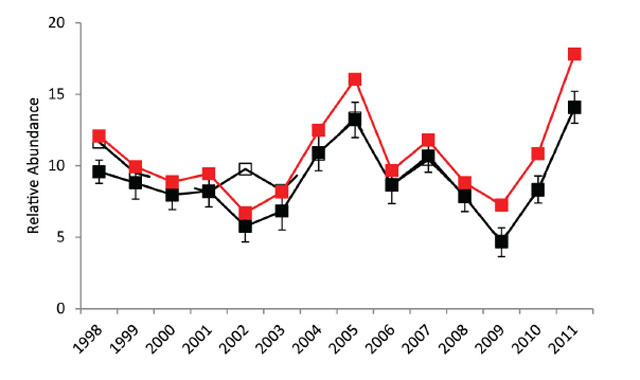
Figure 4. Walleye relative abundance (number·net-1) from 1998 to 2011 fall index gill netting surveys. Filled black symbols connected by a solid black line indicate the annual observed relative abundance estimates with error bars (± 1 standard error). Open black symbols connected by a dashed black line represent the depth-stratified weighted average (1/3 shallow and 2/3 deep net sets). The filled red symbols connected by the solid red line are the gill net selectivity adjusted relative abundance estimates (with depth-stratified weighting).
The exploitable stock (Walleye ≥350 mm) relative biomass (g·net-1) declined from 1998 to 2003 (average for this period ≈2500 g·net-1) increased from 2004 to 2008 (average for this period ≈3700 g·net-1) and then sharply declined in 2009 and remained near that level in 2010 and 2011 (average for 2009-2011 period ≈1600 g·net-1) (Figure 5). Comparing the exploitable stock estimates (from the relationship between yield and exploitation rate) to the relative biomass indices suggests that the fall index netting surveys are tracking the changes in the Lake Nipissing Walleye population (Figure 6).
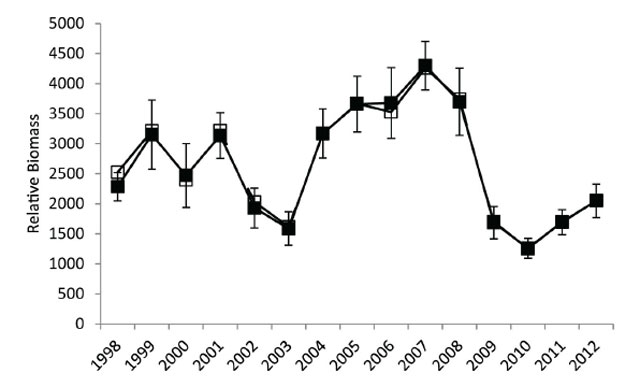
Figure 5. Exploitable stock (Walleye ≥350 mm) relative biomass (g·net-1) from 1998 to 2011 fall index gill netting surveys. Filled symbols connected by a solid line indicate the annual observed relative abundance estimates with error bars (± 1 standard error). Open symbols connected by a dashed line represent gill net selectivity adjusted relative abundance estimates (with depth stratified weighting).
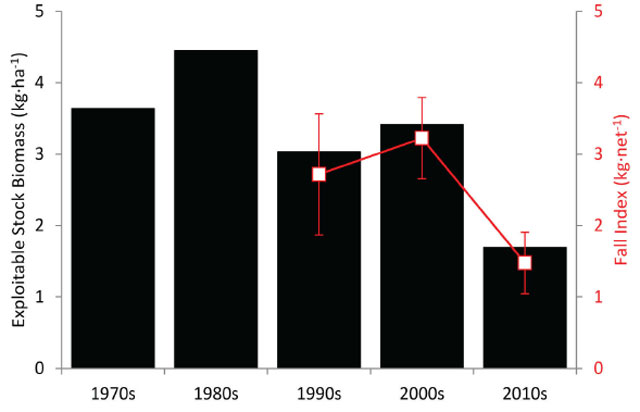
Figure 6. Exploitable stock biomass estimates (kg ·ha-1)from the 1970s to 2010s and relative biomass indices (kg·net-1) from the 1990s to 2010s. Filled black bars indicate the estimated exploitable stock biomass. Open red symbols connected by a solid red line represent fall gill net selectivity adjusted relative biomass indices with error bars (± 1 standard error).
Although the Robson and Chapman’s maximum likelihood estimator indicates declining adult (≥ age 5) Walleye mortality rates since the 1960s, the age class estimates (Heincke’s method) suggest that age 2-to-3 and age 3-to-4 have been rising since the late 1990s with higher estimates than age 4-to-5 beginning in the mid 2000s (Figure 7). This suggests that mortality prior to age 5 is the dominant factor in the decline in the exploitable stock.
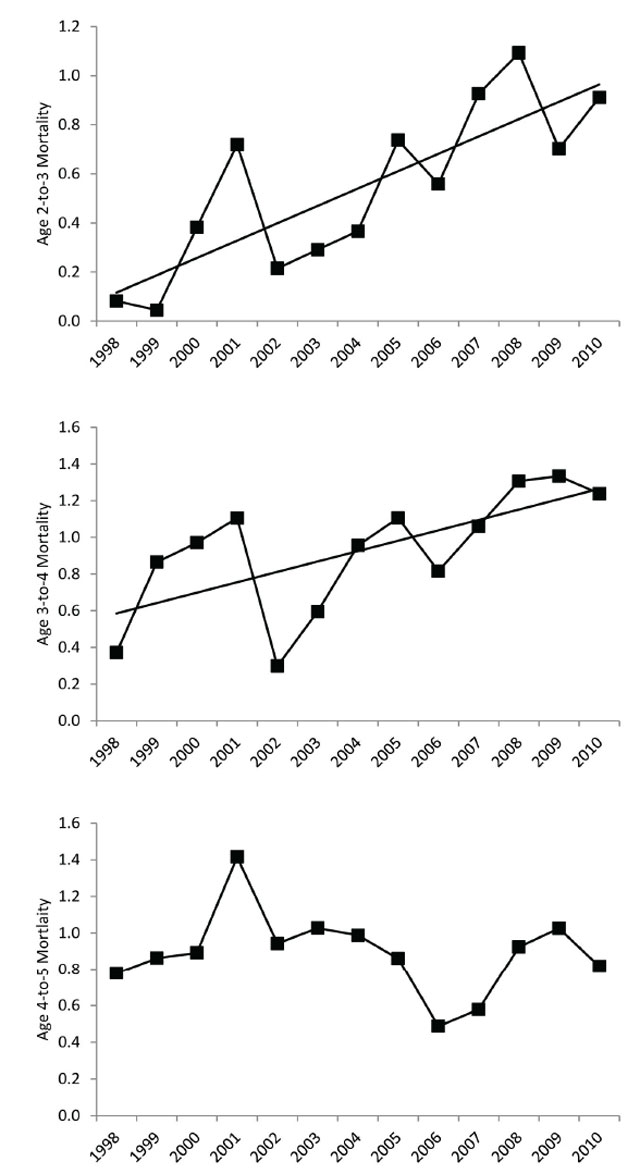
Figure 7. Relationship between year and age 2 to 3 mortality estimates are in upper panel (Fit line: Y = 0.0706X - 141.0190, R2 = 0.66, p < 0.01), year and age 3 to 4 mortality estimates are in middle panel (Fit line: Y = 0.0566X - 112.4370, R2 = 0.44, p < 0.05), and year and age 4 to 5 mortality estimates are in lower panel (1998 to 2011 average mortality rate = 0.8924).
The recreational fishery is largely supported by juvenile Walleye ≈ 350 mm total length (Figure 1; Table 1) and the age-at-350 mm has decreased by ≈ 2 years from the 1970s to the present (Figure 8). This translates into more immature juvenile fish becoming vulnerable to the anglers and gill net fishery. These fish are heavily targeted because of the lower end of the protected slot size (400 mm) and the gill net mesh size restriction. The increased growth may explain the increase in mortality of age 2-to-3 from 1998 to 2011 (Figure 7).
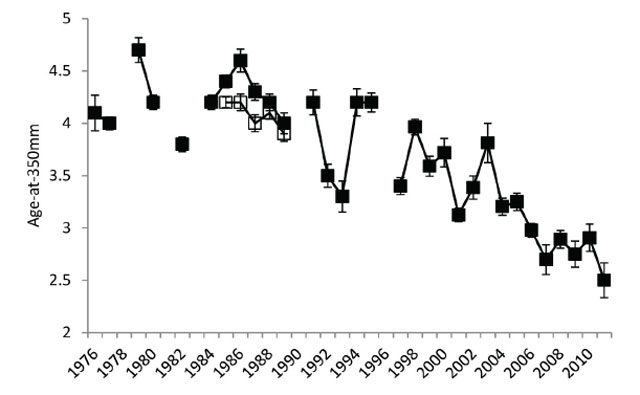
Figure 8. Average Walleye age-at-350 mm with error bars (± 1 standard error) from 1976 to 2011. Filled black symbols connected by solid black line are data from 1976 to 1982 summer index trap netting surveys, 1984 to 1997 open water angler surveys, and 1998 to 2011 fall index gill netting surveys. Open black symbols connected by dashed line are 1985 to 1989 summer index trap netting surveys.
5.2 Secondary indicators of stock status
Density-dependent growth as a result of competition for food in juvenile fishes has been described for many populations. In Walleye, large and rapid compensatory increases in growth rate have been observed, concurrent with reductions in population density generally produced by imposing high fishing mortality (see references in Colby et al. 1979). The compensatory nature of density-dependent growth implies that where the process is significant, harvest and biomass responses to changes in exploitation are less pronounced and more difficult to detect. During the juvenile life stage (prior to sexual maturity), male and female walleyes usually grow at the same rate. Differences in growth rate typically appear after sexual maturation, when females sustain higher growth rates. In Lake Nipissing Walleye, the growth index (measured as total length (mm) and weight (g) –at-age 3) has increased from 1998 to 2011 so that age 3 Walleye now are ≈40 to 50 mm longer and ≈100 to 150 g heavier (Figure 9). However there has been little change in overall lifetime growth patterns, female growth diverges from males between age 3 and 4 so that asymptotic total length is generally < 500 mm for males and <700 mm for females (Figure 10).
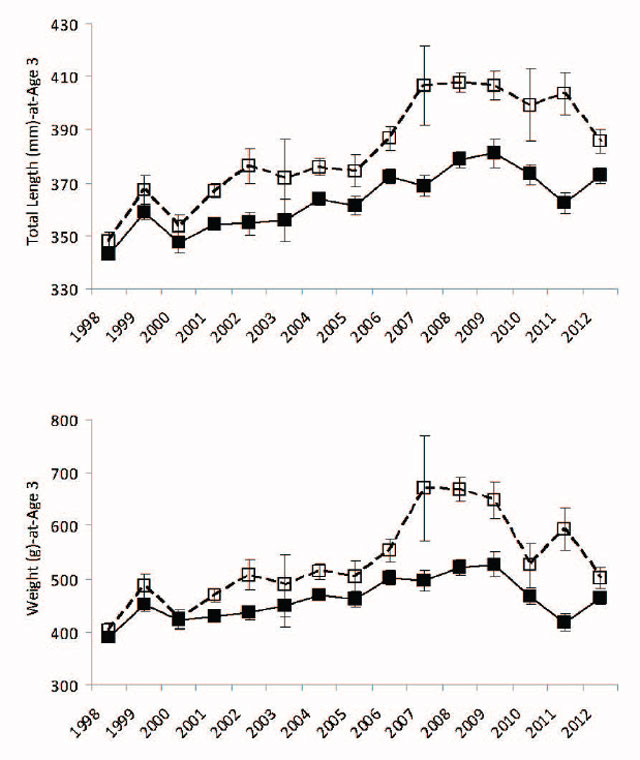
Figure 9. Walleye average total length (mm) and weight (g) at age 3 from 1998 to 2011 fall index gill netting surveys. Male estimates with error bars (± 1 standard error) are represented by filled black symbols connected by a solid black line. Female estimates with error bars (± 1 standard error) are represented by open black symbols connected by a dashed black line. Length data are in upper panel and weight data are in lower panel.
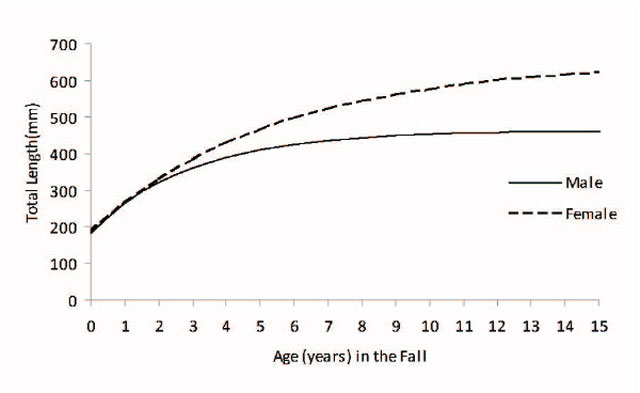
Figure 10. Predicted male and female Walleye total length (mm)-at-age using the sex-specific von Bertalanffy growth model (male estimates are represented by a solid black line and female estimates are represented by a dashed black line) from 1998 to 2011 fall index gill netting surveys.
The biphasic growth model of Lester et al. (2004b) demonstrated that Walleye growth is rapid and approximately linear before maturation and Venturelli et al. (2010) suggested that much of the variation in pre-maturation growth could be explained by an index of ambient thermal energy input (growing degree-days). Lake Nipissing Walleye pre-maturation growth (h) increased with the 2004 cohort (Figure 11). This cohort was produced by the lowest exploitable Walleye stock (2003). Since that time pre-maturation growth has remained high even though stock biomass increased from 2004 to 2008 then dramatically decreased in 2009 and 2011 (Figure 4). There is a strong linear relationship between cohort pre-maturation growth and thermal history (defined as the sum of the current and 3 previous growing seasons thermal energy input). This suggests that pre-maturation growth in Lake Nipissing Walleye was largely determined by climate during the recent time period.
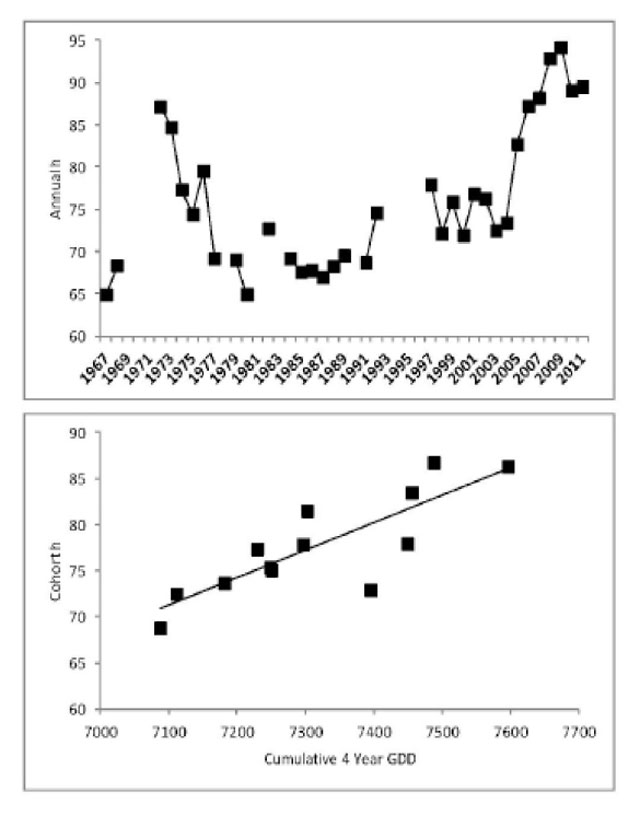
Figure 11. Annual (1967 to 2011) and cohort (1996 to 2008) Walleye pre-maturation growth rate (mm·yr-1). Annual estimates are in the upper panel. Relationship between cohort thermal history (4 growing seasons GDD) and cohort pre-maturation growth (mm·year-1) from 1998 to 2011 fall index gill net surveys is in lower panel (Fit line: Y = 0.0298X - 140.5038, R2 = 0.69, p < 0.01).
Condition (measured as the predicted weight-at-350 mm from the annual length-weight sex-specific regression models or Fulton’s condition factor) was comparatively stable from 1998 to 2007 (Figure 12). Then in 2008-2009 the predicted weight-at-350 mm decreased ≈2 to 3% so that Walleye were in poorer condition (male Walleye weighed ≈15 g less and females weighed ≈10 g less from 2008-2009 compared to 1998 to 2007). Condition declined ≈4 to 5% further in 2010-2011 (male Walleye weighed ≈35 g less and females weighted ≈25 g less in 2010-2011 compared to 1988 to 2007). The decline in condition preceded the decline in exploitable stock biomass by one year. Walleye were in poorer condition in those years where the predator-prey ratio (defined as the ratio of the exploitable Walleye stock biomass divided by Yellow Perch biomass) was <1 and the Yellow Perch relative biomass was > 3500 g·net-1 (Figure 12). This suggests that beginning in 2008 there was a dramatic community shift between Walleye and Yellow Perch.
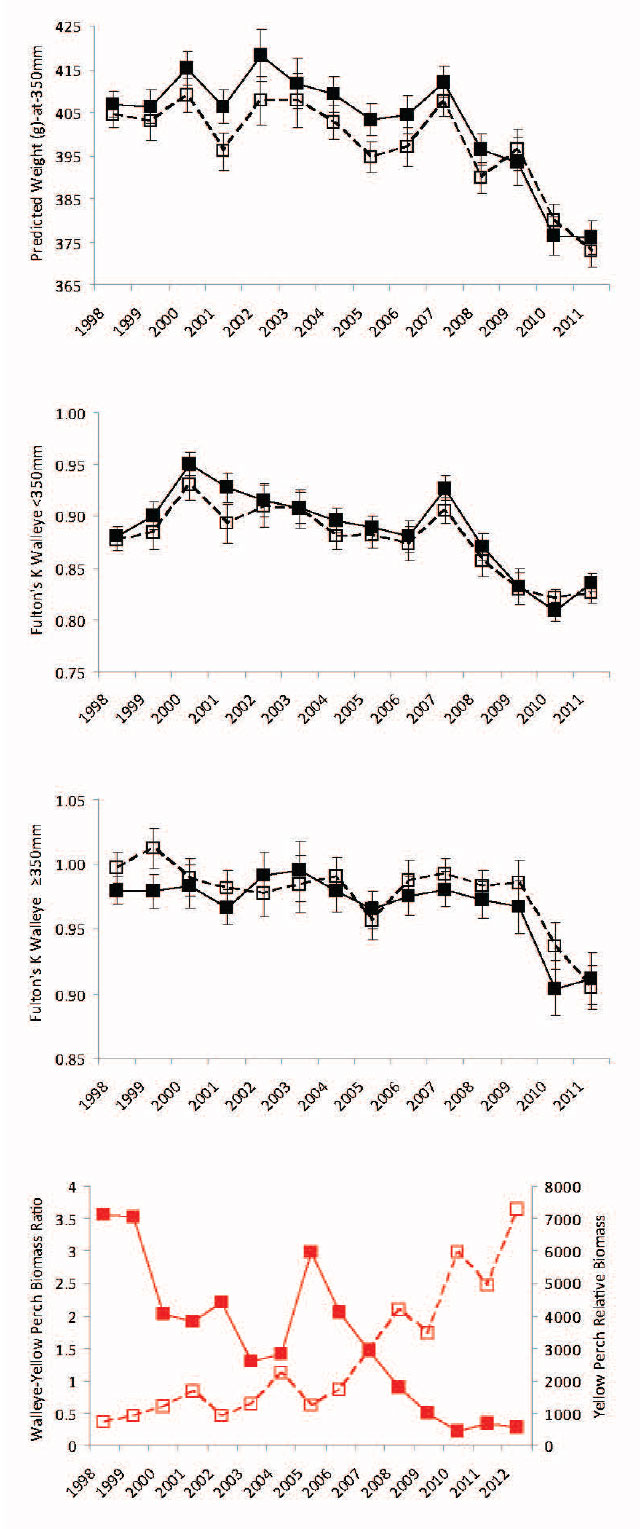
Figure 12. Predicted male and female Walleye weight (g) -at-350 mm total length from 1998 to 2011 fall index gill netting surveys are in upper panel. Fulton’s condition factor for male and female Walleye <350 mm total length from 1998 to 2011 fall index gill netting surveys are in the upper middle panel. Fulton’s condition factor for male and female Walleye ≥350 mm total length form 1998 to 2011 fall index gill netting surveys are in lower middle panel. Male estimates with error bars (± 95% confidence interval) are represented by filled black symbols connected by a solid black line. Female estimates with error bars (± 95% confidence interval) are represented by open black symbols connected by a dashed black line. The Walleye-Yellow Perch ratio (ratio of the exploitable Walleye biomass-to-Yellow Perch biomass) and Yellow Perch relative biomass (g·net-1) are in lower panel. The predator-prey ratio is represented by the filled red symbols connected by a solid red line and the Yellow Perch relative biomass is represented by open red symbols connected by a dashed red line.
Based upon the internal examination of fall caught Walleye, Lake Nipissing males reach sexual maturity (defined as size or age-at-50% maturity) at 320 mm and age 2 (these fish could potentially spawn the next spring at age 3) while females reach sexual maturity 2.2 years later (age 4 to 5; these fish could potentially spawn the next spring at age 5 or 6) at 430 mm (Figure 13). The average age-at-spawning from historical spawning assessments conducted at Wasi Falls from 1968 to 1997 varied from 4.8 to 6.5 years for males and 5.7 to 7.7 years for females.
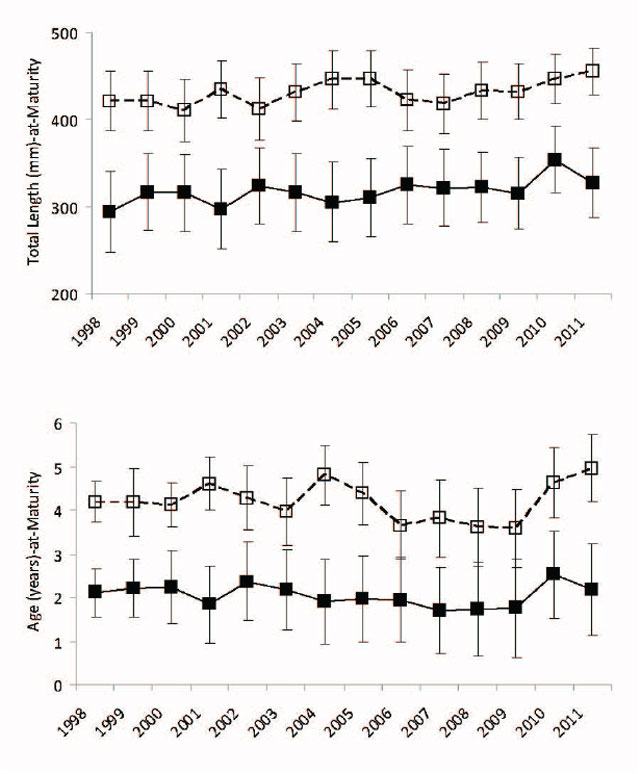
Figure 13. Predicted male and female Walleye total length (mm) and age (years) -at-maturity from 1998 to 2011 fall index gill netting surveys. Male estimates with error bars (± quartiles) are represented by filled black symbols connected by a solid black line. Female estimates with error bars (± quartiles) are represented by open black symbols connected by a dashed black line. Size-at-maturation data are in upper panel and age-at-maturation data are in lower panel.
Changes in fish populations are primarily driven by variability in recruitment. Recruitment of young fish into catchable, harvestable, or adult size is necessary to sustain any population and fishery (Guy and Brown 2007). The inability to predict recruitment has hindered the development of both single and multi-species fish assessment forecast models. The inability to predict recruitment stems from the complexity of the process which is affected by the number of offspring produced as well as the overall effect of density-independent (e.g., temperature and food) and density dependent (e.g., competition for food or refuge with conspecifics or other species) processes on all pre-recruit life stages. Recruitment to the exploitable Walleye stock (age 3) was forecast from simple predictive relationships between young-of-year relative abundance and their abundance at age 1, 2, and 3. The annual relative abundance of young-of-year in the fall index netting surveys is strongly linearly correlated to their abundance at age 1 (Young-of-year abundance explains 60% of the variance in age 1 abundance) and age 2 (Young-of-year abundance explains 61% of the variance in age 2 abundance) (Figure 14). Recruitment to the exploitable stock (age 3) was curvilinear with decreased abundance of age Walleye from year classes where the young-of-year abundance was > 3-5 fish·net-1. Based upon these relationships there should be moderate to high recruitment to the exploitable stock over the next few years.
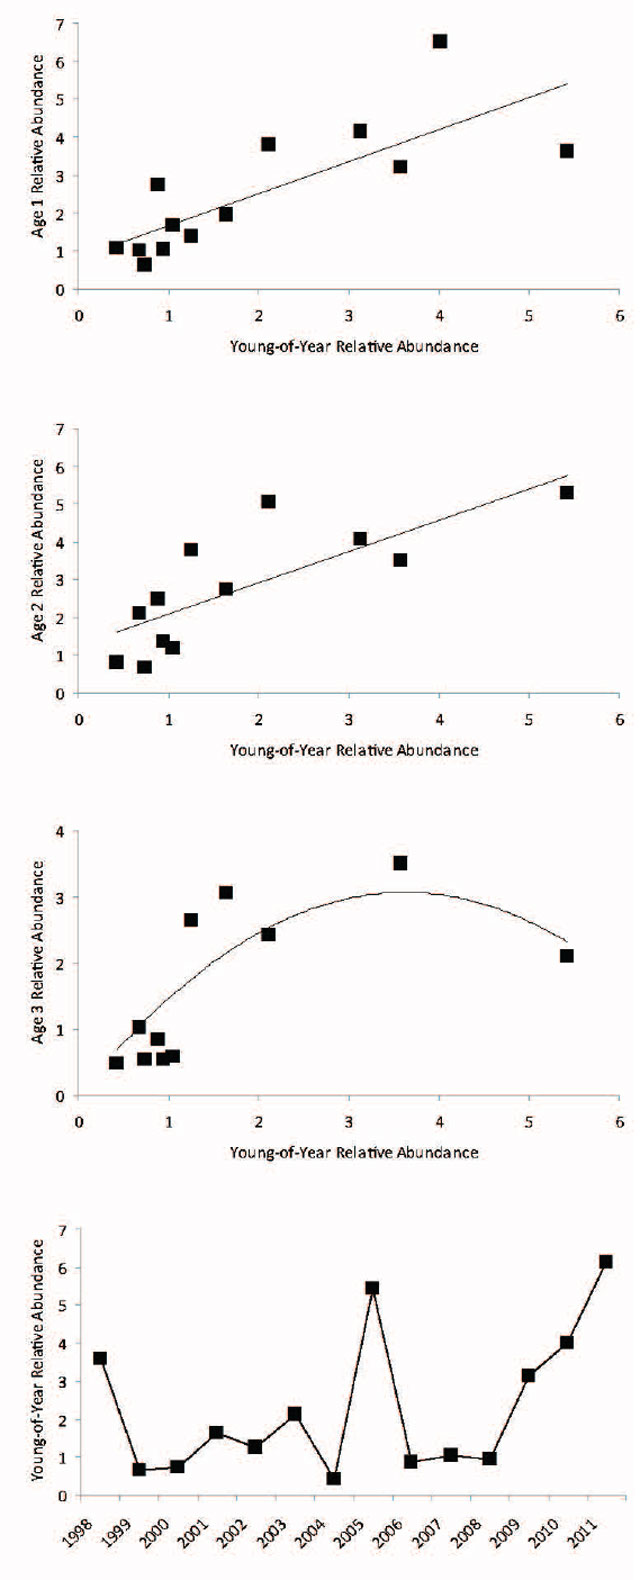
Figure 14. Relationship between cohort young-of-year and age 1 relative abundance (number·net-1) is in upper panel (Fit line: Y = 0.8422X + 0.8441, R2 = 0.60, p < 0.01), cohort young-of-year and age 2 relative abundance is in upper middle panel (Fit line: Y = 0.8277X + 1.2455, R2 = 0.61, p < 0.01), and cohort young-of-year and age 3 relative abundance is in lower middle panel (Fit line: Y = -0.2333X2 + 1.6924X, R2 = 0.70, p < 0.01) . Annual young-of-year relative abundance estimates are in the bottom panel.
5.3 Ecosystem Indicators
The Ontario Ministry of the Environment 2003-2004 report expressed concern that the water quality in Cache and Callander Bays was characterized by higher nutrient levels. However the main conclusion of the report was that the water chemistry of Lake Nipissing has not changed appreciably over the past 15 years. The small changes that were observed in Lake Nipissing have been reported for many smaller lakes through Ontario. These changes are primarily the result of regional impacts such as drought and acidification of watershed soils (causing changes in phosphorus concentrations), reduced deposition of sulphur (resulting in lower lake sulphate concentrations), and the continued application of road salt” (Clark et al. 2010). This does not suggest that there have not been further changes in the last decade but additional water quality monitoring is required to assess the current situation. Water level changes were not correlated with any primary or secondary indicator of the Lake Nipissing Walleye stock status. The reported ice-out date is ≈2 weeks earlier in recent decades (Figure 15) however annual variation in ice-out date was not correlated with any indicator of stock status.
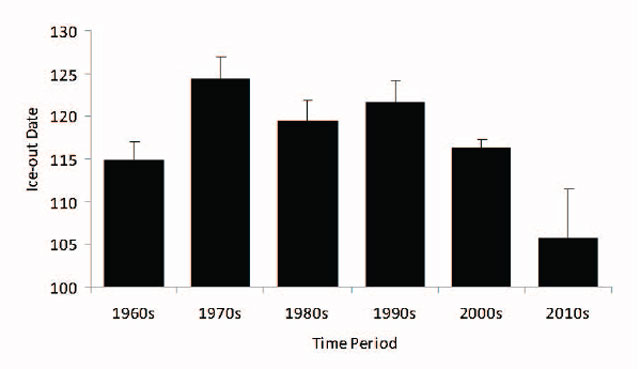
Figure 15. Decadal average ice-out date (Julian calendar) with error bars (± 1 standard error) for Lake Nipissing 1960 to 2012.
Lake Nipissing has the largest inland breeding population of cormorants in northeastern Ontario (Ontario Ministry of Natural Resources 2006). Lake Nipissing was first surveyed for Double-crested Cormorant nesting colonies in 1993 and two nesting sites were found, one consisting of 89 nests and the other 6 nests (Jorgensen et al. 1996). The number of active nests increased dramatically to over 600 in 1994-1995. The number of nests further increased to 1600-2000 nests by the early 2000s. Since 2004 Lake Nipissing Double-crested Cormorant nest counts stabilized at ≈2400 nests. Yellow Perch has been identified as an important diet item for the Lake Nipissing cormorants (Jorgensen et al. 1996). Surprisingly Yellow Perch biomass has dramatically increased during the period that cormorants colonized and became established on Lake Nipissing (Figure 12). This is not to say that cormorants are having an impact on the fish community in Lake Nipissing but it does appear that they are not limiting the production and recruitment of Yellow Perch.
Historical and recent fisheries assessment surveys have documented the presence of Rainbow Smelt in Lake Nipissing since it was first discovered in the late 1970s. However the techniques deployed were either poorly documented (e.g., the historical summer index trawl surveys of the Lake Nipissing Fisheries Assessment Unit) or did not provide adequate samples (e.g., the recent fall index gill netting surveys) to assess abundance or other life history traits. Increases in Rainbow Smelt abundance and importance in the seasonal Walleye diet were first noted in 2007 (Richard Rowe, personal communication). The observation that the Walleye growth index (length and weight-at-age 3) increased at this time (Figure 6) supports this observation however the decline in condition (Figure 12) implies a more complex relationship between predator-prey. Collection of seasonal diet information across a variety of locations on Lake Nipissing would be useful to assess the importance/impact of Rainbow Smelt on Walleye life history traits.
The Spiny Water Flea was suspected to be present in Lake Nipissing in the mid-1990s and was first collected and identified in 1998 by the Lake Nipissing Partners in Conservation (Filion 2010). An intensive survey at 7 sites from June to August 2000-2001 indicated that Bythotrephes was present at low densities throughout the lake in the summer (Filion 2005). A re-survey using 6 of the 2000-2001 sites from late May to early September 2010 documented a striking decline in crustacean zooplankton abundance by the end of June. Associated with this decline was the increased dominance of Spiny Water Flea in the offshore zooplankton community (Filion 2010).
However Spiny Water Flea abundance collapsed in early July. These changes at the base of the food chain could impact the trophic dynamics of the fish in Lake Nipissing.
Stable isotope analysis provides time-integrated information useful for tracking energy flow in aquatic food webs (Guy and Brown 2007). Carbon (δ13C) isotopic signatures are similar to those of their prey and can be used to identify carbon sources at the base of the food chain (i.e., littoral and pelagic food sources). Nitrogen (δ15N) isotopic signatures exhibit a step-wise increase from prey to predator and are used to identify important feeding relationships and energy pathways. Stable isotope samples were collected by Tom Johnston, Ontario Ministry of Natural Resources (unpublished data) from Walleye and various prey species (Emerald Shiner (Notropis atherinoides), Spottail Shiner (Notropis hudsonius), Trout-perch (Percopsis omiscomaycus), Logperch (Percina capriodes), Rainbow Smelt, and Yellow Perch) in 2002-2003 (when Spiny Water Flea were colonizing Lake Nipissing) and 2010-2011 (time period of Spiny Water Flea dominance). Changes in isotopic position suggest that Lake Nipissing fish obtained more of their energy from pelagic sources after Spiny Water Flea became established and were feeding at higher trophic levels (Tom Johnston, personal communication). During this time period Lake Nipissing Yellow Perch (an ontogenetic omnivore that can switch between zooplankton and benthic invertebrates) abundance increased dramatically (Figure 12) and Walleye year-class strength increased (i.e., increased recruitment of young-of-year to the population, Figure 14). This suggests that many of the fish could be utilizing this large zooplankter in their diet. Further examination of trophic ecology and isotope inferred diet with stable isotopes could elucidate food web linkages or bottlenecks in Lake Nipissing.
Concluding Remarks
The data presented in this report shows that the abundance of Walleye ≥350 mm in Lake Nipissing has declined dramatically, especially in recent years, the age distribution shows very few mature (age 3 and older) fish (Figure 16), and their growth rate has increased significantly. The analysis suggests that the Lake Nipissing Walleye stock has been experiencing high levels of fishing mortality (i.e., over-exploited) for many decades and yet has sustained relatively stable fisheries. However the very recent decline (2009-2010) is cause for concern because it may be related to ecosystem changes (e.g., a shift in biomass from Walleye to Yellow Perch, altered predator-prey relationships, trophic changes caused by the colonization of Spiny Water Flea, etc.). At these lower abundance levels Walleye have compensated primarily through growth (i.e., density-dependent effects intertwined with recent climate trends) which has increased the vulnerability of juvenile fish to the fisheries. This situation may not be sustainable in the long term and may require closer monitoring to answer questions regarding changing catchability.
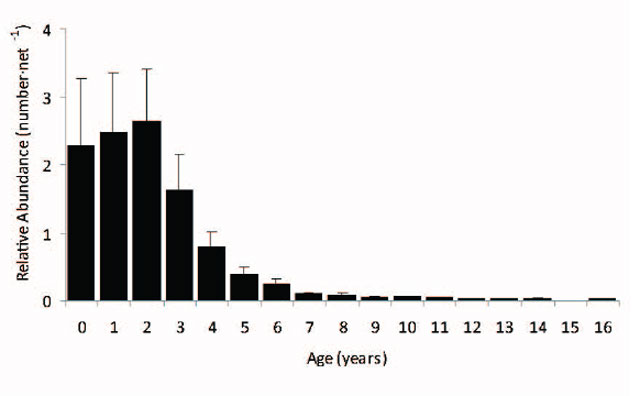
Figure 16. Walleye age distribution from 1998 to 2011 fall index gill netting surveys. Gill net selectivity adjusted relative abundance estimates (number·net-1) with error bars (± standard error).
Acknowledgements
Matt DeMille and Terry Quinney from the Ontario Federation of Anglers and Hunters; Nigel Lester, Tom Johnston, Yingming Zhao, Kim Armstrong, Tim Haxton, Andy Cook, Megan Belore, Rich Drouin, and Jim Bowlby from the Ontario Ministry of Natural Resources; and Nikki Commanda and Richard Rowe from Nipissing First Nation provided valuable assistance and comments on drafts of this report.
References
Clark, B., Paterson, A., DeSellas, A., and R. Ingram.2010. The chemical water quality of Lake Nipissing 2003-2004. Ontario Ministry of the Environement. 57pp.
Colby, P.J., McNichol, R.E., and R.A. Ryder. 1979. Synopsis of biological data on the Walleye (Stizostedion v. vitreum) (Mitchell 1818). FAO Fisheries Synopsis No. 119. Rome, Italy. 139pp.
Cope, J.M., and A.E. Punt. 2007. Admitting ageing error when fitting growth curves: an example using the von Bertalanffy growth function with random effects. Canadian Journal of Fisheries and Aquatic Sciences 64: 205-218.
Diana, J.S. 2010. Should cormorants be controlled to enhance yellow perch in Les Cheneaux Islands? A comment on Fielder (2008). Journal of Great Lakes Research 36: 190-194.
Diana, J.S., S.S. Maruca, and B. Low. 2006. Do increasing cormorant populations threaten sportfishes in the Great Lakes? A case study in Lake Huron. Journal of Great Lakes Research 32: 306-320.
Duffy, M.J., J.L. McNulty, and T.E. Mosindy. September 2000. Identification of sex, maturity, and gonad condition of walleye (Stizostedion vitreum vitreum). Northwest Science and Technology Field Guide: FG-05, Ontario Ministry of Natural Resources, Northwest Region Science and Technology Unit, Thunder Bay, 33pp. - ISBN 0-7778-9018-6.
Fielder, D.G. 2008. Examination of factors contributing to the decline of the yellow perch population and fishery in the Les Cheneaux Islands, Lake Huron, with an emphasis on the role of the double-crested cormorant. Journal of Great Lakes Research 34: 506-523.
Filion, J.-M. 2005. Summer distribution of the limnetic crustacea of Lake Nipissing, Ontario. Lake Nipissing Partners in Conservation, 135 West Peninsula Road, North Bay, Ontario P1B 8G4. 65pp.
Filion, J.-M. 2010. Summer 2010 collapse of the Lake Nipissing zooplankton community subsequent to the introduction of the invasive zooplankter Bythotrephes longimanus. A Lake Nipissing Partners in Conservation case study. Lake Nipissing Partners in Conservation, 135 West Peninsula Road, North Bay, Ontario P1B 8G4. 191pp.
Gunderson, D.R. 1997. Trade-off between reproductive effort and adult survival in oviparous and viviparous fishes. Canadian Journal of Fisheries and Aquatic Sciences 54: 990-998.
Guy, C.S., and M.L. Brown, editors. 2007. Analysis and interpretation of freshwater fisheries data. American Fisheries Society, Bethesda, Maryland, 961pp. ― ISBN 978-1-888569-77-3.
Henderson, B.A., N. Collins, G.E. Morgan, and A. Vaillancourt. 2003. Sexual size dimorphism of walleye (Stizostedion vitreum vitreum). Canadian Journal of Fisheries and Aquatic Sciences 60: 1345-1352.
Jensen, A.L. 1996. Beverton and Holt life history invariants result from optimal trade-off of reproduction and survival. Canadian Journal of Fisheries and Aquatic Sciences 53: 820-822.
Jensen, A.L. 1997. Origin of the relation between K and Linf and synthesis of relations among life history parameters. Canadian Journal of Fisheries and Aquatic Sciences 54: 987-989.
Jorgensen, C., Stronks, T.R., and G. Preston. 1996. Lake Nipissing 1995 data review. Unpublished Ontario Ministry of Natural Resource report. 84pp.
Langangen, O., Edeline, E., Ohlberger, J., Winfield, I.J., Fletcher, J.M., James, J.B., Stenseth, N. C., and L.A. Vollestad. 2011. Six decades of pike and perch population dynamics in Windermere. Fisheries Research 109 131-139.
Lester, N.P., Dextrase, A.J., Kushneriuk, R.S., Rawson, M.R., and P.A. Ryan. 2004a. Light and temperature: key factors affecting Walleye abundance and production. Transactions of the American Fisheries Society 133: 588-605.
Lester, N.P., Shuter, B.J., and P.A. Abrams. 2004b. Interpreting the von Bertalanfy model of somatic growth in fish: the cost of reproduction. Proceedings of the Royal Society, Series B, Biological Sciences 271:1625-1631.
Mann, S.E. 2004. Collection techniques for fish ageing structures Northwest Region. Northwest Science and Information Technical Report TR-73 Revised, Ontario Ministry of Natural Resources, Northwest Region Science and Technology Unit, Thunder Bay, 28pp. ― ISBN 0-7794-5834-6.
Morgan, G.E. 2002. Manual of instructions: Fall Walleye Index Netting (FWIN). Percid Community Synthesis, Diagnostics and Sampling Standards Working Group, Ontario Ministry of Natural Resources, 40pp. ― ISBN 0-7778-8401-01.
MRAG. 2009. Science tools to implement ecosystem based management in Massachusetts. MRAG Americas, Inc. 107pp.
Myers, R.A., Bowen, K.G., and N.J. Barrowman. 1999. Maximum reproductive rate of fish at low population sizes. Canadian Journal of Fisheries and Aquatic Sciences 56: 2404-2419.
Neary, B.P., and B.J. Clark. 1992. The chemical water quality of Lake Nipissing 1988-1990. Ontario Ministry of the Environment, Environmental Sciences and Standards, Technical Report, 66pp. ― ISBN 0-7729-9063-8.
Ontario Ministry of Natural Resources. 2006. Review of the status and management of double-crested cormorants in Ontario. Fish and Wildlife Branch, Wildlife Section, Peterborough, Ontario. 76pp.
Patton, M.Q. 2008. Utilization-focused evaluation 4th Edition. sage Publications Inc., Thousand Oaks, California. 667pp.-ISBN 978-1-4129-5861-5.
Ricker, W.E. 1975. Computation and interpretation of biological statistics of fish populations. Bulletin 191 Fisheries Research Board of Canada 382pp.
Rikter, V.A., and V.N. Efanov. 1976. On one of the approaches to estimation of natural mortality of fish populations. International Convention for the Northwest Atlantic Fisheries Research Document 76/ VI/8. 12pp.
Roberts, S. K. 2007. Lake Nipissing interim fisheries management plan 2007-2010. Ontario Ministry of Natural Resources. 54pp.
Rowe, R. 2007. Lake Nipissing walleye data review and harvest level recommendations for Nipissing First Nation. Nipissing First Nation, 37pp.
Rowe, R., and J. Seyler. 2000. A fisheries assessment plan for Lake Nipissing: 2000-2009. Ontario Ministry of Natural Resources and Anishinabek/Ontario Fisheries Resource Centre, 53pp. Venturelli, P.A., Lester, N.P., Marshall, T.R., and B.J.
Shuter. 2010. Consistent patterns of maturity and density-dependent growth among populations of walleye (Sander vitreus): application of the growing degree-day metric. Canadian Journal of Fisheries and Aquatic Sciences 67: 1057-1067.
Walker, S. 2012. Contact retention selectivity of three types of gill net gangs: A report for the Ontario Ministry of Natural Resources. Unpublished Ontario Ministry of Natural Resource report. 30pp.
Walters, C.J., and S.J.D. Martell. 2002. Stock assessment needs for sustainable fisheries management. Bulletin of Marine Science 70: 629-638.
Supplementary Data Tables2
Table S1. Fish species caught in fall index netting projects 1998 to 2011.
Table S2. Biological measurements of Walleye sampled in fall index netting projects 1998 to 2011.
Table S3. Lake Nipissing recreational fishing effort and Walleye harvest data (recreational and First Nation) 1970 to 2011.
Table S4. Reported Nipissing First Nation commercial Walleye harvest 1995 to 2011 and number of commercial ice hut permits issued 2005 to 2011.
Table S5. Measurements from Lake Nipissing angler harvested Walleye 1981 to 2011.
Table S6. Total length and weight measurements from Lake Nipissing commercially harvested Walleye (by Nipissing First Nation) 2004, 2006, and 2007.
Table S7. Characteristics of Lake Nipissing anglers interviewed during the 1982 to 2011 winter and open water seasons.
Table S8. Female Walleye natural mortality (M) estimates 1968 to 2011.
Table S9. Walleye annual adult mortality rate (Z) estimates from 1967 to 1977 historical surveys and 1998 to 2011 fall index netting projects (size selectivity adjusted).
Table S10. Individual catch records from fall index netting projects 1998 to 2011…
Table S11. Gill net relative selectivity correction factors for Walleye and Yellow Perch caught in standard fall Walleye index gill nets.
Table S12. Walleye age distribution from historical and recent fisheries assessment projects 1967 to 2011.
Table S13. Size-stratified Walleye biomass estimates (observed and size selectivity adjusted) from fall index netting projects 1998 to 2011.
Table S14. Size-stratified Yellow Perch relative abundance and biomass estimates (observed and size selectivity adjusted) from fall index netting projects 1998 to 2011.
Table S15. Walleye age class mortality rate estimates (observed and size selectivity adjusted) from fall index netting projects 1998 to 2011.
2 Requests for any of the data contained in the “Supplementary Tables” are to be in writing and sent to the Ontario Ministry of Natural Resources, North Bay District Office at 3301 Trout Lake Road, North Bay, Ontario P1A 4L7
Table S15. Walleye age class mortality rate estimates (observed and size selectivity adjusted) from fall index netting projects 1998 to 2011.
Table S16. Male and female Walleye young-of-year to age 6 average length- and weight-at-age from fall index netting projects 1998 to 2011.
Table S17. Male and female Walleye von Bertalanffy growth equations from fall index netting projects 1998 to 2011. Table S18. Annual and cohort Walleye pre-maturation growth rates 1967 to 2011.
Table S19. Male, female, and all Walleye length-weight regression models from fall index netting projects 1998 to 2011.
Table S20. Male and female Walleye predicted weight-at-350 and 450 mm total length from annual length-weight regression models (Table S19) and Fulton’s condition factor for male and female Walleye, and for Walleye <350 mm and ≥350 mm total length from fall index netting projects 1998 to 2011.
Table S21. Male and female Walleye length- and age-at-maturity predicted from annual logistic regression models from fall index netting projects 1998 to 2011.
Table S22. Lake Nipissing water level elevations (m) to Government Services, Canada datum reference 1998 to 2011. Table S23. Lake Nipissing growing degree-days ≥5° (GDD) Celsius 1960 to 2011.
Table S24. Lake Nipissing spring ice-out date from the North Bay Nugget newspaper archives 1960 to 2011. Table S25. Lake Nipissing Double-crested Cormorant nest counts 1993 to 2011.