Ontario energy quarterly: electricity in Q1 2020
Read an up-to-date snapshot of Ontario’s electricity sector for January to March 2020.
Overview
Download the data used to create this report from the Ontario open data catalogue.
Ontario Grid-Connected Peak Demand (Q1)
19,928 (MW) (Set on January 17, 2020, 6:00 pm EST)
Source: IESO
Ontario Grid-Connected Peak Demand (YTD)
19,928 (MW) (Set on Q1 – January 17, 2020, 6:00 pm EST)
Source: IESO
| Nuclear | 22.8 TWh | 58.9% |
|---|---|---|
| Hydro | 9.6 TWh | 24.9% |
| Wind | 3.8 TWh | 9.8% |
| Gas | 2.3 TWh | 6.0% |
| Biofuel | < 1 TWh | 0.3% |
| Solar | < 1 TWh | 0.3% |
Source: IESO
| Net peak demand savings | 28 MW |
|---|---|
| Net energy savings | 176 GWh |
Source: IESO
| Commodity | Q1 | YTD |
|---|---|---|
| Hourly Ontario energy price (arithmetic average) | 1.38 | 1.38 |
| Global Adjustment (Average, Class A) |
5.97 | 5.97 |
| Total | 7.35 | 7.35 |
Source: IESO
| Commodity | Q1 | YTD |
|---|---|---|
| Hourly Ontario energy price (arithmetic average) | 1.44 | 1.44 |
| Global Adjustment (Average, Class B) |
11.14 | 11.14 |
| Total | 12.58 | 12.58 |
Source: IESO
Ontario’s transmission grid
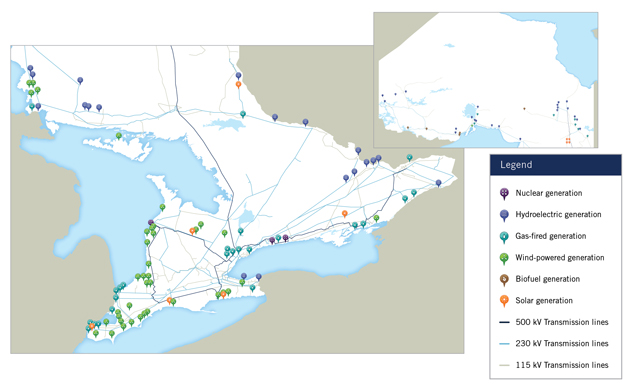
This map displays generation facilities with installed capacity of more than 20 megawatts connected to the high-voltage transmission grid. A zoomed-out version of the map accompanies this figure, to the right.
Electricity supply
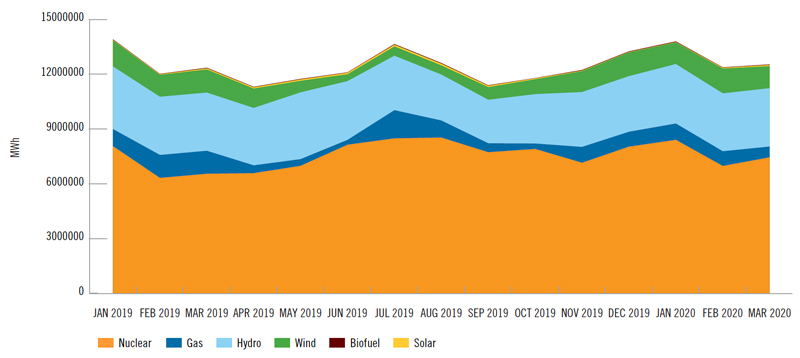
Monthly energy grid output by fuel type
Ontario’s bulk electricity grid has a diverse supply mix, featuring baseload generators that provide energy around the clock, intermittent generators that generate when they are able (primarily wind and solar), and flexible generators that can change their output quickly (primarily natural gas).
Source: IESO
This line graph displays the amount of energy generated in megawatts every month from January 2019 to March 2020. The types of energy sources are: nuclear, hydro, gas, and wind.
The data shown above is sourced from a report developed by the IESO. The report uses settlement data to provide information for all self-schedulers, intermittent and dispatchable Ontario generators registered as a Market Participant. The report – which includes all grid-connected generators, plus those embedded generators that are also registered as market participants – is published monthly as per the Physical Settlement calendar.
Imports and exports
Ontario is connected to a large, stable network of transmission systems across North America, which supports system reliability and economic efficiency. Imports compete against domestic generation to provide energy at the best possible price and to support the province’s needs during periods of high demand. Ontario also exports energy when it is economic, which helps to bring in revenue to offset other system and infrastructure costs and maintain system reliability during times of surplus generation.
Ontario imports and exports power across 26 interties with two provinces and three states. While Ontario is electrically interconnected with Manitoba, Michigan, Minnesota, New York and Quebec, the interties allow for electricity trade in transactions that can reach across eastern North America, contributing to a more diversified and competitive pool of supply.
Q1 imports
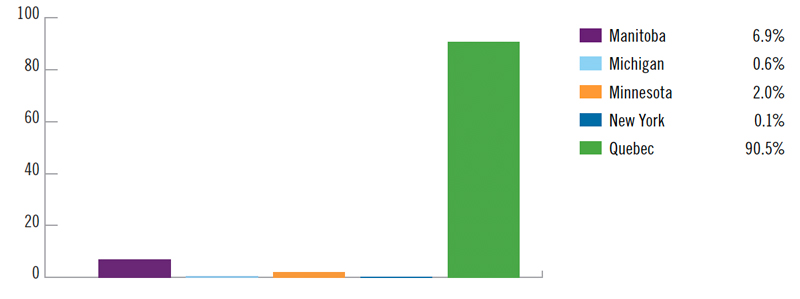
This bar graph displays the data presented in table 5: the percentage of imported energy in Ontario from Manitoba, Michigan, Minnesota, New York, and Quebec for Q1 2020.
| State/Province | % |
|---|---|
| Manitoba | 6.9% |
| Michigan | 0.6% |
| Minnesota | 2.0% |
| New York | 0.1% |
| Quebec | 90.5% |
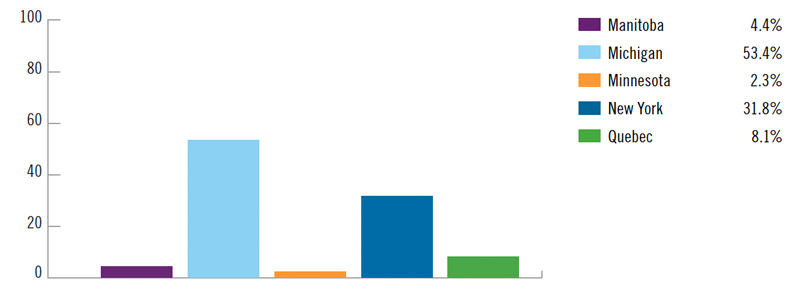
Q1 exports

This bar graph displays the data presented in table 6: the percentage of exported energy from Ontario to Manitoba, Michigan, Minnesota, New York, and Quebec for Q1 2020.
| State/Province | % |
|---|---|
| Manitoba | 4.4% |
| Michigan | 53.4% |
| Minnesota | 2.3% |
| New York | 31.8% |
| Quebec | 8.1% |
| Q1 (GWh) | Imports | Exports |
|---|---|---|
| Manitoba | 83.95 | 244.41 |
| Michigan | 7.23 | 2,933.30 |
| Minnesota | 24.01 | 126.11 |
| New York | 0.89 | 1,746.61 |
| Quebec | 1,105.17 | 447.54 |
| Total | 1,221.25 | 5,497.97 |
Source: IESO
Note: Numbers may not add up to totals due to rounding.
Installed capacity connected to transmission grid
Changes to installed transmission grid capacity in this quarter highlight the continuing process of renewal in Ontario’s electricity sector. While nuclear, hydroelectric and natural gas resources accounted for the vast majority of system capacity, new wind, biofuel and solar generators continued to connect to the transmission grid. The IESO Active Generation Contract List provides the status of individual contracted electricity supply projects within different IESO procurement programs. The list is limited to generation facilities under contract to the IESO.
Grid-connected generation capacity (Q1)
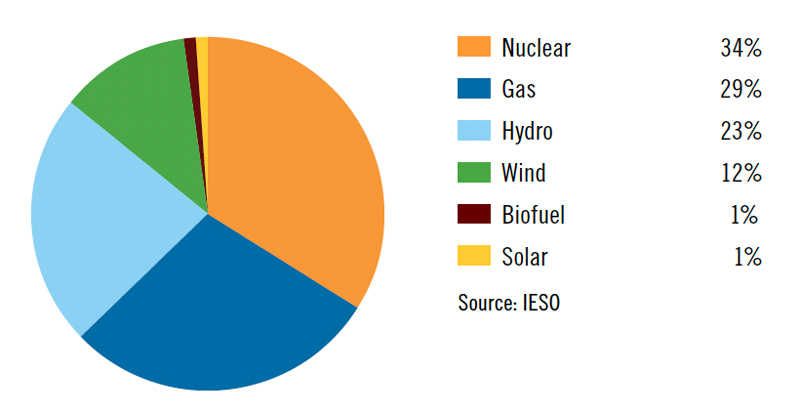
This pie graph displays the data presented in table 8: the percentages of grid-connection generation capacity from nuclear, gas, hydro, wind, biofuel, and solar energy sources.
| Generation | % |
|---|---|
| Nuclear | 34% |
| Gas | 29% |
| Hydro | 23% |
| Wind | 12% |
| Biofuel | 1% |
| Solar | 1% |
Source: IESO
Note: Data includes all transmission-connected generation facilities and distribution-connected facilities that are Market Participants. Numbers may not add up to totals due to rounding.
The table below shows the increased use of renewable resources for generating electricity in the province.
| Type (MW) | 2020 - YTD | 2019 | 2018 | 2017 | 2016 | 2015 | 2014 |
|---|---|---|---|---|---|---|---|
| Nuclear | 13,009 | 13,009 | 13,009 | 13,009 | 12,978 | 12,978 | 12,947 |
| Hydro | 9,065 | 9,065 | 8,482 | 8,490 | 8,451 | 8,432 | 8,462 |
| Coal | 0 | 0 | 0 | 0 | 0 | 0 | 0 |
| Gas |
11,270 | 10,277 | 10,277 | 10,277 | 9,943 | 9,942 | 9,920 |
| Wind | 4,486 | 4,486 | 4,486 | 4,213 | 3,923 | 3,504 | 2,543 |
| Biofuel | 295 | 295 | 295 | 495 | 495 | 495 | 455 |
| Solar | 478 | 424 | 380 | 380 | 280 | 240 | 40 |
| Total |
38,603 | 37,555 | 36,929 | 36,863 | 36,070 | 35,591 | 34,367 |
Note: Total IESO-contracted embedded generation in commercial operation at end of each period. Numbers may not add up to totals due to rounding.
Embedded generation (IESO-contracted)
Embedded generators supply electricity to local distribution systems, helping to reduce demand on the transmission grid and supporting some of the needs of local communities. While wind and solar make up the majority of contracted embedded generation, the IESO has contracted for increasing amounts of hydroelectric, combined heat and power, natural gas and biofuel systems that will also connect to local distribution networks.
By the end of Q1 2020, there was 3,476 MW of contracted generation in commercial operation within local distribution systems.
Contracted embedded generation capacity in commercial operation (Q1)
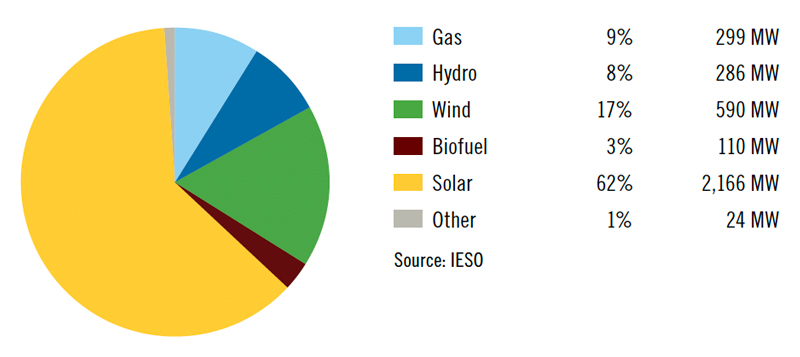
This pie graph displays the data presented in table 10: the amount of embedded generation (in megawatts and corresponding percentages) in Q1 2020 from the following energy sources: solar, wind, hydro, gas biofuel, and other.
| Generation | % | Amount |
|---|---|---|
| Gas | 9% | 299 MW |
| Hydro | 8% | 286 MW |
| Wind | 17% | 590 MW |
| Biofuel | 3% | 110 MW |
| Solar | 62% | 2,166 MW |
| Other | 1% | 24 MW |
Source: IESO
Note: Each of the above numbers appear in the IESO Q1 Progress Report on Contracted Supply.
The table below shows the increased use of embedded generation to supply electricity to local distribution systems in the province.
Contracted embedded generation capacity in commercial operation
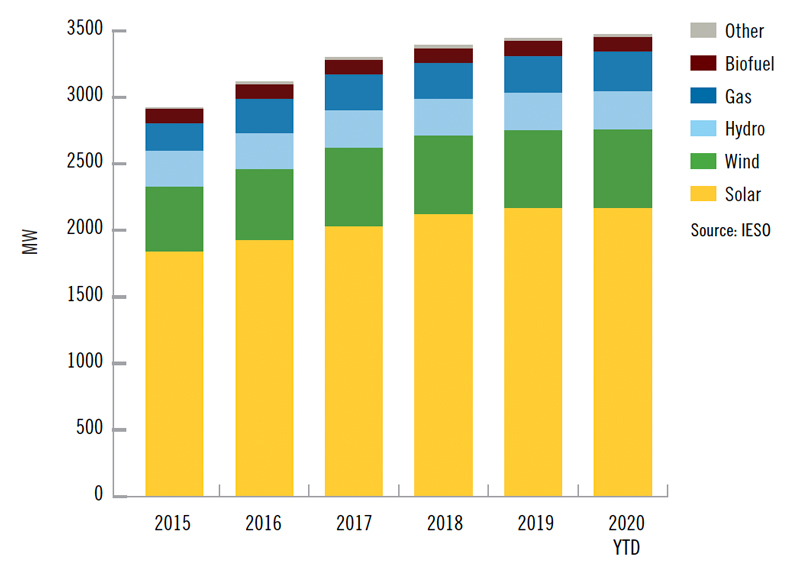
This bar graph displays the amount of embedded generation (in megawatts) to supply electricity to local distribution systems in the province every year from 2015 to 2020 (year-to-date). The types of energy sources are: other, biofuel, gas, hydro, wind, and solar.
Note: Total IESO-contracted embedded generation in commercial operation at end of each period.
The data shown above are sourced from the IESO Progress Report on Contracted Supply. The report provides a quarterly update on the status of supply and procurement initiatives that are under development or in commercial operation, by fuel type, and aggregates total capacities as stated in each contract, which differs from values on installed capacity used for operation purposes. The report is available on the IESO website.
Total grid-connected and contracted embedded generation capacity
This table shows all grid-connected capacity and IESO-contracted embedded capacity in the province.
| Type | 2020 Q1 (MW) | 2020 Q1 (%) |
|---|---|---|
| Nuclear | 13,009 | 31% |
| Hydro | 9,351 | 22% |
| Coal | 0 | 0% |
| Gas | 11,569 | 27% |
| Wind | 5,076 | 12% |
| Biofuel | 405 | 1% |
| Solar | 2,644 | 6% |
| Other | 24 | <1% |
| Total | 42,078 | 100% |
Note: Numbers may not add up to totals due to rounding.
Conservation
Together the Conservation First Framework (CFF), Industrial Accelerator Program (IAP) and the Interim Framework (IF) are expected to achieve 8.7 TWh in savings. As of Q1 2020, Conservation and Demand Management (CDM) Programs have achieved 7,656 gigawatt-hours (GWh) in electricity savings. For more details on quarterly results, please see the quarterly IESO Conservation Progress Report via the IESO Conservation Reports website.
As is common at the start of all conservation frameworks, participation levels in the Interim Framework took time to increase as new programs were implemented, program-delivery vendors were on-boarded, and customers became more familiar with new program offerings. Energy and demand savings from programs under the Interim Framework are forecasted to increase over time as more projects are completed and participation levels continue to increase. Actual savings are expected to continue to accrue through 2021-2022 as committed projects enter into service.
Prior to the COVID-19 health emergency, the IESO was forecasting to cost effectively achieve 100% of the energy savings and demand targets. The IESO is updating its 2020 forecast to account for the COVID-19 health emergency and its impact to overall energy savings and demand targets.
| Incremental progress | 2020 Q1 Incremental |
2015-2020 Q1 Incremental | 2020 target progress (%) |
|---|---|---|---|
| LDC & IESO Delivered CFF Peak Demand Savings (MW) | 17 | 888 | - |
| LDC && IESO Delivered CFF Energy Savings (GWh) | 136 | 7,124 | 119 |
| IESO Delivered IAP Peak Demand Savings (MW) | 5 | 128 | - |
| IESO Delivered IAP Energy Savings (GWh) | 2 | 454 | 35 |
| IESO Delivered IF Peak Demand Savings (MW) | 6.6 | 13.2 | 7.0 |
| IESO Delivered IF Energy Savings (GWh) | 38.4 | 78.3 | 5.5 |
| Total Portfolio Total Peak Demand Savings (MW) | 28 | 1,029 | - |
| Total Portfolio Total Energy Savings (GWh) | 176 | 7,656 | - |
Source: IESO
Note: Totals may not align due to rounding.
Incremental savings (2020 Q1)
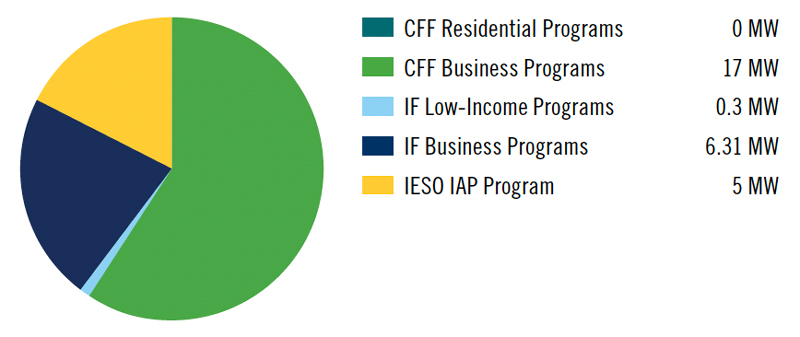
This pie graph displays the data presented in table 13: the 2020 annual peak demand savings, in megawatts, from the following programs: Conservation First Framework Residential Programs, Conservation First Framework Business Programs, Interim Framework Low-Income Programs, Interim Framework Business Programs, and IESO Industrial Accelerator Program.
| Program | Energy savings |
|---|---|
| CFF Residential Programs | 0 MW |
| CFF Business Programs | 17 MW |
| IF Low-Income Programs | 0.3 MW |
| IF Business Programs | 6.31 MW |
| IESO IAP Program | 5 MW |
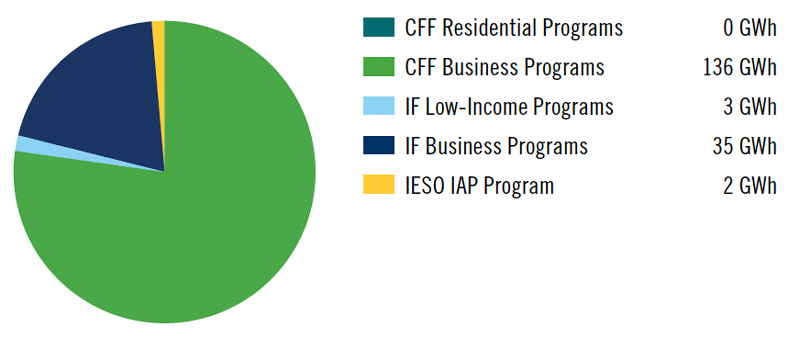
This pie graph displays the data presented in table 14: the 2020 annual energy savings, in megawatts, from the following programs: Conservation First Framework Residential Programs, Conservation First Framework Business Programs, Interim Framework Low-Income Programs, Interim Framework Business Programs, and IESO Industrial Accelerator Program.
| Program | Energy savings |
|---|---|
| CFF Residential Programs | 0 GWh |
| CFF Business Programs | 136 GWh |
| IF Low-Income Programs | 3 GWh |
| IF Business Programs | 35 GWh |
| IESO IAP Program | 2 GWh |
Source: IESO
Note: Totals may not align due to rounding.
Results presented are ‘reported’ (i.e. ‘unverified’) based on project installation dates corresponding to the indicated period and are based on projects reported and invoiced to the IESO as of 2020 quarter 1.
Demand response (DR)
Demand response and peak savings programs benefit the electricity system and lower energy costs for consumers by contributing to overall peak savings for the province.
Beginning in December 2015, DR capacity has been procured through a competitive DR Auction process. The DR Auction provides a transparent and cost-effective way to select the most competitive providers of DR, while ensuring that all providers are held to the same performance obligations.
The December 2018 DR auction procured 818.4 MW for the summer six-month commitment period beginning on May 1, 2019, and 854.2 MW for the winter six-month commitment period beginning on November 1, 2019.
More information on the Demand Response Auction is available on the IESO Demand Response Auction page.
Peak savings
The Industrial Conservation Initiative (ICI) encourages large consumers to shift their energy use away from system-wide peaks. Customers who are able to reduce their impact on peaks benefit the system by reducing the need to build new infrastructure. In 2017, ICI is estimated to have reduced peak demand by 1,400 MW.
Participating customers are assessed an individual Global Adjustment (GA) rate, based on the percentage that their demand contributes to the top five system coincident peaks measured during a defined base period.
The table below lists the top five daily peaks for the base period that began on May 1, 2018 and ended on April 30, 2019.
| Date | September 5, 2018 | July 5, 2018 | July 4, 2018 | August 28, 2018 | September 4, 2018 |
|---|---|---|---|---|---|
| Hour Ending | 17 | 15 | 18 | 17 | 17 |
| Allocated Quantity of Energy Withdrawn (MW) | 22,551.315 | 22,415.022 | 22,122.730 | 21,643.799 | 21,379.327 |
| Embedded Generation (MW) | 1,076.151 | 1,418.704 | 734.709 | 1,069.941 | 803.919 |
| Energy Storage Injections (MWh) | 0.446 | 0.008 | 0.393 | 0.581 | 0.759 |
| Total (MW) | 23,627.020 | 23,833.718 | 22,857.046 | 22,713.159 | 22,182.487 |
Source: IESO
Note: The value in the Total (MW) column is the number used to calculate a customer’s Peak Demand Factor.
The above values are used for the July 1, 2019 to June 30, 2020 adjustment period.
Information on peak tracking can be found on the IESO Peak Tracker page
More information on the ICI is available on the IESO website (PDF).
Greenhouse gas emissions
The marked decline in greenhouse gas emissions (measured in tonnes of CO2 equivalent) is a result of the phase-out of coal-fired electricity generation in the province, uptake of emissions-free generation and conservation measures. Emissions of oxides of sulphur (SOx) – which are predominantly a by-product of coal combustion – have also shown a marked decrease with the phase-out of coal-fired electricity.
Greenhouse gas emissions for the ontario electricity sector
The chart below shows annual greenhouse gas emissions (measured in tonnes of CO2 equivalent) for the years 2010-2020. Year-to-date greenhouse gas emissions in Q1 2020 totalled approximately 1 megatonne (Mt).
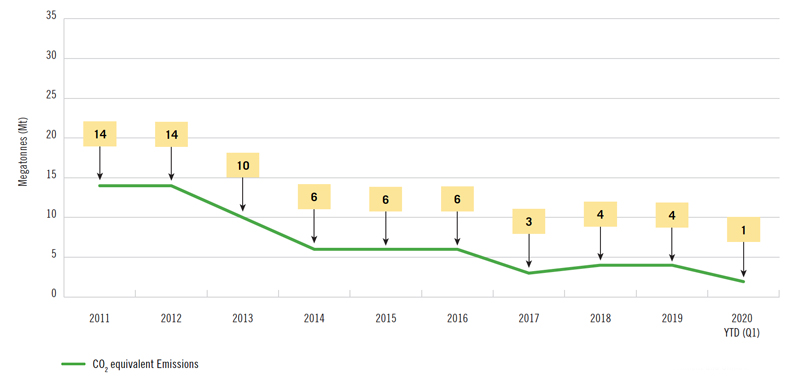
The line graph shows annual greenhouse gas emissions (measured in tonnes of carbon dioxide equivalent) for the years 2010-2020.
Air contaminants
Air contaminants, including oxides of sulphur (SOx), oxides of nitrogen (NOx) and fine particulate matter (PM2.5), are also released during combustion of fossil fuels.
| Emissions | 2011 | 2012 | 2013 | 2014 | 2015 | 2016 | 2017 | 2018 | 2019 | 2020 |
|---|---|---|---|---|---|---|---|---|---|---|
| SOx Emissions | 11,966 | 10,342 | 10,192 | 846 | 424 | 579 | 644 | 504 | 464 | 75 |
| NOx Emissions | 18,198 | 19,867 | 17,973 | 11,448 | 10,355 | 9,323 | 5,695 | 5,924 | 6,010 | 1,445 |
| PM2.5 Emissions | 518 | 468 | 445 | 309 | 262 | 239 | 195 | 210 | 212 | 53 |
Source: IESO, Environment Canada
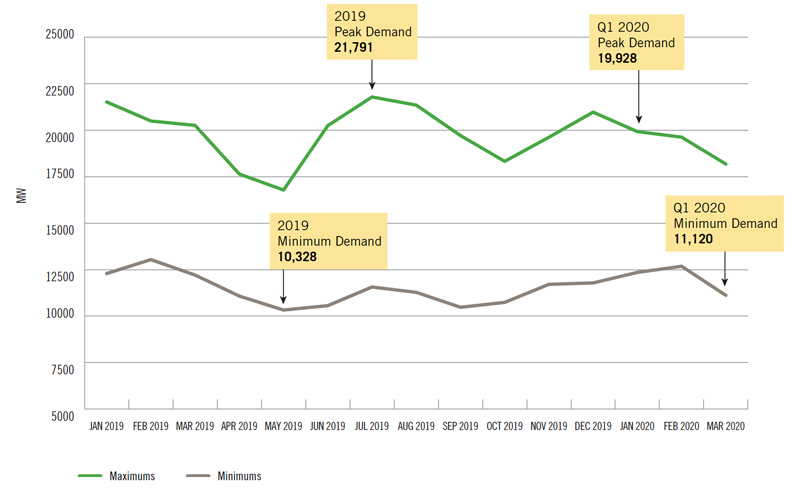
Electricity demand
Ontario Grid-Connected Peak Demand in Q1: 19,928 (MW) (Set on January 17, 2020, 6:00 pm EST)
Ontario Monthly peaks and minimums
Source: IESO
This line graph displays Ontario monthly demand peaks and demand minimums every month between October 2018 and March 2020, in megawatts. The 2019 peak demand was 21,791 MW and the 2019 minimum demand was 10,328 MW. The Q1 2020 peak demand was 19,928 MW and the Q1 2020 minimum demand was 11,120 MW.
Forecast demand peaks
The demand for electricity on the provincial grid is forecast on a rolling 18-month basis. An assessment is done to assure the adequacy of the existing and proposed generation and transmission facilities to meet demand needs. The chart below presents normal weather forecasts, representing a typical peak for the time of year, and extreme weather forecasts that reflect severe weather conditions. The impacts of time-of-use rates and the Industrial Conservation Initiative – which incent customers to reduce demand in peak demand hours – are also factored into the demand forecast in this report.
| Season | Normal Weather Peak (MW) | Extreme Weather Peak (MW) |
|---|---|---|
| Winter 2019-20 | 21,115 | 22,288 |
| Summer 2020 | 22,138 | 24,500 |
| Winter 2020-21 | 21,160 | 22,456 |
Source: IESO Reliability Outlook
| Year | Q1 Total (TWh) |
|---|---|
| 2020 | 34.41 |
| 2019 | 35.73 |
| 2018 | 35.02 |
| 2017 | 34.31 |
| 2016 | 35.16 |
| 2015 | 37.47 |
| 2014 | 38.35 |
| 2013 | 36.59 |
Source: IESO Power Data, Demand Overview
Note: Total does not include the impact of embedded generation to reduce demand.
| Year | Total (TWh) | Change Over Previous Year |
|---|---|---|
| 2020 | 34.4 | n/a |
| 2019 | 135.1 | -2.3 |
| 2018 | 137.4 | 5.3 |
| 2017 | 132.1 | -4.9 |
| 2016 | 137.0 | 0.0 |
| 2015 | 137.0 | -2.8 |
| 2014 | 139.8 | -0.9 |
Source: IESO Power Data, Demand Overview
Note: Total does not include the impact of embedded generation to reduce demand.
Electricity prices
Commodity cost
Commodity cost comprises two components, the wholesale price (the Hourly Ontario Energy Price) and the Global Adjustment. The commodity cost is only a portion of the total energy bill.
| Month (¢/kWh) | JAN 2019 | FEB 2019 | MAR 2019 | APR 2019 | MAY 2019 | JUN 2019 | JULY 2019 | AUG 2019 | SEP 2019 | OCT 2019 | NOV 2019 | DEC 2019 | JAN 2020 | FEB 2020 | MAR 2020 | 2020 YTD |
|---|---|---|---|---|---|---|---|---|---|---|---|---|---|---|---|---|
| HOEP |
2.64 | 2.71 | 2.67 | 1.48 | 0.70 | 0.37 | 2.05 | 1.48 | 1.34 | 0.65 | 1.96 | 2.06 | 1.39 | 1.40 | 1.34 | 1.38 |
| Average Class A Global Adjustment Rate | 5.32 | 5.43 | 4.81 | 6.37 | 6.42 | 7.18 | 5.94 | 6.72 | 5.75 | 6.28 | 5.13 | 5.30 | 5.66 | 6.06 | 6.18 | 5.97 |
| Total Cost of Commodity | 7.96 | 8.14 | 7.48 | 7.85 | 7.12 | 7.55 | 7.99 | 8.20 | 7.08 | 6.93 | 7.09 | 7.36 | 6.93 | 7.09 | 7.36 | 7.35 |
Source: IESO
| Month (¢/kWh) | JAN 2019 | FEB 2019 | MAR 2019 | APR 2019 | MAY 2019 | JUN 2019 | JULY 2019 | AUG 2019 | SEP 2019 | OCT 2019 | NOV 2019 | DEC 2019 | JAN 2020 | FEB 2020 | MAR 2020 | 2020 YTD |
|---|---|---|---|---|---|---|---|---|---|---|---|---|---|---|---|---|
| HOEP |
2.78 | 2.79 | 2.73 | 1.56 | 0.76 | 0.48 | 2.19 | 1.61 | 1.43 | 0.72 | 2.07 | 2.19 | 1.48 | 1.45 | 1.39 | 1.44 |
| Average Class A Global Adjustment Rate | 8.09 | 8.81 | 8.04 | 12.33 | 12.60 | 13.73 | 9.65 | 12.61 | 12.26 | 13.68 | 9.95 | 9.32 | 10.23 | 11.33 | 11.94 | 11.14 |
| Total Cost of Commodity | 10.87 | 11.60 | 10.77 | 13.89 | 13.36 | 14.21 | 11.84 | 14.22 | 13.69 | 14.4 | 12.02 | 11.51 | 14.4 | 12.02 | 11.51 | 12.58 |
Source: IESO
Totals do not sum due to dollar values that are rounded down to cents.
Monthly wholesale electricity prices
The wholesale electricity price fluctuates by the hour. This chart shows the average wholesale prices for each month. The monthly price varies depending on factors in the electricity market that shift the energy price higher or lower. A higher average monthly price exerts a downward pressure on costs that needs to be recovered through Global Adjustment.
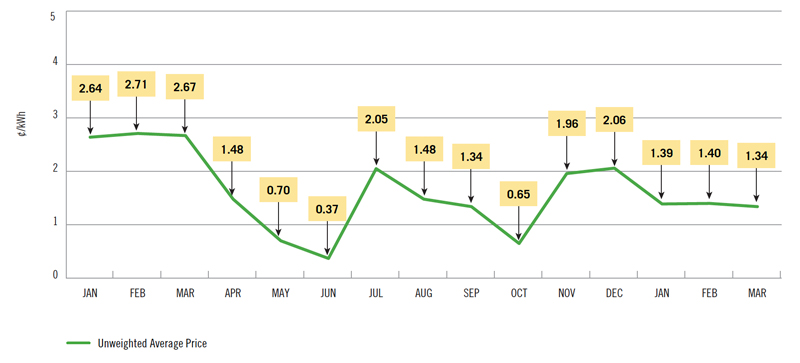
Source: IESO
This chart shows the average wholesale electricity prices for each month, from January 2019 to March 2020, in cents per kilowatt-hour.
Time-of-use pricing under the Regulated Price Plan (RPP)
In accordance with the mandate provided under the Ontario Energy Board Act, 1998, the OEB developed the Regulated Price Plan (RPP), which provides residential and small business consumers with stable and predictable electricity pricing and encourages conservation. The plan has been in place since 2005.
RPP consumers with eligible time-of-use (or "smart") meters that can determine when electricity is consumed during the day pay RPP prices under a time-of-use price structure. The prices for this plan are based on three time-of-use periods per weekday. These periods are referred to as off-peak, mid-peak and on-peak and are shown in the figure below. The hours for mid-peak and on-peak periods are different in the summer and winter months to reflect energy consumption patterns in those seasons, as explained below.
Effective November 1, 2019, the OEB resumed setting RPP prices under section 79.16 of Ontario Energy Board Act, 1998. At the same time, the Ontario government also introduced the Ontario Electricity Rebate, providing a 31.8% rebate on the pre-HST amount of the bill, largely offsetting the RPP price changes on the Electricity line.
On March 17, 2020, the Government of Ontario declared a state of emergency under the Emergency Management and Civil Protection Act to help fight the spread of COVID-19. On March 24, 2020, the Government issued an Emergency Order under the Emergency Management and Civil Protection Act, fixing time-of-use prices at the off-peak price of 10.1 ¢/kWh for all hours of the day, seven days a week. This pricing was in effect until May 31, 2020. The prices below reflect the RPP prices that were set November 1, 2019, and effective for most of the Q1 reporting period.
Summer and winter time-of-use hours
The RPP time-of-use periods are different in the summer than they are in the winter to reflect seasonal variations in how customers use electricity. During the summer, people use more electricity during the hottest part of the day, when air conditioners are running on high. In the winter, with less daylight, electricity use peaks twice: once when people wake up in the morning and turn on their lights and appliances, and again when people get home from work. The time-of-use (TOU) prices applicable from January 1, 2020 for RPP consumers with eligible time-of-use meters are shown in the table below.
Summer (May 1 – October 31) Weekdays
Off peak: 7pm to 7am
Mid peak: 7am to 11am, 5pm to 7pm
Peak: 11am to 5pm
Winter (November 1 – April 30) Weekdays
Off peak: 7pm to 7am
Mid peak: 11am to 5pm
Peak: 7am to 11am, 5pm to 7pm
Weekends and Statutory Holidays
Off peak: 24 hours a day
| Time-of-use RPP Prices – ¢/kWh | Off-Peak | Mid-Peak | On-Peak | Average Price |
|---|---|---|---|---|
| Price (¢) | 10.1 | 14.4 | 20.8 | 12.8 |
| January 1, 2020, w/ w.a. delivery | $/700 kwh |
| Electricity | 89.62 |
| Delivery OEB calculated w.a. delivery | 42.52 |
| Losses | 4.55 |
| Regulatory | 3.12 |
| HST | 18.18 |
| Ontario Electricity Rebate | (44.46) |
| Total Bill: | 113.53 |
This table shows a monthly bill for a residential RPP TOU consumer with monthly usage of 700 kWh with 64% of consumption occurring off-peak, 18% occurring mid-peak and 18% occurring on-peak. The delivery and regulatory charges are weighted-average charges as calculated by the Ontario Energy Board (OEB). Line losses are based on the weighted-average loss factor as calculated by the OEB. Delivery charges and line losses will vary depending on utility. For additional information please see the OEB's bill calculator.
Ontario industrial electricity rates
Industrial electricity consumers can either be directly connected to the high-voltage transmission grid or receive electricity from their local distributor (e.g., Toronto Hydro). Directly-connected consumers do not pay distribution charges, thus lowering their electricity cost. The table below shows the distribution of average all-in prices for all directly-connected consumers in Ontario for 2019. In Ontario, electricity rates for large industrial consumers in Ontario vary by customer as they are determined by individual consumption patterns. Generally speaking, the less energy a large industrial consumer uses during peak hours, the more these consumers reduce their impact on the provincial power system as well as their electricity costs. For most, the commodity cost incorporates both the fluctuating market price and the allocation of the Global Adjustment based on their energy use during peaks.
Transmission-Connected Industrial Ratesfootnote 8 (2019)
Frequency of Cost per MWh
This bar graph shows the distribution of average all-in prices for all directly-connected consumers in Ontario for 2019.
The table below shows average all-in electricity price for a distribution-connected industrial consumer inseveral service territories.
| Cost | Windsor (EnWin) | Hamilton (Alectra) | Ottawa | Sudbury | Toronto |
|---|---|---|---|---|---|
| HOEP |
13.84 | 13.86 | 13.87 | 14.38 | 13.88 |
| Class A Global Adjustment | 59.93 | 60.02 | 60.03 | 62.25 | 60.08 |
| Delivery | 11.38 | 20.27 | 20.10 | 14.87 | 23.94 |
| Regulatory | 3.92 | 3.92 | 3.92 | 4.07 | 3.93 |
| All-In Price | 89.07 | 98.07 | 97.92 | 95.57 | 101.83 |
Source: IESO and OEB
Note: The Debt Retirement Charge ended for all electricity users on March 31, 2018.
2019 indicative industrial electricity prices (Canadian ¢/kWh)
The table below compares indicative retail industrial electricity prices across North American jurisdictions. For reference, Ontario – South reflects the average price for April 2019. Ontario – North is based on the same figure, along with the 2 cent per kilowatt hour Northern Industrial Electricity Rate Program rebate. See footnote for more details.
| Rank | Jurisdiction | Cost |
|---|---|---|
| 1 | Quebec | 5.79 |
| 2 | Manitoba | 5.87 |
| 3 | Oklahoma | 6.09 |
| 4 | Washington | 6.18 |
| 5 | Ontario North | 6.84 |
| 6 | Texas | 6.83 |
| 7 | Nevada | 6.92 |
| 8 | Kentucky | 6.93 |
| 9 | Georgia | 7.19 |
| 10 | Louisiana | 7.19 |
| 11 | New York | 7.29 |
| 12 | Iowa | 7.37 |
| 13 | Utah | 7.39 |
| 14 | Tennessee | 7.5 |
| 15 | North Carolina | 7.54 |
| 16 | South Carolina | 7.54 |
| 17 | Idaho | 7.54 |
| 18 | Arkansas | 7.55 |
| 19 | Montana | 7.67 |
| 20 | New Mexico | 7.7 |
| 21 | West Virginia | 8.04 |
| 22 | Mississippi | 8.07 |
| 23 | Arizona | 8.08 |
| 24 | Missouri | 8.14 |
| 25 | Alabama | 8.24 |
| 26 | Oregon | 8.37 |
| 27 | Ohio | 8.38 |
| 28 | British Columbia | 8.51 |
| 29 | Wyoming | 8.58 |
| 30 | Pennsylvania | 8.69 |
| 31 | New Brunswick | 8.74 |
| 32 | Newfoundland | 8.82 |
| 33 | Ontario South | 8.84 |
| 34 | Illinois | 8.95 |
| 35 | Canadian Average | 9.03 |
| 36 | Virginia | 9.22 |
| 37 | Kansas | 9.56 |
| 38 | Colorado | 9.57 |
| 39 | Michigan | 9.6 |
| 40 | Saskatchewan | 9.62 |
| 41 | Indiana | 10.04 |
| 42 | Nebraska | 10.06 |
| 43 | South Dakota | 10.15 |
| 44 | Florida | 10.15 |
| 45 | Wisconsin | 10.17 |
| 46 | Prince Edward Island | 10.24 |
| 47 | Maryland | 10.25 |
| 48 | Minnesota | 10.36 |
| 49 | Delaware | 10.44 |
| 50 | U.S. Average | 10.58 |
| 51 | Nova Scotia | 11.02 |
| 52 | North Dakota | 11.18 |
| 53 | District of Columbia | 11.28 |
| 54 | Alberta | 12.87 |
| 55 | Maine | 12.98 |
| 56 | New Jersey | 13.54 |
| 57 | Vermont | 13.95 |
| 58 | California | 14.68 |
| 59 | New Hampshire | 17.37 |
| 60 | Connecticut | 18.88 |
| 61 | Massachusetts | 19.17 |
| 62 | Rhode Island | 21.17 |
| 63 | Alaska | 24.45 |
| 64 | Hawaii | 35.52 |
Note: Estimates may differ from actual costs to a consumer based on location, connection, and operational characteristics. Prices exclude taxes and participation in any applicable jurisdictional benefit programs.
The Ontario price is based on April 2019 data and includes the Hourly Ontario Energy Price, Class A Global Adjustment, delivery, and wholesale market service charges.
All other Canadian prices are from the Hydro Quebec Rate Comparison for rates effective April 1, 2019 for select local distribution companies servicing specific cities and reflects a 5 MW consumer with an 65% load factor. Where Hydro Quebec reports prices for two cities in a province (e.g. Calgary and Edmonton), an average of the two is used, in provinces where only one city is reported e.g. Vancouver in BC, Montreal in QC), that one price is used to represent the province for indicative comparison purposes.
American jurisdictions reflect April 2019 data from the US Energy Information Administration’s survey of approximately 500 of the largest electric utilities. The price reflects the average revenue reported by the electric utility from electricity sold to the industrial sector. The value represents an estimated average retail price, but does not necessarily reflect the price charged to an individual consumer. Prices are converted at an exchange rate of 1 USD = 1.34 CAD.
Electricity – what’s new
| Information | Published By | Date |
|---|---|---|
| Reliability Outlook | IESO | June 20, 2019 |
| Quarterly Conservation Report (Q2 & Q3 2019) (PDF) | IESO | November 21, 2019 |
| Progress Report on Contracted Electricity Supply (Q4 2019) (PDF) | IESO | March 24, 2020 |
| Pickering Performance Report – Q1 2020 | OPG | June 16, 2019 |
| Darlington Performance Report – Q1 2020 | OPG | June 16, 2020 |
| OPG Quarterly Financial Results – Q1 2020 | OPG | May 12, 2020 |
| Darlington Refurbishment Performance Report – Q1 2020 | OPG | May 12, 2020 |
| Power News – Special Edition – COVID-19 | OPG | April 24, 2020 |
| Hydro One Quarterly Report (Q4 2019) | Hydro One | August 9, 2019 |
| Report on the 2018 Results of LEAP Emergency Financial Assistance (PDF) | OEB | January 13, 2020 |
| Final Staff Report to the Board, Consultation to Review Natural Gas Supply Plans (PDF) | OEB | March 26, 2020 |
The complete Refurb reports are no longer being posted to OPG.com. An update report is being posted instead.
Footnotes
- footnote[1] Back to paragraph Class A customers are large electricity consumers that pay Global Adjustment based on their proportion of energy use during the five hours of the year with the highest demand. All other customers are Class B, and pay GA on a volumetric basis.
- footnote[2] Back to paragraph Units that use natural gas, oil or are dual fuel, such as Lennox, NP Kirkland and NP Cochrane, are included in the Gas category.
- footnote[3] Back to paragraph A small amount (estimated 180 MW) of contracted embedded capacity is IESO-administered (market participant) generation and therefore reported in both grid-connected and contracted embedded generation totals. Totals do not include non-contracted embedded generation capacity, whose total annual output is approximately 1 TWh.
- footnote[4] Back to paragraph All conservation metrics above are presented as ‘net’ savings which take into consideration the actual influence of the program on participants (e.g., estimating free-ridership and spill over savings). Furthermore, all savings presented above persist until the year 2020 at the end-user level (e.g., accounting for transmission and distribution system line losses). To align savings with generation level metrics, values should be increased by factor of 6.7% for distribution system level savings or a factor of 2.5% for transmission system level savings.
- footnote[5] Back to paragraph Represents savings with an in-service date within the quarter and not savings received by the IESO since the last report
- footnote[6] Back to paragraph (Unweighted) average of Hourly Ontario Energy Prices to reflect a typical (flat) industrial consumption profile.
- footnote[7] Back to paragraph Averages are weighted by the amount of electricity used throughout the province within each hour to broadly reflect the consumption profile of Class B (i.e., residential and commercial) consumers.
- footnote[8] Back to paragraph Does not include Northern Industrial Electricity Rate Program.
- footnote[9] Back to paragraph Data in the table is for a hypothetical consumer with a monthly peak demand of 5 megawatts and an 85% load factor, reflecting delivery and regulatory charges in effect in Q4 2017. Load factor is an expression of how much energy was used in a time period, expressed as a percentage of what would have been used if consuming at full potential for the entire period. A 30 day month is assumed.
- footnote[10] Back to paragraph The distribution cost estimate for an industrial customer in Toronto reflects the assumption that 1 kVA is 1 kW for billing purposes.
- footnote[11] Back to paragraph HOEP is based on a three-month arithmetic average (January - March 31, 2020). The Global Adjustment shown in the table is an average of all distribution-connected Class A consumers for January to March 2020. Both quantities have been adjusted for losses using the applicable primary metered loss factor for each distributor.