January to December, 2025
Introduction
About the Ontario Employment Report – January to December, 2025
The Ontario Employment Report is released four times a year and provides an assessment of the current trends and developments in the Ontario labour market. The Ontario Employment Report is a companion report to the Ontario Economic Accounts, which provides an overall assessment of the current state of the Ontario economy.
The report for the fourth quarter of 2025 provides an assessment of Ontario’s labour market for the entire year, comparing annual averages, while the first through third quarter reports measure year-over-year changes in quarterly data.
Overview
Key labour market indicators, 2025
Employment:
- +80,900 net jobs in 2025 (+1.0%)
- +40,600 net full-time jobs in 2025 (+0.6%)
Unemployment rate:
- 7.7% in 2025 (+0.7 percentage point)
Participation rate:
- 65.0% in 2025 (-0.3 percentage point)
Highlights in 2025
- Employment increased among full-time workers (+0.6%) and part-time workers (+2.8%).
- Private sector employment experienced the largest growth (+77,300, +1.4%), while self-employment also increased (+0.4%) and public sector employment shrank (-0.1%).
- Employment increased in the services-producing industries (+1.4%) but declined in the goods-producing industries (-0.5%).
- Among major industries, information, culture and recreation experienced the largest growth (+8.2%), followed by wholesale and retail trade (+2.2%) and accommodation and food services (+4.4%).
- Among broad occupational groups, sales and service occupations (+3.3%) and natural and applied sciences and related occupations (+5.5%) saw the largest increases in employment.
- Employment increased in four out of five regions, with Northern Ontario (+3.2%) recording the highest percentage increase in employment.
- Employment growth was driven by gains among core-aged workers (+1.0%), but youth employment recorded the fastest increase (+2.5%).
- Among core-aged individuals, employment levels increased for those with a university degree (+1.6%), high school graduates (+4.1%) and those with less than high school education (+9.9%), while employment for those with a postsecondary certificate or diploma declined (-2.1%).
- Actual average weekly hours worked per worker and total economy-wide weekly hours worked decreased.
- The average hourly wage of employees was $37.72, an increase of 1.6% after accounting for inflation.
- The unemployment rate increased by 0.7 percentage point to 7.7%, the highest rate since 2012 (excluding the pandemic years).
- The share of those unemployed for 27 weeks or more increased to 27.1% (+4.7 percentage points).
- The participation rate declined by 0.3 percentage point to 65.0%, driven by declining participation among the core-aged and older population.
Employment change by province, 2025
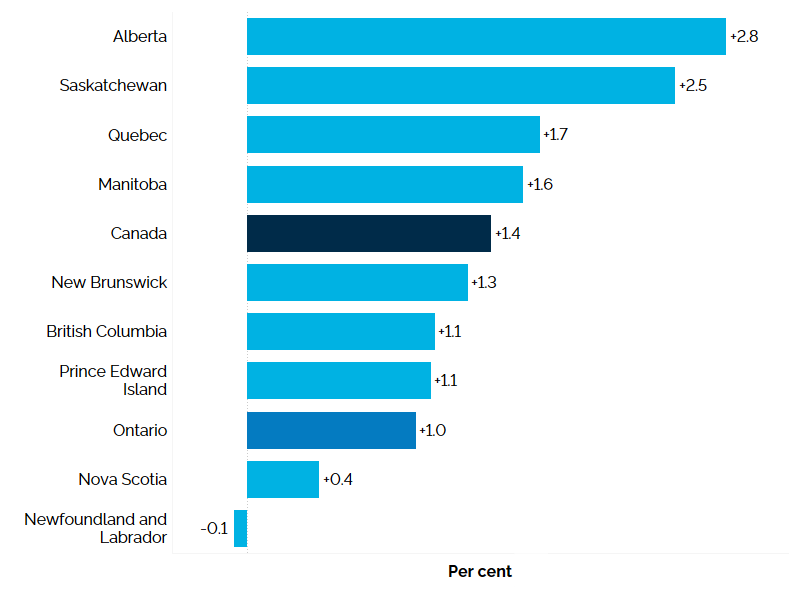
The horizontal bar chart shows the per cent annual employment change for the ten Canadian provinces and Canada. Employment increased the most in Alberta (+2.8%), followed by Saskatchewan (+2.5%), Quebec (+1.7%), Manitoba (+1.6%), New Brunswick (+1.3%), British Columbia and Prince Edward Island (each +1.1%), Ontario (+1.0%), and Nova Scotia (+0.4%). Employment in Newfoundland and Labrador declined by 0.1%. Canada’s employment increased by 1.4%
In 2025, Ontario’s employment increased by 1.0% (+80,900). This followed increases in 2024 (+1.7%) and 2023 (+3.1%).
In 2025, employment increased in all provinces, except Newfoundland and Labrador (-0.1%). While Ontario had the largest employment increase (+80,900) among provinces, its percentage growth in employment (+1.0%) was below the national average (+1.4%). Alberta recorded the largest percentage increase in employment (+2.8%).
Ontario’s labour market, 1976-2025
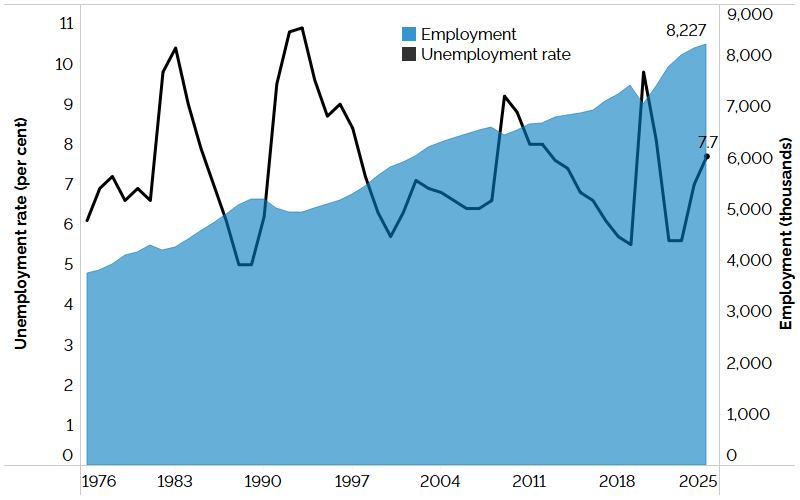
The combination line and area chart shows Ontario’s unemployment rate (line chart) and employment (area chart), measured in thousands, from 1976 to 2025. Ontario’s unemployment rate has fluctuated reaching highs of 10.4% in 1983, 10.9% in 1993, 9.2% in 2009 and 9.8% in 2020 and lows of 5.0% in 1988 and 1989, 5.7% in 2000 and 5.5% in 2019 and 5.6% in both 2022 and 2023. Ontario’s unemployment rate increased in 2025 by 0.7 percentage point to 7.7%. Employment in Ontario has risen steadily since 1976 with a few exceptions when employment contracted during recessions. The decrease in employment from 2019 to 2020 was sharper compared to previous recessions, but employment in 2025 is well above the 2019 level and the highest on record at 8,227,000.
In 2025, the unemployment rate in Ontario was 7.7%, above the Canadian rate of 6.8%. Ontario’s unemployment rate increased by 0.7 percentage point year-over-year and was the highest rate since 2012, excluding the pandemic years (2020 and 2021).
In 2025, Ontario’s labour force participation rate went down by 0.3 percentage point to 65.0%, which was slightly below the Canadian rate of 65.3%.
Ontario’s employment rate declined to 60.0% in 2025 from 60.7% in 2024, as employment growth (+1.0%) did not keep pace with population growth (+2.1%) in the Labour Force Survey (LFS). This follows LFS population increases in 2023 and 2024 (+2.8% and +3.8%, respectively) - the largest on record - which may have contributed to the recent rise in unemployment rates.
Type of work
Employment change by full-time, part-time status, Ontario, 2025
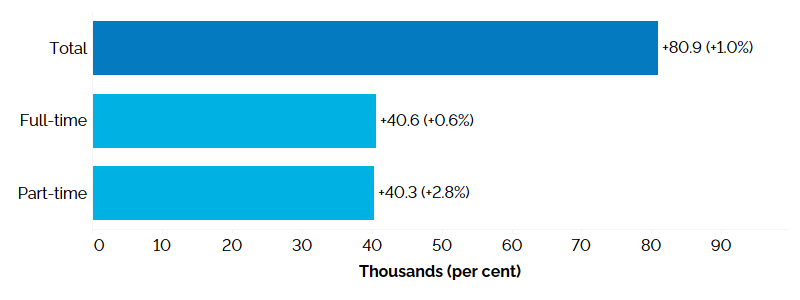
The horizontal bar chart shows Ontario’s annual employment change by full-time and part-time status, measured in thousands with percentage changes in brackets. Total employment increased by 80,900 (+1.0%), with full-time employment increasing by 40,600 (+0.6%), and part-time employment increasing by 40,300 (+2.8%).
In 2025, employment in Ontario increased by 1.0%, driven by increases in both full-time (+40,600, +0.6%) and part-time positions (+40,300, +2.8%).
Employment change by employment sector, Ontario, 2025
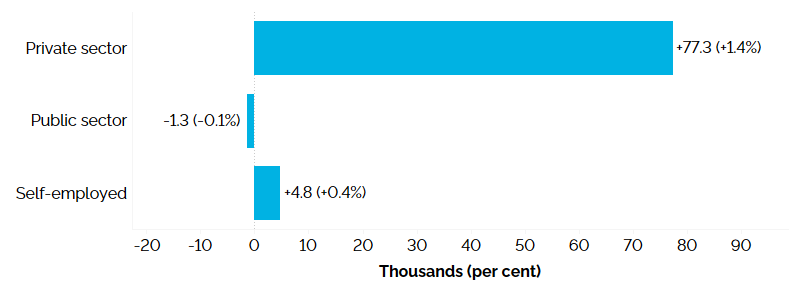
The horizontal bar chart shows Ontario’s annual employment change for the private sector, public sector and the self-employed, measured in thousands with percentage changes in brackets. Employment increased in the private sector (+77,300, +1.4%) and for the self-employed (+4,800, +0.4%), while it declined in the public sector (-1,300, -0.1%).
In 2025, the private sector had the largest increase in employment (+77,300, +1.4%), followed by self-employment (+4,800, +0.4%), while the public sector
Industry and occupation
In 2025, employment decreased in goods-producing industries (-8,000, -0.5%) and increased in services-producing industries (+88,800, +1.4%).
Employment change by industry, goods-producing industries, Ontario, 2025
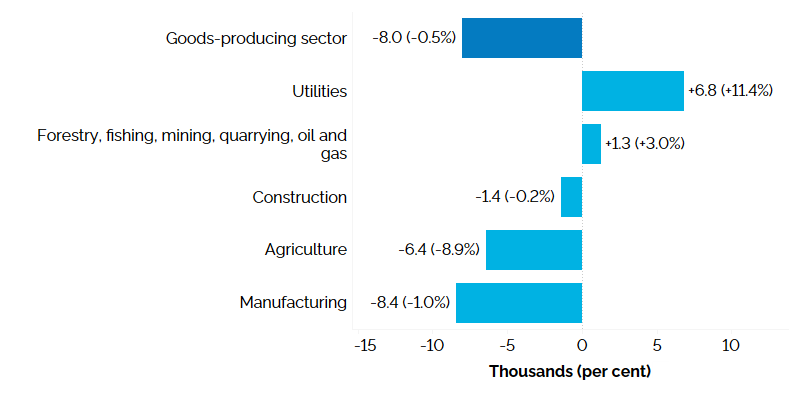
The horizontal bar chart shows Ontario’s annual employment change by industry for goods-producing industries, measured in thousands with percentage changes in brackets. Employment in three out of five goods-producing industries decreased: manufacturing (-8,400, -1.0%), agriculture (-6,400, -8.9%) and construction (-1,400, -0.2%). Utilities (+6,800, +11.4%) and forestry, fishing, mining, quarrying, oil and gas (+1,300, +3.0%) experienced increases in employment. The overall employment in goods-producing industries decreased by 8,000 (-0.5%).
The modest decline in goods-producing sector employment in 2025 (-0.5%) follows a larger decline in the previous year (-2.2%). Relative to pre-pandemic levels (2019), employment in goods-producing industries grew slower (+6.7%), compared to that in services-producing industries (+12.0%).
Three out of five goods-producing industries saw a decline in employment in 2025. The manufacturing industry recorded the largest employment decline (-8,400, - 1.0%), followed by agriculture (-6,400, - 8.9%) and construction (-1,400, -0.2%). Utilities (+6,800, +11.4%) and forestry, fishing, mining, quarrying, oil and gas (+1,300, +3.0%) experienced employment growth.
Employment change by industry, services-producing industries, Ontario, 2025
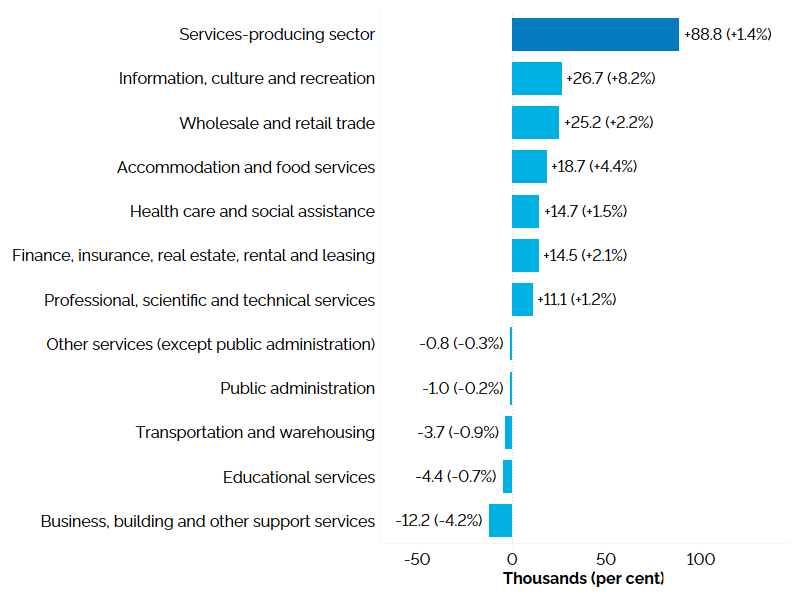
The horizontal bar chart shows Ontario’s annual employment change by industry for services-producing industries, measured in thousands with percentage changes in brackets. Six out of eleven services-producing industries experienced an increase in employment, with the largest increase for information, culture and recreation (+26,700, +8.2%), wholesale and retail trade (+25,200, +2.2%), and accommodation and food services (+18,700, +4.4%). Five industries experienced declines in employment, with the largest decline for business, building and other support services (-12,200, -4.2%). The overall employment in services-producing industries increased by 88,800 (+1.4%).
Six of eleven services-producing industries experienced employment growth in 2025. The information, culture and recreation industry had the highest employment growth (+26,700, +8.2%), followed by wholesale and retail trade (+25,200, +2.2%) and accommodation and food services (+18,700, +4.4%). Business, building and other support services (-12,200, -4.2%) experienced the largest employment decline in 2025.
Employment change by occupational group, Ontario, 2025footnote 2
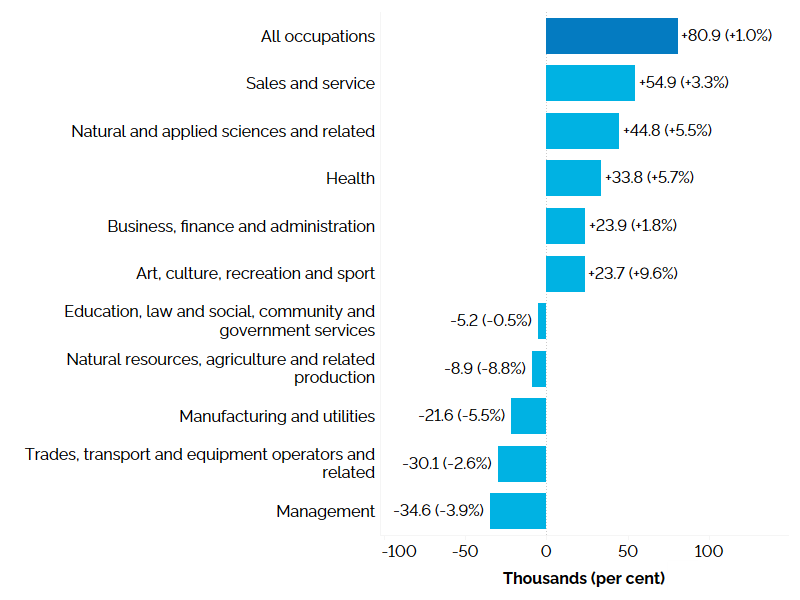
The horizontal bar chart shows Ontario’s annual employment change by broad occupational group, measured in thousands with percentage changes in brackets. Employment increased in five of ten broad occupational groups. Sales and service occupations experienced the largest employment increase (+54,900, +3.3%), followed by natural and applied sciences and related occupations (+44,800, +5.5%), health occupations (+33,800, +5.7%), and business, finance and administration occupations (+23,900, +1.8%). Five broad occupational groups experienced a decline in employment, led by management occupations (-34,600, -3.9%).
Among broad occupational groups, sales and service occupations (+54,900) saw the largest increase in employment, followed by natural and applied sciences and related occupations (+44,800) and health occupations (+33,800). Occupations in five out of ten broad occupational groups experienced a decline in employment, led by management occupations (-34,600).
Regions
Employment change by region, Ontario, 2025
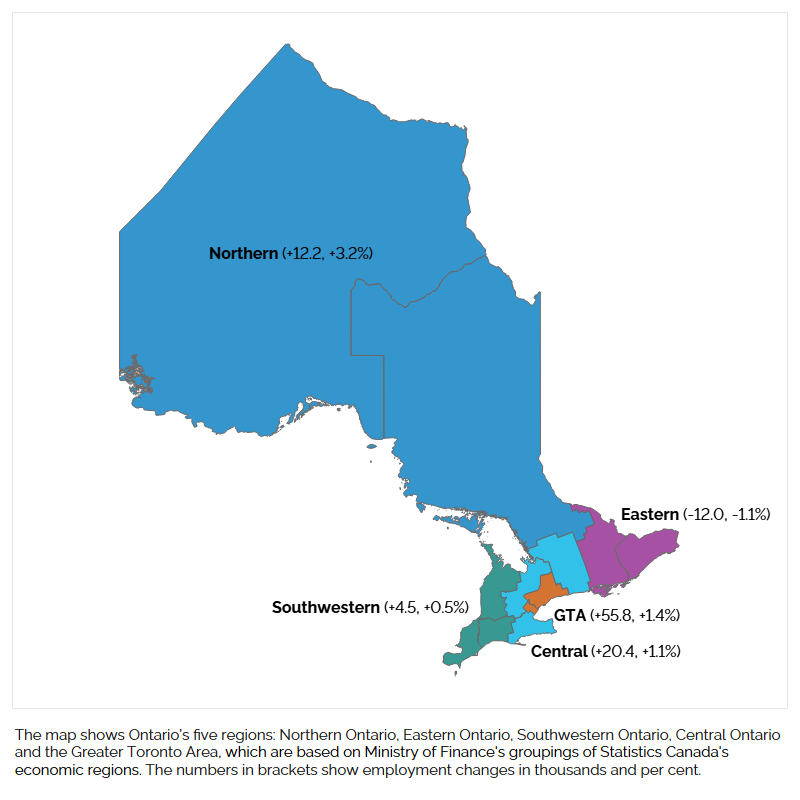
The map shows Ontario’s five regions: Northern Ontario, Eastern Ontario, Southwestern Ontario, Central Ontario and the Greater Toronto Area, which are based on Ministry of Finance's groupings of Statistics Canada's economic regions. The map shows changes in employment measured in thousands and percentages in each region. Employment increased in all Ontario regions in 2025, except Eastern Ontario (-12,000, -1.1%). The GTA led the increase (+55,800, +1.4%), followed by Central Ontario (+20,400, +1.1%), Northern Ontario (+12,200, +3.2%) and Southwestern Ontario (+4,500, +0.5%).
In 2025, all Ontario regions except Eastern Ontario experienced employment growth. The Greater Toronto Area (GTA) experienced the largest employment increase (+55,800); however, Northern Ontario experienced the highest percentage increase in employment (+3.2%), followed by the GTA (+1.4%), Central Ontario (+1.1%) and Southwestern Ontario (+0.5%). Eastern Ontario recorded an employment decline of 12,000 (-1.1%).
Unemployment rate by region, Ontario, 2025
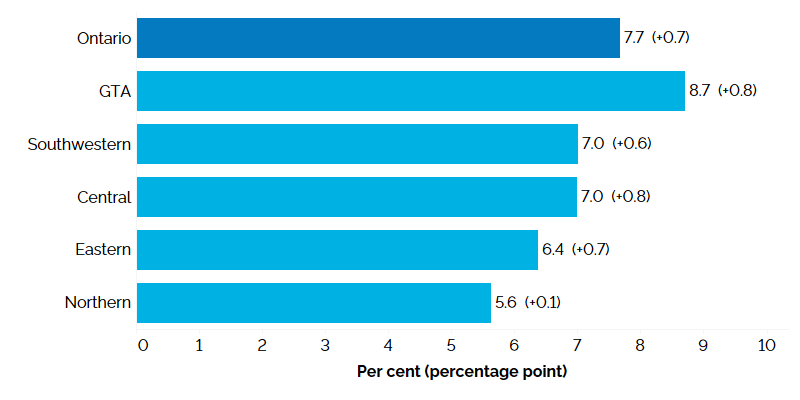
The horizontal bar chart shows unemployment rates by Ontario region in 2025, measured in per cent with annual percentage point changes in brackets. The Greater Toronto Area had the highest unemployment rate at 8.7% (+0.8 percentage point), followed by Southwestern Ontario (7.0%, +0.6 percentage point), Central Ontario (7.0%, +0.8 percentage point), Eastern Ontario (6.4%, +0.7 percentage point) and Northern Ontario (5.6%, +0.1 percentage point). Ontario’s unemployment rate in 2025 was 7.7% (+0.7 percentage point).
In 2025, the unemployment rate increased in every region, with the GTA and Central Ontario recording the largest increases (+0.8 percentage point each). The GTA had the highest unemployment rate at 8.7%, while Northern Ontario had the lowest unemployment rate at 5.6%.
Participation rate by region, Ontario, 2025
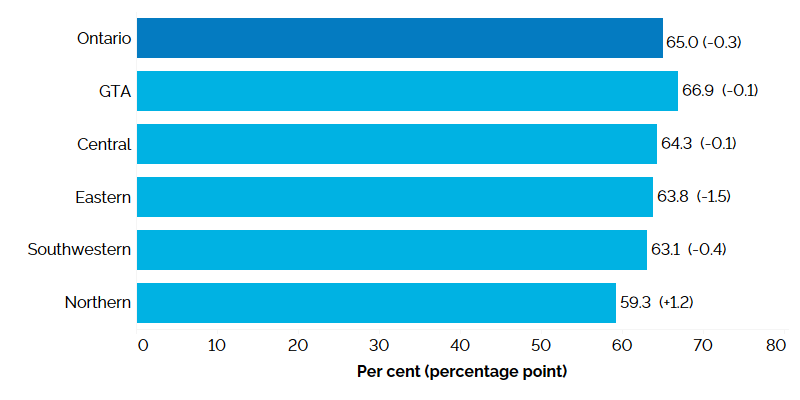
The horizontal bar chart shows participation rates by Ontario region in 2025, measured in per cent with annual percentage point changes in brackets. The Greater Toronto Area had the highest participation rate at 66.9% (-0.1 percentage point), followed by Central Ontario (64.3%, -0.1 percentage point), Eastern Ontario (63.8%, -1.5 percentage points), Southwestern Ontario (63.1%, -0.4 percentage point) and Northern Ontario (59.3%, +1.2 percentage points). The overall participation rate for Ontario was 65.0% (-0.3 percentage point).
In 2025, the participation rate declined across all Ontario regions except Northern Ontario. The GTA had the highest participation rate (66.9%), while Northern Ontario had the lowest participation rate (59.3%).
Demographic groups
Employment change by age group and gender, Ontario, 2025
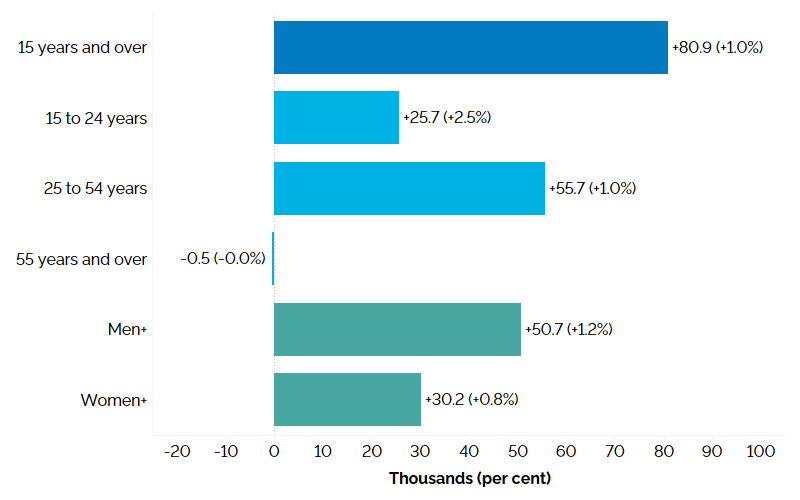
The horizontal bar chart shows Ontario’s annual employment change for three age groups, as well as by gender, compared to the overall population, measured in thousands with percentage changes in brackets. Employment increased for Ontarians aged 25 to 54 years (+55,700, +1.0%) and for those aged 15 to 24 years (+25,700, +2.5%), while it remained essentially unchanged for those 55 years and over (-500, -0.0%). Total employment (for the population aged 15 and over) increased by 80,900 (+1.0%). Men+ employment increased by 50,700 (+1.2%) and women+ employment increased by 30,200 (+0.8%).
In 2025, employment increased among core-aged workers aged 25 to 54 years (+55,700, +1.0%) and youth aged 15 to 24 years (+25,700, +2.5%) but remained essentially unchanged among older adults aged 55 years and over (-500, -0.0%). Employment increased among both men
Employment change by education level, core-aged workers, Ontario, 2025
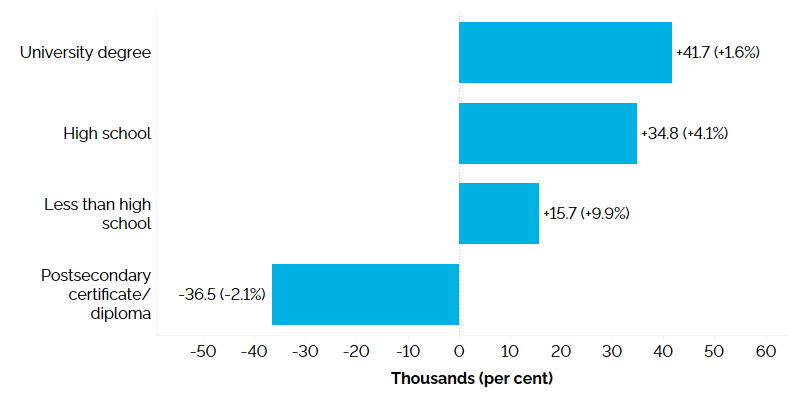
The horizontal bar chart shows Ontario’s annual employment change by education level for the core-aged population (25 to 54 years) in 2025, measured in thousands with percentage changes in brackets. Employment increased among workers with a university degree (+41,700, +1.6%), high school graduates (+34,800, +4.1%) and those with less than high school education (+15,700, +9.9%). Those with a postsecondary certificate or diploma experienced a decrease in employment (-36,500, -2.1%).
Among the core-aged population, employment increased for university graduates (+41,700, +1.6%), high school graduates (+34,800, +4.1%) and for those with less than high school education (+15,700, +9.9%) in 2025. Individuals with a postsecondary certificate or diploma experienced a decline in employment (-36,500, -2.1%).
These employment changes may have in part been influenced by demographic changes. Despite mixed employment level changes across educational groups, unemployment rates increased for all groups in 2025. University degree holders posted the lowest unemployment rate (5.8%, +0.5 percentage point), followed by those with a postsecondary certificate or diploma (6.1%, +0.9 percentage point), high school graduates (9.1%, +1.4 percentage point) and those with less than high school education (12.2%, +1.4 percentage point).
Employment change by immigrant status, core-aged workers, Ontario, 2025
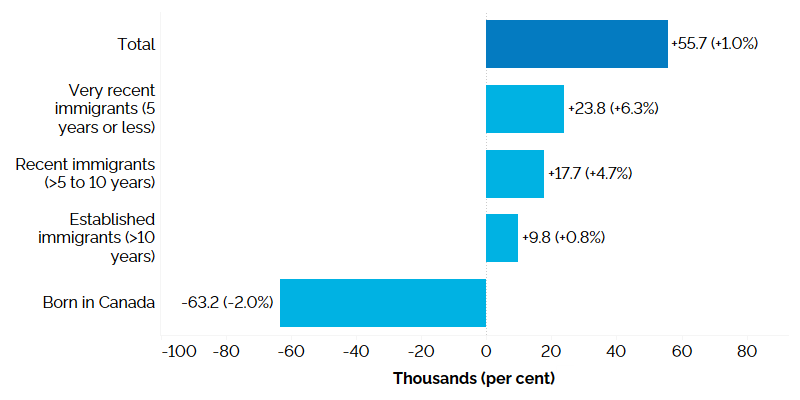
The horizontal bar chart shows Ontario’s annual employment change by immigrant status for the core-aged population (25 to 54 years) in 2025, measured in thousands with percentage changes in brackets. Employment increased among landed immigrants, led by very recent immigrants who landed 5 years earlier or less (+23,800, +6.3%), followed by recent immigrants who landed between 5 and 10 years earlier (+17,700, +4.7%), and established immigrants who landed more than 10 years earlier (+9,800, +0.8%). Employment among those born in Canada declined (-63,200, -2.0%).
In 2025, employment increased among core-aged established immigrants, recent immigrants and very recent immigrants, but declined among those born in Canada. Core-aged very recent immigrants experienced the largest increase (+23,800, +6.3%), followed by recent immigrants (+17,700 +4.7%) and established immigrants (+9,800, +0.8%). On the other hand, core-aged workers born in Canada recorded a decline in employment (-63,200, -2.0%).
The Canadian born core-aged population continued to have the lowest unemployment rate at 5.6%, while very recent immigrants had the highest at 10.4%, followed by recent immigrants (7.7%) and established immigrants (6.8%). In 2025, the Canadian born population had the largest year-over-year increase in their unemployment rate (+1.0 percentage point), while very recent immigrants had the lowest (+0.3 percentage point).
Wages
Average hourly wages by employment status, Ontario, 1997-2025footnote 4
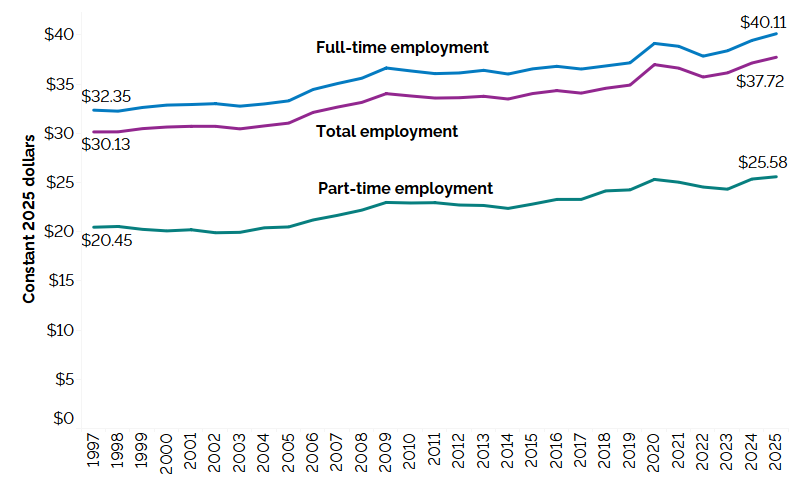
The line chart shows average hourly wages for all employees, full-time and part-time employees expressed in real 2025 dollars from 1997 to 2025. Real average hourly wages of all employees increased from $30.13 in 1997 to $37.72 in 2025; those of full-time employees increased from $32.35 in 1997 to $40.11 in 2025, while those of part-time employees increased from $20.45 in 1997 to $25.58 in 2025.
Over the last two and a half decades, the average hourly wage increased in real terms
Real hourly wage change by type of work, Ontario, 2025
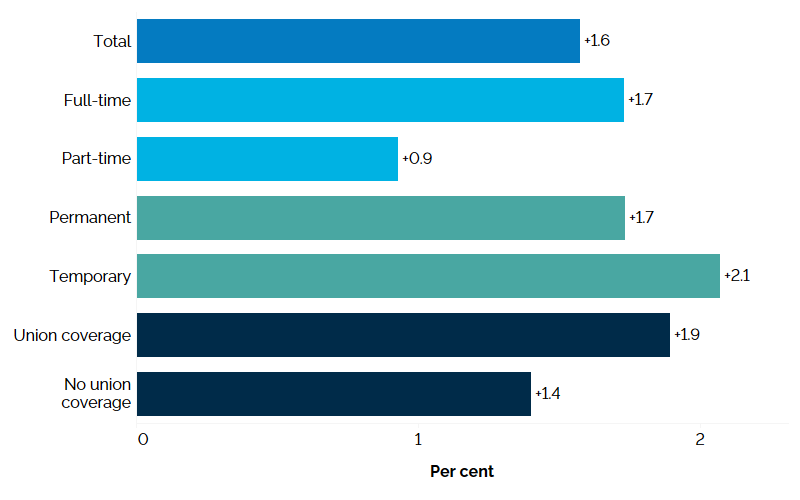
The horizontal bar chart shows the annual change in Ontario’s real hourly wages by type of work in 2025, measured in per cent. The average hourly wage increased by 1.6%. Real hourly wages increased for the following types of work: full-time (+1.7%); part-time (+0.9%); permanent (+1.7%); temporary (+2.1%); union coverage (1.9%); and no union coverage (+1.4%).
In 2025, the average hourly wage of Ontario employees was $37.72 per hour, an increase of 3.5% or 1.6% in real terms (after accounting for inflation of 1.9%)
Real average hourly wages increased by 1.7% for full-time employees and 0.9% for part-time employees in 2025. Real hourly wages increased by 1.7% for permanent employees and 2.1% for temporary employees. Real hourly wages of unionized employees increased by 1.9%, and 1.4% for non-unionized employees.
Average hourly wage by occupational group, Ontario, 2025
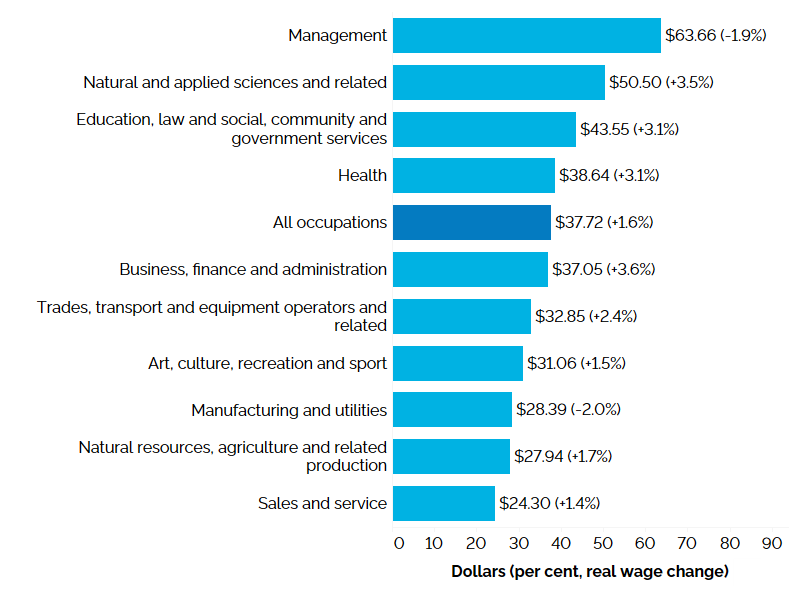
The horizontal bar chart shows average hourly wage rates in 2025, measured in dollars with per cent growth in real wages in brackets, by occupational group. In 2025, the average hourly wage rate for Ontario was $37.72 (+1.6%). The highest average hourly wage rate was for management occupations at $63.66 (-1.9%); followed by natural and applied sciences and related occupations at $50.50 (+3.5%); and occupations in education, law and social, community and government services at $43.55 (+3.1%). The lowest average hourly wage rate was for sales and service occupations at $24.30 (+1.4%).
In 2025, employees in management occupations had the highest average hourly wage ($63.66), followed by natural and applied sciences and related occupations ($50.50) and occupations in education, law and social, community and government services ($43.55). Employees in sales and service occupations had the lowest average hourly wage ($24.30).
Business, finance and administration occupations recorded the largest annual increase in real average hourly wages (+3.6%), followed by natural and applied sciences and related occupations (+3.5%), health occupations (+3.1%) and occupations in education, law and social, community and government services (+3.1%). On the other hand, occupations in manufacturing and utilities (-2.0%) and management occupations (-1.9%) were the only occupational groups to record a decline in real average hourly wage rates.
Hours Worked
Total weekly hours worked, Ontario, 1976-2025
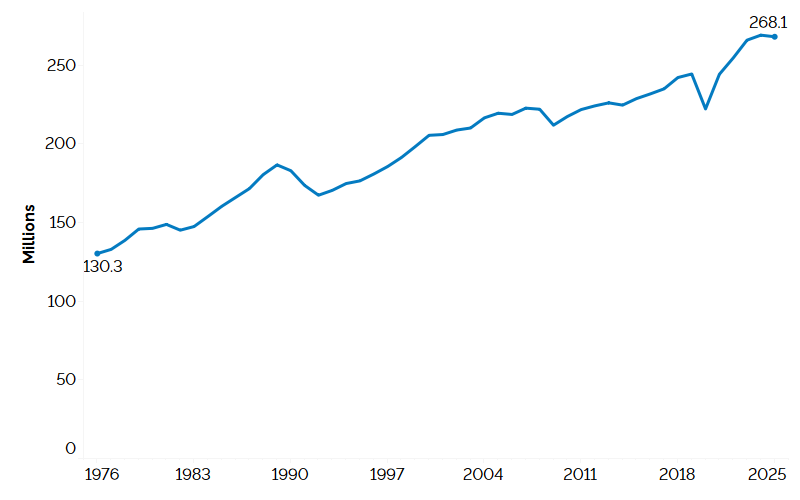
The line chart shows Ontario’s total weekly hours worked from 1976 through 2025, measured in millions of hours. Ontario’s total weekly hours have risen steadily since 1976 with a few exceptions before the 2000s and when hours worked declined in 2008, 2009, 2014, 2020 and 2025. The decrease in total weekly hours worked from 2019 to 2020 was sharper compared to previous declines. Total weekly hours increased from 130.3 million weekly hours in 1976 to 268.1 million hours in 2025.
In 2025, total weekly hours worked
Unemployment
Unemployment rate by province, 2025
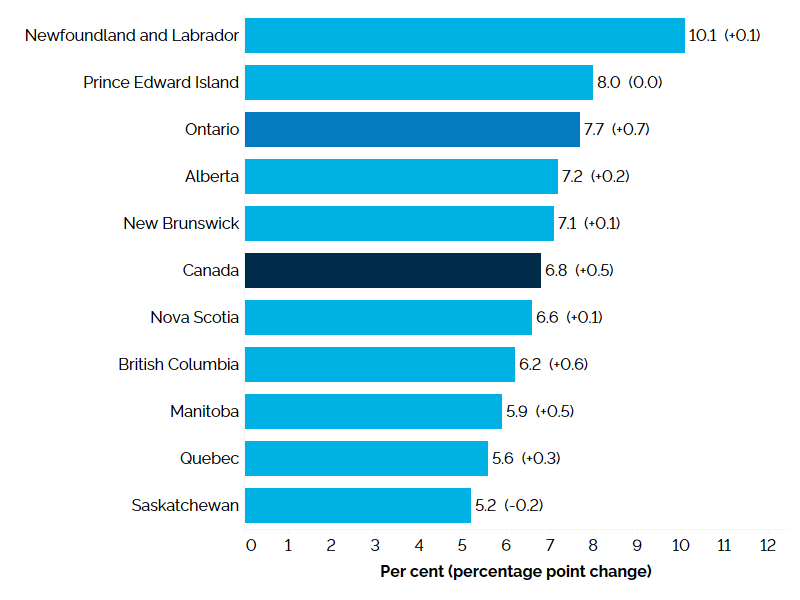
The horizontal bar chart shows unemployment rate by province in 2025, measured in percent with annual percentage point changes in brackets. The national unemployment rate was 6.8% (+0.5 percentage point). Newfoundland and Labrador had the highest unemployment rate at 10.1% (+0.1 percentage point), followed by Prince Edward Island at 8.0% (unchanged), and Ontario at 7.7% (+0.7 percentage point). Saskatchewan had the lowest unemployment rate at 5.2% (-0.2 percentage point).
In 2025, eight provinces experienced an increase in their unemployment rate, while Prince Edward Island’s unemployment rate remained the same and Saskatchewan experienced a decrease. Ontario had the third highest unemployment rate among the ten provinces at 7.7%, and the largest unemployment rate increase (+0.7 percentage point) compared to 2024. Ontario’s unemployment rate was 0.9 percentage point above the Canadian rate of 6.8%. Saskatchewan had the lowest unemployment rate (5.2%), and Newfoundland and Labrador had the highest (10.1%).
Unemployment rate by age group, Ontario, 1976-2025
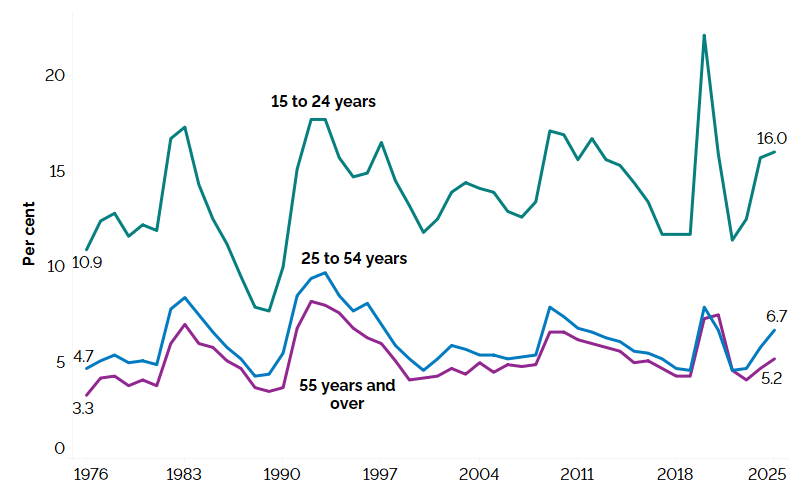
The line chart shows unemployment rates for three groups: youth (15 to 24 years), the core-aged population (25 to 54 years) and the older population (55 years and older) from 1976 to 2025. Compared to 2024, the unemployment rate increased for all age groups with youth reaching 16.0% in 2025, the core-aged population reaching 6.7%, and the older population reaching 5.2%. The unemployment rate of youth has historically been higher than those of the core-aged and older populations.
In 2025, the unemployment rate increased the most for the core-aged population aged 25 to 54 years (+0.9 percentage point), followed by the older population aged 55 years and over (+0.5 percentage point) and youth aged 15 to 24 years (+0.3 percentage point). Youth had the highest unemployment rate (16.0%), followed by the core-aged population (6.7%) and older population (5.2%).
Share of long-term unemployment, Ontario, 1976-2025
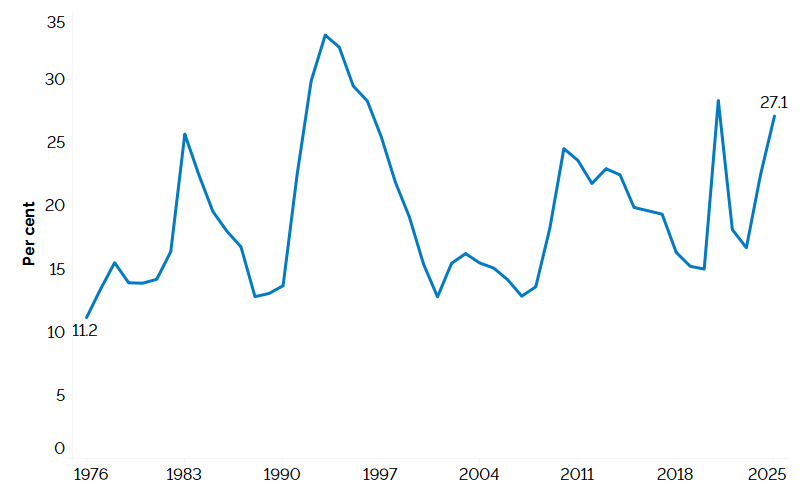
The line chart shows the share of those experiencing long-term unemployment (unemployed for 27 weeks or more) as a share of total unemployment from 1976 to 2025, measured in per cent. The share has fluctuated over this time frame. It was 11.2% in 1976, with increased growth during the periods of the early 1990s, 2008, 2021 and most recently in 2025. In 2025, long-term unemployment as a share of total unemployment in Ontario was 27.1% (+4.7 percentage points).
In 2025, long-term unemployment (unemployed for 27 weeks or more) as a share of total unemployment increased to 27.1% (+4.7 percentage points). This marks the highest rate of long-term unemployment since 1996 (excluding the post-pandemic peak of 28.3% in 2021).
The average duration of unemployment in 2025 (24.9 weeks) was the longest recorded since 1997.
Participation rates
Participation rate by province, 2025
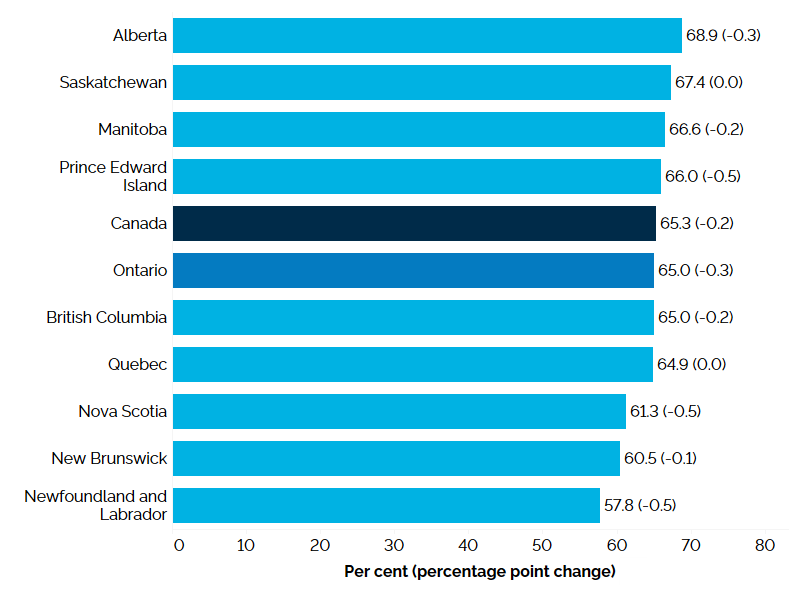
The horizontal bar chart shows the participation rate by province in 2025, measured in per cent with percentage point change from the previous year in brackets. Alberta had the highest participation rate at 68.9% (-0.3 percentage point), followed by Saskatchewan at 67.4% (0.0 percentage point), and Manitoba at 66.6% (-0.2 percentage point). Newfoundland and Labrador had the lowest participation rate at 57.8% (-0.5 percentage point). Ontario had the fifth highest participation rate at 65.0% (-0.3 percentage point), slightly below the national rate of 65.3% (-0.2 percentage point).
In 2025, Ontario’s participation rate for people aged 15 years and over was 65.0%, a decrease of 0.3 percentage point compared to 2024. Although the labour force increased (+1.2%), it did not keep pace with the LFS population growth (+2.1%). The participation rate in Ontario was slightly below the Canadian average (65.3%) and ranked fifth out of the ten provinces. Ontario was one of the eight provinces that experienced a decline in its participation rate in 2025, while the remaining two provinces’ participation rates remained the same.
Ontario’s participation rate has declined since 2003, in part due to an aging population.
In 2025, there were 191,200 people who wanted work but were not part of the labour force
Participation rate by gender, Ontario, 1976-2025
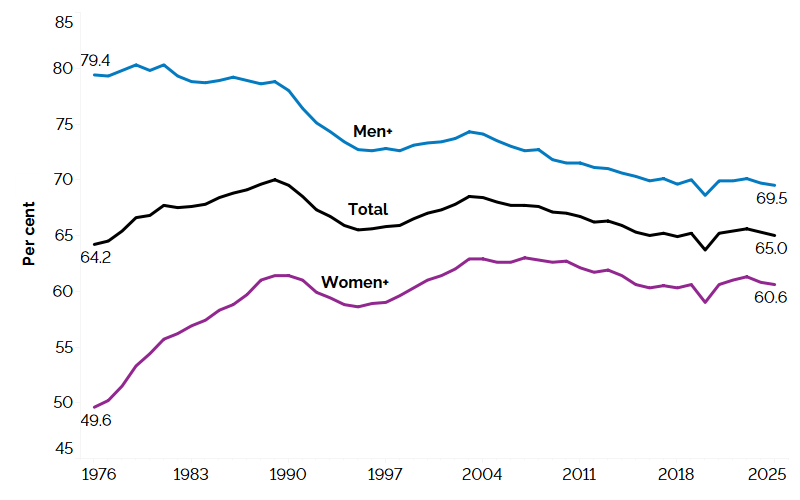
The line chart shows participation rates for the total population, males, and females from 1976 to 2025, measured in per cent. The participation rate of males has historically been higher than that of females. The participation rate of males declined from 79.4% in 1976 to 69.5% in 2025, slightly below the 2024 rate. The participation rate of the total population increased from 64.2% in 1976 to 65.0% in 2025, slightly below the 2024 rate. The participation rate of females increased from 49.6% in 1976 to 60.6% in 2025, also slightly below the 2024 rate.
In 2025, the participation rate for men declined by 0.2 percentage point to 69.5%, while the rate for women also decreased by 0.2 percentage point to 60.6%. Excluding 2020 (the onset of the pandemic), the participation rate of men in 2025 reached its lowest rate on record.
Participation rate by age group, Ontario, 1976-2025
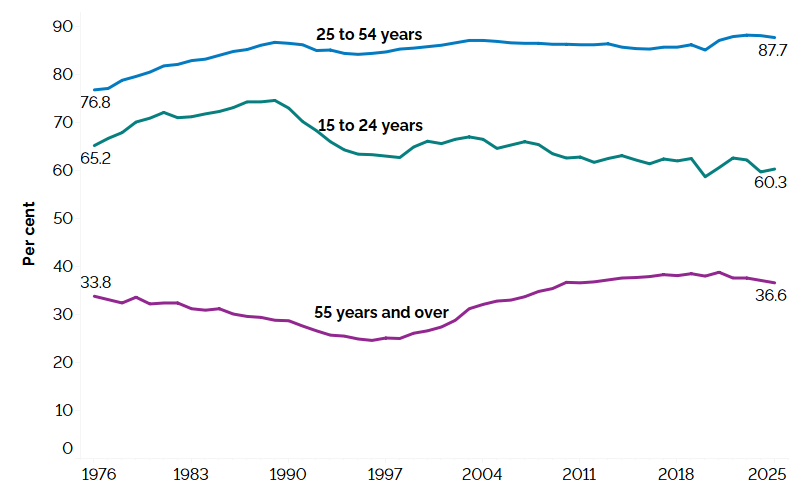
The line chart shows the participation rate for the three age groups: youth (15 to 24 years), the core-aged population (25 to 54 years) and the older population (55 years and older) from 1976 to 2025, measured in per cent. The participation rate of the core-aged population increased from 76.8% in 1976 to 87.7% in 2025. The participation rate of youth decreased from 65.2% in 1976 to 60.3% in 2025. The participation rate of the older population increased from 33.8% in 1976 to 36.6% in 2025.
In 2025, the participation rate of the core-aged population declined by 0.4 percentage point to 87.7%. Youth experienced an increase in their participation rate of 0.6 percentage point to 60.3%, following a record low of 59.7% in 2024 (excluding the pandemic low in 2020). The participation rate for the older population declined by 0.5 percentage point to 36.6%.
Methodological note
In this report, year-over-year change represents change between 2024 and 2025. Longer-term trends are included for select labour market characteristics to provide historical context.
All estimates in the report are based on Statistics Canada’s Labour Force Survey (LFS), which measures the current state of the national, provincial and territorial labour market. The LFS is based on a household survey carried out monthly by Statistics Canada in reference weeks of the month. All estimates in this report include the population aged 15 years and over, unless otherwise indicated.
Starting with the 2025 revisions, LFS estimates incorporate the concept of gender, which was introduced in the 2021 Census of Population and added to the LFS questionnaire in January 2022. Estimates prior to 2022 are based on sex of person, while those from 2022 onward are based on gender of person. Although gender and sex at birth are two different concepts, this change does not cause a significant break in the trend because the two concepts produce very similar distributions. All data products from the LFS now adopt the term “gender” for all years and periods.
Given that the non-binary population is small, individuals in the category “non-binary persons” are distributed into the other two gender categories and are denoted by the “+” symbol. The category “Men+” includes men, as well as some non-binary persons, while the category “Women+” includes women, as well as some non-binary persons.
Appendix
10-year overview of annual employment
| 2016 | 2017 | 2018 | 2019 | 2020 | 2021 | 2022 | 2023 | 2024 | 2025 | |
|---|---|---|---|---|---|---|---|---|---|---|
| Total Labour Force (000) | 7,422.0 | 7,568.3 | 7,674.2 | 7,848.0 | 7,805.6 | 8,060.1 | 8,221.5 | 8,483.8 | 8,754.7 | 8,911.0 |
| Participation Rate (%) | 65.0 | 65.2 | 64.9 | 65.2 | 63.7 | 65.2 | 65.4 | 65.6 | 65.3 | 65.0 |
| Men+ Participation Rate (%) | 69.9 | 70.1 | 69.6 | 70.0 | 68.6 | 69.9 | 69.9 | 70.1 | 69.7 | 69.5 |
| Women+ Participation Rate (%) | 60.3 | 60.5 | 60.3 | 60.6 | 59.0 | 60.6 | 61.0 | 61.3 | 60.8 | 60.6 |
| Total Employment (000) | 6,934.5 | 7,109.2 | 7,240.4 | 7,412.9 | 7,043.4 | 7,404.8 | 7,764.1 | 8,006.1 | 8,146.1 | 8,227.0 |
| Full-time (000) | 5,611.6 | 5,735.1 | 5,883.8 | 6,036.8 | 5,821.7 | 6,111.0 | 6,411.1 | 6,632.4 | 6,711.0 | 6,751.6 |
| Part-time (000) | 1,323.0 | 1,374.1 | 1,356.6 | 1,376.1 | 1,221.7 | 1,293.8 | 1,353.0 | 1,373.8 | 1,435.1 | 1,475.4 |
| Employment-Population Ratio (%) | 60.7 | 61.2 | 61.2 | 61.6 | 57.5 | 59.9 | 61.8 | 62.0 | 60.7 | 60.0 |
| Men+ Employment (000) | 3,640.5 | 3,736.2 | 3,813.6 | 3,901.2 | 3,738.2 | 3,910.2 | 4,094.1 | 4,230.2 | 4,298.2 | 4,348.9 |
| Women+ Employment (000) | 3,294.0 | 3,373.0 | 3,426.8 | 3,511.6 | 3,305.3 | 3,494.6 | 3,670.0 | 3,776.0 | 3,847.9 | 3,878.1 |
| Part-Time (% of total) | 19.1 | 19.3 | 18.7 | 18.6 | 17.3 | 17.5 | 17.4 | 17.2 | 17.6 | 17.9 |
| Goods-Producing Sector Employment (000) | 1,435.6 | 1,463.5 | 1,482.3 | 1,476.3 | 1,423.5 | 1,480.9 | 1,558.9 | 1,619.0 | 1,583.5 | 1,575.5 |
| Services-Producing Sector Employment (000) | 5,499.0 | 5,645.7 | 5,758.1 | 5,936.5 | 5,620.0 | 5,923.9 | 6,205.2 | 6,387.2 | 6,562.6 | 6,651.4 |
| Private Sector Employment (000) | 4,621.6 | 4,749.2 | 4,818.7 | 4,931.6 | 4,614.0 | 4,876.3 | 5,153.1 | 5,367.3 | 5,421.7 | 5,499.0 |
| Public Sector Employment (000) | 1,262.9 | 1,278.7 | 1,311.6 | 1,343.2 | 1,332.0 | 1,441.0 | 1,540.9 | 1,570.1 | 1,622.2 | 1,620.9 |
| Self-Employment (%of total) | 15.1 | 15.2 | 15.3 | 15.4 | 15.6 | 14.7 | 13.8 | 13.3 | 13.5 | 13.5 |
| Total Unemployment (000) | 487.5 | 459.1 | 433.8 | 435.1 | 762.1 | 655.3 | 457.4 | 477.7 | 608.6 | 684.0 |
| Unemployment Rate (%) | 6.6 | 6.1 | 5.7 | 5.5 | 9.8 | 8.1 | 5.6 | 5.6 | 7.0 | 7.7 |
| Men+ Unemployment Rate (%) | 6.8 | 6.3 | 5.6 | 5.7 | 9.6 | 8.1 | 5.5 | 5.5 | 7.3 | 7.9 |
| Women+ Unemployment Rate (%) | 6.3 | 5.8 | 5.7 | 5.4 | 10.0 | 8.2 | 5.7 | 5.8 | 6.5 | 7.4 |
| Long-Term (27 wks+) (% of total) | 19.6 | 19.3 | 16.3 | 15.2 | 15.0 | 28.3 | 18.1 | 16.7 | 22.4 | 27.1 |
| Average Unemployment in Weeks | 19.8 | 19.1 | 17.2 | 16.0 | 15.4 | 23.0 | 19.7 | 17.6 | 20.9 | 24.9 |
| Youth Unemployment Rate (%) | 13.4 | 11.7 | 11.7 | 11.7 | 22.1 | 15.9 | 11.4 | 12.5 | 15.7 | 16.0 |
| 25-54 y.o. Unemployment rate (%) | 5.5 | 5.2 | 4.7 | 4.6 | 7.9 | 6.7 | 4.6 | 4.7 | 5.8 | 6.7 |
| 55+ y.o. Unemployment rate (%) | 5.1 | 4.7 | 4.3 | 4.3 | 7.3 | 7.5 | 4.6 | 4.1 | 4.7 | 5.2 |
| Average Weekly Wage Rate ($) | 984.76 | 992.85 | 1,030.78 | 1,059.89 | 1,138.00 | 1,164.85 | 1,218.08 | 1,279.16 | 1,339.01 | 1,381.64 |
| Average Hourly Wage Rate ($) | 26.89 | 27.14 | 28.18 | 28.97 | 30.90 | 31.66 | 32.97 | 34.63 | 36.44 | 37.72 |
Employment by region (000)
| 2016 | 2017 | 2018 | 2019 | 2020 | 2021 | 2022 | 2023 | 2024 | 2025 | |
|---|---|---|---|---|---|---|---|---|---|---|
| Greater Toronto Area | 3,316.0 | 3,386.2 | 3,459.4 | 3,550.4 | 3,367.9 | 3,525.6 | 3,673.7 | 3,787.6 | 3,852.0 | 3,907.8 |
| Central | 1,587.7 | 1,666.3 | 1,675.1 | 1,707.9 | 1,627.2 | 1,713.4 | 1,815.6 | 1,879.5 | 1,901.0 | 1,921.4 |
| Southwest | 783.5 | 795.2 | 820.9 | 821.4 | 778.2 | 843.7 | 883.9 | 908.5 | 940.3 | 944.8 |
| East | 899.4 | 907.3 | 923.6 | 970.4 | 920.5 | 967.3 | 1,017.3 | 1,052.7 | 1,072.5 | 1,060.5 |
| North | 348.2 | 354.2 | 361.4 | 362.7 | 349.6 | 354.9 | 373.5 | 377.7 | 380.3 | 392.5 |
Unemployment rate by region (%)
| 2016 | 2017 | 2018 | 2019 | 2020 | 2021 | 2022 | 2023 | 2024 | 2025 | |
|---|---|---|---|---|---|---|---|---|---|---|
| Greater Toronto Area | 6.9 | 6.5 | 6.0 | 5.9 | 11.0 | 9.1 | 6.3 | 6.2 | 7.9 | 8.7 |
| Central | 5.9 | 5.3 | 5.3 | 5.2 | 9.0 | 7.5 | 5.0 | 5.2 | 6.2 | 7.0 |
| Southwest | 6.1 | 5.7 | 5.3 | 5.4 | 9.2 | 7.5 | 5.5 | 5.6 | 6.4 | 7.0 |
| East | 6.5 | 5.9 | 4.9 | 5.0 | 7.7 | 6.5 | 4.4 | 4.6 | 5.7 | 6.4 |
| North | 7.4 | 6.5 | 6.1 | 6.0 | 8.0 | 6.8 | 4.6 | 5.2 | 5.5 | 5.6 |
Total employment by CMA (000)
Greater Toronto Area
| 2016 | 2017 | 2018 | 2019 | 2020 | 2021 | 2022 | 2023 | 2024 | 2025 | |
|---|---|---|---|---|---|---|---|---|---|---|
| Toronto | 3,145.1 | 3,223.9 | 3,284.6 | 3,380.3 | 3,198.5 | 3,353.6 | 3,498.2 | 3,613.0 | 3,669.5 | 3,736.7 |
| Oshawa | 209.3 | 205.6 | 214.4 | 213.6 | 207.4 | 215.1 | 233.8 | 235.6 | 242.3 | 249.7 |
Central Ontario
| 2016 | 2017 | 2018 | 2019 | 2020 | 2021 | 2022 | 2023 | 2024 | 2025 | |
|---|---|---|---|---|---|---|---|---|---|---|
| Hamilton | 379.9 | 411.5 | 407.9 | 416.5 | 390.4 | 417.9 | 427.7 | 424.9 | 433.3 | 442.2 |
| Kitchener-Cambridge-Waterloo | 292.3 | 303.8 | 311.9 | 322.2 | 304.5 | 322.5 | 338.7 | 358.0 | 381.4 | 389.1 |
| St. Catharines-Niagara | 205.8 | 204.8 | 210.6 | 209.3 | 192.5 | 203.0 | 228.4 | 233.1 | 233.5 | 239.3 |
| Peterborough | 58.4 | 61.8 | 65.0 | 62.3 | 53.1 | 62.6 | 66.0 | 67.9 | 66.8 | 70.8 |
| Brantford | 70.1 | 72.7 | 70.7 | 79.3 | 73.4 | 76.8 | 81.8 | 84.3 | 85.2 | 87.2 |
| Guelph | 90.9 | 91.5 | 89.7 | 92.4 | 86.8 | 95.0 | 99.6 | 103.6 | 103.0 | 97.5 |
| Barrie | 102.5 | 114.2 | 111.8 | 117.2 | 119.2 | 117.1 | 128.1 | 136.1 | 132.3 | 130.2 |
Eastern Ontario
| 2016 | 2017 | 2018 | 2019 | 2020 | 2021 | 2022 | 2023 | 2024 | 2025 | |
|---|---|---|---|---|---|---|---|---|---|---|
| Ottawa-Gatineau (Ontario part) | 566.5 | 574.5 | 589.6 | 616.4 | 587.9 | 620.3 | 642.0 | 677.0 | 693.2 | 688.2 |
| Kingston | 80.4 | 85.6 | 84.9 | 85.9 | 81.9 | 82.7 | 89.2 | 93.3 | 93.3 | 94.9 |
| Belleville | 33.3 | 41.0 | 41.8 | 51.8 | 50.6 | 51.6 | 60.5 | 63.1 | 44.8 | 49.3 |
Southwestern Ontario
| 2016 | 2017 | 2018 | 2019 | 2020 | 2021 | 2022 | 2023 | 2024 | 2025 | |
|---|---|---|---|---|---|---|---|---|---|---|
| London | 244.9 | 248.2 | 258.5 | 256.4 | 259.1 | 283.7 | 300.5 | 315.5 | 321.5 | 328.1 |
| Windsor | 201.1 | 198.2 | 205.3 | 207.6 | 181.3 | 202.1 | 210.0 | 232.3 | 237.2 | 238.1 |
Northern Ontario
| 2016 | 2017 | 2018 | 2019 | 2020 | 2021 | 2022 | 2023 | 2024 | 2025 | |
|---|---|---|---|---|---|---|---|---|---|---|
| Greater Sudbury | 83.1 | 83.0 | 84.2 | 88.1 | 82.0 | 83.6 | 88.3 | 91.4 | 90.2 | 95.4 |
| Thunder Bay | 60.1 | 62.2 | 64.8 | 63.6 | 59.8 | 61.8 | 62.9 | 65.4 | 65.0 | 66.8 |
Note: All estimates in this appendix are based on Statistics Canada’s Labour Force Survey.
Footnotes
- footnote[1] Back to paragraph Public sector includes the federal, provincial, territorial and local general governments, health and social service institutions, universities, colleges, vocational and trade institutions, school boards, and government business enterprises.
- footnote[2] Back to paragraph Occupation estimates are based on the 2021 National Occupational Classification. Management occupations are classified under the management occupational category and the remaining categories exclude management occupations.
- footnote[3] Back to paragraph See Methodological note for information on gender collection and reporting.
- footnote[4] Back to paragraph Starting in 2006, enhancements to the Labour Force Survey processing system have introduced a level shift in average and median wages. Caution should be used when comparing estimates before and after 2006.
- footnote[5] Back to paragraph Real wages are based on nominal wages deflated by the Ontario Consumer Price Index (CPI) for all items. Self-employment is excluded.
- footnote[6] Back to paragraph Real wages are based on nominal wages deflated by the Ontario Consumer Price Index (CPI) for all items. Self-employment is excluded.
- footnote[7] Back to paragraph This is a 12-month average of the total number of hours actually worked by all employed persons in all jobs in the Labour Force Survey reference weeks.
- footnote[8] Back to paragraph Despite wanting to work, some people might not look for a job due to reasons like illness, personal/family responsibilities, school, awaiting recall/reply, discouraged, and other factors.