2023-24 Third Quarter Finances
The Third Quarter Finances report contains information about Ontario’s 2023-24 fiscal outlook, primarily as of December 31, 2023.
Highlights
- Ontario’s real gross domestic product (GDP) was unchanged in the third quarter (July, August and September) of 2023, after increasing 0.4 per cent in the second quarter.
- Since the 2023 Ontario Economic Outlook and Fiscal Review (also referred to as the Fall Economic Statement, or FES), estimated Ontario real and nominal GDP growth in 2023 has been revised upwards, while the private-sector average projection for real and nominal GDP growth in 2024 has been revised modestly downwards.
- As of the 2023–24 Third Quarter Finances, the province’s 2023–24 deficit is projected to be $4.5 billion — an improvement of $1.1 billion compared to the 2023 Ontario Economic Outlook and Fiscal Review. The improvement to the deficit is primarily due to increased revenue and lower interest on debt expense. The 2023 Budget, published in March 2023, projected a deficit of $1.3 billion.
- Revenues in 2023–24 are projected to be $202.7 billion, $1.6 billion lower than forecast in the 2023 Budget and $0.9 billion higher than expected in the 2023 Ontario Economic Outlook and Fiscal Review, mainly reflecting stronger-than-expected Broader Public Sector revenues, slightly higher taxation revenue and transfers from the Government of Canada.
- Overall program expense in 2023–24 is projected to be $193.4 billion, $2.8 billion higher than forecast in the 2023 Budget and $0.4 billion higher than forecast in the 2023 Ontario Economic Outlook and Fiscal Review. New commitments announced since the release of the 2023 Ontario Economic Outlook and Fiscal Review are primarily funded through third-party revenues, lower-than-expected spending and existing contingencies within the fiscal plan.
Introduction
Ontario experienced strong employment growth and a low unemployment rate in 2023. However, Ontario’s labour market and real GDP growth have eased recently as the Bank of Canada’s high interest rates weigh on the economy. While there has been an easing of inflationary pressure, the future path of consumer price inflation and the persistence of high interest rates continue to be a key risk to the economic outlook. Despite these challenges, Ontario’s economy is expected to see continued growth in 2024.
The 2023–24 Third Quarter Finances outlook projects a deficit of $4.5 billion, an improvement of $1.1 billion compared to the 2023 Ontario Economic Outlook and Fiscal Review.
The government's next economic and fiscal update, including the province's final projection for 2023–24, will be released by March 31, 2024 as part of the 2024 Budget.
Section A: Ontario’s 2023–24 Fiscal Outlook
Ontario’s 2023–24 deficit is projected to be $4.5 billion — an improvement of $1.1 billion from the outlook published in the 2023 Ontario Economic Outlook and Fiscal Review. Changes since the 2023 Ontario Economic Outlook and Fiscal Review are primarily due to increased revenues and decreased interest on debt expense. The 2023 Budget, published in March 2023, projected a deficit of $1.3 billion.
Revenues in 2023–24 are projected to be $1.6 billion lower than forecast in the 2023 Budget and $0.9 billion higher than expected in the 2023 Ontario Economic Outlook and Fiscal Review. Increases in revenues since the 2023 Ontario Economic Outlook and Fiscal Review mainly reflect stronger-than-expected Broader Public Sector revenues, slightly higher taxation revenue and transfers from the Government of Canada.
Overall program expense in 2023–24 is projected to be $2.8 billion higher than the forecast in the 2023 Budget, and $0.4 billion higher than the 2023 Ontario Economic Outlook and Fiscal Review. Increases in program expense since the 2023 Ontario Economic Outlook and Fiscal Review are primarily due to expense commitments for the health sector and support for the City of Toronto. New commitments announced since the release of the 2023 Ontario Economic Outlook and Fiscal Review are primarily funded through third-party revenues, lower-than-expected spending and existing contingencies within the fiscal plan.
Interest on debt expense in 2023–24 is projected to be $12.9 billion, approximately $1.2 billion lower than the $14.1 billion forecast in the 2023 Budget and $0.6 billion lower than the $13.4 billion projection in the 2023 Ontario Economic Outlook and Fiscal Review, due to lower-than-projected borrowing costs and a reduced interest rate forecast.
At the time of the 2023–24 Third Quarter Finances, the net debt-to-GDP ratio is projected to be 38.0 per cent in 2023–24, 0.2 percentage points higher than the 37.8 per cent forecast in the 2023 Budget and 0.4 percentage points lower than the 38.4 per cent forecast in the 2023 Ontario Economic Outlook and Fiscal Review.
The 2023 Budget included a $1.0 billion reserve in 2023–24 to protect the fiscal outlook against any unforeseen changes in the province’s revenue and expense forecasts. The $1.0 billion reserve has been maintained as part of the current fiscal outlook. The reserve provides additional prudence in the government’s fiscal framework and is distinct from contingency funds that set aside dedicated funding to be allocated in response to emerging needs. If not needed, the reserve is eliminated at year‐end as part of the final projection for 2023–24 published in the 2024 Budget.
| Item | 2023 Budget | Current Outlook | In-Year Change |
|---|---|---|---|
| Revenue | 204,367 | 202,744 | (1,623) |
| Expense — Programs | 190,622 | 193,388 | 2,767 |
| Expense — Interest on Debt | 14,058 | 12,889 | (1,169) |
| Total Expense | 204,680 | 206,277 | 1,598 |
| Surplus/(Deficit) Before Reserve | (313) | (3,534) | (3,221) |
| Reserve | 1,000 | 1,000 | – |
| Surplus/(Deficit) | (1,313) | (4,534) | (3,221) |
Notes: Numbers may not add due to rounding. Current outlook primarily reflects information available as of December 31, 2023, as well as other currently available key updates to the fiscal plan.
Sources: Ontario Treasury Board Secretariat and Ontario Ministry of Finance.
Revenue
The outlook for revenue in 2023–24 is projected to be $202.7 billion, a decrease of $1.6 billion compared to the 2023 Budget and $0.9 billion higher than the 2023 Ontario Economic Outlook and Fiscal Review.
The forecast for Total Taxation Revenue increased by a modest $0.1 billion, compared to the 2023 Ontario Economic Outlook and Fiscal Review, but there have been significant updates in key taxation revenue sources. Key changes in the taxation revenue outlook, compared to the 2023 Ontario Economic and Fiscal Review, include:
- Personal Income Tax revenue projections increased by $2.5 billion, mainly due to higher‐than‐expected revenues from the processing of 2022 and prior-year tax returns by the Canada Revenue Agency;
- Sales Tax revenue projections increased by $2.0 billion, mostly due to the impact of revised federal official entitlements for Harmonized Sales Tax for prior years;
- Ontario Health Premium revenue projections increased by $124 million, mainly due to higher‐than‐expected revenues from the processing of 2022 and prior-year tax returns by the Canada Revenue Agency;
- Employer Health Tax revenue projections increased by $89 million, mainly due to updated information from tax receipts in 2023–24;
- Land Transfer Tax revenue projections decreased by $119 million, reflecting weaker-than-expected activity in the housing market;
- Gasoline and Fuel Taxes revenue projections combined decreased by $265 million, mainly due to updated information from tax receipts in 2023–24;
- Corporations Tax revenue projections decreased by $4.2 billion, mainly due to lower‐than‐expected revenues from the processing of 2022 and prior-year tax returns by the Canada Revenue Agency; and
- Projections for revenue from All Other Taxes combined increased by $28 million, mainly due to Beer, Wine and Spirits Taxes, the Education Property Tax and the Ontario Portion of the Federal Cannabis Excise Duty.
Government of Canada Transfers projections have increased by $71 million, mainly due to higher Canada Health Transfer and Canada Social Transfer payments resulting from an increase in Ontario’s share of the national population.
Net income from Government Business Enterprises projections increased by $7 million, mainly due to higher net income from the LCBO, reflecting lower expenses, and higher iGaming revenue, reflecting growth in the market and the number of operators. This increase is partially offset by lower revenue from the Ontario Lottery and Gaming Corporation, mainly reflecting lower consumer spending.
Other Non-Tax Revenue projections combined increased by $743 million, due to higher third-party revenues in colleges.
| Item | 2023–24 |
|---|---|
| 2023 Budget Total Revenue Outlook | 204,367 |
| Revenue Changes in the 2023–24 First Quarter Finances | 0.2 |
| Revenue Changes in the 2023 Ontario Economic Outlook and Fiscal Review | (2,566) |
| Revenue Changes Since the 2023 Ontario Economic Outlook and Fiscal Review — Personal Income Tax | 2,481 |
| Revenue Changes Since the 2023 Ontario Economic Outlook and Fiscal Review — Sales Tax | 2,032 |
| Revenue Changes Since the 2023 Ontario Economic Outlook and Fiscal Review — Ontario Health Premium | 124 |
| Revenue Changes Since the 2023 Ontario Economic Outlook and Fiscal Review — Employer Health Tax | 89 |
| Revenue Changes Since the 2023 Ontario Economic Outlook and Fiscal Review — Land Transfer Tax | (119) |
| Revenue Changes Since the 2023 Ontario Economic Outlook and Fiscal Review — Gasoline and Fuel Taxes | (265) |
| Revenue Changes Since the 2023 Ontario Economic Outlook and Fiscal Review — Corporations Tax | (4,249) |
| Revenue Changes Since the 2023 Ontario Economic Outlook and Fiscal Review — All Other Taxes | 28 |
| Total Taxation Revenue | 121 |
| Government of Canada Transfers | 71 |
| Government Business Enterprises | 7 |
| Other Non-Tax Revenue | 743 |
| Total Revenue Changes Since the 2023 Ontario Economic Outlook and Fiscal Review | 942 |
| Total Revenue Changes Since the 2023 Budget | (1,623) |
| 2023–24 Third Quarter Finances Total Revenue Outlook | 202,744 |
Notes: Numbers may not add due to rounding. Current outlook primarily reflects information available as of December 31, 2023, as well as other currently available key updates to the fiscal plan.
Source: Ontario Ministry of Finance.
Additional developments could materially affect the 2023–24 revenue outlook as new information becomes available during and well after the end of the 2023–24 fiscal year. These include changes to the economic growth outlook, the results from 2023 tax return processing, revenue collections from Ontario‐administered taxes and the earnings of government business enterprises. The government will monitor these developments and provide further details in future fiscal updates.
Expense
Total expense is projected to be $206.3 billion, $1.6 billion higher than the 2023 Budget projection and $0.1 billion lower than the projection at the time of the 2023 Ontario Economic Outlook and Fiscal Review. Changes to expense since the release of the 2023 Ontario Economic Outlook and Fiscal Review are largely driven by health sector spending, support for the City of Toronto, a consolidation adjustment in the college sector and lower interest on debt expense. Additional expenses are primarily offset through third-party revenues, lower-than-expected spending and existing contingencies within the fiscal plan.
| Item | 2023–24 |
|---|---|
| 2023 Budget Total Expense Outlook | 204,680 |
| Total Expense Changes in the 2023–24 First Quarter Finances | 0.2 |
| Total Expense Changes in the 2023 Ontario Economic Outlook and Fiscal Review | 1,734 |
| Total Program Expense Changes Since the 2023 Ontario Economic Outlook and Fiscal Review — Heath Sector Supports | 1,711 |
| Total Program Expense Changes Since the 2023 Ontario Economic Outlook and Fiscal Review — New Deal for Toronto | 704 |
| Total Program Expense Changes Since the 2023 Ontario Economic Outlook and Fiscal Review — College Sector | 583 |
| Total Program Expense Changes Since the 2023 Ontario Economic Outlook and Fiscal Review — Support for Emergency Firefighting | 81 |
| Total Program Expense Changes Since the 2023 Ontario Economic Outlook and Fiscal Review — Ontario Anti-Hate Security and Prevention Grant | 21 |
| Total Program Expense Changes Since the 2023 Ontario Economic Outlook and Fiscal Review — Broadband and Cellular Infrastructure Forecast Updates | (451) |
| All Other Changes | (100) |
| Total Program Expense Changes Since the 2023 Ontario Economic Outlook and Fiscal Review | 2,549 |
| Net Drawdown of the Contingency Fund | (2,125) |
| Total Net Program Expense Changes Since the 2023 Ontario Economic Outlook and Fiscal Review | 424 |
| Interest on Debt Change Since the 2023 Ontario Economic Outlook and Fiscal Review | (560) |
| Total Expense Changes Since the 2023 Ontario Economic Outlook and Fiscal Review | (136) |
| Total Expense Changes Since the 2023 Budget | 1,598 |
| 2023–24 Third Quarter Finances Total Expense Outlook | 206,277 |
Notes: Numbers may not add due to rounding. Current outlook primarily reflects information available as of December 31, 2023, as well as other currently available key updates to the fiscal plan.
Sources: Ontario Treasury Board Secretariat and Ontario Ministry of Finance.
Program Expense Update
Total program expense in 2023–24 is projected to be $193.4 billion, $2.8 billion higher than forecast in the 2023 Budget and $0.4 billion higher than in the 2023 Ontario Economic Outlook and Fiscal Review. New commitments since the release of the 2023 Ontario Economic Outlook and Fiscal Review are primarily offset by third-party revenues, lower-than-expected spending and the Contingency Fund, and include increased health sector spending, support for the City of Toronto and increases in the college sector.
Key changes to program expense projections since the release of the 2023 Ontario Economic Outlook and Fiscal Review include:
- $1.7 billion in health sector supports, primarily to address pressures related to compensation costs, cancer treatment services and other health initiatives;
- $704 million as part of the New Deal for Toronto, including $504 million in transit and transportation related funding and making available $200 million in supports for shelters and homelessness;
- $583 million increase in the college sector, offset by third-party revenues;
- $81 million in additional funding to support wildland fire operations across Ontario, as forest fires in 2023 exceeded the 10-year average by over 275,000 hectares;
- $21 million to expand the Ontario Anti-Hate Security and Prevention Grant, to address the rise of hate incidents against religious and minority groups by helping faith-based and cultural organizations implement measures to ensure community spaces remain safe and secure;
- $451 million decrease in planned expenditures due to an updated construction schedule for the broadband program; and
- $100 million net savings in all other programs.
Interest on Debt Expense Update
Interest on debt expense is projected to be $12.9 billion, approximately $1.2 billion lower than the $14.1 billion forecast in the 2023 Budget and $0.6 billion lower than the $13.4 billion projection in the 2023 Ontario Economic Outlook and Fiscal Review. With lower-than-projected borrowing costs and a reduced interest rate forecast, Ontario’s cost of borrowing has been reduced to 4.2 per cent, lower than the 4.6 per cent forecast in the 2023 Budget and the 2023 Ontario Economic Outlook and Fiscal Review.
Fiscal Prudence
The Fiscal Sustainability, Transparency and Accountability Act, 2019 requires Ontario's fiscal plan to incorporate prudence in the form of a reserve to protect the fiscal outlook against unforeseen changes in the province’s revenue and expense, including those resulting from Ontario’s economic performance. The 2023 Budget included a reserve of $1.0 billion in 2023–24, which has been maintained as part of the current fiscal outlook. If not needed, the reserve is eliminated at year‐end as part of the final projection for 2023–24 published in the 2024 Budget. In addition, the Contingency Fund is maintained to help mitigate expense risks — for example, in cases where health and safety may be compromised, or unforeseen events which may otherwise adversely affect Ontario’s fiscal performance. The remaining balance of the Contingency Fund is projected to be $3.3 billion for 2023–24.
Section B: Ontario’s Recent Economic Performance and Outlook
Recent Economic Performance
In the third calendar quarter of 2023, Ontario’s real gross domestic product (GDP) was unchanged, following a 0.4 per cent increase in the second quarter of 2023. Real GDP growth has been slowing, in part due to the impact of higher interest rates.
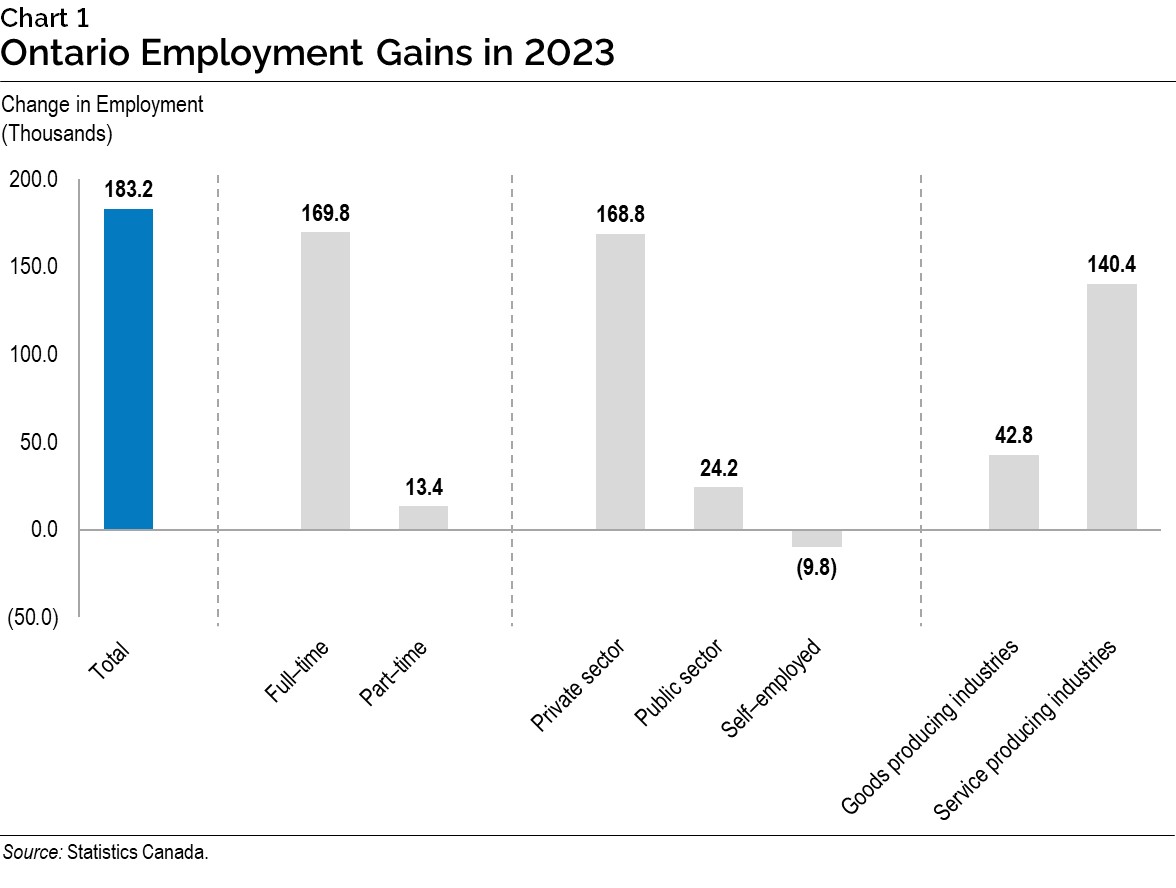
Growth in Ontario’s labour market remained strong in 2023, increasing by 183,200, following a gain of 338,300 in 2022. Most of the net employment gains in 2023 were in full-time positions (93 per cent of the net total) and in the private sector (92 per cent of the net total). Ontario’s unemployment rate edged up to 5.7 per cent in 2023, from 5.6 per cent in 2022.
Economic Outlook
Global economic growth expectations have continued to moderate as persistently elevated price inflation has prompted tighter monetary policy, including significantly higher central bank policy interest rates over the past two years in many countries. The International Monetary Fund estimates that global real GDP rose by 3.1 per cent in 2023, and projects real GDP growth will remain at 3.1 per cent in 2024. The U.S. economy outperformed expectations in 2023 as labour markets and consumer demand were resilient in the face of higher interest rates, but growth is expected to moderate in 2024. According to the Blue Chip Economic Indicators January survey, forecasters anticipate U.S. real GDP growth to slow from 2.5 per cent in 2023 to 1.6 per cent in 2024.
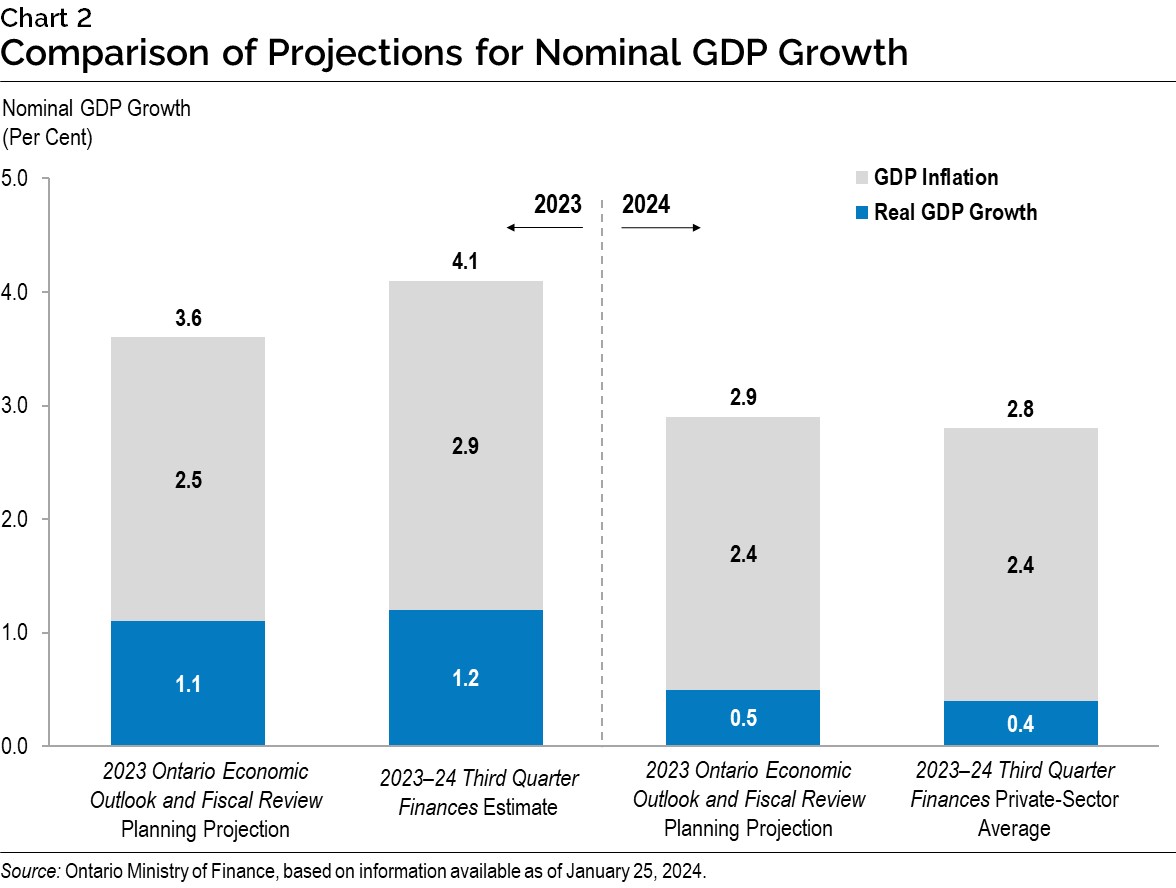
The Ministry of Finance estimates that Ontario real GDP increased 1.2 per cent in 2023, slightly higher than the 2023 Ontario Economic Outlook and Fiscal Review planning assumption of 1.1 per cent. Ontario nominal GDP is estimated to have increased 4.1 per cent in 2023, higher than the 2023 Ontario Economic Outlook and Fiscal Review planning assumption of 3.6 per cent, largely due to higher-than-expected GDP inflation.
Private-sector forecasters, on average, project Ontario’s real GDP to rise by 0.4 per cent in 2024, which is slightly lower than the 2023 Ontario Economic Outlook and Fiscal Review planning assumption of 0.5 per cent. Ontario’s nominal GDP is projected to rise by 2.8 per cent in 2024, compared to the 2023 Ontario Economic Outlook and Fiscal Review planning assumption of 2.9 per cent.
The future path of price inflation continues to be a key risk to the economic outlook, both in Canada and globally. In many countries, the cumulative impact of higher interest rates has begun to moderate price inflation. If central banks determine that there is a significant risk that this inflation moderation will pause or reverse, they may maintain tighter monetary policy for longer. This represents a significant downside risk for global economies. Elevated interest rates also pose a risk to the housing market, as prices and activity continue to adjust to tighter monetary policy conditions.
Conflicts around the world could continue to disrupt the supply of key commodities, impact global trade and further elevate risks. Supply disruptions continue to pose a heightened risk to the global economy.
Section C: Details of Ontario’s Finances
| Item | 2023–24 2023 Budget | 2023–24 Current Outlook | 2023–24 In-Year Change |
|---|---|---|---|
| Taxation Revenue — Personal Income Tax | 55,982 | 51,875 | (4,107) |
| Taxation Revenue — Sales Tax | 35,350 | 39,762 | 4,412 |
| Taxation Revenue — Corporations Tax | 24,668 | 21,769 | (2,899) |
| Taxation Revenue — Education Property Tax | 5,725 | 5,755 | 30 |
| Taxation Revenue — Employer Health Tax | 8,215 | 8,364 | 150 |
| Taxation Revenue — Ontario Health Premium | 4,896 | 4,918 | 22 |
| Taxation Revenue — Gasoline Tax | 2,222 | 1,664 | (558) |
| Taxation Revenue — Land Transfer Tax | 3,529 | 3,739 | 210 |
| Taxation Revenue — Tobacco Tax | 840 | 827 | (13) |
| Taxation Revenue — Fuel Tax | 635 | 499 | (136) |
| Taxation Revenue — Beer, Wine and Spirits Taxes | 617 | 599 | (18) |
| Taxation Revenue — Electricity Payments in Lieu of Taxes | 538 | 545 | 7 |
| Taxation Revenue — Ontario Portion of the Federal Cannabis Excise Duty | 269 | 344 | 75 |
| Taxation Revenue — Other Taxes | 735 | 673 | (62) |
| Taxation Revenue — Total | 144,222 | 141,333 | (2,889) |
| Government of Canada — Canada Health Transfer | 19,218 | 19,277 | 59 |
| Government of Canada — Canada Social Transfer | 6,384 | 6,404 | 21 |
| Government of Canada — Equalization | 421 | 421 | – |
| Government of Canada — Infrastructure Programs | 1,206 | 1,206 | – |
| Government of Canada — Labour Market Programs | 931 | 1,161 | 230 |
| Government of Canada — Social Housing Agreement | 218 | 218 | – |
| Government of Canada — Other Federal Payments | 5,996 | 5,998 | 1 |
| Government of Canada — Direct Transfers to Broader Public-Sector Organizations | 470 | 472 | 2 |
| Government of Canada — Total | 34,844 | 35,158 | 314 |
| Income from Government Business Enterprises — Liquor Control Board of Ontario | 2,452 | 2,546 | 94 |
| Income from Government Business Enterprises — Ontario Power Generation Inc./Hydro One Ltd. | 1,126 | 1,498 | 372 |
| Income from Government Business Enterprises — Ontario Lottery and Gaming Corporation | 2,574 | 2,351 | (222) |
| Income from Government Business Enterprises — Ontario Cannabis Store | 194 | 242 | 48 |
| Income from Government Business Enterprises — iGaming Ontario | – | 162 | 162 |
| Income from Government Business Enterprises — Total | 6,345 | 6,800 | 454 |
| Other Non-Tax Revenue — Fees, Donations and Other Revenues from Hospitals, School Boards and Colleges | 11,104 | 11,845 | 741 |
| Other Non-Tax Revenue — Vehicle and Driver Registration Fees | 1,131 | 1,114 | (16) |
| Other Non-Tax Revenue — Miscellaneous Other Non-Tax Revenue | 1,943 | 1,755 | (188) |
| Other Non-Tax Revenue — Other Fees and Licences | 1,518 | 1,524 | 6 |
| Other Non-Tax Revenue — Sales and Rentals | 1,847 | 1,800 | (47) |
| Other Non-Tax Revenue — Reimbursements | 1,048 | 1,054 | 6 |
| Other Non-Tax Revenue — Royalties | 322 | 322 | – |
| Other Non-Tax Revenue — Power Supply Contract Recoveries | 43 | 39 | (4) |
| Other Non-Tax Revenue — Net Reduction of Power Purchase Contracts | – | – | – |
| Other Non-Tax Revenue — Total | 18,956 | 19,453 | 497 |
| Total Revenue | 204,367 | 202,744 | (1,623) |
Notes: Numbers may not add due to rounding. Current outlook primarily reflects information available as of December 31, 2023, as well as other currently available key updates to the fiscal plan.
Source: Ontario Ministry of Finance.
| Ministry Expense | 2023–24 2023 Budget | 2023–24 Current Outlook | 2023–24 In-Year Change |
|---|---|---|---|
| Agriculture, Food and Rural Affairs (Base) | 350.3 | 361.4 | 11.2 |
| Agriculture, Food and Rural Affairs — Demand-Driven Risk Management and Time-Limited Programs | 472.1 | 472.1 | – |
| Agriculture, Food and Rural Affairs (Total) | 822.4 | 833.6 | 11.2 |
| Attorney General (Total) | 1,919.2 | 1,838.7 | (80.4) |
| Board of Internal Economy (Total) | 304.8 | 304.8 | – |
| Children, Community and Social Services (Total) | 19,360.8 | 19,394.0 | 33.2 |
| Citizenship and Multiculturalism (Total) | 64.1 | 88.3 | 24.1 |
| Colleges and Universities (Base) | 10,757.2 | 11,333.9 | 576.7 |
| Colleges and Universities — Student Financial Assistance | 1,357.7 | 1,357.7 | – |
| Colleges and Universities (Total) | 12,114.8 | 12,691.5 | 576.7 |
| Economic Development, Job Creation and Trade (Base) | 188.9 | 196.3 | 7.4 |
| Economic Development, Job Creation and Trade — Tax Credits for Research and Development and Regional Investment | 299.2 | 299.2 | – |
| Economic Development, Job Creation and Trade — Ontario Made Manufacturing Investment Tax Credit | 215.0 | 215.0 | – |
| Economic Development, Job Creation and Trade — Time-Limited Investments | 606.8 | 977.2 | 370.4 |
| Economic Development, Job Creation and Trade (Total) | 1,309.8 | 1,687.7 | 377.9 |
| Education (Base) | 34,712.1 | 34,714.1 | 2.0 |
| Education — Teachers’ Pension Plan | 1,711.0 | 1,711.0 | – |
| Education (Total) | 36,423.1 | 36,425.1 | 2.0 |
| Energy (Base) | 281.8 | 284.8 | 3.0 |
| Energy — Electricity Cost Relief Programs | 6,516.8 | 6,377.6 | (139.3) |
| Energy (Total) | 6,798.6 | 6,662.4 | (136.2) |
| Environment, Conservation and Parks (Total) | 782.6 | 788.0 | 5.4 |
| Executive Offices (Total) | 60.8 | 66.2 | 5.4 |
| Finance (Base) | 1,006.0 | 1,012.8 | 6.8 |
| Finance — Investment Management Corporation of Ontario | 298.8 | 298.8 | – |
| Finance — Ontario Municipal Partnership Fund | 501.9 | 501.9 | – |
| Finance — Temporary and Other Local Assistance | 81.0 | 81.0 | – |
| Finance — Power Supply Contract Costs | 42.9 | 38.8 | (4.1) |
| Finance (Total) | 1,930.6 | 1,933.3 | 2.7 |
| Francophone Affairs (Total) | 7.7 | 7.9 | 0.2 |
| Health (Total) | 72,709.6 | 74,579.5 | 1,869.9 |
| Indigenous Affairs (Total) | 133.2 | 136.0 | 2.8 |
| Infrastructure (Base) | 601.8 | 688.4 | 86.7 |
| Infrastructure — Federal–Provincial Infrastructure Programs | 492.2 | 491.6 | (0.7) |
| Infrastructure — Broadband | 783.2 | 332.6 | (450.6) |
| Infrastructure — Waterfront Toronto Revitalization (Port Lands Flood Protection) | – | 25.0 | 25.0 |
| Infrastructure — Municipal Infrastructure Program Investments | 398.4 | 397.0 | (1.4) |
| Infrastructure — Realty | 1,194.3 | 1,195.2 | 1.0 |
| Infrastructure (Total) | 3,469.8 | 3,129.9 | (339.9) |
| Labour, Immigration, Training and Skills Development (Base) | 236.4 | 240.7 | 4.3 |
| Labour, Immigration, Training and Skills Development — Training Tax Credits (Co-operative Education and Apprenticeship Training) | 93.5 | 93.5 | – |
| Labour, Immigration, Training and Skills Development — Demand-Driven Employment and Training Programs | 1,454.2 | 1,454.2 | – |
| Labour, Immigration, Training and Skills Development (Total) | 1,784.1 | 1,788.4 | 4.3 |
| Long-Term Care (Total) | 8,299.7 | 8,306.4 | 6.8 |
| Mines (Total) | 172.3 | 184.8 | 12.5 |
| Municipal Affairs and Housing (Base) | 767.5 | 771.2 | 3.7 |
| Municipal Affairs and Housing — Time-Limited Investments | 480.0 | 746.1 | 266.2 |
| Municipal Affairs and Housing — Social Housing Agreement – Payments to Service Managers | 198.2 | 198.2 | – |
| Municipal Affairs and Housing (Total) | 1,445.6 | 1,715.5 | 269.8 |
| Natural Resources (Base) | 688.3 | 700.0 | 11.7 |
| Natural Resources — Emergency Forest Firefighting | 135.0 | 215.7 | 80.7 |
| Natural Resources (Total) | 823.2 | 915.6 | 92.4 |
| Northern Development (Total) | 725.3 | 725.6 | 0.3 |
| Public and Business Service Delivery (Total) | 1,130.6 | 1,144.9 | 14.3 |
| Seniors and Accessibility (Base) | 64.9 | 66.4 | 1.5 |
| Seniors and Accessibility — Seniors Tax Credits (Home Safety and Care at Home) | 120.0 | 120.0 | – |
| Seniors and Accessibility (Total) | 184.9 | 186.4 | 1.5 |
| Solicitor General (Total) | 3,431.1 | 3,613.4 | 182.3 |
| Tourism, Culture and Sport (Base) | 840.2 | 856.2 | 16.0 |
| Tourism, Culture and Sport — Ontario Cultural Media Tax Credits | 906.1 | 906.1 | – |
| Tourism, Culture and Sport (Total) | 1,746.3 | 1,762.3 | 16.0 |
| Transportation (Base) | 6,179.5 | 6,186.3 | 6.8 |
| Transportation — Federal–Provincial Infrastructure Programs | 729.2 | 729.2 | – |
| Transportation — Time-Limited Investments | – | 504.4 | 504.4 |
| Transportation (Total) | 6,908.7 | 7,419.9 | 511.2 |
| Treasury Board Secretariat (Base) | 497.4 | 525.3 | 27.9 |
| Treasury Board Secretariat — Employee and Pensioner Benefits | 1,260.7 | 1,260.7 | – |
| Treasury Board Secretariat — Operating Contingency Fund | 3,893.7 | 3,215.3 | (678.4) |
| Treasury Board Secretariat — Capital Contingency Fund | 106.3 | 57.2 | (49.2) |
| Treasury Board Secretariat (Total) | 5,758.1 | 5,058.4 | (699.7) |
| Interest on Debt | 14,058.0 | 12,889.0 | (1,169.0) |
| Total Expense | 204,680.0 | 206,277.5 | 1,597.5 |
Notes: Numbers may not add due to rounding. Current outlook primarily reflects information available as of December 31, 2023, as well as other currently available key updates to the fiscal plan.
Sources: Ontario Treasury Board Secretariat and Ontario Ministry of Finance.
| Sector | 2023-24 2023 Budget Total Infrastructure Expenditures | 2023–24 Current Outlook Investment in Capital Assets | 2023–24 Current Outlook Transfers and Other Infrastructure Expenditures | 2023-24 Current Outlook Total Infrastructure Expenditures | 2023-24 Change from 2023 Budget Total Infrastructure Expenditures |
|---|---|---|---|---|---|
| Transportation — Transit | 7,471 | 6,195 | 1,276 | 7,471 | – |
| Transportation — Provincial Highways | 3,193 | 3,098 | 293 | 3,391 | 198 |
| Transportation — Other Transportation, Property and Planning | 236 | 157 | 79 | 236 | – |
| Health — Hospitals | 3,349 | 3,348 | 1 | 3,349 | – |
| Health — Other Health | 581 | 77 | 491 | 568 | (13) |
| Education | 3,003 | 2,777 | 226 | 3,003 | – |
| Postsecondary Education — Colleges and Other | 705 | 678 | 66 | 744 | 39 |
| Postsecondary Education — Universities | 124 | – | 124 | 124 | – |
| Social | 369 | 32 | 361 | 394 | 24 |
| Justice | 801 | 824 | 27 | 851 | 49 |
| Other Sectors | 3,667 | 1,140 | 2,067 | 3,207 | (460) |
| Total Infrastructure Expenditures | 23,499 | 18,326 | 5,011 | 23,336 | (163) |
| Less: Other Partner Funding | 2,864 | 2,607 | 304 | 2,912 | 48 |
| Total | 20,635 | 15,718 | 4,706 | 20,424 | (211) |
Notes: Numbers may not add due to rounding. Current outlook primarily reflects information available as of December 31, 2023, as well as other currently available key updates to the fiscal plan.
Source: Ontario Treasury Board Secretariat.
| Item | 2019–20 | 2020–21 | 2021–22 | Actual 2022–23 | Current Outlook 2023–24 |
|---|---|---|---|---|---|
| Revenue | 156,167 | 164,970 | 185,128 | 192,887 | 202,744 |
| Expense — Programs | 152,265 | 168,964 | 170,520 | 186,361 | 193,388 |
| Expense — Interest on Debt | 12,497 | 12,296 | 12,583 | 12,389 | 12,889 |
| Total Expense | 164,762 | 181,260 | 183,103 | 198,750 | 206,277 |
| Reserve | – | – | – | – | 1,000 |
| Surplus/(Deficit) | (8,595) | (16,290) | 2,025 | (5,863) | (4,534) |
| Net Debt | 352,382 | 372,501 | 382,842 | 400,484 | 415,091 |
| Accumulated Deficit | 224,814 | 238,231 | 238,160 | 246,804 | 251,338 |
| Gross Domestic Product (GDP) at Market Prices | 893,224 | 874,354 | 960,226 | 1,048,258 | 1,091,497 |
| Primary Household Income | 593,065 | 592,514 | 642,859 | 695,228 | 739,268 |
| Population — July (000s) | 14,574 | 14,762 | 14,842 | 15,145 | 15,608 |
| Net Debt Per Capita (dollars) | 24,180 | 25,234 | 25,794 | 26,443 | 26,594 |
| Household Income Per Capita (dollars) | 40,695 | 40,138 | 43,312 | 45,905 | 47,364 |
| Net Debt as a Per Cent of Revenue | 225.6% | 225.8% | 206.8% | 207.6% | 204.7% |
| Interest on Debt as a Per Cent of Revenue | 8.0% | 7.5% | 6.8% | 6.4% | 6.4% |
| Net Debt as a Per Cent of GDP | 39.5% | 42.6% | 39.9% | 38.2% | 38.0% |
| Accumulated Deficit as a Per Cent of GDP | 25.2% | 27.2% | 24.8% | 23.5% | 23.0% |
Notes: Numbers may not add due to rounding. Current outlook primarily reflects information available as of December 31, 2023 as well as other currently available key updates to the fiscal plan.
Sources: Statistics Canada, Ontario Treasury Board Secretariat and Ontario Ministry of Finance.
Section D: Ontario’s 2023–24 Borrowing Program
| Item | 2023–24 2023 Budget | 2023–24 Current Outlook | 2023–24 Change from 2023 Budget |
|---|---|---|---|
| Deficit/(Surplus) | 1.3 | 4.5 | 3.2 |
| Investment in Capital Assets | 13.6 | 13.6 | 0.1 |
| Non-Cash and Cash Timing Adjustments | (9.2) | (1.3) | 7.9 |
| Loans to Infrastructure Ontario | 0.1 | 0.1 | – |
| Other Net Loans/Investments | 0.1 | 0.1 | (0.0) |
| Debt Maturities/Redemptions | 31.2 | 31.2 | (0.0) |
| Total Funding Requirement | 37.0 | 48.1 | 11.1 |
| Decrease/(Increase) in Short-Term Borrowing | – | – | – |
| Increase/(Decrease) in Cash and Cash Equivalents | 5.0 | – | (5.0) |
| Pre-Borrowing in 2022–23 for 2023–24 | (14.5) | (14.5) | – |
| Total Long-Term Public Borrowing | 27.5 | 33.6 | 6.1 |
Note: Numbers may not add due to rounding.
Source: Ontario Financing Authority.
Ontario’s long-term public borrowing requirement for 2023–24 has decreased by $1.1 billion compared to the forecast in the 2023 Ontario Economic Outlook and Fiscal Review, mirroring a decrease in the projected deficit for 2023–24.
As of February 7, 2024, Ontario completed $38.6 billion of long‑term borrowing in 2023–24 and has begun pre-borrowing for the next fiscal year. Approximately $32.8 billion, or 85 per cent, was completed in Canadian dollars, with the remaining $5.9 billion, or 15 per cent, completed in U.S. dollars and Euros.
Green Bonds remain a core component of Ontario’s borrowing program and are an important tool to help finance public transit initiatives, extreme weather-resilient infrastructure, as well as energy efficiency and conservation projects. Ontario remains the largest issuer of Canadian dollar Green Bonds, totalling $16.5 billion issued since 2014–15, with $14.5 billion outstanding.
Ontario has released a Sustainable Bond Framework, replacing its Green Bond Framework from 2014. The new Framework will allow for a broader range of potential bond offerings in the future.
Interest rates have been lower than projected in the 2023 Ontario Economic Outlook and Fiscal Review, resulting in a decreased forecast in Ontario’s cost of borrowing for 2023–24, from 4.6 per cent to 4.2 per cent. Ontario is estimated to pay interest on debt costs of $12.9 billion, compared to the forecast of $13.4 billion as of the 2023 Ontario Economic Outlook and Fiscal Review. The province will continue to monitor interest rate movements and provide regular updates on interest on debt costs in future fiscal updates.
2023–24 Long-Term Borrowing
| Item | Amount |
|---|---|
| Canadian dollar issues | 32.8 |
| Foreign currency issues | 5.9 |
| Total | 38.6 |
Note: Numbers may not add due to rounding.
Source: Ontario Financing Authority.
Ministry of Finance: www.ontario.ca/finance
For general inquiries regarding the 2023–24 Third Quarter Finances, please call or email:
Toll-free English and French inquiries:
Teletypewriter :
Email: FinanceCommunications.fin@ontario.ca
© King’s Printer for Ontario, 2024
Chart Descriptions: Alternative Text for Web Accessibility
Chart 1: Ontario Employment Gains in 2023
This bar chart illustrates Ontario’s annual employment gains in 2023. Changes are as follows: Total employment was 183,200 higher; Full-time employment was 169,800 higher; Part-time employment was 13,400 higher; Private-sector employment was 168,800 higher; Public-sector employment was 24,200 higher; Self-employment was 9,800 lower; Goods producing industry employment was 42,800 higher; and Service producing industry employment was 140,400 higher.
Source: Statistics Canada.
Chart 2: Comparison of Projections for Nominal GDP Growth
The stacked bar graph shows the 2023 Ontario Economic Outlook and Fiscal Review planning projections and the 2023–24 Third Quarter Finances estimates for Ontario real GDP growth, GDP inflation and nominal GDP growth for 2023, and the 2023 Ontario Economic Outlook and Fiscal Review planning projections and 2023–24 Third Quarter Finances private-sector averages for Ontario real GDP growth, GDP inflation and nominal GDP growth for 2024.
The 2023 Ontario Economic Outlook and Fiscal Review planning projections for Ontario real GDP growth are 1.1 per cent for 2023 and 0.5 per cent for 2024. The 2023 Ontario Economic Outlook and Fiscal Review planning projections for Ontario GDP inflation are 2.5 per cent for 2023 and 2.4 per cent for 2024. The 2023 Ontario Economic Outlook and Fiscal Review planning projections for Ontario nominal GDP growth are 3.6 per cent for 2023 and 2.9 per cent for 2024.
The 2023–24 Third Quarter Finances estimate for Ontario real GDP growth is 1.2 per cent for 2023, while the 2023–24 Third Quarter Finances private-sector average for Ontario real GDP is 0.4 per cent for 2024. The 2023–24 Third Quarter Finances estimate for Ontario GDP inflation is 2.9 per cent in 2023, while the 2023–24 Third Quarter Finances private-sector average for Ontario GDP inflation is 2.4 per cent in 2024. The 2023–24 Third Quarter Finances estimate for Ontario nominal GDP growth is 4.1 per cent for 2023, while the 2023–24 Third Quarter Finances private-sector average for Ontario nominal GDP growth is 2.8 per cent for 2024.
Source: Ontario Ministry of Finance, based on information available as of January 25, 2024.
Footnotes
- footnote[1] Back to paragraph In the 2023 Budget, iGaming Ontario was recognized as an Ontario government organization with revenue and expense consolidated under the Ministry of the Attorney General. Beginning with the Public Accounts of Ontario 2022–2023, iGaming Ontario was reclassified as a Government Business Enterprise.
- footnote[2] Back to paragraph Numbers reflect current ministry structure.
- footnote[3] Back to paragraph Includes the estimated cost of tax credit claims for the Ontario Innovation Tax Credit, the Ontario Business-Research Institute Tax Credit and the Regional Opportunities Investment Tax Credit (ROITC).
- footnote[4] Back to paragraph Based on the requirements of Public Sector Accounting Standards, the province consolidates the financial results of the Investment Management Corporation of Ontario.
- footnote[5] Back to paragraph The Co-operative Education Tax Credit remains in effect. The Apprenticeship Training Tax Credit was eliminated for eligible apprenticeship programs that commenced on or after November 15, 2017.
- footnote[6] Back to paragraph The Ontario Ministry of Long-Term Care total includes expenses incurred by Ontario Health for funding for long-term care. These amounts will be consolidated in the total expense of the Ontario Ministry of Health, including $5.2 billion in 2023–24.
- footnote[7] Back to paragraph Interest on debt is net of interest capitalized during construction of tangible capital assets of $573 million in 2023–24.
- footnote[8] Back to paragraph Includes $573 million in interest capitalized during construction.
- footnote[9] Back to paragraph Includes provincial investment in capital assets of $13.6 billion.
- footnote[10] Back to paragraph Includes transfers to municipalities, universities and non-consolidated agencies.
- footnote[11] Back to paragraph Includes broadband infrastructure, government administration, natural resources and the culture and tourism industries.
- footnote[12] Back to paragraph Other Partner Funding refers to third-party investments, primarily in hospitals, colleges and schools.
- footnote[13] Back to paragraph Includes Federal/Municipal contributions to provincial infrastructure investments.
- footnote[14] Back to paragraph Interest on debt is net of interest capitalized during construction of tangible capital assets of $245 million in 2019–20, $230 million in 2020–21, $321 million in 2021–22, $694 million in 2022–23 and $573 million in 2023–24.
- footnote[15] Back to paragraph Population figures are for July 1 of the fiscal year indicated (i.e., for 2023–24, the population on July 1, 2023 is shown).