Technical appendix - Climate Vision: Progress Report 2012
This technical appendix provides details on the province’s greenhouse gas (GHG) emissions and changes in emission levels since 1990. In addition, it also provides an update on the province’s forecasted emission levels out to 2020, including the impact of policies on progress toward the province’s emission targets.
Technical Appendix A
Introduction
This technical appendix provides details on the province’s greenhouse gas (GHG) emissions and changes in emission levels since 1990
How Ontario Measures its GHG Emissions
Ontario’s definition of GHG emissions aligns with the definitions used to prepare Environment Canada’s National Inventory Report 1990–2010: Greenhouse Gas Sources and Sinks in Canada (NIR), published in April, 2012. Each year, Environment Canada submits its updated NIR to the United Nations Framework Convention on Climate Change (UNFCCC) Secretariat. Historical GHG emissions in this progress report are taken from the latest NIR, which covers the period from 1990 to 2010. The data cover most activities in Ontario’s economy that influence GHGs but do not include impacts relating to land use and forestry at this time. The NIR is organized into numerous categories that are defined by UNFCCC reporting protocols and therefore do not match categorizations by other sources of economic, industrial, energy and emissions data. For this appendix, the categories are rolled up into six key economic sectors (see Table 1).
| Economic sector | Description |
|---|---|
| Transportation | Emissions from the consumption of fossil fuels such as diesel, gasoline and propane consumed by passenger and commercial vehicles including road, rail, marine and air travel |
| Industry | Emissions from industrial processes and the use of fossil fuels such as coke, natural gas and coal are produced from a range of industries including mining, oil and gas extraction, manufacturing, mineral and chemical production, construction and paper and wood products production |
| Buildings | Emissions from the use of fossil fuels such as natural gas in residential, commercial and institutional buildings for heating and water |
| Electricity | Emissions from electricity and heat generation produced from the combustion of fossil fuels such as coal and natural gas |
| Agriculture | Emissions generated by enteric fermentation, manure management and fertilizer application |
| Waste | Emissions generated by solid waste disposal on land, wastewater handling and waste incineration |
NB: Emissions from the pipeline transportation of petroleum products are included in the Industry sector.
Changes in NIR
Environment Canada is continually working to refine the data and methods used to estimate national and provincial emissions. These refinements often lead to re-calculation of GHG emission estimates for the whole time period of the NIR, dating back to 1990. This means that our 1990 base year emissions and historical trends can change from year to year, influencing our emission forecasts and the assessment of our progress to targets. These changes are well documented in the NIR and are typically minor but in recent years, some changes in the industrial sector methods have had a pronounced impact on Ontario emission estimates.
Sources of Ontario’s GHG Emissions
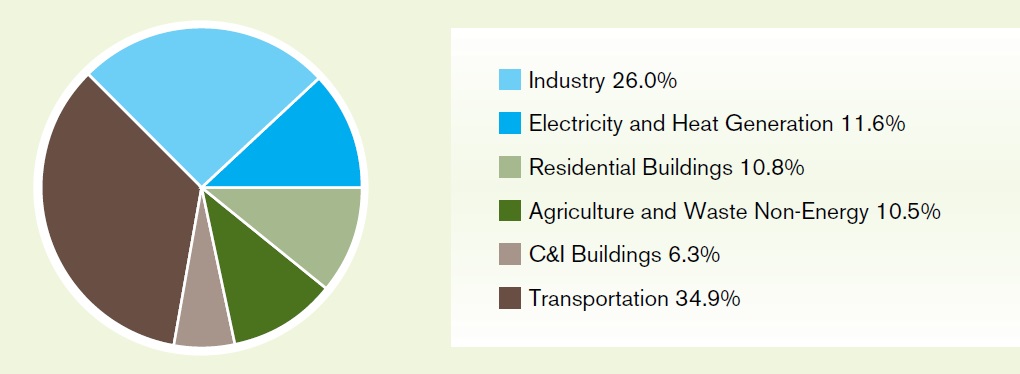
GHG emissions result from virtually all aspects of Ontario’s society and economy but primarily from how we produce and consume energy. Ontario’s 2010 emissions are estimated to have been 171 megatonnes (Mt) of carbon dioxide equivalent (CO2 eq), with sectoral shares shown in Figure 1.
Figure 1: 2010 GHG emissions by sector
Long-Term Trends in Ontario’s Emissions (1990–2010)
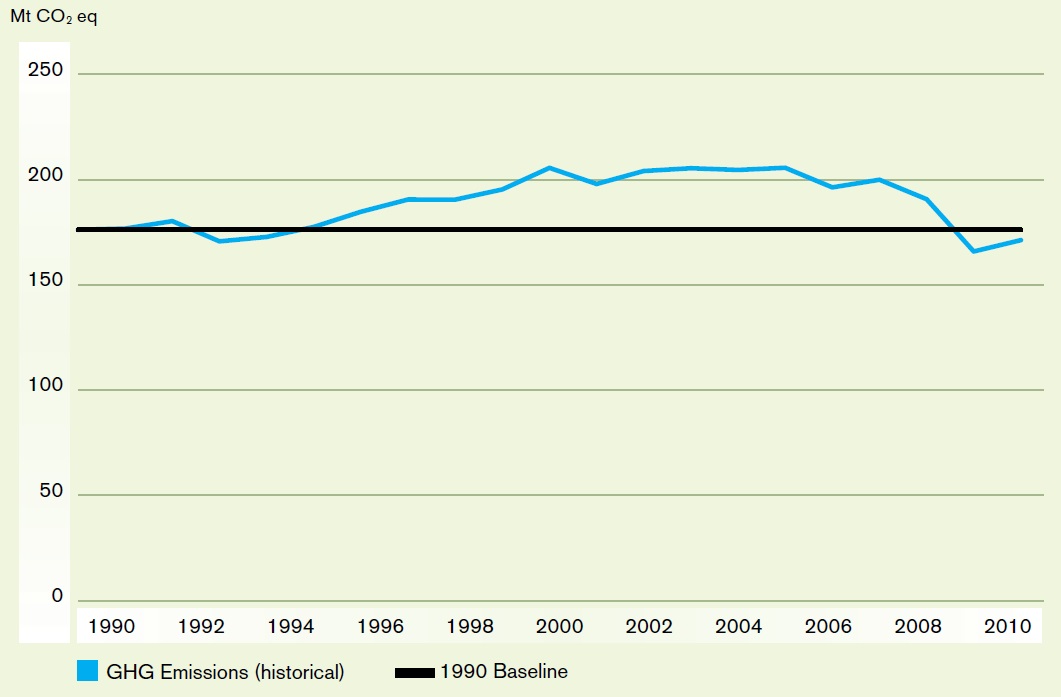
Between 1990 and 2010, Ontario’s total annual emissions dropped by three per cent, from 176 Mt of CO2 eq to 171 Mt of CO2 eq. Figure 2 shows that, while total emissions increased fairly steadily in the first half of this period, more recent annual emission levels have fluctuated in response to changes in the economy, weather, energy demandandtechnologies usedby industry, electricity generation, transportation, andconsumer products.
Figure 2: Ontario’s GHG emissions, 1990-2010
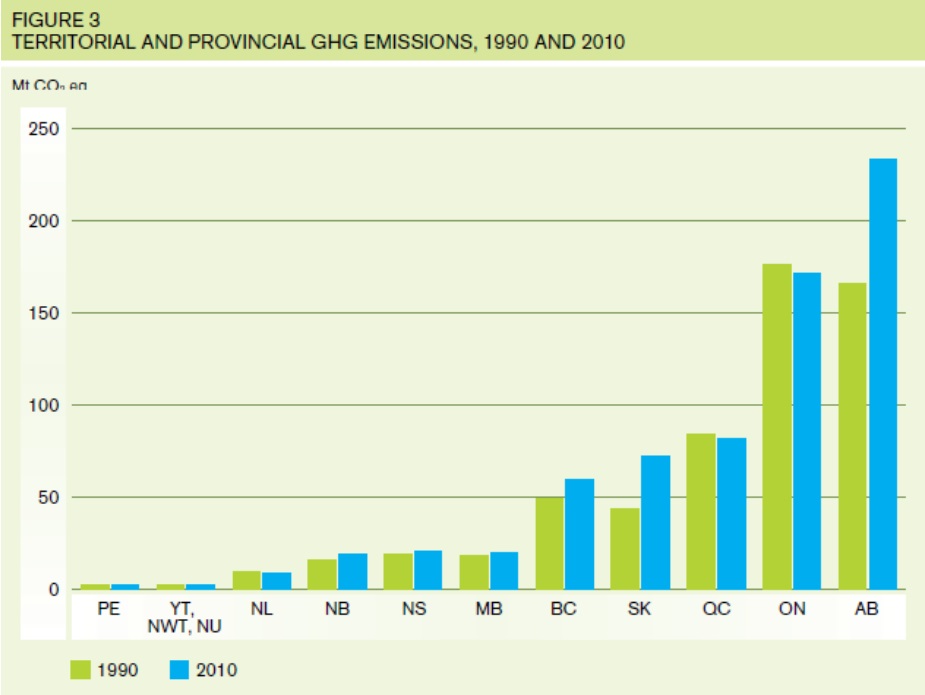
In contrast to Ontario’s stable to declining emissions, the national trend is increasing emissions. In 2010, Canada’s GHG emissions totalled
Figure 3: Territorial and provincial GHG emissions, 1990 and 2010
| Economic sector | Description |
|---|---|
| Transportation 1990: 45.5 Mt 2010: 59.8 Mt Change: +31% |
Road transportation was responsible for the greatest increase in Ontario’s emissions between 1990 and 2010. This long-term increase can be attributed to 30 per cent growth in the on-road vehicle population and the increased consumer preference for SUVs, vans and pick-ups (which more than doubled over this period) over smaller passenger vehicles. Higher emissions also reflect the national trend toward just-in-time delivery, requiring more transportation per product. |
| Industry 1990: 63.2 Mt 2010: 44.5 Mt Change: −30% |
Significant improvements in energy efficiency since 1990 have resulted in greenhouse gas reductions as industries responded to increased energy costs and global competitiveness. |
| Buildings 1990: 26.3 Mt 2010: 29.2 Mt Change: +11% |
Long-term increases in this sector are due to economic changes and population growth. Emissions from commercial and institutional buildings have increased 18 per cent due to a shift in the provincial economy from a manufacturing base to a diversified service industry including finance, insurance and real estate. Residential emissions increased by seven per cent while the population increased by 28 per cent. |
| Electricity 1990: 25.1 Mt 2010: 19.8 Mt Change: −21% |
Emissions in Ontario’s electricity and heat generation sector grew between 1990 and 2000 (an increase of approximately 70 per cent). Significant decreases after 2007 (40 per cent by 2010) have been achieved primarily through the phasing out of coal-fired generation, increasing of renewables and conservation initiatives in the industrial, residential and commercial sectors. |
| Agriculture 1990: 10.0 Mt 2010: 10.3 Mt Change: +4% |
Emissions from agriculture have remained relatively constant with slight fluctuations resulting from a combination of changing tilling and nutrient management techniques and livestock levels. |
| Waste 1990: 6.2 Mt 2010: 7.6 Mt Change: +24% |
Waste emissions increased primarily due to increases in landfill gas which is generated from waste disposed in landfill sites both recently and in past decades. |
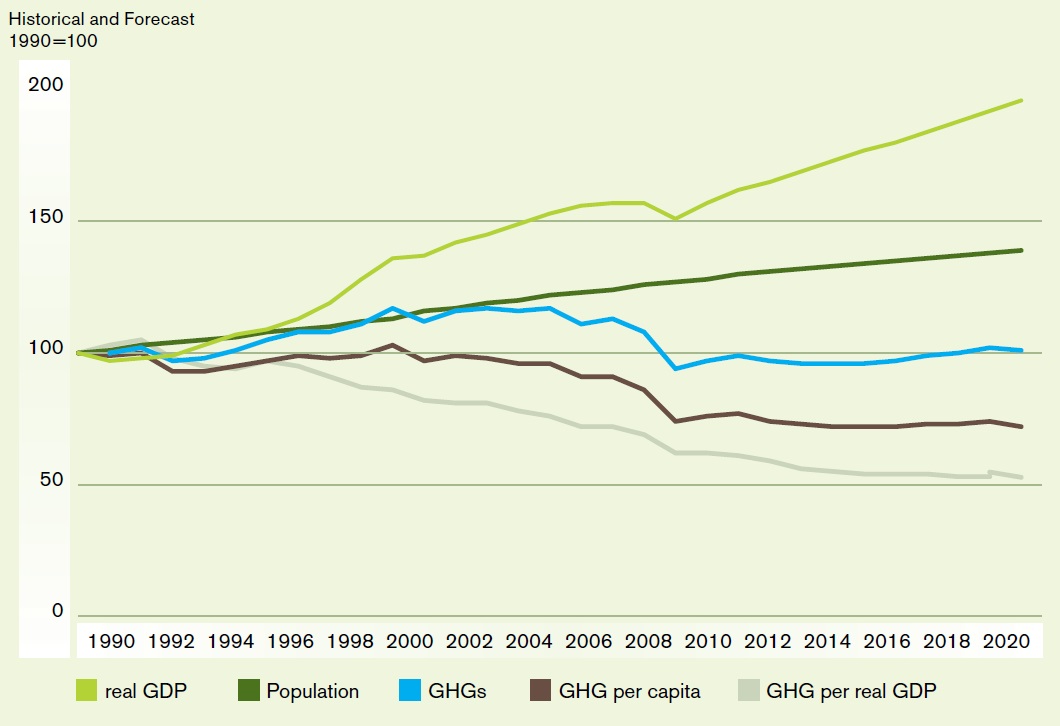
It is important to note that, while Ontario’s total emissions decreased by three per cent between 1990 and 2010, both emissions per capita and emissions for each dollar of real Gross Domestic Production (GDP) have declined by a much greater amount (24 percent and 38 per cent respectively; see Figure 4). This indicates an ongoing trend towards a lower-carbon economy and society, which our modelling suggests will continue.
Figure 4: Emission intensities indices
Ontario’s intensities are significantly lower than most provinces. Table 3 shows 2010 emissions per capita and per dollar of real GDP across Canada.
| Province/Territory | GHG intensity (Mt/$B GDP) | Rank (GHG intensity) | GHG per capita (t per capita) | Rank (GHG per capita) |
|---|---|---|---|---|
| YT, NWT, NU | 0.18 | 1 | 18.99 | 7 |
| QC | 0.34 | 2 | 10.37 | 1 |
| ON | 0.37 | 3 | 12.95 | 2 |
| BC | 0.41 | 4 | 13.04 | 3 |
| MB | 0.53 | 5 | 16.05 | 5 |
| PE | 0.57 | 6 | 13.67 | 4 |
| NL | 0.59 | 7 | 17.33 | 6 |
| NS | 0.79 | 8 | 21.54 | 8 |
| NB | 0.88 | 9 | 24.68 | 9 |
| AB | 1.55 | 10 | 62.70 | 10 |
| SK | 2.12 | 11 | 69.05 | 11 |
NB: GDP is measured in 1997 dollars.
Short-Term Trends in Ontario’s Emissions (2007–2010)
Between 2007 (when the Climate Change Action Plan was first released) and 2010, Ontario’s emissions decreased by 14 per cent — a decline of 29 Mt. Table 4 shows emissions decreased across all major sectors. The electricity sector saw a 40 per cent reduction in emissions, the largest decrease. The second largest decrease was in the industrial sector where emissions fell by 23 per cent. These reductions are largely attributable to reduced coal-fired electricity generation and a decline in both output and emission intensity in energy-intensive industries. Both residential and commercial buildings also reduced their emissions from heating, despite increases in total floor space. This is due to ongoing successful natural gas demand management programs, and the residential retrofit program; however, economic activity likely affected these emissions as well.
| Sector | 2007 | 2010 | Variation (2007 to 2010) |
|---|---|---|---|
| Transportation | 58.0 | 59.8 | 3% |
| Industrial | 58.0 | 44.5 | −23% |
| Buildings | 33.0 | 29.2 | −12% |
| Electricity | 33.0 | 19.8 | −40% |
| Agriculture | 10.0 | 10.3 | 4% |
| Waste | 7.9 | 7.6 | −4% |
| Total | 200.0 | 171.3 | −14% |
Emission Modelling Overview
Reporting on the progress of Climate Change Action Plan initiatives and projecting future GHG emissions are essential to understanding Ontario’s progress towards meeting its action plan targets. It should be noted, that emission forecasts are only one measure of progress on climate change actions. Decarbonization is achieved through steady, ongoing reductions in the key drivers of energy use (particularly fossil fuels) and non- energy emissions. Incremental progress in these areas is best assessed by looking at a variety of indicators — quantitative ones like emission forecasts, but also changes in emission intensities, building densities, vehicle kilometres travelled, etc. — along with qualitative assessments of the nature and resilience of socioeconomic changes. Finally, most of the important initiatives (public transit infrastructure, building energy efficiency, vehicle efficiency improvements, and land use) take decades until their peak impacts are felt.
Ontario’s approach to modelling GHG emissions is updated periodically to incorporate the latest data available and refinements based on best practices. In addition, the projections of emission reductions are adjusted as required to incorporate changes to programs or policies. This modelling uses the most recent NIR data (April 2012) from Environment Canada and economic and demographic forecasts from February 2012 by Informetrica.
This information was used to create:
- A Business-as-Usual (BAU) projection — a projection that assumes underlying historical emission trends continue (excluding the anticipated future impact of emission reduction initiatives, both planned and already underway), while taking account of the current economic outlook for Ontario;
- A Climate Change Action Plan projection — a projection that includes the anticipated future impact of emission reduction initiatives (both those that are underway and those that are committed to and sufficiently developed to reasonably estimate their impacts).
Third-Party Validation
To provide confidence in the province’s long-term forecasts, Ontario has had its emissions forecasting methodology and assumptions validated by an independent third party. In 2009, Ontario was the first jurisdiction to undertake a validation of its forward-looking emission reduction forecasts. The process of completing a validation is intended to ensure that the methodologies, data sources and assumptions used to develop the projected GHG emissions under the action plan are reasonable and align with best practices where available. For this report, Ontario retained Navius Research Inc., who concluded that Ontario’s estimates are a fair representation of those expected using current best practices in GHG emissions forecasting and evaluation of GHG mitigation programs (see Appendix C for assurance statement).
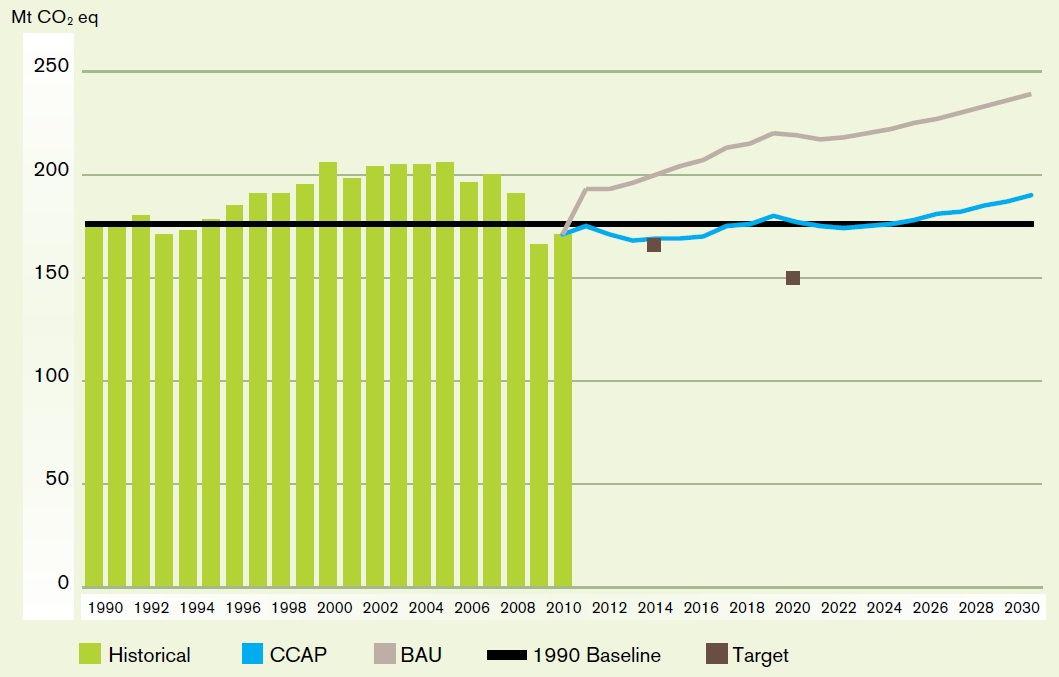
Updated Emissions Projection
Since the release of the last climate change progress report, the province’s emission forecasting model has been updated to reflect the best available information.
The government is now projecting that the suite of initiatives will achieve approximately 90 per cent of the reductions needed to meet the 2014 target. The forecasts show a slight improvement over those in the last report (see Table 5). Changes in forecasted emissions reflect revisions to modelling
| 2012 Report | 2014 | 2020 |
|---|---|---|
| Projected Reductions (Mt) | 31 | 42 |
| Progress to Target | 91% | 60% |
| Gap (Mt) | 3 | 28 |
| 2011 Report | 2014 | 2020 |
|---|---|---|
| Projected Reductions (Mt) | 27 | 39 |
| Progress to Target | 88% | 57% |
| Gap (Mt) | 4 | 30 |
Updating the BAU
The province’s BAU scenario has been updated to reflect more recent emission and energy use data, revisions to historical data from Environment Canada and Natural Resources Canada, revised economic and demographic forecasts and refinements to the underlying model.
Figure 5: Forecasted GHG emissions
Initiative Impacts
The province’s suite of initiatives represent a combination of distinct GHG reduction efforts, such as provincial regulation requiring methane from landfills to be captured, and clusters of related efforts aimed at achieving a common goal, such as the phase-out of coal-fired electricity generation and related renewable generation and conservation activities. The initiatives cross all of the emission sources and economic sectors and represent a blend of short-, medium- and long-term emission reductions. The initiatives include activities that are both within and outside the direct control of the Ontario government and include federal policies that are closely interrelated with provincial initiatives.
| Sector | Initiative | Projected reductions (Mt) 2014 | Projected reductions (Mt) 2020 |
|---|---|---|---|
| Transportation |
|
1.9 | 3.9 |
| Industry |
|
0.6 | 1.0 |
| Buildings |
|
1.6 | 2.9 |
| Electricity |
|
24.8 | 31.6 |
| Agriculture and Waste |
|
1.8 | 2.0 |
| All initiatives total | 30.6 | 41.3 |
NB: Emission reductions for all initiatives together may differ from the sum of individual initiative reductions due to interaction between them.
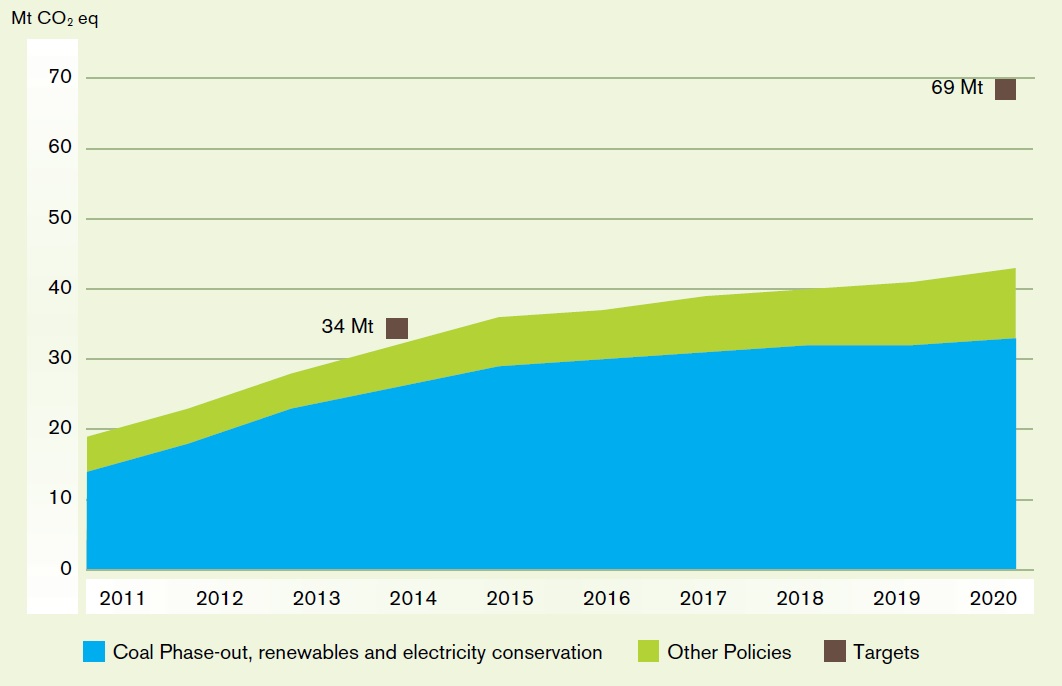
Phasing out coal-fired electricity generation and replacing it with renewable power, natural gas, refurbished nuclear and energy conservation has by far the largest impact in the near future (see Figure 7). After 2020, however, impacts from initiatives in the transportation and building sectors will increase relative to those from the electricity sector because of the time required for construction (transit projects) and turnover (vehicle fleets, housing stock).
Figure 7: Reductions by source
Uncertainty
The reductions presented in this report, linked to the government’s GHG emission reduction measures, are based on a single set of economic, demographic, energy, and policy assumptions. As with any modelling of this kind, there are significant uncertainties inherent in this projection.
As a rough example, if in 2020 both real GDP and population were one per cent higher than forecasted, the projected non-electricity emissions would be approximately 1.5 Mt greater (almost one per cent of non-electricity emissions). This change is a generalized effect. The increase could be significantly higher or lower depending, for example, on whether energy-intensive manufacturing output is higher than the service sector. Electricity emissions are sensitive to weather — more frequent hot summer afternoons (especially combined with higher GDP) would increase emissions much further.
Technical Appendix B: Status of Climate Ready Actions
1. Require consideration of climate change adaptation
| Year | Status |
|---|---|
| 2011 |
|
| 2012 |
|
| 2013 |
|
| 2014 and beyond | Ministries mainstreaming adaptation into policies and programs as standard practice. |
2. Establish a climate change adaptation directorate
| Year | Status |
|---|---|
| 2011 | Determined appropriate mix of technical, policy, research and scientific support staff necessary to meet adaptation needs. |
| 2012 | Dedicated staff in MOE coordinated adaptation research and expertise across government. |
| 2013 | Dedicated staff in MOE coordinating adaptation research and expertise across government. |
| 2014 and beyond |
|
3. Promote water conservation
| Year | Status |
|---|---|
| 2011 |
|
| 2012 |
|
| 2013 |
|
| 2014 and beyond |
|
4. Review the Ontario low water response program
| Year | Status |
|---|---|
| 2011 | |
| 2012 | Scanned and digitized historic groundwater levels (1966-1980) to lengthen PGMN period of record. |
| 2013 | Revising methodologies to select monitoring wells, mapping groundwater drought susceptibility and streamlining program delivery. |
| 2014 and beyond |
|
5. Consider climate change impacts in the building code
| Year | Status |
|---|---|
| 2011 | MOE started working with MMAH and industry stakeholders to promote changes to the Building Code that would increase resiliency in light of a changing climate. Public, technical and stakeholder consultations on potential changes to the Code took place in 2010-2011. |
| 2012 | Currently reviewing input received on potential changes to the next edition of the Building Code. These changes potentially include updated climatic data on which design parameters for buildings are determined. |
| 2013 | Implementation of any new Building Code requirements apart from major changes to the Building Code which justify a "new edition", interim amendments to the Building Code can be made as required. This will allow the Building Code to adopt new scientific and technical information as it becomes available for the design of new construction. |
| 2014 and beyond | Ongoing implementation of any new Building Code requirements. |
6. Undertake infrastructure vulnerability assessments
| Year | Status |
|---|---|
| 2011 | Completed the assessments and final report. |
| Year | Status |
|---|---|
| 2011 | Complementary Actions: Assessed intensity, duration, frequency (IDF) curves for climate change to support risk management and decision-making. |
| 2012 | Complementary Actions: Supported the City of Welland to update the local rainfall IDF curve and to complete a climate change engineering risk assessment for wastewater, combined sewage and stormwater infrastructure on the city- wide scale. |
| 2013 | Complementary Actions:
|
| 2014 and beyond | Complementary Actions:
|
7. Build climate change adaptation into Ontario’s 10-year infrastructure plan
| Year | Status |
|---|---|
| 2011 | Released Building Together, the province’s long-term infrastructure plan, on June 24, 2011. A key part of the plan is the requirement that asset management plans prepared by the province or transfer payment partners such as universities, municipalities and social service agencies will have to show how climate change adaptation was considered in the project design. |
| 2012 | Implementation will continue over the ten-year span of Building Together. |
| 2013 | Implementation will continue over the ten-year span of Building Together. |
| 2014 and beyond | Implementation will continue over the ten-year span of Building Together. |
8. Integrate climate change impacts into the environmental assessment (EA) process
| Year | Status |
|---|---|
| 2011 | |
| 2012 | Draft EA Guidance under development. |
| 2013 | Once complete, draft EA Guidance to be posted on Environmental Registry for public consultation. EA Guidance to be finalized and publicly released following consultation period. |
| 2014 and beyond |
|
9. Integrate adaptive solutions into drinking water management
| Year | Status |
|---|---|
| 2011 |
|
| 2012 | Training on integrating climate change information into drinking water protection. Climate change integration pilots completed. |
| 2013 | Risk Management and Climate Change Evaluation Process for Drinking Water Quantity Risk finalized. |
| 2014 and beyond | Adaptation will be incorporated into the Assessment Reports and source protection plans in high risk areas. |
10. Develop guidance for stormwater management
| Year | Status |
|---|---|
| 2011 | Supported the City of Hamilton to develop municipal document for stormwater source control including climate change adaptation measures in planning/approval of industrial/business parks. |
| 2012 | Hamilton’s municipal guidance document completed in Spring 2012 with municipal training anticipated for mid-2012. |
| 2013 | Reviewing for potential broad implementation across Ontario. |
| 2014 and beyond | Potentially expanded number of Ontario municipalities will be incorporating stormwater source control as adaptation measures in planning/approval of industrial/business parks, as appropriate. |
11. Strengthen the winter road network
| Year | Status |
|---|---|
| 2011 | Winter road 2011-12 season ended March 15, 2012; Roads opened to light traffic January 2012. Full loads February 15 to March 15, 2012. Construction and operation of 3,000 km winter road system that links 30 communities to provincial highway or rail system. |
| 2012 | Will contribute up to $4.7 million in 2012-13 to help isolated communities build winter roads. Some First Nation communities have completed studies to move winter roads to high ground for future all season roads. |
| 2013 | Continue to work with Federal Government and First Nation communities towards moving winter roads to high ground winter roads and future all season roads. MNDM will continue to provide financial assistance towards the cost to construct winter roads. |
| 2014 and beyond | Continue to work with Federal Government and First Nation communities towards moving winter roads to high ground winter roads and future all season roads. MNDM will continue to provide financial assistance towards the cost to construct winter roads. |
12. Protect animal health
| Year | Status |
|---|---|
| 2011 |
|
| 2012 |
|
| 2013 |
|
| 2014 and beyond | Continuing participation and contribution to national animal disease surveillance. |
13. Protect plant health
| Year | Status |
|---|---|
| 2011 |
|
| 2012 |
|
| 2013 |
|
| 2014 and beyond |
|
14. Encourage business risk-management approaches
| Year | Status |
|---|---|
| 2011 |
|
| 2012 |
|
| 2013 |
|
| 2014 and beyond |
|
15. Pilot adaptation strategies in the tourism sector
| Year | Status |
|---|---|
| 2011 | Ministry of Tourism, Culture and Sport explored opportunities to address and raise awareness of climate change impacts with the tourism industry. |
| 2012 | On-going. |
| 2013 | On-going. |
| 2014 and beyond | On-going. |
16. Conserve biodiversity and support resilient ecosystems
| Year | Status |
|---|---|
| 2011 |
|
| 2012 |
|
| 2013 | |
| 2014 and beyond |
17. Undertake forest adaptation assessment
| Year | Status |
|---|---|
| 2011 | Assisted migration papers developed by CCFM were featured in a special edition of Forestry Chronicle in December 2011. A set of case studies from jurisdictions across the country will document vulnerability assessments that have occurred and are occurring in Canada. |
| 2012 |
|
| 2013 |
|
| 2014 and beyond | Continuing research to understand potential impacts of climate change and extreme weather events on our forests. |
18. Build adaptation into great lakes agreements
| Year | Status |
|---|---|
| 2011 | Build adaptation into Great Lakes agreements. |
| 2012 | Negotiated a new Canada-Ontario Agreement Respecting the Great Lakes Basin Ecosystem (COA), which includes commitments to climate change adaptation. New COA drafted; posted to the Environmental Registry for public comment. |
| 2013 | Anticipating new COA signed; implementation begins. |
| 2014 and beyond | Ongoing implementation of new COA commitments. |
19. Examine climate change impacts on fisheries
| Year | Status |
|---|---|
| 2011 | MNR Climate Change Research Reports made available online include:
|
| 2012 | Continued science and research to examine changing climate conditions on fish populations, fitness, spawning, invasive species and food webs. |
| 2013 | Interactive web-based mapping tools to be completed to explore fish sensitivity to climate change. |
| 2014 and beyond |
20. Develop the lake simcoe adaptation strategy
| Year | Status |
|---|---|
| 2011 | Developed draft Lake Simcoe Adaptation Strategy. |
| 2012 |
|
| 2013 | |
| 2014 and beyond |
21. Increase awareness of land use planning tools
Climate change and sustainable land use planning considerations and practices are being incorporated into education and training outreach products and activities to the municipal sector.
| Year | Status |
|---|---|
| 2011 | Webinar for municipal sector. |
| 2012 | Completion date for webinar to be determined — target of Fall 2012. |
| 2013 | |
| 2014 and beyond |
22. Integrate adaptation policies into the provincial policy statement
| Year | Status |
|---|---|
| 2011 | Provincial Policy Statement Review underway. |
| 2012 | PPS Review ongoing; analysis and consideration of the need for revisions, including climate change policy. |
| 2013 | Anticipated completion of revised PPS, subject to government approvals and timing considerations;
|
| 2014 and beyond | Continuing implementation of revised PPS. |
23. Consider climate change in the growth plan for Northern Ontario
| Year | Status |
|---|---|
| 2011 | Worked with all communities, all orders of government, and all sectors of Northern Ontario to implement the Growth Plan for Northern Ontario, a 25-year strategic framework to guide provincial investment and policy decisions in Northern Ontario. The environment chapter includes policies recognizing the need for climate change mitigation and adaptation, which are of particular importance in Northern Ontario. |
| 2012 | Climate change mitigation and adaptation considered as initiatives were developed that advance policies identified in the Growth Plan for Northern Ontario. Implementation on-going. |
| 2013 | Climate change mitigation and adaptation will be considered as initiatives are developed that advance policies identified in the Growth Plan for Northern Ontario. Implementation on-going. |
| 2014 and beyond | Climate change mitigation and adaptation will be considered as initiatives are developed that advance policies identified in the Growth Plan for Northern Ontario. Implementation on-going. |
24. Raise awareness about health hazards of climate change
| Year | Status |
|---|---|
| 2011 | Monitored public health impacts of climate change. |
| 2012 |
|
| 2013 | Completion date to be determined. |
| 2014 and beyond |
25. Raise public awareness of lyme disease
| Year | Status |
|---|---|
| 2011 | 2011 Lyme disease strategy included continued human and tick surveillance, tick control and public education. |
| 2012 | Ongoing human and tick surveillance, tick control and public education. |
| 2013 | |
| 2014 and beyond |
26. Update intensity-duration-frequency (IDF) curves
| Year | Status |
|---|---|
| 2011 |
|
| 2012 |
|
| 2013 | Continuing improvement of the IDF curve to incorporate changes in science and technology. |
| 2014 and beyond |
|
27. Update the environmental farm plan program
| Year | Status |
|---|---|
| 2011 |
|
| 2012 |
|
| 2013 |
|
| 2014 and beyond | On-going. |
28. Provide community outreach and training
| Year | Status |
|---|---|
| 2011 | Ontario Centre for Climate Impacts and Adaptation Resources, in partnership with Clean Air Partnership, received funding from MOE through a Transfer Payment agreement, the Community Adaptation Initiative, at a value of $460,000 over two years (2010-2012). |
| 2012 | Final year of funding Community Adaptation Initiative. Adaptation tools and information developed over the last two years were made available at the Climate Ontario website. |
| 2013 | Continuing to provide outreach and training to practitioners through presentations and conferences. |
| 2014 and beyond |
29. Develop the far north land use strategy
| Year | Status |
|---|---|
| 2011 | Five communities completed land use plans with Ontario — Pikangikum, Cat Lake, Slate Falls, Pauingassi and Little Grand Rapids. The joint Cat Lake-Slate Falls Community Based Land Use Plan recognized the need to understand and adapt to climate change. These plans were jointly approved by the respective First Nations and the Minister of Natural Resources under the Far North Act, 2010. |
| 2012 | 27 other Far North communities began the initial steps in community based land use planning, e.g., community meetings, mapping their Aboriginal Traditional Knowledge, working with MNR on preparing terms of reference for planning. |
| 2013 | |
| 2014 and beyond |
30. Incorporate climate change into curriculum
| Year | Status |
|---|---|
| 2011 | Revised elementary and secondary curriculum policy documents using the Standards for Environmental Education in the Curriculum to ensure increased focus on environmental issues such as climate change and its impacts. An emphasis on critical thinking, problem solving, collaboration and other skills will help students address environmental issues as knowledge expands. In addition to the curriculum policy documents, learning resources which support environmental education were made available to all of Ontario’s 5,000 English and French-language schools. |
| 2012 | On-going. |
| 2013 | On-going. |
| 2014 and beyond | On-going. |
31. Enhance climate-related monitoring
| Year | Status |
|---|---|
| 2011 | |
| 2012 | Completed water monitoring site installation in the Spring of 2012. Through COA, funding was provided to assess Lake Superior watersheds for integrated monitoring. Additionally, MNR enhanced water monitoring in the Far North. A review of land use criteria and priority ranking for stream gauges was completed and 10 stream gauges were installed. MOE continued monitoring efforts in the Far North (e.g., carbon flux monitoring) and under the Ontario Forest Biomonitoring Network. |
| 2013 | Collecting and sharing of data with stakeholders and general public. Pursuing collaborative opportunities for all monitoring networks. Development of integrated data analyses. Pursuing opportunities for network enhancement with focus on the Far North. MNR will share recommendations for enhancements to climate change monitoring where necessary. MOE will continue monitoring efforts in the Far North (e.g., carbon flux monitoring) and under the Ontario Forest Biomonitoring Network. |
| 2014 and beyond | Collection of data, sharing data with stakeholders/general public. Continue monitoring efforts in the Far North and under the Ontario Forest Biomonitoring Network. Development of integrated data analyses. Pursuing opportunities for network enhancement with focus on the Far North. |
32. Undertake climate impact indicators study
| Year | Status |
|---|---|
| 2011 |
|
| 2012 | Created baseline indicators using trends data already collected. |
| 2013 | Results of climate indicators including economic/ecological data will be included in annual report. |
| 2014 and beyond | New indicators will be added as appropriate as data becomes available, including agriculture, tourism and infrastructure. |
33. Undertake research partnerships for climate modelling
| Year | Status |
|---|---|
| 2011 | Invested over $1M from 2008-2011 for regional climate modelling with partners. Outcomes include:
|
| 2012 |
|
| 2013 |
|
| 2014 and beyond |
|
34. Establish an OPS climate modelling collaborative
| Year | Status |
|---|---|
| 2011 | Established an OPS Climate Modelling Collaborative made up of senior representatives from 10 ministries and five agencies. |
| 2012 | Established Strategic Assistant Deputy Ministers Steering Committee established to consider path forward. Quarterly meetings of the OPS Climate Modelling Collaborative were held to identify gaps and synergies. |
| 2013 | Reviewing effectiveness of the Collaborative in mainstreaming climate modelling into ministry decisions and long-term plans. |
| 2014 and beyond |
35. Establish and lead Ontario’s Regional Adaptation Collaborative (RAC) and Participate in NRCAN adaptation platform and working groups
| Year | Status |
|---|---|
| 2011 | Ontario RAC is established - seven projects led by three ministries and seven external partners were successfully rolled out across Ontario. |
| 2012 |
|
| 2013 | Adaptation Platform to bring together national industry associations, national professional organizations, representatives from federal, provincial and territorial governments, as well as other relevant organizations to address shared adaptation priorities. Key sectors to be addressed in 2012-2013 include mining and metals, forests, coastal management, economic analysis and measuring progress on adaptation. |
| 2014 and beyond | Adaptation Platform Regional Adaptation Collaborative (RAC 2) ongoing from 2012 to 2016. |
36. Work with the canadian council of ministers of the environment and canadian council of forest ministers
| Year | Status |
|---|---|
| 2011 | Completed and released a series of papers in a special edition of the Forestry Chronicle journal in December 2011 focusing on assisted migration. Complementary outreach with forestry practitioners in fall 2011 and winter 2012. |
| 2012 |
|
| 2013 | Development of tools for climate change monitoring of the cryosphere, i.e. monitoring of permafrost, sea ice, glaciers, and other factors important to the North. |
| 2014 and beyond |
37. Participate in the territorial approach to climate change (United Nations Development Programme)
| Year | Status |
|---|---|
| 2011 |
|
| 2012 |
|
| 2013 | Preparation of the Regional Climate Profile and identification of early 'no regrets' actions. |
| 2014 and beyond | Integrated Territorial Climate Change Plan developed, including identification of priority mitigation and adaptation needs. |
Additional initiatives
Ontario public service green transformation strategy
| Year | Status |
|---|---|
| 2011 | Continued to reduce Ontario Public Service carbon footprint focusing on energy conservation through reduced consumption in travel and fuel use, print devices and paper, e-business transformation and other areas. All ministries implemented multi-year green plans to embed greening into their business practices. |
| 2012 | Continued to reduce energy consumption, adopt clean energy solutions, implement innovative business processes and empower staff. |
| 2013 | Expanding engagement with the broader public service and other partners to create a greener public sector. |
| 2014 and beyond | Continuing to reduce Ontario public service carbon footprint by increasing environmental and fiscal efficiency. |
Dam safety guidance
| Year | Status |
|---|---|
| 2011 | Updated Ontario dam safety standards by releasing updated technical guidelines and best management practices through a policy decision notice on the Environmental Registry in August 2011. |
| 2012 | The Administrative Guide for the Lakes and Rivers Improvement Act, technical bulletins and best management practices will ensure safe design, construction and operation of dams. There are currently six technical bulletins and two best management practices. |
| 2013 | |
| 2014 and beyond |
Technical Appendix C: Assurance Statement
Attachment A: Assurance Statement
Based on the methods, data sources, and assumptions used to forecast Provincial GHG emissions for the Ontario Climate Change Action Plan 2010-11 Annual Report, the forecasted business as usual emissions for Ontario are a fair representation of those expected using current best practices in GHG emissions forecasting. Further, based on those methods, data sources and assumption used to model GHG reductions for the fifteen initiatives in the 2011 Annual Report, the estimated future annual GHG emissions reductions are a fair representation of forecasted annual GHG emissions reductions that would be expected using current best practises in the evaluation of GHG mitigation programs.
Dr. Chris Bataille
Lead Validator, Navius Research Inc.
Footnotes
- footnote[1] Back to paragraph All figures in this appendix are rounded, which may therefore not produce the exact results indicated for totals, ratios, etc.
- footnote[2] Back to paragraph In June 2012, British Columbia released their Greenhouse Gas Inventory Report 2010, in which they identified a significant discrepancy in the "Fossil Fuel Production and Refining" line item of the 1990-2010 NIR. As the discrepancy was due to a data automation issue that was not identified before the NIR was published, this appendix uses a revised estimate for B.C. (and therefore total Canadian) emissions: an increase of 3037.5 kiltotonnes CO2 eq in 2010.
- footnote[3] Back to paragraph The most significant methodological change was in how ethanol in blended gasoline is both reported and forecast. In the last report, the NIR data used did not account for ethanol in motor gasoline and the model did not forecast emission reductions from higher ethanol blending due to Ontario’s ethanol regulation (although in place at the time). A change to using an average of historical emission factors of coal in generating electricity also significantly increased the BAU emissions from electricity, as recommended by the validator.
- footnote[4] Back to paragraph The regional transportation plan is an official long-term plan, produced by Metrolinx. However, capital projects are approved and funded individually as the plan is implemented over 25 years and may be subject to change. Therefore, modelling for this initiative is inherently more uncertain than for other initiatives.