The chemical water quality of Lake Nipissing
This report describes the chemical changes that have been noted in Lake Nipissing.
For more information:
Ministry of the Environment and Climate Change
Public Information Centre
Email: picemail.moe@ontario.ca
Website: Ministry of the Environment and Climate Change
Executive Summary
Lake Nipissing is a productive water body and is highly valued as a recreational lake in Ontario. We report that the water chemistry of Lake Nipissing has not changed appreciably over the past 15 years. The small changes that were observed in Lake Nipissing have been reported for many smaller lakes throughout Ontario. These changes are primarily the result of regional impacts such as drought and acidification of watershed soils (causing changes in phosphorus concentrations), reduced deposition of sulphur (resulting in lower lake sulphate concentrations), and the continued application of road salt. Despite the minimal changes reported throughout the main basin of Lake Nipissing, the current water quality of Cache and Callander Bays is significantly different, and is characterized by higher nutrient levels.
Introduction
A major role of the Inland Lakes Group (Ministry of the Environment, Dorset Environmental Science Centre (DESC) is to update existing water quality databases that pertain to large inland lakes in Ontario. These water bodies, including Lake Nipissing, have significant recreational and commercial value. The chemical water quality of Lake Nipissing has been assessed several times since the early 1970s.
Intensive sampling was conducted by the Ministry of the Environment in 1975 with earlier sampling conducted in 1971 and 1974. Most of these data exist in technical reports that are not available in electronic format. Between 1988 and 1990 the Dorset Environmental Science Centre, Inland Lakes Group, sampled Lake Nipissing monthly throughout the ice-free season and compared the results of these investigations to data collected in the 1970s (Neary and Clark, 1992). The sampling locations, in most cases, were similar to those visited in the earlier studies to allow the observation of temporal trends. Similarly, in 2003 and 2004, volunteers were trained to collect water quality samples from a subset of these sample locations. Consequently, the lake has now been sampled intensively every 15 years (approximately). The Lake Nipissing data collected since 1988 by the Inland Lakes Group resides in the Oracle relational database housed at the DESC.
In this report, we present the most recent data and compare it to data collected during the 1988 to 1990 survey. Total phosphorus (TP) concentrations, in particular, are discussed relative to the thirty year record, thus providing additional insight into the conclusions offered by Neary and Clark (1992) that TP concentrations measured between 1988 and 1990 were lower than those observed in 1975 in Lake Nipissing.
The chemical water quality of Lake Nipissing has changed either very little or has responded predictably to external stresses such as acid rain and climate change. Similar changes in response to external impacts have been described in detail for Canadian Shield lakes in other areas of Ontario. This is outlined in separate sections of the report that discuss individual water quality parameters.
Study Area
Physical description of Lake Nipissing
The Hydrological Atlas of Canada (1978) lists Lake Nipissing as the seventh largest inland lake in Ontario (822 km2). The watershed drains 13,100 km2 and Nipissing itself is located in the sedimentary basin of glacial lake Algonquin. The maximum depth (52 m) is located in a relatively small basin close to the outflow of the French River, and the lake is otherwise less than 20 m deep (Zmean = 4.5 m). There are several enclosed bays. Two of these, Cache Bay and Callander Bay, have water chemistry that is dissimilar from the main, open water areas of the lake because of their proximity to major local inflows.
The Lake Nipissing Watershed
The Lake Nipissing watershed lies on Precambrian bedrock that is covered in many areas by deposits of sand and clay which are remnants of glacial Lake Algonquin. The watershed is drained by 12 major rivers (Neary and Clark 1992). Four of these rivers drain 71% of the total watershed area. These are: the Sturgeon R. (37%); Amateewakea R. (13%); South R. (11%); and Veuve R. (10%).
Sample locations
Sample locations for the 2003 to 2004 studies were maintained close to the sites sampled in previous surveys (Table 1). Four additional sites were sampled at the west end of the lake.
| Name | Latitude | Longitude | 1975 | 1988 to 1990 | 2003 to 2004 |
|---|---|---|---|---|---|
| Yellek Point | 461826 | 792947 | N1 | IG1 | IG1 |
| Beaucage Point | 462008 | 793926 | N2 | IG2 | IG2 |
| Meadowside | 462017 | 794533 | N3 | IG3 | IG3 |
| Dokis Point | 461742 | 795129 | N4 | IG4 | IG4 |
| Mouseau Point | 461908 | 795551 | N5 | IG5 | IG5 |
| Sturgeon River | 461819 | 795804 | N6 | IG6 | IG6 |
| Cache Bay | 462119 | 800022 | N7 | IG7 | IG7 |
| Manitou Island East | 461544 | 793226 | E23 | IG8 | IG8 |
| Callander Bay | 461244 | 792321 | E24 | IG9 | IG9 |
| Second Rocky Point | 461408 | 792925 | E25 | IG10 | IG10 |
| North Bay Diffuser | 461723 | 792844 | n/a | IG11 | IG11 |
| Campbell’s Point | 461252 | 794704 | S16 | IG12 | IG12 |
| Cross Point | 461328 | 794313 | S14 | IG13 | IG13 |
| Jessop Island West | 460902 | 793521 | S19 | IG14 | IG14 |
| 14B | 460808 | 793441 | n/a | n/a | 14B |
| South Bay, Durrell Pt. | 461157 | 793716 | S20 | IG15 | IG15 |
| Hardwood Island N. | 461908 | 800611 | W9 | IG16 | IG16 |
| Gull Island E. | 461739 | 800656 | W10 | IG17 | IG17 |
| Hay Narrows | 461416 | 800553 | W11 | IG18 | IG18 |
| West Bay | 461500 | 800908 | W12 | IG19 | IG19 |
| Little Oak Island E. | 461657 | 800155 | C8 | IG20 | IG20 |
| Iron Island W. | 461650 | 795759 | C14 | IG21 | IG21 |
| Iron Island E. | 461539 | 795124 | C15 | IG22 | IG22 |
| Manitou Island W. | 461603 | 793760 | C21 | IG23 | IG23 |
| Burritt Island S. | 461657 | 794219 | C22 | IG24 | IG24 |
| Chaudiere Dam | 460904 | 795939 | F1 | IG25 | IG25 |
| Little Chaudiere Dam | 460948 | 800344 | F2 | IG26 | IG26 |
| Hwy 535 | 461509 | 802552 | n/a | n/a | Hwy 535 |
| Cross Lake | 461550 | 802804 | n/a | n/a | Cross Lake |
| Musky Bay | 461737 | 802231 | n/a | n/a | Musky Bay |
| Warren Bay | 461339 | 801941 | n/a | n/a | Warren Bay |
Sample methods
Water samples were collected in 2003 and 2004 by trained volunteers who live or cottage near the lake. Additional samples were collected in June, 2005 by Dorset Environmental Science Centre (DESC) staff. Generally, the sample collection protocols followed those outlined in Ingram (2006). Briefly, samples were collected as composites of the mixed layer by integrating water from the top 5m using a weighted, high-density-polyethylene, composite bottle. At shallow locations, composites were taken in the top half of the water column. All samples except chlorophyll were coarse filtered (80-µm) to remove large zooplankton. Samples were refrigerated and sent to the chemistry lab at DESC as soon as possible. The water samples were analysed for total inflection point alkalinity, aluminum (Al), calcium (Ca), chlorophyll a (Chl a), chloride (Cl), true colour, conductivity (Cond), dissolved organic and inorganic carbon (DOC, DIC), iron (Fe), potassium (K), magnesium (Mg), manganese (Mn), sodium (Na), ammonia (NH4), nitrate (NO3), total Kjeldahl nitrogen (TKN), pH, total phosphorus (TP), sulphate (SO4), and silica (SiO3) (MOE, 1996). Temperature and Secchi depth measurements were made on each visit to the sampling locations.
Chemical water quality
The detailed results of the water quality analysis are shown in Appendix 1. A useful method to assess water quality measurements is to compare the values to those observed in lakes elsewhere. This approach is useful only if the distribution of concentrations for the parameters in question is known for a large number of typical or "normal" lakes for a given geographic or geological area. The water quality of Lake Nipissing is shown relative to other lakes on the Canadian Shield in Ontario. In this report, histograms that show the percent distribution of lakes for the individual water quality parameters are shown as vertical bars. These data are from the MOE inland lakes database which includes information from more than 7000 lakes throughout Ontario. The number of observations for each parameter and the number of lakes sampled for each parameter are summarized in Table 2. It is important to note that all available data for individual lakes has been averaged for each parameter (n varies) but the data for individual lakes are not necessarily collected from the same years. Alkalinity data, for example, was collected more frequently in the early 1980's whereas phosphorus data has been collected more frequently in recent years (Figure 3). Thus, the data are representative of a long-term mean water quality for the lakes on the Precambrian Shield.
Each water chemistry parameter studied is described in the sections that follow. The data from the Ontario Inland Lakes Database were used to create histograms for each water chemistry parameter. The ice-free mean concentrations (from 2003-04) for Lake Nipissing (excluding Callandar and Sturgeon Bays) is indicated on each histogram as a thick arrow, whereas the means for Callandar and Sturgeon Bays are indicated by thin arrows because, in some cases, they are substantially different than the lake-wide means (e.g., Figure 4).
Lake Nipissing, ice-free-average values are based on the most recent 2003-04 data, with the exception of some parameters (e.g., Secchi depth) where we present the 2003-04 data relative to earlier surveys to assess water quality trends through time.
| Parameter | # Observations | # Lakes |
|---|---|---|
| alkalinity (total inflection) | 8441 | 5941 |
| aluminum | 4546 | 3304 |
| calcium | 5770 | 3807 |
| chloride | 2693 | 1230 |
| true colour | 1885 | 1090 |
| conductivity | 2125 | 480 |
| DOC | 4943 | 3084 |
| DIC | 1436 | 454 |
| Iron | 2890 | 1556 |
| Potassium | 4940 | 3412 |
| Magnesium | 5473 | 3711 |
| Manganese | 4357 | 3114 |
| Sodium | 4925 | 3399 |
| Ammonia | 3426 | 714 |
| Nitrate | 3398 | 712 |
| TKN | 6850 | 1524 |
| pH | 8587 | 6009 |
| total phosphorus | 17754 | 2093 |
| sulphate | 5354 | 3663 |
| silica | 1601 | 427 |
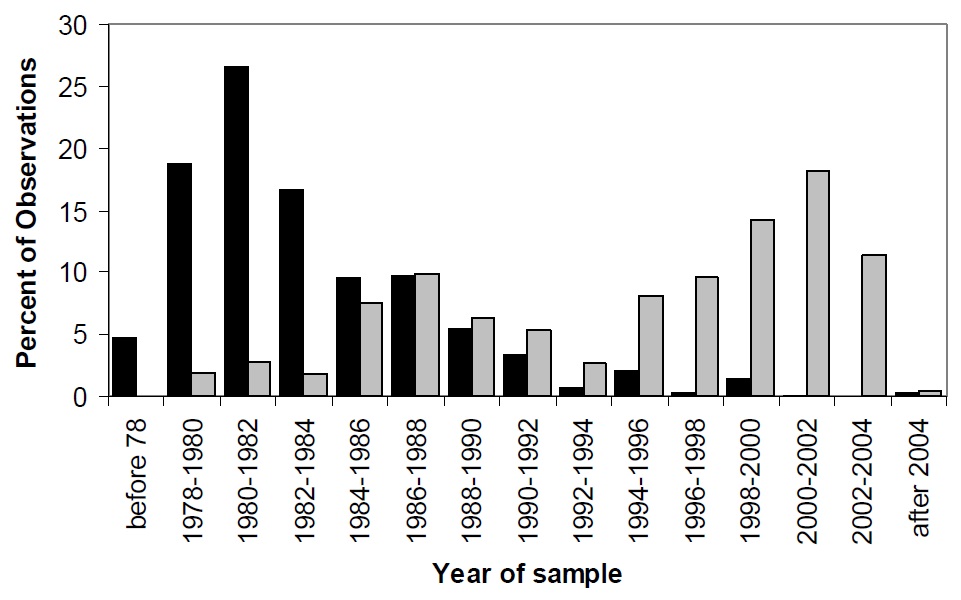
Figure 3. Sample date distribution for selected parameters in the Inland Lakes Database. Solid bars show the distribution of sample dates of alkalinity and grey bars for phosphorus.
Trophic Status Parameters
For lakes on the Canadian Shield, trophic status is usually inferred or indexed using some measure of nutrients (usually phosphorus), chlorophyll or water clarity. Water clarity in most Ontario lakes is controlled by a combination of algal biomass, water colour, which is primarily a result of the export of dissolved organic carbon (DOC) from wetlands, and suspended matter (e.g., sediments) in the water column. The presence of DOC may complicate interpretations of trophic status because the humic substances that comprise DOC may bind with the phosphorus compounds, thus reducing phosphorus availability to phytoplankton (Stewart and Wetzel, 1982). Therefore, water clarity is not the most useful measure to assess the trophic status of Ontario lakes.
There is however, merit in tracking changes in water clarity because the portion of the light attenuation that is controlled by algal biomass can be influenced by human activity in the watershed. Since phosphorus is the nutrient that controls the growth of algae in most Ontario lakes, it is the preferred trophic status indicator. Increased phosphorus concentrations can lead to nuisance algal blooms and the loss of water clarity. Nitrogen fractions are also of interest because N is an essential algal nutrient and may influence the composition or types of algae that exist in the lake. Agricultural runoff and effluent from sewage treatment plants may be important sources of nitrogen to water bodies. However, nitrogen does not typically control algal growth in nutrient-poor lakes on the Canadian Shield.
There is relatively little information about production at higher trophic levels or the interaction between trophic levels in Lake Nipissing. Zooplankton communities were studied in the 1930s by Langford (1938) and Fry (1937) and recently by Filion et al. (2002). Aspects of fish community productivity were studied by the former MNR Nipissing Fisheries Assessment Unit and more recently by fisheries personnel at the North Bay MNR. Instead, most of what we know about primary production in this lake must be inferred from measures of total phosphorus concentrations, as described in the previous paragraph.
The following sections include: water quality observations to infer water clarity and algal biomass using Secchi depth and mixed-layer chlorophyll a concentrations, respectively; DOC and true colour measurements are included here to assess water colour and its impact on water clarity. Algal nutrient observations include total phosphorus, ammonium, nitrate and total Kjeldahl nitrogen.
Water Clarity
Water clarity in Lake Nipissing is lower than most lakes on the Canadian Shield (Figure 4). Water clarity is likely controlled by DOC (Figure 5) but some of the limited transparency may be due to the influence of wind mixing and sediment particle resuspension throughout the lake due to the extensive fetch (Neary and Clark 1992).
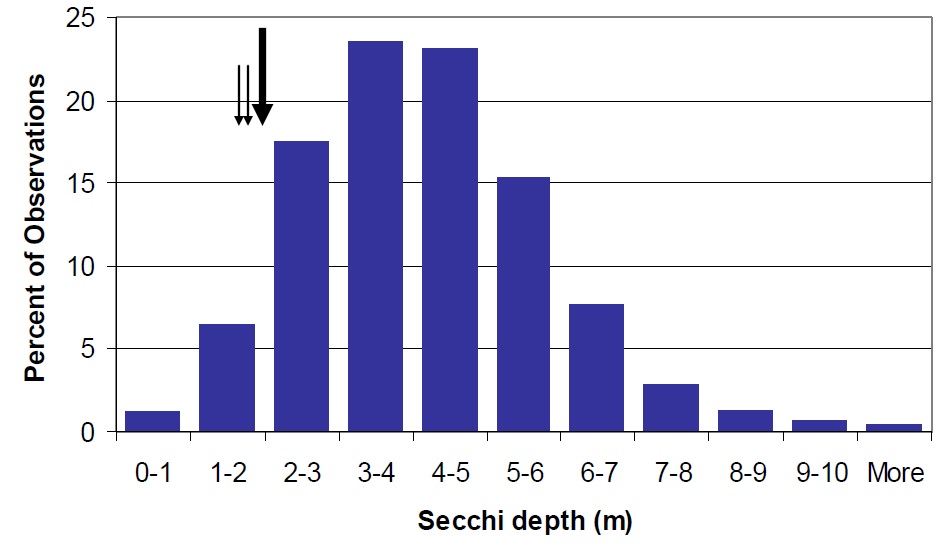
Figure 4. Distribution of Secchi depth in Ontario lakes shown as percent of the total observations in the MOE, Inland Lakes Database (vertical bars). Nipissing mean Secchi depth (2.2 m) is shown by the large arrow. Water clarity in Sturgeon Bay (1.7 m) and Callander Bay (1.9 m) is represented by the smaller arrows.
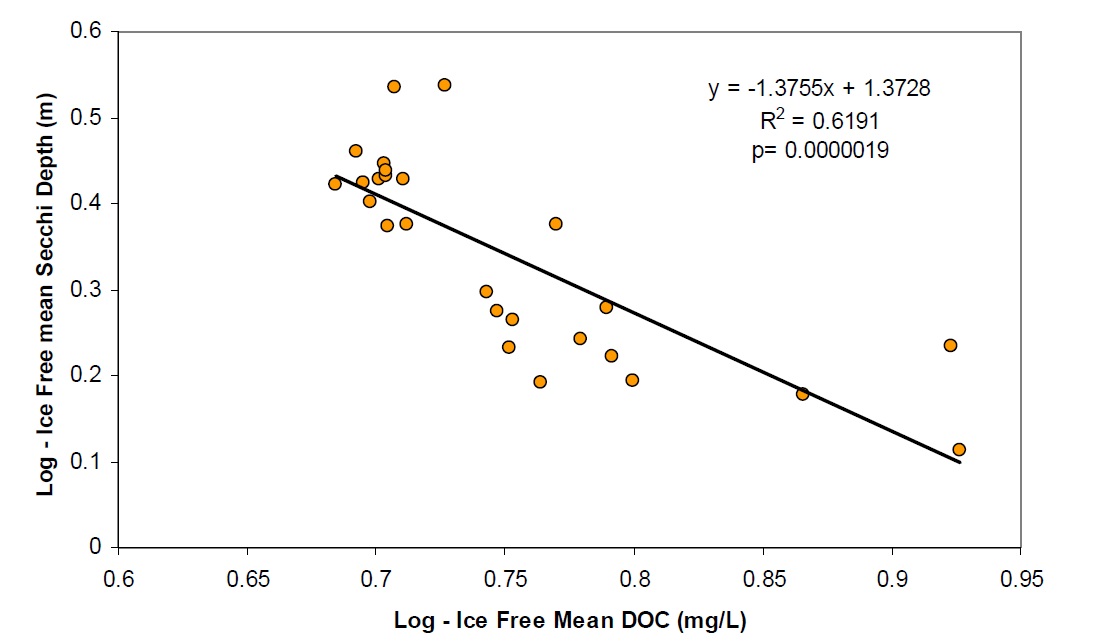
Figure 5. The relationship between DOC and water clarity in Lake Nipissing based on 88-90 data.
There have been some small changes in water clarity between the 1988-90 and 2003-04 sampling intervals. For stations where there are at least four years of Secchi data, the coefficient of variation (Standard Deviation ⁄ mean) between years is approx 0.4 m. Approximately half of the stations show changes that are greater than 0.4 m between the 1988 to 1990 and 2003-04 datasets. For example, there is some evidence that water clarity may have improved slightly some areas (e.g., Cache Bay (IG7) and Callander Bay (IG9)) and decreased in other areas of the lake (e.g., IG1, IG23, IG24; Table 3; Figures 6 through 9). It is important to note that the water clarity data collected in 2003-05 are not as comprehensive as the data collected earlier such that it is difficult to draw concrete conclusions from these data.
| Year | IG1 | IG6 | IG7 | IG9 | IG11 | IG12 | IG14 | IG15 | IG16 | IG19 | IG23 | IG24 | IG25 |
|---|---|---|---|---|---|---|---|---|---|---|---|---|---|
| 1988 to 1990 | 2.4 | 1.5 | 1.3 | 1.7 | 2.4 | 2.7 | 2.5 | 2.9 | 1.7 | 1.9 | 2.7 | 2.9 | 3.4 |
| 2003 to 2004 | 1.9 | 2.2 | 2.6 | 2.1 | 1.7 | 3.1 | 2.6 | 2.5 | 2.1 | 1.7 | 2.3 | 2.1 | 3.6 |
| Change (m) | −0.5 | 0.7 | 1.3 | 0.4 | −0.6 | 0.5 | 0.1 | −0.4 | 0.4 | −0.2 | −0.4 | −0.8 | 0.2 |
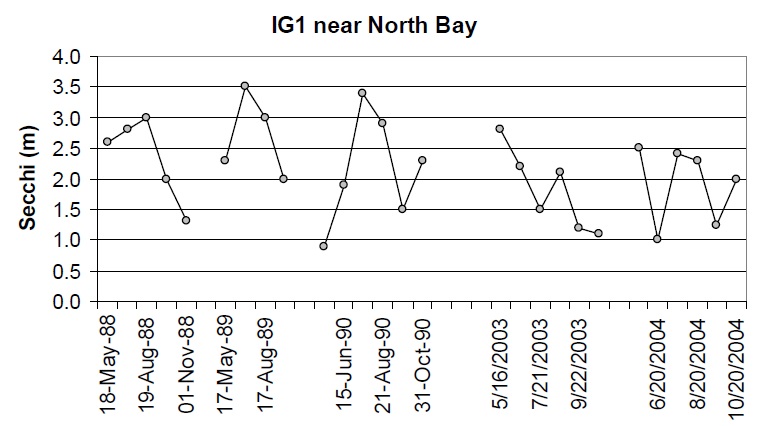
Figure 6. Water clarity observations at IG1 near North Bay between 1988 and 2004
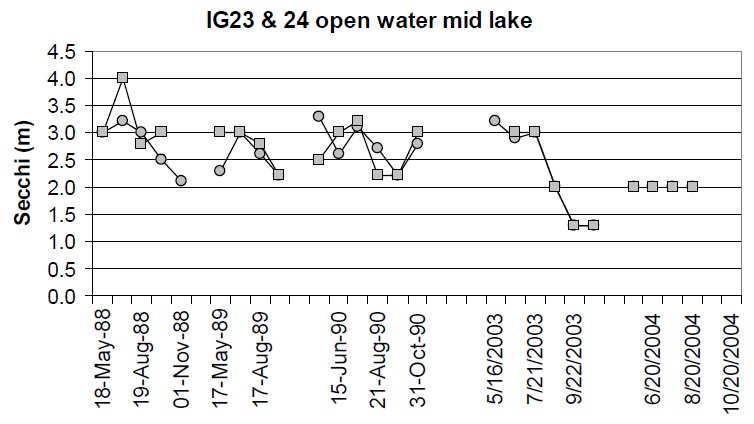
Figure 7. Water clarity observations at IG23 (circles) and IG24 (squares) in open water areas near the centre of the lake between 1988 and 2004.
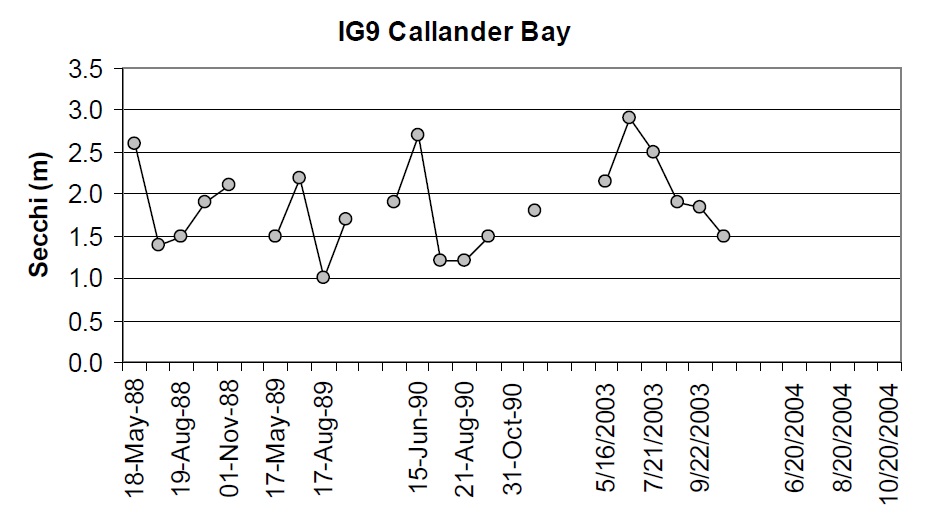
Figure 8. Water clarity observations at IG9 in Callander Bay between 1988 and 2003.
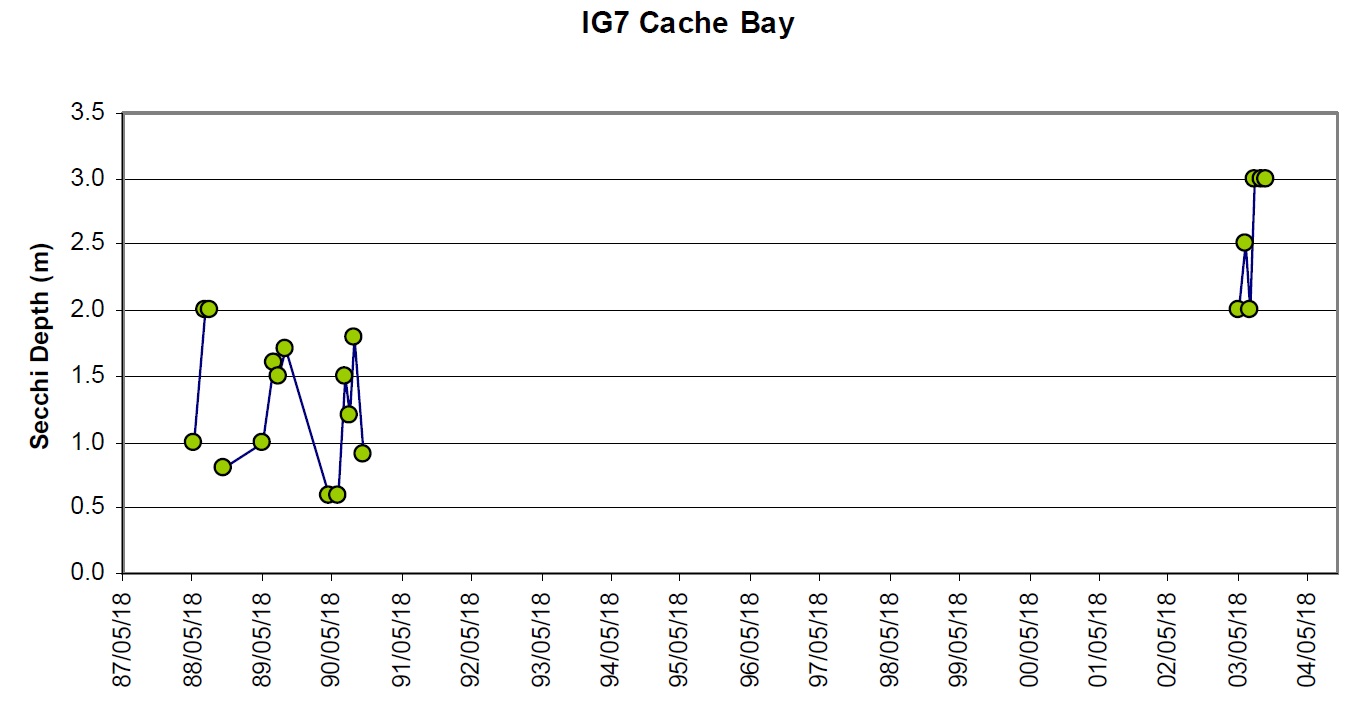
Figure 9. Water clarity observations at IG7 – Cache Bay between 1988 and 2003.
Chlorophyll a
Chlorophyll concentrations were not correlated to water clarity observations between stations in Lake Nipissing (Figure 10). Generally the chlorophyll concentrations are lower than expected in Lake Nipissing when compared to lakes with similar TP concentrations (i.e., Dorset-area lakes, Figure 11). The mean chlorophyll concentrations in Nipissing are normally 3 or 4 µg/L in open water areas. Dickie Lake, a Dorset, long-term study lake, with approximately the same DOC concentrations as Lake Nipissing (5 to 6 mg/L) had 9 to 10 µg/L Chl a in the mid 1970s when the TP concentrations were similar to those measured today in Lake Nipissing (15 µg/L). The reasons for this are unclear. It may be that: the algal community has not been representatively sampled; a significant portion of the lake’s algal biomass is represented by periphyton; the algal biomass may not be well represented by chlorophyll a; or, there may be some aspect of community clearance rates at one or more trophic levels that shift biomass in the lake quickly from one level to the next. Low silica concentrations may also be influencing algal production, as silica is an important nutrient for two components of the phytoplankton community, the diatoms and the chrysophytes. Many additional factors can have an effect on algal success. The effect of suspended sediments on light penetration could impact algal growth, or nutrients other than silica could be co-limiting at certain times of the year. It has been shown that relationships between nutrients, chlorophyll and water clarity are different for enriched shallow lakes than for the deeper and dilute lakes typically found on the Shield, and between mixed and stratified lakes (Riley and Prepas, 1985). In addition, it has been demonstrated that the presence of large zooplankton can cause shifts in the TP/Chl yield ratios (Mazumder 1994) but little is known about trophic interactions in Lake Nipissing.
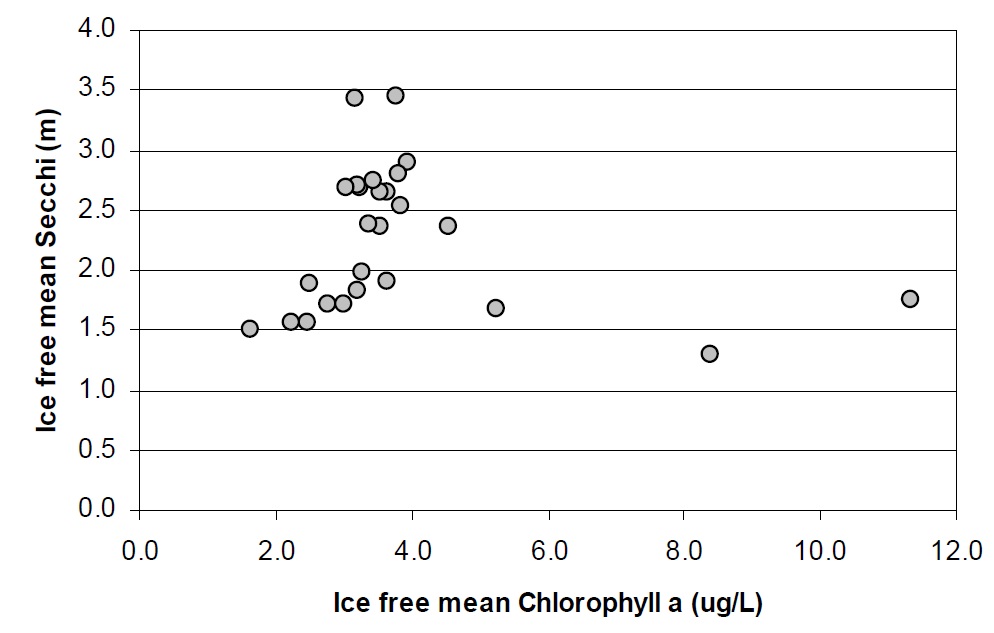
Figure 10. The relationship between Chlorophyll and water clarity between stations in Lake Nipissing based on 88-90 data.
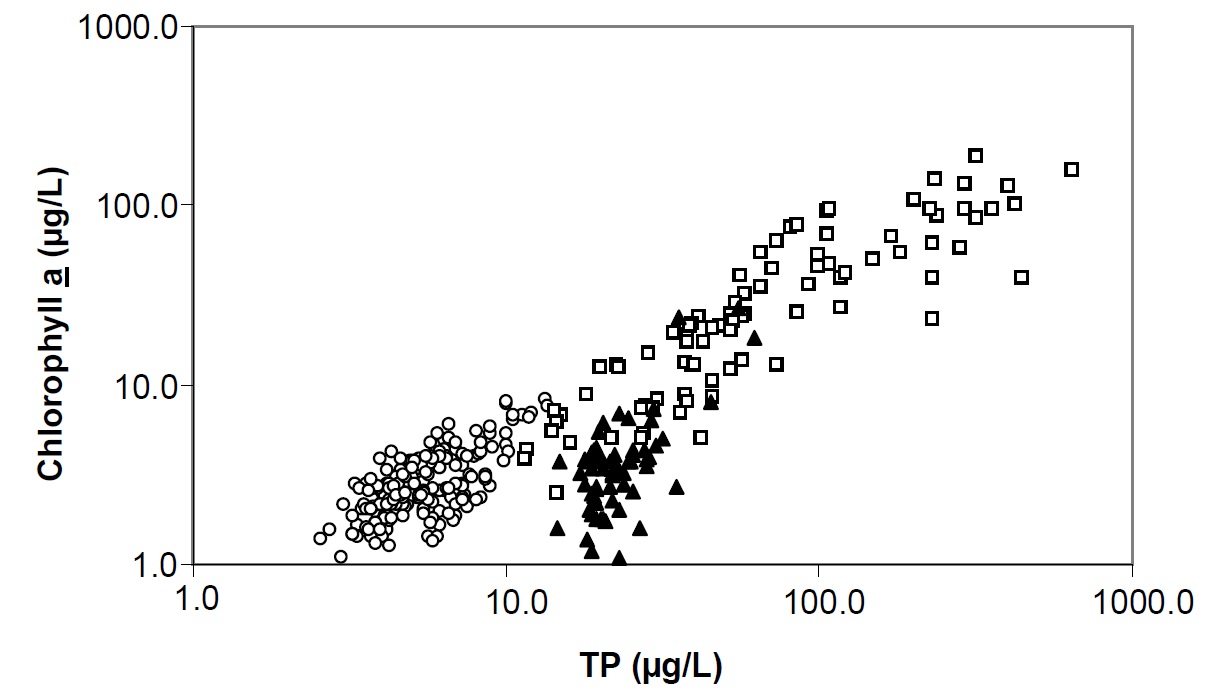
Figure 11. The relationship between mean annual total phosphorus (TP) and chlorophyll a for Dorset lakes (open circles) data published by Smith and Shapiro for North American lakes (open squares) and stations within Lake Nipissing (closed triangles). Note both axes are a log scale.
Total Phosphorus
Phosphorus is the nutrient that controls algal growth in most Ontario lakes. Attempts to describe the links between phosphorus concentrations and algal productivity in aquatic systems have led to the development of many methodologies to measure a wide variety of phosphorus fractions in surface water. Variations in the sample matrix make it difficult to standardize methods to measure dissolved or particulate fractions of phosphorus, or to isolate reactive forms with certainty that the samples will remain stable prior to analysis (Gardolinski et al., 2001). There are additional problems with the standardization of the terms used to describe various fractions of phosphorus in surface water (Jarvie et al., 2002). These problems have led many researchers to favor total phosphorus (TP) as a measure of productive capacity (Carlson and Simpson, 1996; Clark and Hutchinson, 1992). Samples analyzed for TP are digested to include both dissolved and particulate forms of phosphorus in the analysis. This eliminates some of the difficulties associated with interpreting data derived from fractionated samples (Clark et al. 2010). The relatively widespread measurement of TP will also allow comparison with samples collected elsewhere using similar methods.
TP concentrations in Lake Nipissing are higher than those observed for the majority of the lakes on the Canadian Shield (Figure 12). This is primarily a function of watershed geology. Lake Nipissing sits in the sedimentary basin of glacial Lake Algonquin and has more enriched and deeper soils in the watershed. These contribute to higher export of nutrients into the lake through tributary inflows. This is especially evident in areas where large rivers drain into enclosed embayments such as Cache Bay or Callander Bay. These bays are also shallow and may develop internal loads and be susceptible to nutrient cycling through extensive aquatic plant beds.
Lake Nipissing is essentially mesotrophic (10 to 20 µg/L) except for certain areas in the west end and in the enclosed bays (see Appendix 1). Water bodies with less than 20 µg/L total phosphorus are not expected to experience nuisance algal blooms.
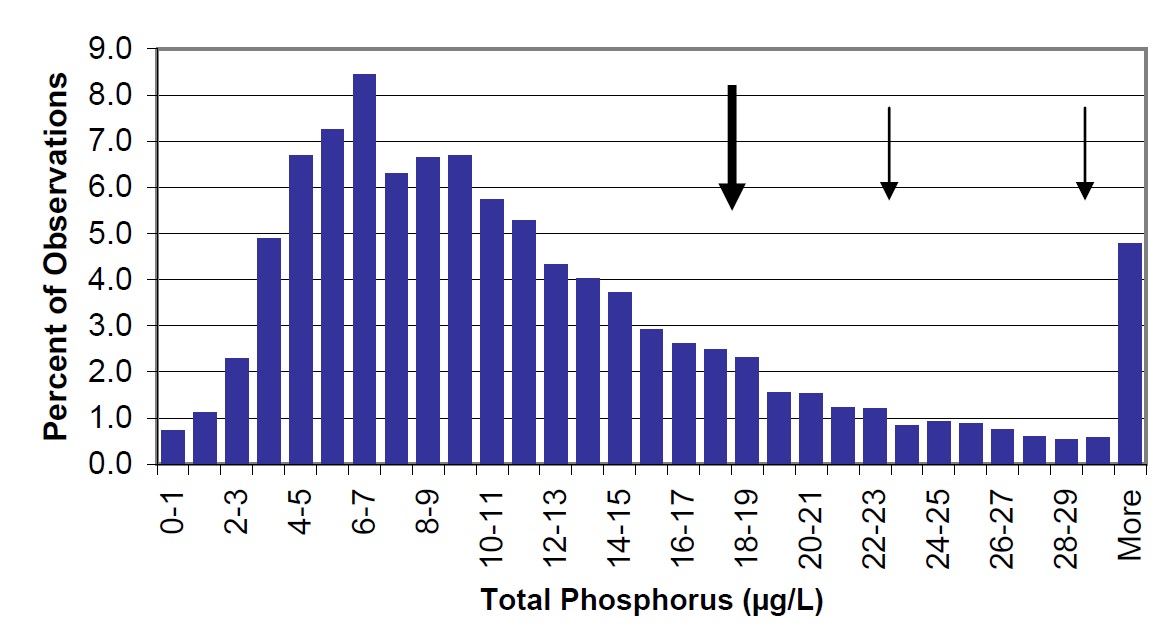
Figure 12. The distribution of total phosphorus concentrations in Ontario lakes (vertical bars) based on 6824 observations in the Inland Lakes Database. Lake Nipissing lake-wide average is 18 µg/L (large arrow) with 29 µg/L in Cache Bay and 22.6 µg/L in Callander Bay (small arrows).
An assessment of long-term changes in TP concentrations in Lake Nipissing reveals some interesting trends. In 1992, Neary and Clark noted that the TP concentrations measured between 1988 and 1990 were lower than those observed in the lake in 1975. They reasoned that these results were improbable and that the older data were likely in error. Since 1992 we have learned that the TP concentrations in many Ontario Shield Lakes have indeed declined, especially between 1975 and 1990. It is therefore conceivable that the earlier results were correct and that the TP concentrations in Lake Nipissing were lower in 1990 than in 1975.
It is also possible that this observed decline in total phosphorus in Lake Nipissing from 1975 to 1988 to 1990 was caused partly by sampling error, as the samples collected for TP in the 1988 to 1990 study were analysed by a private lab. A multi-lake comparison, conducted after the first Nipissing report (1990 to 1992), found that the TP concentrations measured by this private lab were approximately 35% lower than the Dorset lab results for a large number of lakes (Figure 13). Although this lab demonstrated adequate QA/QC for the test, water was collected into PET bottles and then subsampled prior to analysis. The loss of phosphorus by adsorption or through uptake by biofilms onto sample container walls is widely recognized and this may have biased the 1988-90 results (Clark et al. 2010). A more reliable method is to digest the TP samples in the same borosilicate glass tubes that are used to collect the samples. This is the method employed by the Dorset Environmental Science Centre Chemistry lab.
Summary of the TP data:
- The TP concentrations in Lake Nipissing have decreased since 1975 which is in line with the findings for lakes elsewhere in the province or;
- If the 1975 values were too high as suggested by Neary and Clark, then the concentrations have not changed substantially for most areas of the lake in 30 years.
Total phosphorus concentrations measured in 2003 to 2004 are again lower than those observed in 1975. Values are generally intermediate between the 1975 and 1988 to 1990 studies (Figure 14).
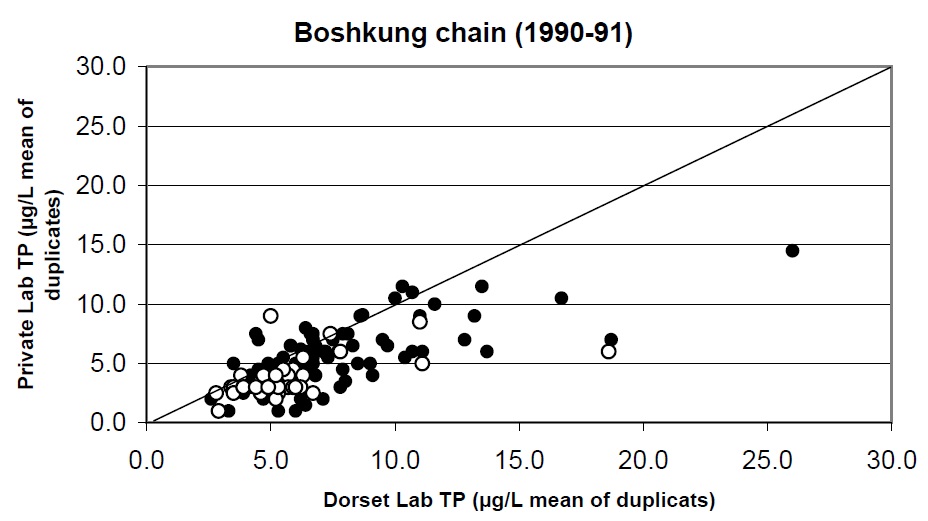
Figure 13. Comparison of total phosphorus analysis determined by the MOE Dorset lab and a private lab for a set of 50 lakes near Dorset in 1990 and 1991. Open circles represent fall data and closed circles are spring turnover samples. One to one line shown.
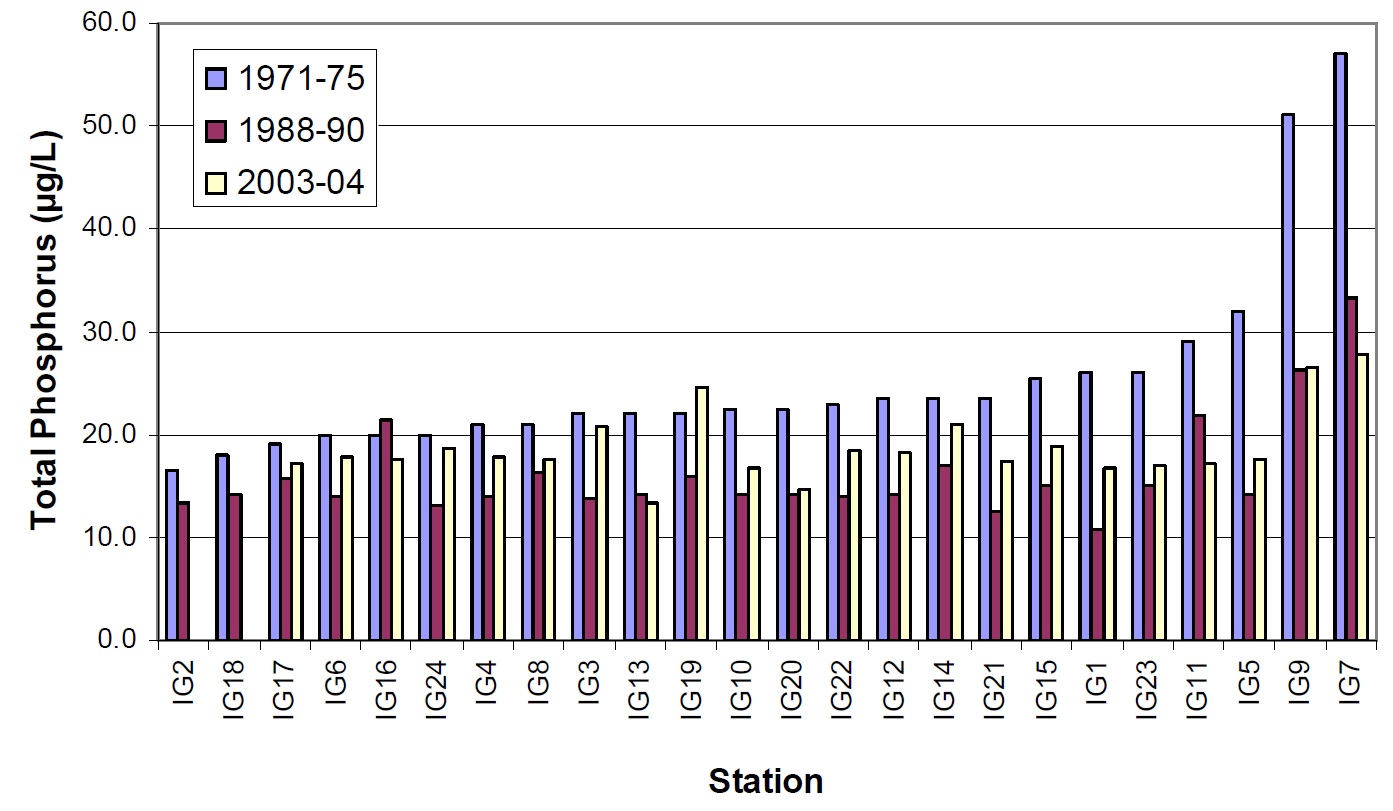
Figure 14. Total phosphorus concentrations observed for 24 stations in Lake Nipissing between 1975 (blue bars), 1988 to 1990 (red bars) and 2003 to 2004 (white bars).
It is possible that there have been substantial improvements since 1975 in areas such as Callander Bay or Cache Bay, where human impacts in the watershed may have influenced water quality. However, recently measured TP concentrations in these areas are still above 20 µg/L (Callander Bay = 22.6 µg/L, Cache Bay = 29.0 µg/L), which is the concentration above which nuisance algal blooms can be expected to occur. It is important to note that, as mentioned earlier, chlorophyll yield in Lake Nipissing is lower than expected for the measured total phosphorus concentrations. This is evident when comparing the TP/chl relationships between Lake Nipissing and lakes elsewhere on the Shield (see Figure 11). Filion, et al. (2003) noticed a similar decoupling in the expected trophic production for zooplankton. It may be that the Nipissing algal community would not respond to phosphorous concentrations in a manner similar to lakes elsewhere on the Shield. Generally, we do not know enough about production and trophic interactions in Lake Nipissing to comment further.
Nitrogen
Nitrogen (N) and nitrogen compounds are common in plant and animal material and in decomposition wastes, sewage, fertilizers and industrial discharge. Total Kjeldahl nitrogen (TKN), nitrate (NO3) and ammonia (NH4) were measured to assess nitrogen concentrations in the lake. TKN is an excellent measure of total nitrogenous matter including both live and dead plant and animal matter and represents the organic nitrogen that is present in the lake. Generally, the TKN concentrations in Nipissing are similar to those found in other lakes on the Canadian Shield (Figure 15). TKN concentrations are higher in Callander Bay (412 µg/L) and Cache Bay (592 µg/L).
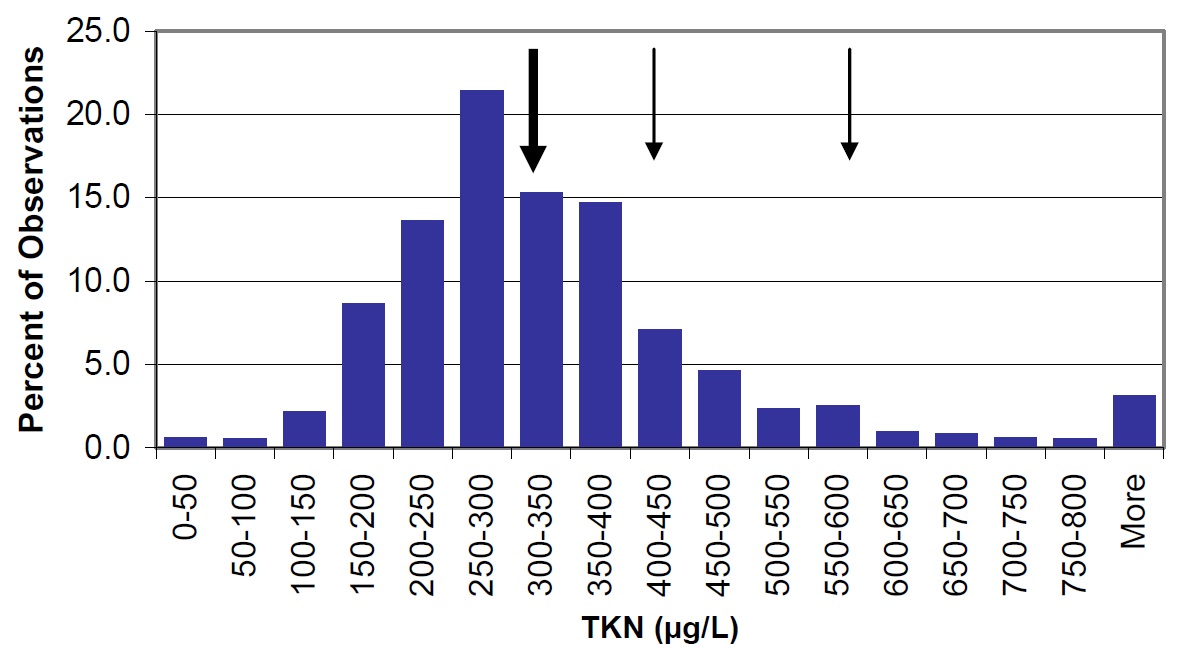
Figure 15. TKN concentrations in lakes throughout Ontario (vertical bars) and the mean in Lake Nipissing, shown by large arrow. Cache Bay (592 µg/L) and Callander Bay (412 µg/L) are shown by narrow arrows.
Concentrations of ammonium and nitrate in Nipissing are higher than most lakes on the Precambrian Shield, but the distribution of these parameters in Ontario lakes is generally skewed towards higher concentrations (Figure 16 & 17). In addition, ammonium and nitrate concentrations are slightly higher in 2003 to 2004 than in 1988 to 1990. To obtain reliable results, ammonium and nitrate samples must be kept cool, shipped to the laboratory as soon as possible, and analysed within seven days. If kept at room temperature, bacteria can convert organic nitrogen (TKN – NH4) to ammonia/ammonium (eventually resulting in an over-representation of ammonium in the sample). It is possible that sample handling times for the 1988-90 samples were extended beyond the seven day window, which could explain the higher ammonium concentrations in these years, relative to earlier samples. Samples collected in 1988-90 were collected via helicopter and were processed rapidly (within 2 days), in contrast to the more recent samples that were collected by volunteers and shipped by mail thereafter. However, sample perishability does not explain the higher concentrations of nitrate in 2003 to 2004 as compared to 1988-90. It should also be noted that higher inter-annual variability in both nitrate and ammonium concentrations have been observed in other Ontario lakes (e.g., near the Dorset Environmental Science Centre), indicating that long-term trends based on only two points should be interpreted with caution.
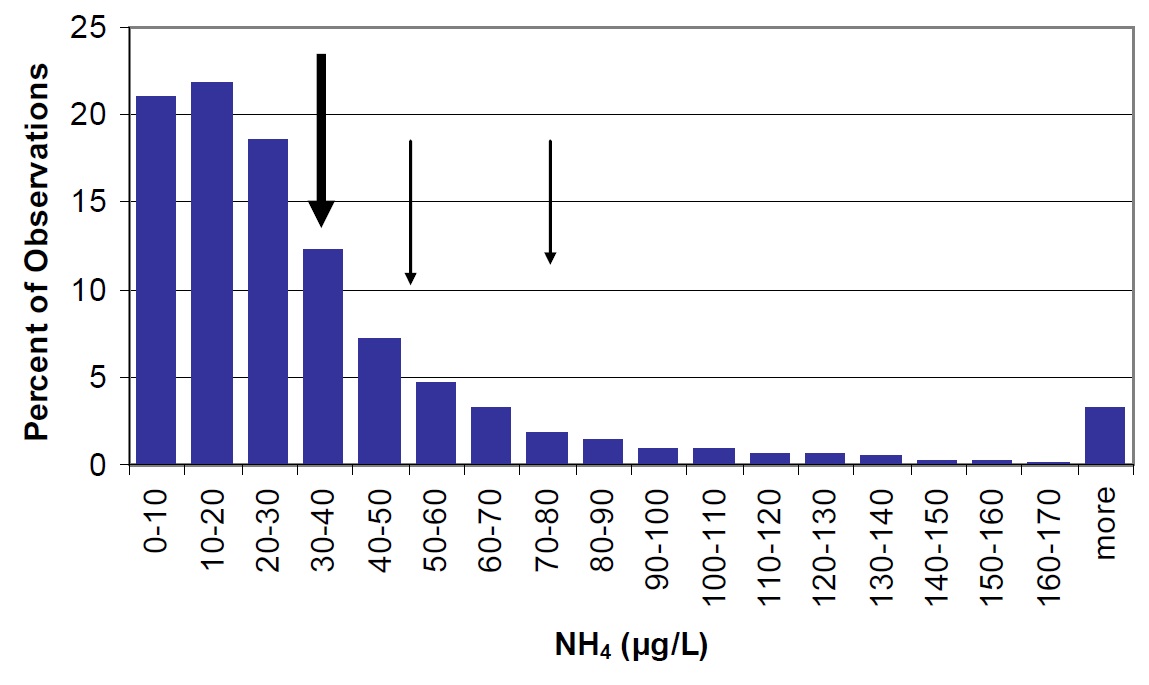
Figure 16. Ammonium concentrations in Lake Nipissing (large arrow) compared to Ontario lakes (vertical bars). Small arrows represent average observations for Cache Bay (78 µg/L) and Callander Bay (51 µg/L).
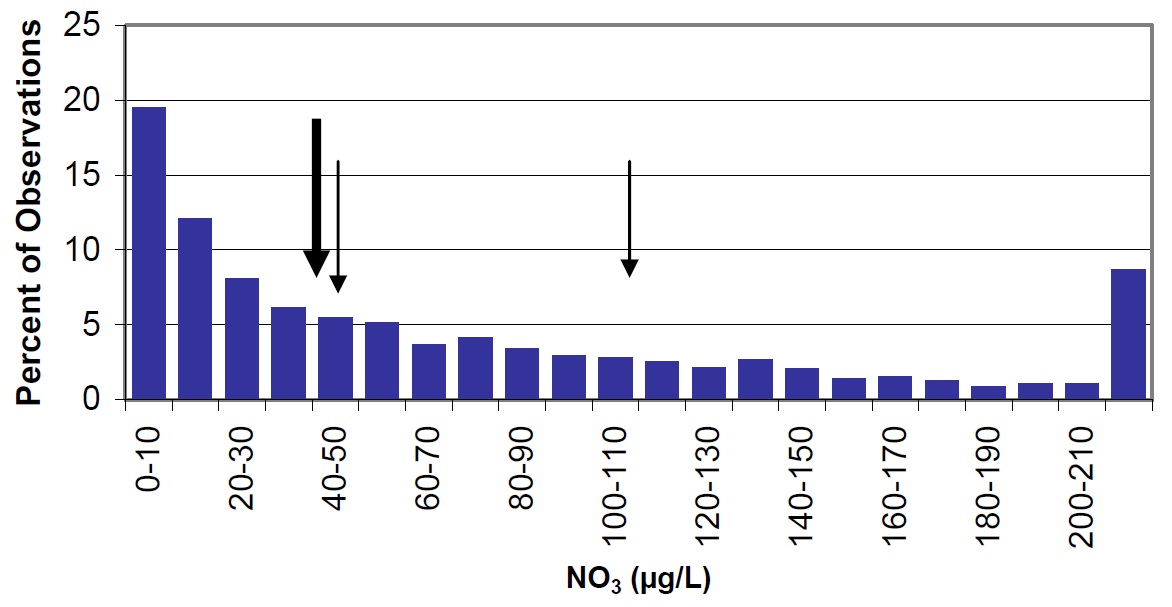
Figure 17. Nitrate in Lake Nipissing (large arrow) compared to Ontario lakes (vertical bars) small arrow represents average observations for Cache Bay (44 µg/L) and Callander Bay (109 µg/L).
Silica
As mentioned previously, silica is an important component of the frustules' cell walls and coverings and cysts of two major groups of phytoplankton (diatoms and chrysophytes). Therefore, silica availability may influence phytoplankton productivity and community succession in lakes (Wetzel, 2001).
Silica is lower in Lake Nipissing than in other lakes throughout the Province (Figure 18). Low silica values and high TP/silica ratios may explain the low chlorophyll values observed in Lake Nipissing (refer to Chlorophyll a section).
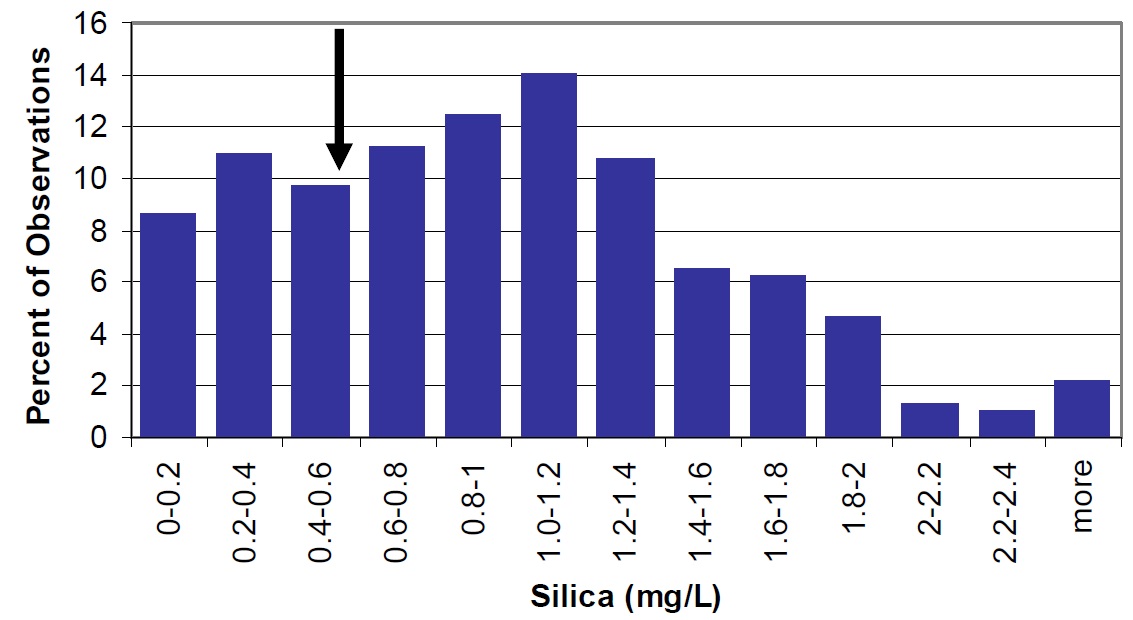
Figure 18. Silica in Lake Nipissing (large arrow) compared to Ontario lakes (vertical bars). Concentrations for Cache Bay (0.7 mg/L) and Callander Bay (0.5 mg/L) are similar.
pH and Alkalinity
pH, the measure of hydrogen ion activity, is often used to assess water quality. Lake pH affects chemical and biochemical reactions, regulates toxicity and controls the distribution of many aquatic organisms. Natural, unpolluted lakes generally vary in pH from about 5.0 (acid bogs) to 8.5 (marl lakes). Alkalinity is determined as the capacity of a solution to neutralize acid and in general lakes with a gran alkalinity of less than 15 mg/L as CaCO3 have the potential for acidification.
Lake Nipissing is intermediate between off-Shield lakes, which are dominated by limestone bedrock and deeper, calcium rich soils and have higher alkalinity. The size and surficial geology of the watershed contribute to more calcium and carbonate export to the lake. The pH and alkalinity of Lake Nipissing are slightly higher than levels measured in most lakes in Ontario (Figures 19 and 20). Cache and Callander Bays have higher pH (8.4 and 7.3, respectively) and Cache Bay has higher alkalinity (47.9 mg/L) than most other areas of the lake, which may be due to bicarbonate production by the extensive macrophytes beds in this shallow bay. This elevated bicarbonate production likely contributes to the higher pH and alkalinity levels observed in this lake as compared to other Ontario lakes.
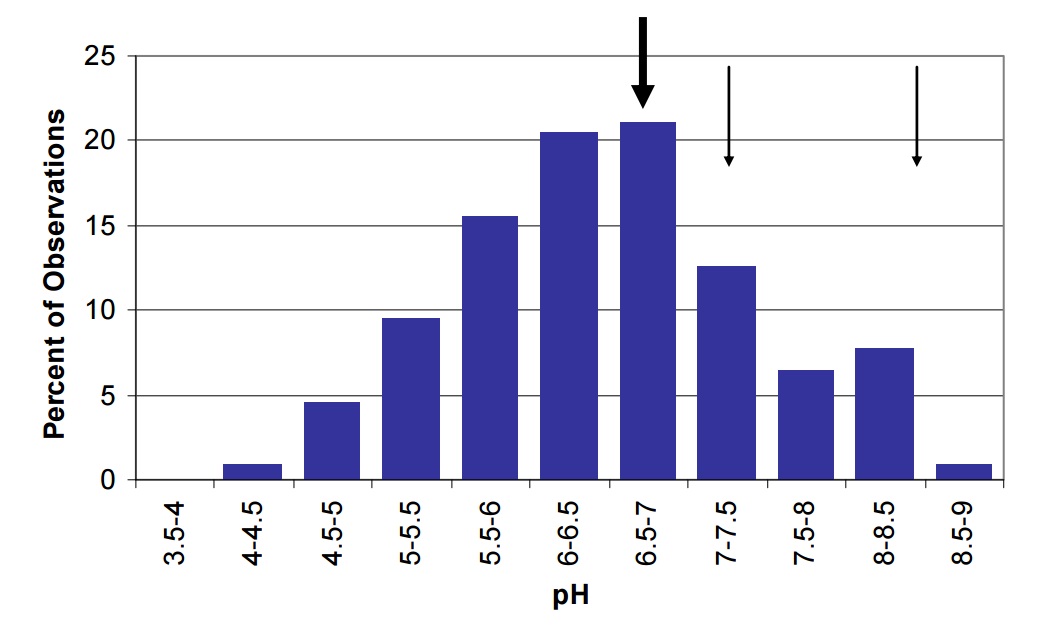
Figure 19. The pH of lakes in Ontario shown by the vertical bars compared to the mean pH in Nipissing (large arrow) and in Cache (8.4) and Callander Bay (7.3) (small arrows).
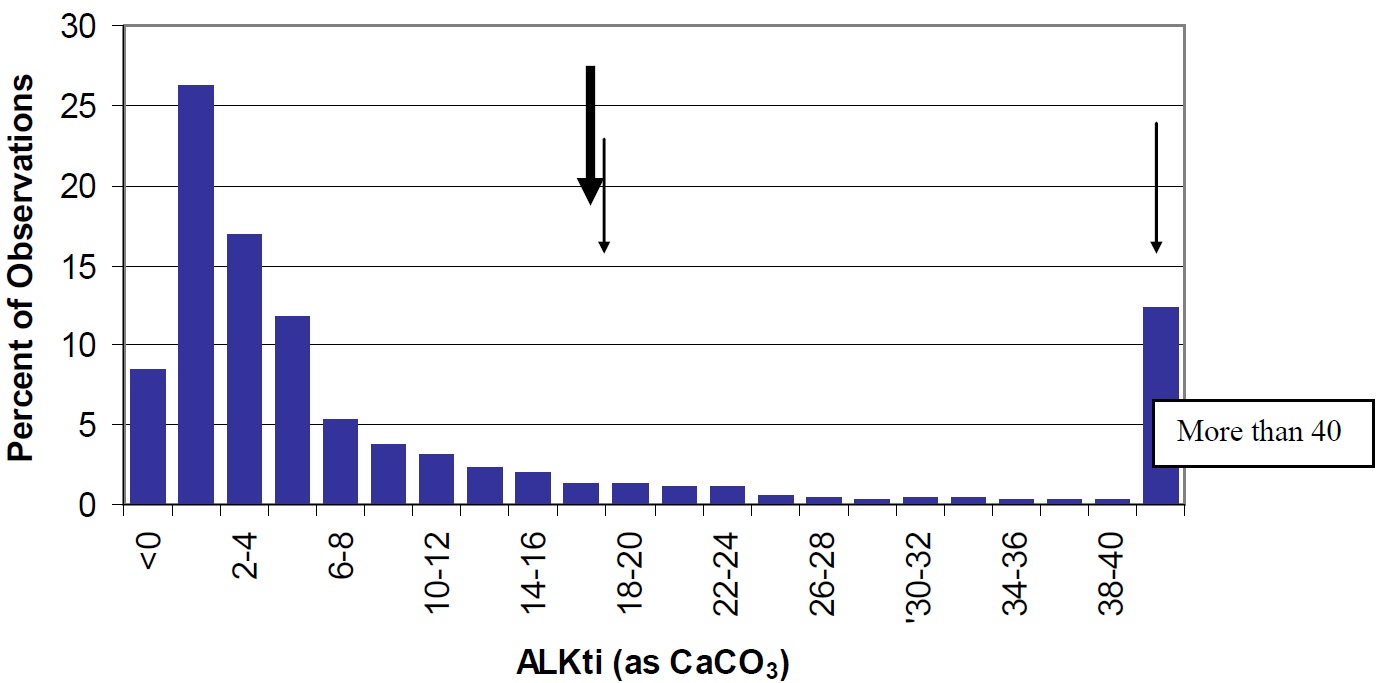
Figure 20. Total Inflection Point Alkalinity in Ontario Lakes (vertical bars) compared to Lake Nipissing (large arrow). Cache (47.9 mg/L) and Callander Bay (18.4 mg/L) are shown by the smaller arrows.
Colour and Dissolved Organic Carbon
Dissolved organic carbon (DOC) is an important variable in Boreal Shield lakes. It controls lake transparency and thermal structure, attenuates harmful UV radiation, is an important complexing agent for metals, and is an energy source in aquatic food webs.
DOC, when coloured, is primarily responsible for light attenuation in Shield lakes (see Figure 5), which is true with most lakes on the Precambrian Shield. There is a strong relationship between colour and DOC in Lake Nipissing (Figure 21). This indicates that much of the lake tends to receive a large proportion of its organic content (DOC) from the watershed (allochthonous sources), as opposed to productivity within the lake (autochthonous sources). Lakes which receive a large proportion of their organic content from the watershed (allochthonous sources) are called dystrophic (trophy in lakes refers to the rate of supply of organic material to the lake). Dystrophic lakes tend to be characterized as having lower pelagic phytoplankton production.
In general, DOC concentrations and colour measurements are generally higher in Lake Nipissing than for other lakes on the Precambrian Shield (Figures 22 and 23).
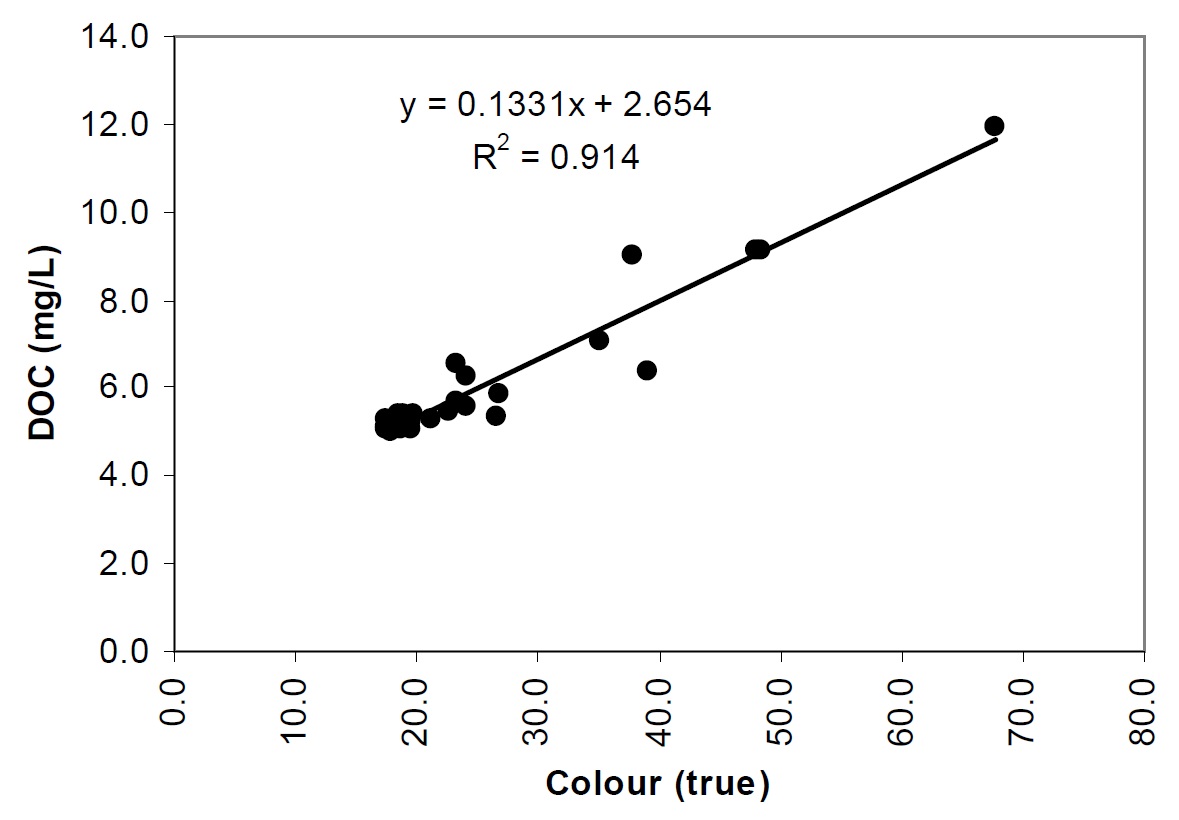
Figure 21. The relationship between DOC and True Colour in Lake Nipissing (1988-90 dataset).
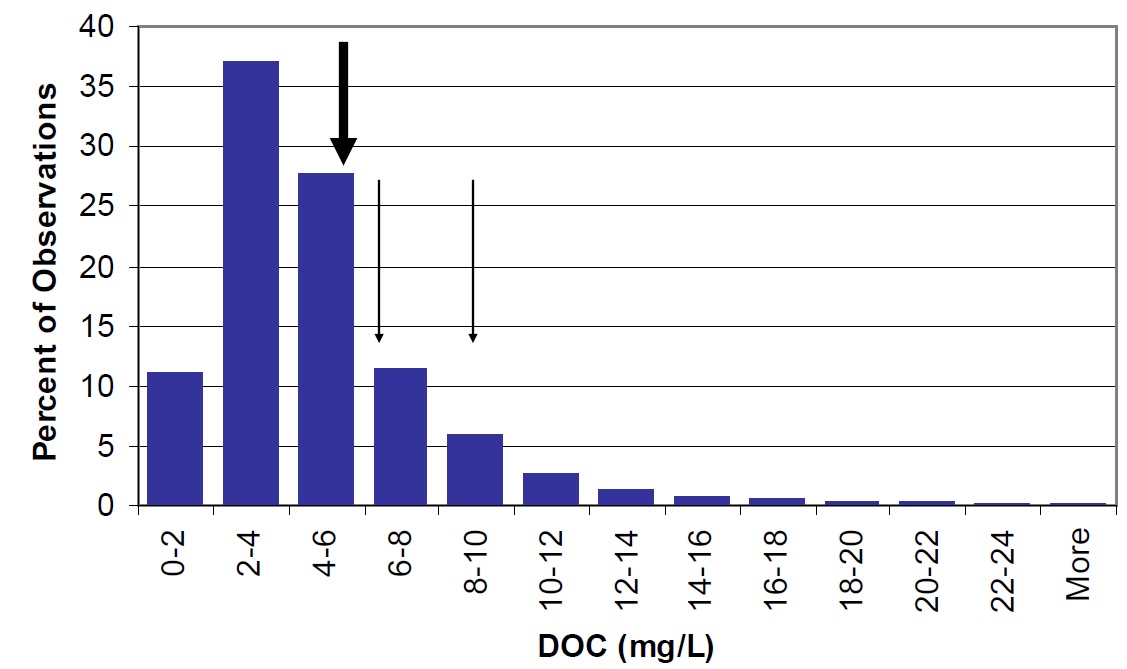
Figure 22. Distribution of DOC in Ontario lakes shown as percent of the total observations in the MOE, Inland Lakes Database (vertical bars). Nipissing lake wide mean is shown by the large arrow. Mean concentrations in Cache Bay (8.9 mg/L) and Callander Bay (6.4 mg/L) are shown by smaller arrows.
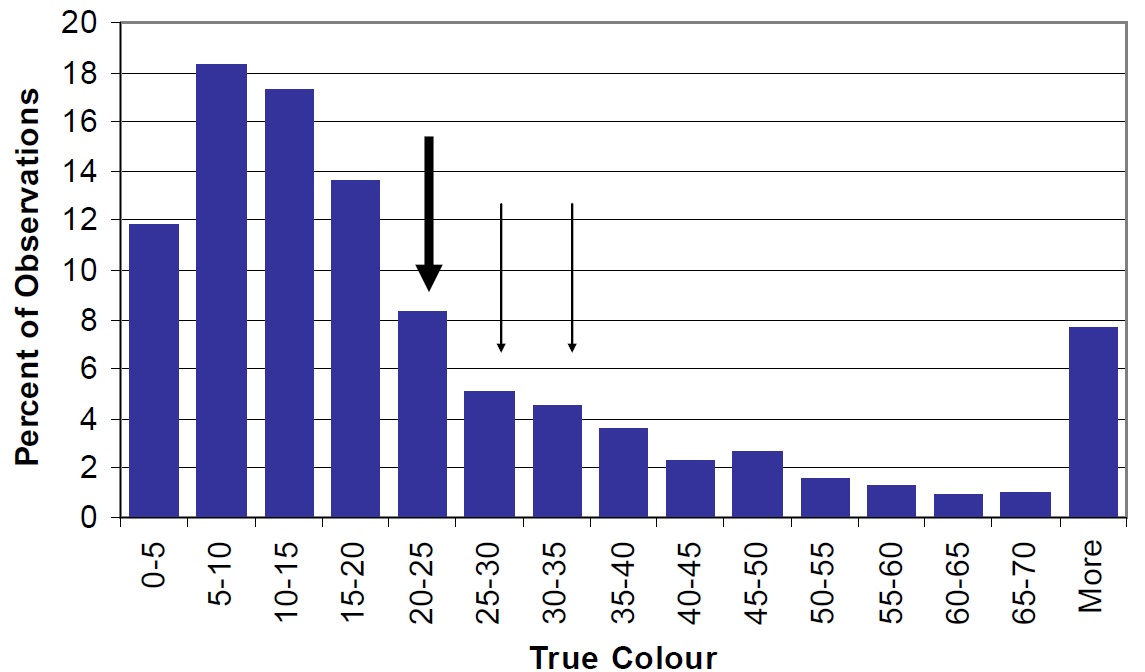
Figure 23. Distribution of True Colour in Ontario lakes shown as percent of the total observations in the MOE, Inland Lakes Database (vertical bars). Nipissing mean, lake wide concentrations are shown by the large arrow and concentrations in Cache Bay (34.4 tcu) and Callander Bay (30.3 tcu) shown by smaller arrows.
Major Ions and Conductivity
The cations (positively charged ions) measured in recent surveys are calcium (Ca), magnesium (Mg), sodium (Na), and potassium (K). Note that ammonia (NH4) is also a cation – discussed in the nitrogen section above. Generally, most of the cations are higher in concentration when compared to other lakes throughout Ontario but this is again a consequence of the surficial geology of Lake Nipissing’s watershed (See figures 24 to 27).
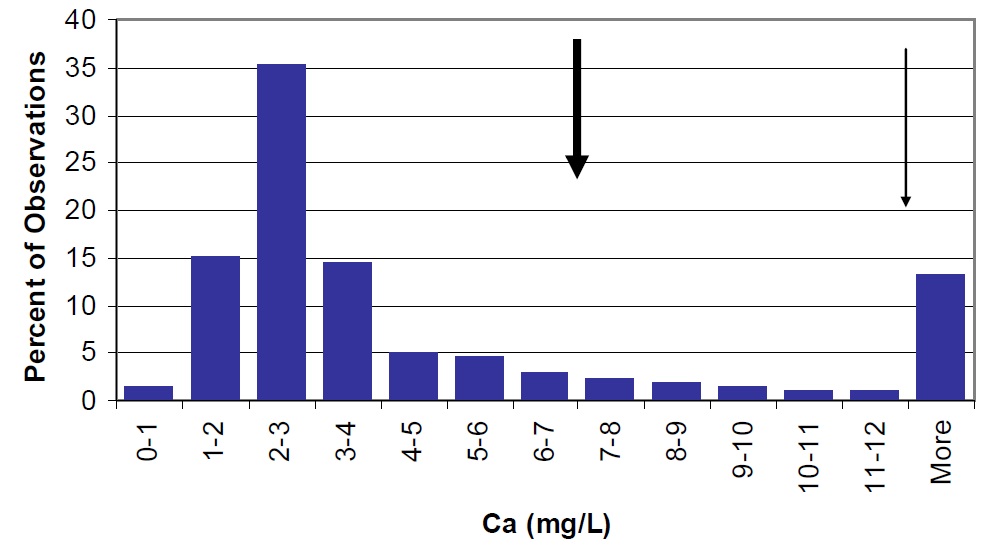
Figure 24. Calcium concentrations in Lake Nipissing (large arrow) compared to Ontario lakes (vertical bars) and small arrow represents average observations for Cache Bay. Callander Bay concentrations are similar to lakewide averages.
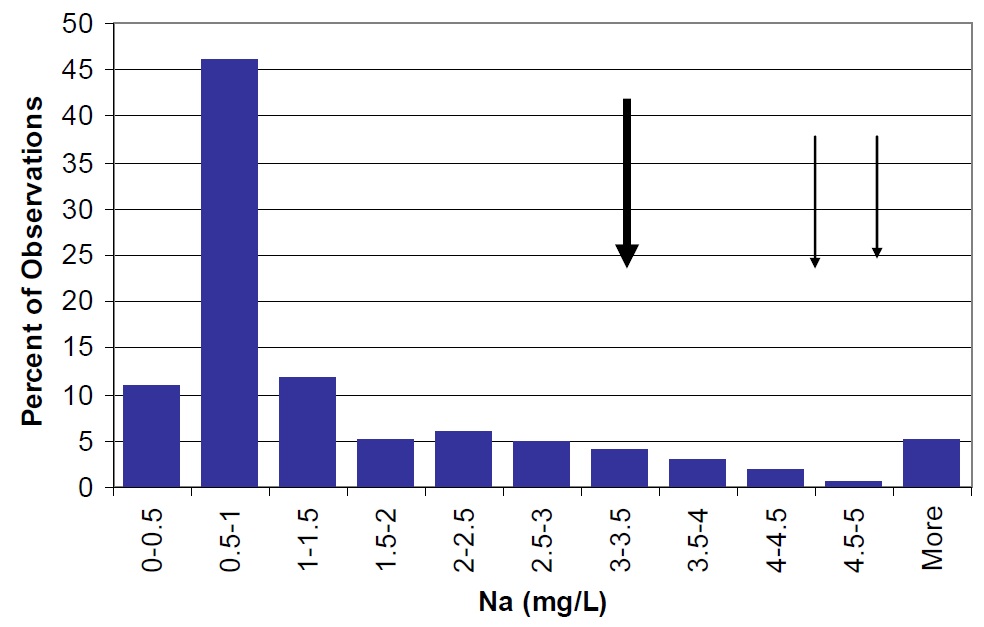
Figure 25. Sodium concentrations in Lake Nipissing (large arrow) compared to Ontario lakes (vertical bars) small arrow represents average observations for Cache Bay (5.0 mg/L) and Callander Bay (4.6 mg/L).
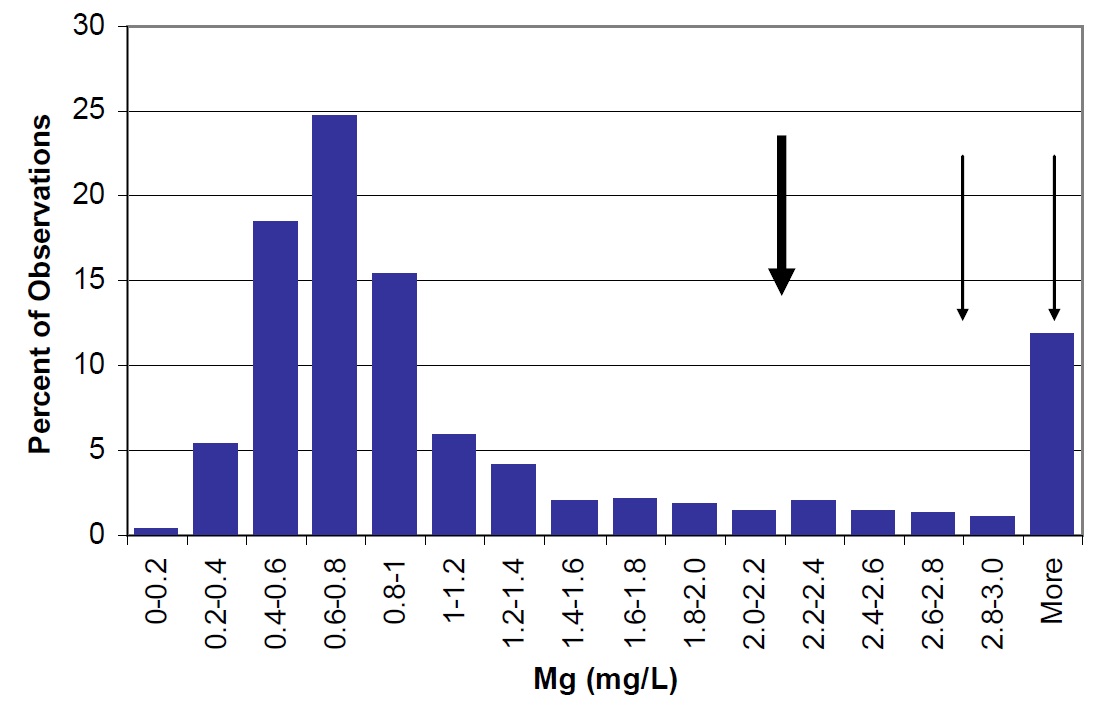
Figure 26. Magnesium concentrations in Lake Nipissing (large arrow) compared to Ontario lakes (vertical bars) small arrow represents average observations for Cache Bay (5.1 mg/L) and Callander Bay (2.2 mg/L).
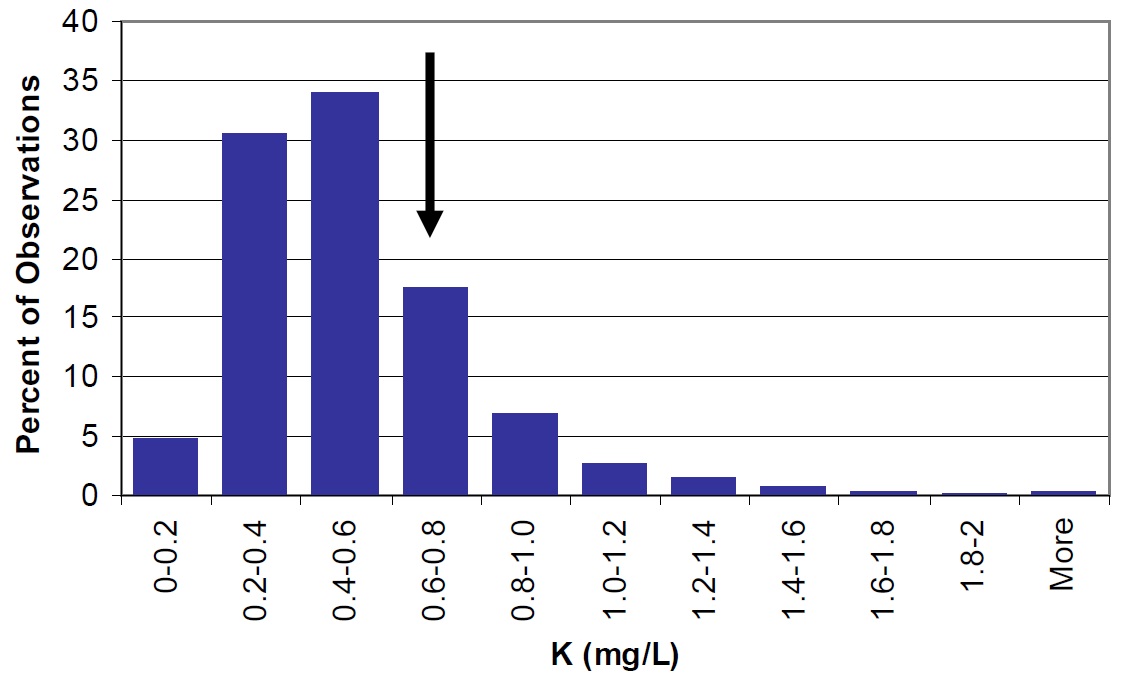
Figure 27. Potassium concentrations at most stations in Lake Nipissing (large arrow) compared to Ontario lakes (vertical bars).
The anions (negatively charged ions) measured were sulphate (SO4), and chloride (Cl). Note that nitrate (NO3) is also an anion – discussed in the nitrogen section above.
Sulphate is of interest since SO4 concentrations in Ontario Shield lakes are expected to decline in response to reduced atmospheric sulphate deposition in recent years. There has been a reduction in measured sulphate concentrations between 1988 to 1990 (10.3 mg/L) and 2003 to 2004 (6.9 mg/L). The current concentrations are similar to those observed in Precambrian Shield lakes throughout Ontario (Figure 28).
Lake-wide average sodium concentrations have increased from 3.1 mg/L to 3.4 mg/L and chloride concentrations from 3.4 mg/L to 4.2 mg/L between 1988 to 1990 and 2003 to 2004 (Figures 25 and 29). This is likely a result of road salt (NaCl) additions around the lake. Levels of these anions are generally higher in Lake Nipissing than many other Ontario lakes but these levels are well below those considered to be toxic (Health Canada, 2007).
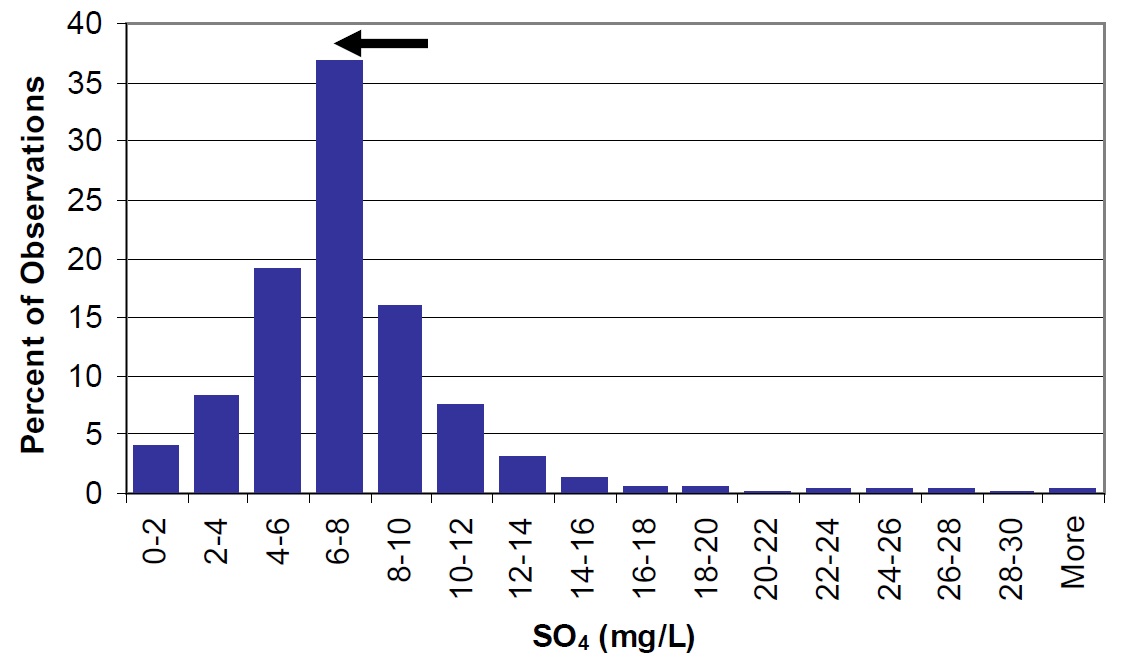
Figure 28. Sulphate in Lake Nipissing (arrow) compared to Ontario lakes (vertical bars). Arrow represents a change in concentration (lake wide) from 10.3 mg/L in 1988 to 1990 to 6.9 mg/L in 2003 to 2004.
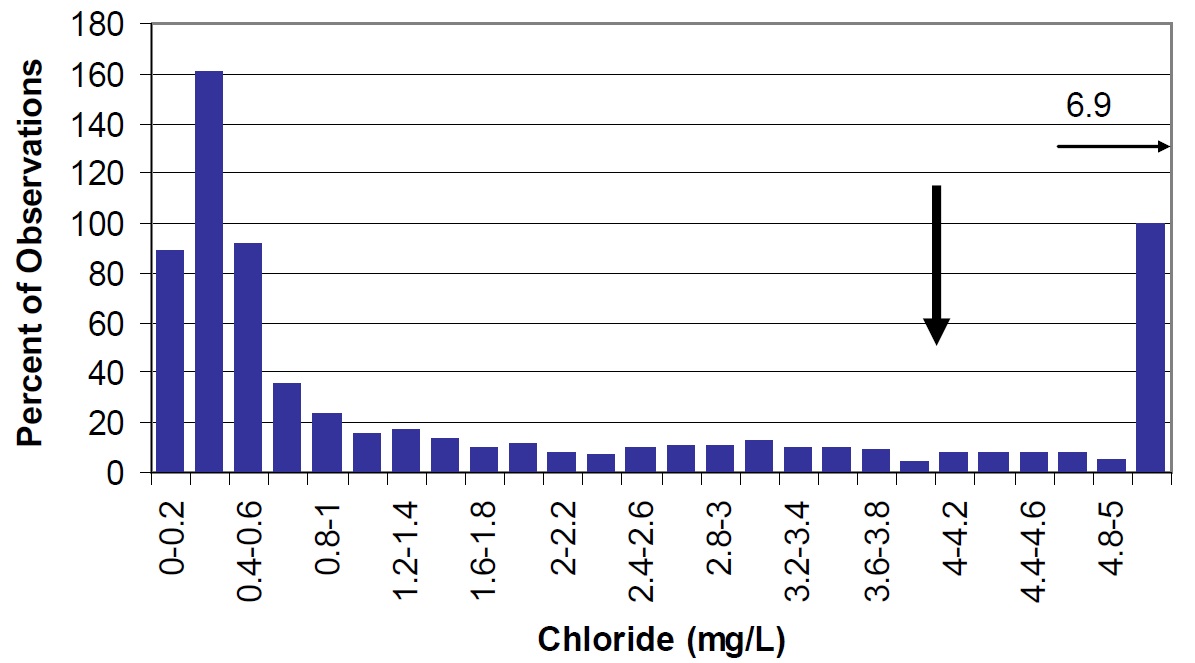
Figure 29. Chloride in Lake Nipissing (large arrow) compared to Ontario lakes (vertical bars). Small arrow represents average observations for Cache Bay, and Callander Bay (6.9 mg/L).
Conductivity
Conductivity is a measure of the capacity of water to carry an electrical current. This capacity is related to the total concentration of ionized substances in the water (Wetzel, 2001).
Lake Nipissing’s conductivity is higher than in many dilute lakes on the Precambrian Shield (Figure 30). This is expected since the concentrations of major cations and anions are also higher (see previous sections).
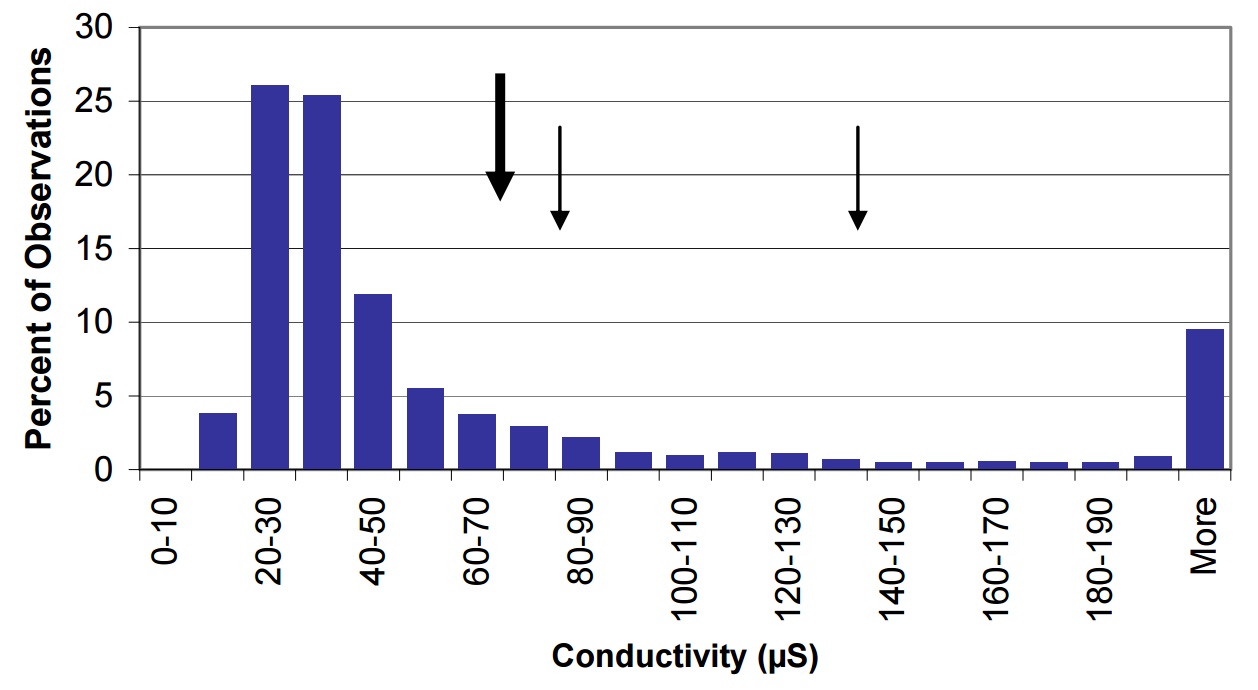
Figure 30. Conductivity in Lake Nipissing (large arrow) compared to Ontario lakes (vertical bars) small arrow represents average observations for Cache Bay (78 µS) and Callander Bay (51 µS).
Temporal Change in Water Chemistry
Most water chemistry parameters have not changed appreciably since the 1988 to 1990 survey (Table 4).
Calcium, which is of interest because it is required for the growth of exoskeletons in mussels, zooplankton and other aquatic organisms, has declined from 7.4 mg/L to 6.8 mg/L across the lake as a whole. In other regions with Precambrian geology, this decline has been attributed to the depletion of calcium from watershed soils over decades of acidification (Stoddard et al. 1999), as Ca levels in lakes are a reflection of Ca in catchment soils (Houle et al. 2006).
Sodium and chloride, which are components of road salt (NaCl), have increased from 3.1 mg/L in 1988 to 1990 to 3.4 mg/L in 2003 to 2004 and from 3.4 mg/L to 4.2 mg/L, respectively. This is a common observation in Ontario lakes that are adjacent to roads and highways.
Average ammonium concentrations increased from 23 µg/L to 38 µg/L, but this may be a consequence of some samples being stored for too long prior to analysis. Nitrate also increased over the same time period, but we are currently unable to explain the reason for this increase. Nonetheless, long-term trends based on only two points in time should be interpreted with caution.
Total phosphorus concentrations may have declined and this is happening elsewhere in lakes throughout Ontario including lakes that have no human activity in the watershed.
Recent declines in sulphate concentrations are consistent with ~50% declines in sulphate deposition in central Ontario between 1976 and 2006 (Dillon et al. 2007).
The above noted changes in water chemistry are expected since these have been demonstrated for many smaller lakes throughout Ontario. These changes are primarily the result of regional impacts such as drought and acidification of watershed soils (in the case of phosphorus), reduced deposition of sulphur (in the case, of sulphate), and continued application of road salt (in the case of sodium and chloride).
| Lakewide | ALKti as CaCO3 | Al (mg/L) | Ca (mg/L) | Chl a (µg/L) | Cl (mg/L) | Coltr | Cond (µS) | DIC (mg/L) | DOC (mg/L) | Fe (µg/L) | SD (m) | K (mg/L) | Mg (mg/L) | Mn (mg/L) | Na (mg/L) | NH4 (µg/L) | NO3 (µg/L) | TKN (µg/L) | pH | TP (µg/L) | SiO3 (mg/L) | SO4 (mg/L) |
|---|---|---|---|---|---|---|---|---|---|---|---|---|---|---|---|---|---|---|---|---|---|---|
| mean | 18 | 75 | 6.8 | 2.3 | 4 | 21.4 | 73 | 4.9 | 5.5 | 98.5 | 0.7 | 2.2 | 13.1 | 3.2 | 36 | 45 | 319 | 7.1 | 17.5 | 0.6 | 7 | |
| minimum | 15.5 | 34 | 5.9 | 1.6 | 2.5 | 17.4 | 63 | 4.3 | 5 | 59.5 | 0.6 | 2 | 9.2 | 2.3 | 23 | 15 | 228 | 6.9 | 13.8 | 0.5 | 5.1 | |
| maximum | 19.6 | 126 | 7.3 | 4.4 | 4.9 | 35.1 | 79 | 6.2 | 7.1 | 183 | 1.5 | 2.4 | 23.4 | 3.7 | 57 | 95 | 426 | 7.4 | 26.1 | 0.9 | 7.4 | |
| IG7 | 47.9 | 43 | 13.5 | 4.6 | 6.4 | 34.4 | 137 | 10.7 | 8.9 | 108 | 0.6 | 5.1 | 15.9 | 5 | 78 | 44 | 592 | 8.4 | 29 | 0.5 | 4.8 | |
| IG9 | 18.4 | 52 | 7.2 | 4 | 6.4 | 30.3 | 83 | 5 | 6.4 | 115 | 0.9 | 2.2 | 14.5 | 4.6 | 51 | 109 | 412 | 7.3 | 22.6 | 0.7 | 7 |
| Lakewide | ALKti as CaCO3 | Al (mg/L) | Ca (mg/L) | Chl a (µg/L) | Cl (mg/L) | Coltr | Cond (µS) | DIC (mg/L) | DOC (mg/L) | Fe (µg/L) | SD (m) | K (mg/L) | Mg (mg/L) | Mn (mg/L) | Na (mg/L) | NH4 (µg/L) | NO3 (µg/L) | TKN (µg/L) | pH | TP (µg/L) | SiO3 (mg/L) | SO4 (mg/L) |
|---|---|---|---|---|---|---|---|---|---|---|---|---|---|---|---|---|---|---|---|---|---|---|
| mean | 18.7 | 80 | 7.4 | 3.4 | 3.2 | 24.7 | 77 | 4.8 | 5.6 | 117.4 | 2.4 | 0.7 | 2.4 | 15.2 | 3 | 23 | 21 | 334 | 7.4 | 14.1 | 0.6 | 10.4 |
| minimum | 16.2 | 24 | 6.9 | 1.6 | 1.6 | 18.4 | 69 | 4 | 4.8 | 52.2 | 1.5 | 0.6 | 2.1 | 9.6 | 2 | 12 | 6 | 294 | 7.1 | 11.3 | 0.4 | 8.6 |
| maximum | 23.4 | 207 | 8 | 5.3 | 4.9 | 36.2 | 86 | 6.2 | 8.4 | 243.1 | 3.5 | 1.1 | 2.9 | 28 | 4.1 | 52 | 45 | 453 | 7.6 | 24 | 1.2 | 11 |
| IG7 | 49 | 256 | 15.1 | 8.4 | 4.5 | 37.6 | 135 | 8.5 | 8.4 | 175 | 1.3 | 0.7 | 4.7 | 14.6 | 3.4 | 38 | 19 | 595 | 8.6 | 30 | 0.7 | 8.6 |
| IG9 | 18.4 | 78 | 7.4 | 11.3 | 5.4 | 29.1 | 82 | 4.6 | 6 | 140 | 1.7 | 0.9 | 2.4 | 27.2 | 4 | 50 | 32 | 504 | 7.4 | 22.6 | 0.7 | 9.4 |
Discussion and Conclusion
Lake Nipissing is a productive water body which is, in part, responsible for its great value as a recreational lake. The water chemistry of Lake Nipissing, including Cache and Callander Bays, has not changed appreciably over the past 15 years, particularly with respect to total phosphorus (TP) concentrations. In general, we report minimal changes in water chemistry over time in this lake. This is consistent with the findings of the paleolimnological study completed by AECOM (2009) that reported TP concentrations in Callander Bay to be elevated and relatively stable since the early 1950's when TP concentrations initially increased following construction of the Portages Dam and then leveled off. However, the AECOM study reported a diatom-inferred mean TP concentration of 32.5 µg/L for Callander Bay, which is higher than the directly measured value given in this report of 22.6 µg/L. In both cases however, the high TP concentrations are expected to lead to nuisance algal growth. Suggested sources of TP to Lake Nipissing include agricultural land use in the Cache Bay and Callander Bay watersheds, sediment resuspension and TP mobilization from sediment under anoxic conditions (AECOM 2009).
The current water quality of Cache and Callander Bays is somewhat poorer than that of the main basin of Lake Nipissing. Callander Bay is the municipal water supply for the Municipality of Callander and is also the discharge location of the Municipality’s Sewage Treatment Lagoons. Algal blooms are a recurring problem in Callander Bay and there are concerns about the impacts of bacteria on the municipal water supply. The risk that the discharge poses to the municipal supply and recreational use of Callander Bay’s waters has not been clearly defined, and further studies are needed to provide insights into the current situation (HESL 2010). A characterization of the severity of impact of the lagoon discharge may be warranted, as well as an evaluation of Lake Nipissing as an alternate discharge location.
We recommend on-going monitoring (e.g., every 10-15 years) to continue to understand the water quality condition observed in Lake Nipissing. Much of the speculation in the interpretation of Lake Nipissing water chemistry data is a result of the paucity of information that exists relating to production and trophic interactions in the lake. Considering the size and value of the resource, there is also a noticeable lack of peer review literature pertaining to the biochemical and physical characteristics of Lake Nipissing that contribute to the observed water quality conditions. Both AECOM (2009) and HESL (2010) provide numerous recommendations for studies that would help in interpreting the water quality data and provide a better understanding of mechanisms leading to observed conditions.
References
AECOM (2009). North Bay-Mattawa Conservation Authority Paleolimnology of Callander Bay, Lake Nipissing. Prepared for the North Bay-Mattawa Conservation Authority by AECOM Canada Ltd. Project number 107389.
Carlson, R.E. and J. Simpson (1996). A Coordinator’s Guide to Volunteer Lake Monitoring Methods. North American Lake Management Society. In: The Great North America Secchi Dip-In (n.d.). Retrieved August 22, 2002, from Secchi Dip-In
Chang, C., F. Ashenhurst, S. Demaia and W. Mann (2002). Ontario Flow Assessment Techniques, Version 1.0: Users Manual. Northeast Science and Information Section Technical Manual TM-011. Ontario Ministry of Natural Resources.
Clark, B. and N.J. Hutchinson (1992). Measuring the Trophic Status of Lakes: Sampling Protocols. Ontario Ministry of Environment and Energy.
Clark, B.J., A.M. Paterson, A. Jeziorski and S. Kelsey (2010). Assessing variability in total phosphorus measurements in Ontario lakes. Lake and Reservoir Management 26: 63 to 72.
Dillon, P. J., S. Watmough, M. C. Eimers and J. Aherne (2007). Long-term changes in boreal lake and stream chemistry: recovery from acid deposition and the role of climate. in Acid in the Environment: Lessons Learned and Future Prospects, edited by Gerald R. Visgilio and Diana M. Whitelaw. Springer.
Filion, J–M. (2002). Summer Distribution of the Limnetic Crustacea of Lake Nipissing Ontario 2000-2001 Report Prepared for the Lake Nipissing Stewardship Council.
Fry, F.E. (1937). The Summer Migration of the Cisco, Leucichtyys artedi (Le Sueur), in Lake Nipissing, Ontario., No. 44: Publications of the Ontario Fisheries Research Laboratory, LV., The University of Toronto Press 1937.
Gardolinski, P.C.F.C., G. Hanrahan, E.P. Achterberg, M. Gledhill, D.D. Tappin, W.A. House and P.J. Worsfold (2001). Comparisons of sample storage protocols for the determination of nutrients in natural waters. Water Resources 35: 3670 to 3678.
Health Canada (2007). Priority Substances List Assessment Report for Road Salts. Retrieved September 30, 2010, from Health Canada.
HESL (2010). North Bay – Mattawa Conservation Authority Callander Drinking Water Source Protection Technical Studies Update. Prepared by Hutchinson Environmental Sciences Ltd (HESL) for the North Bay-Mattawa Conservation Authority. Project Number J100011.
Houle, D., R. Ouimet, S. Couture and C. Gagnon (2006). Base cation reserves in soil control the buffering capacity of lakes in forested catchments. Canadian Journal of Fisheries and Aquatic Sciences 63: 471 to 474.
Hydrological Atlas of Canada (1978). Surveys and Mapping Branch, Dep't of Energy Mines and Resources, ISBN 0-660-01591-9
Ingram, R. (2006). Sample collection protocols used by the Dorset Environmental Science Centre. Draft Technical report.
Jarvie, H.P., P. Withers and C. Neal (2002). Review of robust measurement of phosphorus in river water: sampling, storage, fractionation and sensitivity. Hydrology and Earth System Sciences 6: 113-132.
Langford, R.R. (1938). Diurnal and Seasonal Changes in the Distribution of the Limnetic Crustacea of Lake Nipissing, Ontario., No. 56: Publications of the Ontario Fisheries Research Laboratory, LV., The University of Toronto Press.
Mazumder, A. (1994). Phosphorus- Chlorophyll relationships under contrasting Zooplankton Community Structure: Potential mechanisms. Canadian Journal of Fisheries and Aquatic Sciences 51: 401 to 407.
Neary, B.P. and B.J. Clark (1992). The Chemical Water Quality of Lake Nipissing 1988 to 1990, Ontario Ministry of the Environment, Environmental Sciences and Standards, Technical Report, 66 pp. – ISBN 0-7729-9063-8.
Ontario Ministry of Environment and Energy. (October, 1996). 1995 Performance Report: Water Quality Analyses Section (ISSN 1198 to 3043).
Riley, E.T. and E.E. Prepas (1985). Comparison of the phosphorus-chlorophyll relationships in mixed and stratified lakes. Canadian Journal of Fisheries and Aquatic Sciences 42: 831 to 835.
Smith, V.H. and J. Shapiro (1981). Chlorophyll – Phosphorus relationships in individual lakes. Their importance to lake restoration strategies. Environmental Science and Technology 15: 444 to 451.
Stewart, A.J. and R.G. Wetzel (1982). Influence of dissolved humic materials on carbon assimilation and alkaline phosphatase activity in natural algal-bacterial assemblages. Freshwater Biology 12: 369 to 380.
Stoddard, J.L., D.S. Jeffries, A. Lukewille, T.A. Clair, P.J. Dillon, C.T. Driscoll, M. Forsius, M. Johannessen, J.S. Kahl, J.H. Kellogg, A. Kemp, J. Mannio, D.T. Monteith, P.S. Murdoch, S. Patrick, A. Rebsdorf, B.L. Skjelkvale, M.P. Stainton, T. Traaen, H. van Dam, K.E. Webster, J. Weiting and A. Wilander (1999). Regional trends in aquatic recovery from acidification in North America and Europe. Nature 401: 575 to 578.
Wetzel, R.G. (2001). Limnology. Lake and River Ecosystems. Third Ed. Academic Press, San Diego, 1006 pp.
Appendix 1
| Date | ALKti CaCO3 | Al mg/L | Ca mg/L | Chl µg/L | Cl mg/L | Coltr true | Cond µS | DIC mg/L | DOC mg/L | Fe µg/L | K mg/L | Mg mg/L | Mn mg/L | Na mg/L | NH µg/L | NO µg/L | TKN µg/L | pH | TP µg/L | SiO3 mg/L | SO4 mg/L |
|---|---|---|---|---|---|---|---|---|---|---|---|---|---|---|---|---|---|---|---|---|---|
| 18-May-03 | 18.1 | 39 | 7.1 | 5.5 | 15.2 | 77 | 5.4 | 4.9 | 83 | 0.7 | 2.2 | 4.2 | 50 | 188 | 244 | 7.0 | 14.8 | 0.6 | 7.5 | ||
| 2-Jul-03 | 19.4 | 99 | 7.0 | 5.0 | 18.6 | 74 | 5.2 | 5.2 | 92 | 0.7 | 2.1 | 9.5 | 3.9 | 46 | 144 | 320 | 7.0 | 11.6 | 0.3 | 7.4 | |
| 17-Jul-03 | 18.7 | 74 | 7.0 | 1.4 | 5.4 | 17.4 | 77 | 5.0 | 4.5 | 77 | 0.7 | 2.2 | 10.5 | 4.2 | 6 | 96 | 340 | 6.9 | 15.4 | 0.2 | 7.3 |
| 28-Aug-03 | 19.8 | 68 | 6.9 | 4.7 | 15.2 | 76 | 5.3 | 4.8 | 93 | 0.8 | 2.2 | 10.8 | 3.6 | 8 | 72 | 306 | 7.1 | 21.6 | 0.8 | 7.5 | |
| 29-Sep-03 | 20.3 | 74 | 7.5 | 5.1 | 16.8 | 87 | 5.2 | 8.0 | 87 | 0.8 | 2.4 | 9.5 | 4.1 | 58 | 86 | 327 | 7.2 | 21.3 | 0.7 | 7.6 | |
| 23-Oct-03 | 17.5 | 110 | 7.3 | 4.4 | 20.6 | 79 | 5.2 | 5.2 | 151 | 0.6 | 2.4 | 10.7 | 3.8 | 36 | 6 | 730 | 6.7 | 18.4 | 0.5 | 7.5 | |
| 2-Jun-04 | 92 | 6.4 | 5.0 | 21.8 | 72 | 4.3 | 4.9 | 94 | 0.7 | 2.1 | 6.3 | 3.8 | 28 | 68 | 322 | 10.8 | 1.0 | 7.2 | |||
| 7-Jul-04 | 16.5 | 174 | 6.7 | 3.7 | 26.2 | 64 | 4.8 | 5.2 | 184 | 0.6 | 2.1 | 20.9 | 2.9 | 24 | 42 | 232 | 7.1 | 0.7 | 6.8 | ||
| 21-Jul-04 | 17.4 | 84 | 6.5 | 5.0 | 26.2 | 71 | 4.3 | 6.2 | 95 | 0.7 | 2.1 | 7.6 | 3.7 | 30 | 32 | 7.4 | 14.8 | 0.1 | |||
| 18-Aug-04 | 18.2 | 84 | 6.7 | 5.1 | 19.6 | 81 | 4.6 | 5.3 | 77 | 0.7 | 2.1 | 6.6 | 4.0 | 28 | 28 | 293 | 7.5 | 15.4 | 0.3 | 7.2 | |
| 1-Oct-04 | 20.7 | 57 | 7.3 | 4.6 | 18.0 | 77 | 5.4 | 5.6 | 71 | 0.7 | 2.4 | 5.6 | 3.5 | 32 | 18 | 394 | 7.4 | 15.0 | 0.6 | 7.1 | |
| 28-Oct-04 | 20.7 | 62 | 7.4 | 21.8 | 74 | 5.6 | 4.9 | 59 | 0.7 | 2.4 | 3.4 | 3.2 | 22 | 2 | 111 | 7.4 | 14.1 | 0.4 | 8.0 | ||
| mean | 18.8 | 85 | 7.0 | 4.9 | 19.8 | 76 | 5.0 | 5.4 | 97 | 0.7 | 2.2 | 9.2 | 3.7 | 31 | 65 | 329 | 7.2 | 15.7 | 0.5 | 7.4 | |
| 88-90 mean | 19.5 | 72 | 7.6 | 3.5 | 4.4 | 18.4 | 83 | 5.1 | 5.1 | 102 | 0.8 | 2.4 | 9.6 | 3.8 | 29 | 26 | 333 | 7.4 | 12.5 | 0.4 | 10.6 |
| Date | ALKti CaCO3 | Al mg/L | Ca mg/L | Chl µg/L | Cl mg/L | Coltr true | Cond µS | DIC mg/L | DOC mg/L | Fe µg/L | K mg/L | Mg mg/L | Mn mg/L | Na mg/L | NH µg/L | NO µg/L | TKN µg/L | pH | TP µg/L | SiO3 mg/L | SO4 mg/L |
|---|---|---|---|---|---|---|---|---|---|---|---|---|---|---|---|---|---|---|---|---|---|
| 18-May-03 | 18.2 | 52 | 7.0 | 5.0 | 18.0 | 75 | 5.1 | 5.2 | 76 | 0.6 | 2.3 | 10.7 | 3.8 | 36 | 360 | 333 | 7.1 | 17.5 | 0.6 | 7.4 | |
| 2-Jul-03 | 16.8 | 133 | 6.6 | 3.5 | 23.0 | 65 | 4.5 | 6.1 | 111 | 0.7 | 1.9 | 10.6 | 2.9 | 34 | 52 | 338 | 7.1 | 16.3 | 0.6 | 7.4 | |
| 7-Aug-03 | 18.7 | 109 | 6.8 | 3.8 | 23.6 | 69 | 5.2 | 5.4 | 173 | 0.6 | 2.2 | 15.4 | 3.0 | 30 | 38 | 320 | 7.2 | 19.6 | 0.4 | 7.4 | |
| 9-Sep-03 | 63 | 7.1 | 3.6 | 20.0 | 76 | 4.9 | 5.1 | 91 | 0.6 | 2.2 | 9.8 | 2.9 | 74 | 2 | 320 | 7.3 | 22.6 | 0.9 | 7.4 | ||
| 15-Jul-04 | 17.1 | 107 | 6.5 | 4.5 | 23.6 | 67 | 4.5 | 4.8 | 99 | 0.7 | 2.1 | 7.9 | 3.3 | 32 | 16 | 284 | 7.5 | 0.2 | 7.2 | ||
| 13-Sep-04 | 18.6 | 61 | 6.8 | 3.9 | 52.0 | 70 | 5.1 | 5.3 | 71 | 0.7 | 3.9 | 8.4 | 3.0 | 14 | 4 | 303 | 6.8 | 16.3 | 0.5 | 7.4 | |
| mean | 17.9 | 88 | 6.8 | 4.0 | 26.7 | 70 | 4.9 | 5.3 | 103 | 0.6 | 2.4 | 10.5 | 3.2 | 37 | 79 | 316 | 7.1 | 18.5 | 0.5 | 7.3 | |
| 88-90 mean | 18.3 | 81 | 7.5 | 2.8 | 2.8 | 26.3 | 76 | 4.7 | 5.6 | 191 | 0.7 | 2.3 | 16.5 | 2.9 | 18 | 18 | 323 | 7.3 | 14.7 | 0.8 | 10.7 |
| Date | ALKti CaCO3 | Al mg/L | Ca mg/L | Chl µg/L | Cl mg/L | Coltr true | Cond µS | DIC mg/L | DOC mg/L | Fe µg/L | K mg/L | Mg mg/L | Mn mg/L | Na mg/L | NH µg/L | NO µg/L | TKN µg/L | pH | TP µg/L | SiO3 mg/L | SO4 mg/L |
|---|---|---|---|---|---|---|---|---|---|---|---|---|---|---|---|---|---|---|---|---|---|
| 18-May-03 | 17.9 | 71 | 7.2 | 5.3 | 19.8 | 75 | 5.2 | 5.6 | 100 | 0.7 | 2.3 | 11.4 | 4.0 | 38 | 210 | 330 | 6.8 | 13.8 | 0.5 | 7.4 | |
| 2-Jul-03 | 15.9 | 169 | 6.4 | 2.8 | 30.4 | 62 | 4.4 | 6.6 | 146 | 0.7 | 1.9 | 15.6 | 2.5 | 58 | 232 | 378 | 6.8 | 15.7 | 0.8 | 7.4 | |
| 7-Aug-03 | 19.1 | 98 | 6.6 | 3.9 | 18.8 | 69 | 4.8 | 5.6 | 145 | 0.6 | 2.2 | 15.7 | 3.1 | 64 | 114 | 363 | 7.2 | 22.6 | 0.4 | 7.3 | |
| 9-Sep-03 | 19.2 | 63 | 7.2 | 2.9 | 24.0 | 71 | 4.9 | 5.4 | 126 | 0.8 | 2.2 | 14.8 | 2.7 | 44 | 2 | 310 | 7.3 | 16.9 | 0.8 | 7.4 | |
| 15-Jul-04 | 17.3 | 86 | 6.5 | 4.0 | 25.2 | 66 | 4.3 | 5.0 | 104 | 0.6 | 2.1 | 8.5 | 3.0 | 24 | 8 | 285 | 7.3 | 8.0 | 0.2 | 7.0 | |
| 13-Sep-04 | 17.4 | 32 | 6.7 | 2.9 | 27.0 | 67 | 4.7 | 5.1 | 63 | 0.5 | 2.1 | 8.5 | 2.4 | 18 | 2 | 305 | 6.8 | 12.4 | 0.6 | 7.7 | |
| mean | 17.8 | 86 | 6.8 | 3.6 | 24.2 | 68 | 4.7 | 5.6 | 114 | 0.7 | 2.1 | 12.4 | 3.0 | 41 | 95 | 329 | 7.0 | 14.9 | 0.6 | 7.3 | |
| 88-90 mean | 16.8 | 87 | 7.2 | 2.3 | 2.4 | 36.2 | 72 | 4.1 | 6.3 | 193 | 0.6 | 2.2 | 17.4 | 2.6 | 14 | 24 | 336 | 7.2 | 14.0 | 1.0 | 10.5 |
| Date | ALKti CaCO3 | Al mg/L | Ca mg/L | Chl µg/L | Cl mg/L | Coltr true | Cond µS | DIC mg/L | DOC mg/L | Fe µg/L | K mg/L | Mg mg/L | Mn mg/L | Na mg/L | NH µg/L | NO µg/L | TKN µg/L | pH | TP µg/L | SiO3 mg/L | SO4 mg/L |
|---|---|---|---|---|---|---|---|---|---|---|---|---|---|---|---|---|---|---|---|---|---|
| 18-May-03 | 14.0 | 130 | 6.0 | 2.9 | 40.2 | 59 | 4.2 | 7.4 | 183 | 0.6 | 1.9 | 15.9 | 2.4 | 40 | 36 | 365 | 7.1 | 15.0 | 1.0 | 7.3 | |
| 2-Jul-03 | 11.9 | 62 | 5.8 | 1.5 | 30.6 | 52 | 3.2 | 7.2 | 122 | 0.4 | 1.6 | 20.2 | 1.6 | 36 | 26 | 334 | 6.9 | 10.0 | 0.7 | 7.6 | |
| 20-Jul-03 | 25.1 | 46 | 8.7 | 1.8 | 3.8 | 27.0 | 113 | 6.4 | 7.8 | 138 | 0.4 | 2.8 | 24.9 | 3.2 | 40 | 66 | 465 | 7.5 | 18.8 | 0.2 | 6.8 |
| 28-Aug-03 | 15.3 | 35 | 6.4 | 1.2 | 27.8 | 59 | 3.9 | 5.4 | 140 | 0.4 | 1.9 | 16.4 | 1.5 | 28 | 14 | 249 | 7.2 | 13.0 | 1.2 | 8.7 | |
| 29-Sep-03 | 16.8 | 99 | 6.9 | 1.2 | 25.6 | 66 | 4.5 | 4.8 | 285 | 0.7 | 2.0 | 42.9 | 1.9 | 74 | 52 | 232 | 7.2 | 19.8 | 1.1 | 8.2 | |
| 21-Oct-03 | 17.6 | 89 | 7.1 | 44.6 | 172 | 5.2 | 10.1 | 252 | 1.3 | 6.6 | 21.8 | 6.2 | 50 | 36 | 505 | 6.8 | 19.8 | 0.7 | 6.4 | ||
| 2-Jun-04 | 16.6 | 206 | 4.5 | 1.5 | 47.4 | 43 | 2.4 | 6.9 | 288 | 0.5 | 1.3 | 34.4 | 1.4 | 24 | 62 | 332 | 7.4 | 26.5 | 1.4 | 6.1 | |
| 28-Jun-04 | 13.9 | 45 | 6.0 | 1.3 | 31.6 | 54 | 4.0 | 6.9 | 111 | 0.4 | 1.8 | 20.9 | 1.5 | 26 | 46 | 163 | 7.0 | 8.4 | 1.2 | 7.2 | |
| 21-Jul-04 | 10.3 | 86 | 5.1 | 1.3 | 52.8 | 46 | 2.7 | 8.7 | 192 | 0.4 | 1.5 | 20.8 | 1.4 | 22 | 22 | 7.0 | 15.4 | 1.3 | 5.4 | ||
| 27-Aug-04 | 24.6 | 7.9 | 3.4 | 36.0 | 78 | 6.0 | 7.3 | 0.7 | 2.6 | 3.0 | 2 | 44 | 466 | 7.4 | 22.8 | 0.6 | 6.1 | ||||
| 1-Oct-04 | 19.3 | 29 | 7.0 | 1.9 | 22.0 | 63 | 4.8 | 5.4 | 119 | 0.4 | 2.1 | 15.7 | 1.7 | 26 | 34 | 284 | 7.3 | 8.9 | 1.0 | 8.4 | |
| mean | 16.9 | 83 | 6.4 | 1.8 | 2.5 | 35.1 | 73 | 4.3 | 7.1 | 183 | 0.6 | 2.4 | 23.4 | 2.3 | 33 | 40 | 340 | 7.2 | 16.2 | 0.9 | 7.1 |
| 88-90 mean | 16.2 | 144 | 7.2 | 1.6 | 1.6 | 36.1 | 70 | 4.0 | 7.3 | 183 | 0.6 | 2.1 | 28.0 | 2.5 | 12 | 26 | 322 | 7.1 | 14.0 | 1.2 | 11.0 |
| Date | ALKti CaCO3 | Al mg/L | Ca mg/L | Chl µg/L | Cl mg/L | Coltr true | Cond µS | DIC mg/L | DOC mg/L | Fe µg/L | K mg/L | Mg mg/L | Mn mg/L | Na mg/L | NH µg/L | NO µg/L | TKN µg/L | pH | TP µg/L | SiO3 mg/L | SO4 mg/L |
|---|---|---|---|---|---|---|---|---|---|---|---|---|---|---|---|---|---|---|---|---|---|
| 18-May-03 | 51.7 | 36 | 17.0 | 8.1 | 27.2 | 153 | 13.9 | 6.9 | 84 | 1.1 | 4.8 | 14.6 | 6.0 | 112 | 14 | 1080 | 7.4 | 29.3 | 0.2 | 7.3 | |
| 2-Jul-03 | 59.9 | 20 | 18.8 | 8.2 | 35.2 | 161 | 14.3 | 9.6 | 99 | 1.0 | 5.3 | 18.3 | 6.4 | 142 | 10 | 729 | 7.7 | 40.3 | 0.5 | 5.7 | |
| 20-Jul-03 | 57.0 | 44 | 15.6 | 4.6 | 7.7 | 25.4 | 150 | 13.2 | 9.0 | 105 | 0.8 | 5.2 | 17.0 | 6.2 | 10 | 130 | 588 | 8.0 | 31.5 | 0.5 | 5.5 |
| 28-Aug-03 | 53.2 | 59 | 14.7 | 7.4 | 27.6 | 141 | 9.7 | 8.9 | 125 | 0.3 | 5.0 | 26.5 | 5.6 | 32 | 108 | 647 | 9.3 | 36.6 | 0.4 | 5.0 | |
| 29-Sep-03 | 51.8 | 26 | 15.2 | 7.2 | 25.4 | 138 | 10.7 | 8.5 | 47 | 0.5 | 5.2 | 9.7 | 5.7 | 80 | 10 | 555 | 9.4 | 20.5 | 0.6 | 4.0 | |
| 21-Oct-03 | 20.1 | 41 | 5.4 | 1.7 | 58.2 | 52 | 3.2 | 8.8 | 105 | 0.3 | 1.6 | 4.8 | 1.7 | 24 | 38 | 281 | 7.3 | 10.9 | 1.4 | 6.6 | |
| 2-Jun-04 | 9.1 | 148 | 15.1 | 5.4 | 52.2 | 157 | 8.4 | 238 | 0.9 | 4.0 | 27.7 | 3.3 | 246 | 102 | 782 | 6.9 | 46.9 | 1.1 | 4.4 | ||
| 28-Jun-04 | 60.3 | 17 | 2.9 | 6.6 | 38.8 | 154 | 14.1 | 9.5 | 108 | 0.6 | 5.3 | 18.7 | 5.4 | 94 | 8 | 450 | 7.8 | 31.3 | 0.1 | 4.0 | |
| 21-Jul-04 | 61.1 | 26 | 18.1 | 6.2 | 38.4 | 143 | 11.9 | 10.0 | 127 | 0.3 | 5.3 | 12.8 | 5.0 | 62 | 2 | 152 | 9.5 | 35.5 | 0.1 | 2.8 | |
| 27-Aug-04 | 53.1 | 13.4 | 6.0 | 27.0 | 130 | 7.9 | 9.1 | 0.6 | 5.0 | 5.0 | 2 | 50 | 659 | 9.8 | 18.7 | 0.3 | 4.1 | ||||
| 1-Oct-04 | 49.7 | 15 | 12.0 | 6.3 | 23.0 | 128 | 7.7 | 8.7 | 37 | 0.2 | 9.9 | 8.8 | 4.7 | 50 | 8 | 593 | 9.7 | 17.1 | 0.2 | 3.7 | |
| mean | 47.9 | 43 | 13.5 | 4.6 | 6.4 | 34.4 | 137 | 10.7 | 8.9 | 108 | 0.6 | 5.1 | 15.9 | 5.0 | 78 | 44 | 592 | 8.4 | 29.0 | 0.5 | 4.8 |
| 88-90 mean | 49.0 | 256 | 15.1 | 8.4 | 4.5 | 37.6 | 135 | 8.5 | 8.4 | 175 | 0.7 | 4.7 | 14.6 | 3.4 | 38 | 19 | 595 | 8.6 | 30.0 | 0.7 | 8.6 |
| Date | ALKti CaCO3 | Al mg/L | Ca mg/L | Chl µg/L | Cl mg/L | Coltr true | Cond µS | DIC mg/L | DOC mg/L | Fe µg/L | K mg/L | Mg mg/L | Mn mg/L | Na mg/L | NH µg/L | NO µg/L | TKN µg/L | pH | TP µg/L | SiO3 mg/L | SO4 mg/L |
|---|---|---|---|---|---|---|---|---|---|---|---|---|---|---|---|---|---|---|---|---|---|
| 18-May-03 | 17.3 | 36 | 6.8 | 4.9 | 18.0 | 72 | 5.1 | 5.6 | 78 | 0.7 | 2.2 | 35.1 | 3.6 | 48 | 66 | 302 | 6.9 | 11.6 | 1.1 | 7.6 | |
| 21-Jun-03 | 18.6 | 55 | 6.9 | 4.9 | 16.6 | 72 | 4.8 | 5.5 | 58 | 0.7 | 2.2 | 6.3 | 3.9 | 26 | 12 | 365 | 7.1 | 0.1 | 7.5 | ||
| 20-Jul-03 | 18.5 | 64 | 7.0 | 4.4 | 4.8 | 18.0 | 75 | 4.9 | 4.4 | 84 | 0.7 | 2.2 | 13.8 | 3.8 | 40 | 64 | 365 | 7.2 | 19.8 | 0.3 | 7.3 |
| 28-Aug-03 | 19.5 | 37 | 6.9 | 4.8 | 13.0 | 76 | 5.4 | 4.7 | 62 | 0.7 | 2.2 | 15.1 | 3.7 | 44 | 80 | 336 | 7.0 | 20.5 | 0.8 | 7.5 | |
| 29-Sep-03 | 19.4 | 77 | 7.3 | 4.6 | 17.0 | 80 | 5.1 | 4.8 | 100 | 0.7 | 2.3 | 14.5 | 3.6 | 46 | 12 | 309 | 7.2 | 21.9 | 0.7 | 7.7 | |
| 21-Oct-03 | 12.5 | 99 | 7.1 | 4.5 | 17.8 | 74 | 17.1 | 4.8 | 144 | 0.6 | 2.4 | 13.1 | 3.8 | 28 | 6 | 255 | 7.1 | 17.6 | 0.5 | 7.5 | |
| 2-Jun-04 | 121 | 7.6 | 4.5 | 20.4 | 72 | 4.4 | 4.5 | 110 | 0.6 | 2.1 | 8.5 | 3.5 | 28 | 64 | 343 | 7.4 | 11.0 | 1.0 | 7.3 | ||
| 21-Jul-04 | 17.0 | 96 | 6.5 | 4.6 | 21.6 | 72 | 4.5 | 5.7 | 89 | 0.7 | 2.1 | 8.4 | 3.5 | 34 | 26 | 10 | 7.2 | 13.6 | 0.1 | 5.9 | |
| 9-Sep-04 | 18.0 | 45 | 6.8 | 4.2 | 15.0 | 74 | 4.8 | 5.6 | 55 | 0.7 | 2.2 | 9.3 | 3.2 | 36 | 2 | 339 | 7.3 | 14.4 | 0.5 | 7.2 | |
| mean | 17.6 | 70 | 7.0 | 4.4 | 4.6 | 17.5 | 74 | 6.2 | 5.1 | 87 | 0.7 | 2.2 | 13.8 | 3.6 | 37 | 37 | 292 | 7.2 | 16.3 | 0.6 | 7.3 |
| 88-90 mean | 19.0 | 35 | 7.6 | 3.5 | 4.1 | 19.8 | 81 | 5.0 | 4.8 | 70 | 0.7 | 2.4 | 17.5 | 3.5 | 23 | 23 | 313 | 7.4 | 12.4 | 0.4 | 10.6 |
| Date | ALKti CaCO3 | Al mg/L | Ca mg/L | Chl µg/L | Cl mg/L | Coltr true | Cond µS | DIC mg/L | DOC mg/L | Fe µg/L | K mg/L | Mg mg/L | Mn mg/L | Na mg/L | NH µg/L | NO µg/L | TKN µg/L | pH | TP µg/L | SiO3 mg/L | SO4 mg/L |
|---|---|---|---|---|---|---|---|---|---|---|---|---|---|---|---|---|---|---|---|---|---|
| 18-May-03 | 16.7 | 60 | 6.9 | 7.8 | 29.4 | 85 | 4.7 | 6.5 | 139 | 1.0 | 2.3 | 21.5 | 5.4 | 54 | 676 | 665 | 7.1 | 22.3 | 1.5 | 7.5 | |
| 2-Jul-03 | 18.0 | 66 | 6.9 | 7.2 | 27.8 | 81 | 4.6 | 6.8 | 95 | 0.9 | 2.2 | 7.7 | 5.1 | 50 | 12 | 385 | 7.1 | 33.4 | 0.2 | 7.4 | |
| 20-Jul-03 | 18.9 | 25 | 7.0 | 4.0 | 6.7 | 18.2 | 108 | 5.0 | 7.1 | 94 | 0.7 | 2.3 | 28.8 | 4.9 | 86 | 76 | 393 | 7.2 | 13.6 | 0.2 | 7.2 |
| 28-Aug-03 | 19.7 | 18 | 6.9 | 6.5 | 16.0 | 80 | 5.6 | 5.4 | 83 | 0.8 | 2.2 | 14.9 | 4.6 | 2 | 144 | 386 | 7.2 | 19.6 | 0.6 | 7.2 | |
| 29-Sep-03 | 20.2 | 32 | 7.3 | 6.3 | 18.0 | 88 | 5.5 | 5.6 | 151 | 0.8 | 2.3 | 24.4 | 4.6 | 132 | 52 | 450 | 7.2 | 26.3 | 0.7 | 7.3 | |
| 23-Oct-03 | 45 | 6.8 | 6.4 | 19.6 | 82 | 5.1 | 5.6 | 108 | 0.8 | 2.3 | 9.5 | 4.9 | 36 | 20 | 280 | 8.1 | 21.4 | 0.1 | 7.5 | ||
| 1-Jun-04 | 15.1 | 115 | 5.9 | 6.0 | 43.4 | 74 | 4.3 | 7.7 | 196 | 0.9 | 2.0 | 10.3 | 4.1 | 48 | 82 | 455 | 7.1 | 19.8 | 1.8 | 5.7 | |
| 7-Jul-04 | 15.9 | 105 | 6.3 | 6.6 | 87.4 | 74 | 4.4 | 6.6 | 155 | 0.8 | 2.1 | 11.1 | 4.6 | 32 | 36 | 315 | 7.2 | 15.5 | 0.8 | 6.8 | |
| 27-Aug-04 | 20.8 | 6.9 | 5.6 | 30.0 | 80 | 5.0 | 6.8 | 1.1 | 2.0 | 4.3 | 2 | 88 | 499 | 7.2 | 33.1 | 0.8 | 6.4 | ||||
| 1-Oct-04 | 18.9 | 27 | 6.8 | 5.7 | 22.0 | 79 | 5.3 | 6.4 | 63 | 0.8 | 2.0 | 9.3 | 4.1 | 110 | 8 | 500 | 7.2 | 25.6 | 0.9 | 6.9 | |
| 14-Oct-04 | 19.3 | 31 | 11.0 | 5.7 | 22.0 | 81 | 5.0 | 6.1 | 64 | 0.8 | 2.6 | 7.2 | 4.1 | 4 | 2 | 199 | 7.3 | 18.2 | 0.1 | 7.1 | |
| mean | 18.4 | 52 | 7.2 | 4.0 | 6.4 | 30.3 | 83 | 5.0 | 6.4 | 115 | 0.9 | 2.2 | 14.5 | 4.6 | 51 | 109 | 412 | 7.3 | 22.6 | 0.7 | 7.0 |
| 88-90 mean | 18.4 | 78 | 7.4 | 11.3 | 5.4 | 29.1 | 82 | 4.6 | 6.0 | 140 | 0.9 | 2.4 | 27.2 | 4.0 | 50 | 32 | 504 | 7.4 | 22.6 | 0.7 | 9.4 |
| Date | ALKti CaCO3 | Al mg/L | Ca mg/L | Chl µg/L | Cl mg/L | Coltr true | Cond µS | DIC mg/L | DOC mg/L | Fe µg/L | K mg/L | Mg mg/L | Mn mg/L | Na mg/L | NH µg/L | NO µg/L | TKN µg/L | pH | TP µg/L | SiO3 mg/L | SO4 mg/L |
|---|---|---|---|---|---|---|---|---|---|---|---|---|---|---|---|---|---|---|---|---|---|
| 1-Jun-04 | 17.0 | 55 | 6.6 | 4.3 | 19.6 | 72 | 4.6 | 5.0 | 74 | 0.6 | 2.1 | 11.4 | 3.4 | 38 | 64 | 288 | 7.2 | 12.1 | 1.1 | 7.2 | |
| 7-Jul-04 | 19.2 | 7.0 | 3.8 | 29.6 | 70 | 4.8 | 5.7 | 0.6 | 2.0 | 23.4 | 2.9 | 22 | 38 | 260 | 7.4 | 38.1 | 0.5 | 7.2 | |||
| 27-Aug-04 | 19.6 | 6.7 | 4.4 | 21.0 | 74 | 4.6 | 5.1 | 0.9 | 2.1 | 3.7 | 12 | 290 | 7.5 | 16.8 | 0.3 | 7.0 | |||||
| 1-Oct-04 | 19.6 | 68 | 7.0 | 4.7 | 20.0 | 77 | 5.3 | 5.6 | 69 | 0.7 | 2.2 | 5.7 | 3.6 | 26 | 8 | 287 | 7.4 | 19.1 | 0.5 | 7.4 | |
| 26-Oct-04 | 20.5 | 89 | 7.3 | 3.0 | 16.0 | 76 | 5.3 | 5.0 | 78 | 0.7 | 2.2 | 7.5 | 3.3 | 22 | 8 | 225 | 7.4 | 12.7 | 0.6 | 6.0 | |
| mean | 19.2 | 71 | 6.9 | 4.1 | 21.2 | 74 | 4.9 | 5.3 | 73 | 0.7 | 2.1 | 12.0 | 3.4 | 27 | 26 | 270 | 7.4 | 19.8 | 0.6 | 7.0 | |
| 88-90 mean | 19.4 | 24 | 7.6 | 3.8 | 3.9 | 19.9 | 81 | 5.0 | 5.1 | 75 | 0.7 | 2.4 | 10.9 | 3.5 | 20 | 22 | 316 | 7.4 | 12.4 | 0.4 | 10.6 |
| Date | ALKti CaCO3 | Al mg/L | Ca mg/L | Chl µg/L | Cl mg/L | Coltr true | Cond µS | DIC mg/L | DOC mg/L | Fe µg/L | K mg/L | Mg mg/L | Mn mg/L | Na mg/L | NH µg/L | NO µg/L | TKN µg/L | pH | TP µg/L | SiO3 mg/L | SO4 mg/L |
|---|---|---|---|---|---|---|---|---|---|---|---|---|---|---|---|---|---|---|---|---|---|
| 18-May-03 | 17.9 | 39 | 7.0 | 5.0 | 17.6 | 74 | 5.1 | 5.0 | 88 | 0.7 | 2.2 | 45.9 | 3.9 | 42 | 136 | 236 | 7.1 | 12.0 | 0.7 | 7.4 | |
| 2-Jul-03 | 18.5 | 119 | 7.2 | 5.5 | 27.0 | 75 | 4.8 | 5.4 | 76 | 0.8 | 2.2 | 7.5 | 4.3 | 28 | 62 | 311 | 7.1 | 17.8 | 0.1 | 7.5 | |
| 17-Jul-03 | 18.6 | 75 | 6.9 | 1.2 | 4.9 | 16.2 | 76 | 5.0 | 4.4 | 95 | 0.7 | 2.2 | 13.6 | 3.9 | 66 | 16 | 336 | 7.1 | 16.6 | 0.2 | 7.3 |
| 28-Aug-03 | 19.7 | 55 | 6.9 | 5.5 | 14.4 | 79 | 5.3 | 4.9 | 91 | 0.7 | 2.2 | 16.2 | 4.1 | 2 | 80 | 305 | 7.2 | 18.6 | 0.7 | 7.5 | |
| 29-Sep-03 | 19.3 | 141 | 7.2 | 5.1 | 16.6 | 83 | 5.2 | 4.9 | 206 | 0.7 | 2.3 | 17.0 | 4.0 | 56 | 114 | 341 | 7.3 | 24.4 | 0.6 | 7.6 | |
| 23-Oct-03 | 19.7 | 100 | 7.1 | 4.4 | 18.8 | 74 | 5.1 | 5.0 | 145 | 0.6 | 2.4 | 11.7 | 3.7 | 36 | 6 | 236 | 7.4 | 20.4 | 0.5 | 7.5 | |
| 2-Jun-04 | 16.7 | 95 | 7.5 | 5.3 | 22.6 | 74 | 4.3 | 4.8 | 109 | 0.7 | 2.1 | 8.6 | 4.1 | 36 | 70 | 332 | 7.3 | 17.7 | 1.0 | 7.1 | |
| 7-Jul-04 | 16.9 | 172 | 6.5 | 3.8 | 23.8 | 66 | 4.6 | 5.2 | 178 | 0.6 | 2.1 | 18.7 | 2.9 | 24 | 44 | 218 | 7.2 | 29.8 | 0.6 | 7.1 | |
| 21-Jul-04 | 17.0 | 107 | 6.5 | 4.7 | 22.0 | 72 | 4.4 | 5.8 | 94 | 0.7 | 2.1 | 6.6 | 3.6 | 26 | 26 | 22 | 7.4 | 13.2 | 0.1 | 5.7 | |
| 18-Aug-04 | 17.6 | 77 | 6.6 | 4.6 | 19.0 | 77 | 4.4 | 5.3 | 68 | 0.7 | 2.2 | 6.4 | 3.5 | 2 | 22 | 82 | 7.5 | 15.6 | 0.3 | 7.2 | |
| 1-Oct-04 | 19.2 | 61 | 7.0 | 4.9 | 17.0 | 77 | 5.3 | 5.3 | 69 | 0.7 | 2.1 | 5.9 | 3.7 | 32 | 8 | 177 | 7.3 | 16.1 | 0.5 | 7.1 | |
| 28-Oct-04 | 20.3 | 45 | 7.3 | 4.1 | 20.2 | 75 | 5.4 | 4.4 | 46 | 0.7 | 2.4 | 4.4 | 3.3 | 26 | 16 | 146 | 7.4 | 13.8 | 0.5 | 7.3 | |
| mean | 18.5 | 90 | 7.0 | 4.8 | 19.6 | 75 | 4.9 | 5.0 | 105 | 0.7 | 2.2 | 13.5 | 3.7 | 31 | 50 | 228 | 7.3 | 18.0 | 0.5 | 7.2 | |
| 88-90 mean | 19.7 | 39 | 7.6 | 4.6 | 4.9 | 20.4 | 86 | 5.0 | 5.2 | 100 | 0.8 | 2.4 | 9.6 | 4.1 | 52 | 45 | 406 | 7.4 | 15.1 | 0.4 | 10.6 |
| Date | ALKti CaCO3 | Al mg/L | Ca mg/L | Chl µg/L | Cl mg/L | Coltr true | Cond µS | DIC mg/L | DOC mg/L | Fe µg/L | K mg/L | Mg mg/L | Mn mg/L | Na mg/L | NH µg/L | NO µg/L | TKN µg/L | pH | TP µg/L | SiO3 mg/L | SO4 mg/L |
|---|---|---|---|---|---|---|---|---|---|---|---|---|---|---|---|---|---|---|---|---|---|
| 18-May-03 | 74 | 6.6 | 4.1 | 22.2 | 68 | 4.5 | 5.8 | 97 | 0.7 | 2.1 | 13.9 | 3.3 | 56 | 44 | 743 | 16.8 | 0.6 | 7.5 | |||
| 2-Jul-03 | 17.0 | 71 | 7.0 | 3.9 | 23.0 | 69 | 4.4 | 6.1 | 82 | 0.7 | 2.1 | 7.1 | 3.3 | 48 | 20 | 336 | 7.1 | 12.6 | 0.4 | 7.5 | |
| 20-Jul-03 | 19.0 | 48 | 6.8 | 1.8 | 4.7 | 102 | 5.1 | 5.3 | 74 | 0.7 | 2.2 | 15.2 | 3.7 | 8 | 102 | 338 | 7.1 | 19.4 | 0.2 | 7.3 | |
| 28-Aug-03 | 19.0 | 52 | 6.7 | 4.5 | 13.4 | 73 | 5.3 | 4.7 | 84 | 0.6 | 2.2 | 20.2 | 3.4 | 2 | 192 | 307 | 7.0 | 22.4 | 0.8 | 7.6 | |
| 2-Oct-03 | 19.2 | 77 | 6.8 | 4.6 | 15.6 | 5.1 | 4.6 | 114 | 0.7 | 2.2 | 13.5 | 3.6 | 36 | 46 | 288 | 7.0 | 23.6 | 0.5 | 7.6 | ||
| 31-Oct-03 | 19.3 | 104 | 7.2 | 4.4 | 18.6 | 73 | 4.9 | 5.3 | 134 | 0.7 | 2.2 | 16.9 | 3.7 | 42 | 12 | 298 | 7.2 | 23.8 | 0.7 | 7.4 | |
| 2-Jun-04 | 16.2 | 118 | 7.5 | 4.3 | 23.4 | 69 | 4.3 | 4.8 | 114 | 0.6 | 2.1 | 8.0 | 3.4 | 32 | 58 | 306 | 7.3 | 12.8 | 1.0 | 7.1 | |
| 7-Jul-04 | 17.0 | 124 | 6.6 | 4.8 | 20.6 | 70 | 4.7 | 5.0 | 111 | 0.6 | 2.1 | 12.1 | 3.5 | 32 | 54 | 225 | 7.2 | 19.2 | 0.6 | 7.5 | |
| 9-Sep-04 | 18.4 | 49 | 6.7 | 4.1 | 21.0 | 73 | 4.7 | 5.5 | 52 | 0.7 | 2.2 | 6.4 | 3.1 | 24 | 2 | 327 | 7.4 | 14.2 | 0.4 | 6.9 | |
| 14-Oct-04 | 19.6 | 72 | 10.6 | 4.2 | 18.0 | 76 | 5.0 | 5.0 | 65 | 0.7 | 2.5 | 8.7 | 3.3 | 20 | 2 | 156 | 7.4 | 14.8 | 0.6 | 7.5 | |
| mean | 18.3 | 79 | 7.3 | 1.8 | 4.4 | 19.5 | 75 | 4.8 | 5.2 | 93 | 0.7 | 2.2 | 12.2 | 3.4 | 30 | 53 | 332 | 7.2 | 18.0 | 0.6 | 7.4 |
| 88-90 mean | 18.3 | 88 | 7.0 | 3.6 | 3.5 | 23.9 | 78 | 4.6 | 5.0 | 71 | 0.7 | 2.4 | 12.8 | 3.0 | 18 | 21 | 312 | 7.4 | 12.3 | 0.5 | 10.6 |
| Date | ALKti CaCO3 | Al mg/L | Ca mg/L | Chl µg/L | Cl mg/L | Coltr true | Cond µS | DIC mg/L | DOC mg/L | Fe µg/L | K mg/L | Mg mg/L | Mn mg/L | Na mg/L | NH µg/L | NO µg/L | TKN µg/L | pH | TP µg/L | SiO3 mg/L | SO4 mg/L |
|---|---|---|---|---|---|---|---|---|---|---|---|---|---|---|---|---|---|---|---|---|---|
| 18-May-03 | 47 | 6.4 | 4.3 | 21.4 | 72 | 5.1 | 5.3 | 74 | 0.6 | 2.1 | 25.0 | 3.4 | 50 | 44 | 534 | 10.9 | 0.7 | 7.6 | |||
| 2-Jul-03 | 18.7 | 59 | 7.2 | 4.6 | 18.6 | 74 | 4.7 | 5.6 | 58 | 0.7 | 2.1 | 4.9 | 3.7 | 44 | 44 | 348 | 7.3 | 10.7 | 0.1 | 7.5 | |
| 20-Jul-03 | 18.5 | 45 | 6.9 | 1.6 | 4.7 | 14.2 | 102 | 5.0 | 5.4 | 84 | 0.7 | 2.1 | 19.1 | 3.7 | 6 | 176 | 360 | 7.1 | 19.0 | 0.3 | 7.3 |
| 9-Sep-03 | 18.6 | 61 | 7.1 | 4.7 | 17.8 | 78 | 5.1 | 4.6 | 87 | 0.7 | 2.2 | 15.1 | 3.6 | 72 | 48 | 404 | 7.2 | 13.4 | 0.9 | 7.4 | |
| 28-Jun-04 | 16.4 | 57 | 6.3 | 4.0 | 22.4 | 68 | 5.6 | 6.0 | 71 | 0.7 | 2.1 | 7.9 | 3.4 | 4 | 94 | 196 | 6.9 | 14.9 | 1.0 | 6.6 | |
| mean | 18.1 | 54 | 6.8 | 1.6 | 4.4 | 18.9 | 79 | 5.1 | 5.4 | 75 | 0.7 | 2.1 | 14.4 | 3.6 | 35 | 81 | 368 | 7.1 | 13.8 | 0.6 | 7.3 |
| 88-90 mean | 18.5 | 81 | 7.5 | 3.4 | 3.5 | 22.1 | 78 | 4.7 | 5.1 | 80 | 0.7 | 2.4 | 13.6 | 3.2 | 19 | 21 | 320 | 7.4 | 12.5 | 0.5 | 10.7 |
| Date | ALKti CaCO3 | Al mg/L | Ca mg/L | Chl µg/L | Cl mg/L | Coltr true | Cond µS | DIC mg/L | DOC mg/L | Fe µg/L | K mg/L | Mg mg/L | Mn mg/L | Na mg/L | NH µg/L | NO µg/L | TKN µg/L | pH | TP µg/L | SiO3 mg/L | SO4 mg/L |
|---|---|---|---|---|---|---|---|---|---|---|---|---|---|---|---|---|---|---|---|---|---|
| 18-May-03 | 44 | 6.7 | 4.5 | 20.6 | 69 | 4.9 | 5.3 | 90 | 0.4 | 1.3 | 26.4 | 2.4 | 42 | 54 | 380 | 11.1 | 0.9 | 7.6 | |||
| 2-Jul-03 | 17.3 | 61 | 7.0 | 4.8 | 18.4 | 74 | 4.9 | 5.4 | 74 | 0.7 | 2.1 | 8.4 | 3.7 | 48 | 56 | 336 | 6.9 | 12.5 | 0.2 | 7.5 | |
| 20-Jul-03 | 18.2 | 58 | 6.8 | 2.0 | 4.8 | 15.4 | 100 | 5.0 | 5.3 | 99 | 0.8 | 2.4 | 20.2 | 3.8 | 8 | 76 | 311 | 7.1 | 19.6 | 0.3 | 7.4 |
| 9-Sep-03 | 19.4 | 90 | 7.1 | 4.7 | 12.4 | 79 | 5.1 | 4.4 | 121 | 0.8 | 2.2 | 19.0 | 3.7 | 72 | 2 | 382 | 7.1 | 27.8 | 0.9 | 7.4 | |
| 2-Oct-03 | 19.1 | 80 | 6.9 | 4.6 | 16.0 | 5.1 | 4.4 | 132 | 0.7 | 2.2 | 13.8 | 3.7 | 40 | 20 | 302 | 7.1 | 23.5 | 0.5 | 7.6 | ||
| 31-Oct-03 | 19.5 | 97 | 7.2 | 4.6 | 21.4 | 75 | 4.7 | 5.2 | 133 | 0.7 | 2.2 | 11.0 | 3.8 | 26 | 20 | 291 | 7.3 | 20.6 | 0.5 | 7.5 | |
| 2-Jun-04 | 16.4 | 92 | 7.9 | 4.3 | 21.6 | 71 | 4.3 | 4.7 | 99 | 0.6 | 2.1 | 8.2 | 3.4 | 30 | 62 | 321 | 7.4 | 14.7 | 1.0 | 7.2 | |
| 8-Jul-04 | 17.4 | 75 | 6.5 | 4.4 | 20.8 | 70 | 5.1 | 5.3 | 93 | 0.7 | 2.1 | 9.6 | 3.4 | 30 | 26 | 247 | 7.3 | 20.2 | 0.3 | 7.1 | |
| 9-Sep-04 | 18.1 | 44 | 6.7 | 4.2 | 25.0 | 73 | 4.6 | 5.4 | 56 | 0.7 | 2.2 | 6.6 | 3.2 | 36 | 2 | 373 | 7.4 | 14.2 | 0.4 | 7.1 | |
| 1-Oct-04 | 18.4 | 23 | 6.9 | 4.3 | 17.0 | 73 | 5.2 | 5.2 | 39 | 0.7 | 2.2 | 7.6 | 3.3 | 32 | 8 | 258 | 7.1 | 12.0 | 0.4 | 7.3 | |
| 14-Oct-04 | 19.3 | 41 | 10.3 | 4.3 | 18.0 | 78 | 5.0 | 5.2 | 52 | 0.7 | 2.4 | 7.9 | 3.4 | 30 | 4 | 182 | 7.4 | 14.4 | 0.6 | 7.3 | |
| mean | 18.3 | 64 | 7.3 | 2.0 | 4.5 | 18.8 | 76 | 4.9 | 5.1 | 90 | 0.7 | 2.1 | 12.6 | 3.4 | 36 | 30 | 308 | 7.2 | 17.3 | 0.5 | 7.3 |
| 88-90 mean | 17.7 | 141 | 7.2 | 3.8 | 3.7 | 23.9 | 77 | 4.2 | 5.0 | 86 | 0.7 | 2.3 | 15.1 | 3.3 | 16 | 21 | 315 | 7.4 | 12.3 | 0.6 | 10.4 |
| Date | ALKti CaCO3 | Al mg/L | Ca mg/L | Chl µg/L | Cl mg/L | Coltr true | Cond µS | DIC mg/L | DOC mg/L | Fe µg/L | K mg/L | Mg mg/L | Mn mg/L | Na mg/L | NH µg/L | NO µg/L | TKN µg/L | pH | TP µg/L | SiO3 mg/L | SO4 mg/L |
|---|---|---|---|---|---|---|---|---|---|---|---|---|---|---|---|---|---|---|---|---|---|
| 2-Jun-04 | 16.2 | 172 | 4.1 | 4.1 | 68.8 | 46 | 1.8 | 8.1 | 399 | 0.7 | 1.0 | 38.8 | 3.4 | 40 | 58 | 415 | 7.3 | 22.7 | 1.8 | 5.0 | |
| 8-Jul-04 | 14.7 | 83 | 5.7 | 5.0 | 34.4 | 68 | 4.2 | 6.1 | 282 | 0.7 | 1.9 | 40.6 | 3.9 | 50 | 18 | 301 | 7.0 | 22.9 | 1.0 | 5.8 | |
| 9-Sep-04 | 17.7 | 60 | 5.9 | 8.0 | 11.0 | 79 | 4.7 | 6.0 | 551 | 0.9 | 1.9 | 26.8 | 5.7 | 30 | 10 | 385 | 7.4 | 19.0 | 1.9 | 5.8 | |
| 1-Oct-04 | 19.0 | 39 | 6.7 | 9.2 | 41.0 | 90 | 5.7 | 5.9 | 422 | 1.0 | 2.3 | 22.5 | 7.6 | 32 | 24 | 297 | 7.0 | 16.9 | 1.9 | 6.4 | |
| 14-Oct-04 | 18.1 | 64 | 9.9 | 8.0 | 40.0 | 87 | 5.1 | 5.7 | 462 | 1.0 | 2.4 | 41.1 | 9.6 | 30 | 8 | 188 | 7.1 | 21.3 | 1.9 | 6.3 | |
| mean | 17.1 | 83 | 6.4 | 6.8 | 39.0 | 74 | 4.3 | 6.4 | 423 | 0.9 | 1.9 | 34.0 | 6.1 | 36 | 24 | 317 | 7.1 | 20.6 | 1.7 | 5.8 | |
| new site |
| Date | ALKti CaCO3 | Al mg/L | Ca mg/L | Chl µg/L | Cl mg/L | Coltr true | Cond µS | DIC mg/L | DOC mg/L | Fe µg/L | K mg/L | Mg mg/L | Mn mg/L | Na mg/L | NH µg/L | NO µg/L | TKN µg/L | pH | TP µg/L | SiO3 mg/L | SO4 mg/L |
|---|---|---|---|---|---|---|---|---|---|---|---|---|---|---|---|---|---|---|---|---|---|
| 18-May-03 | 38 | 7.0 | 4.4 | 17.8 | 72 | 4.9 | 5.3 | 65 | 0.7 | 2.2 | 23.5 | 3.5 | 42 | 48 | 1580 | 11.5 | 0.8 | 7.7 | |||
| 2-Jul-03 | 17.7 | 59 | 7.0 | 4.8 | 18.2 | 72 | 4.8 | 5.6 | 59 | 0.7 | 2.1 | 5.8 | 3.7 | 22 | 10 | 303 | 7.1 | 9.2 | 0.1 | 7.5 | |
| 20-Jul-03 | 18.2 | 47 | 6.9 | 1.8 | 4.6 | 16.2 | 99 | 5.2 | 6.5 | 82 | 0.6 | 2.2 | 18.5 | 3.8 | 8 | 130 | 319 | 7.0 | 20.2 | 0.3 | 7.3 |
| 9-Sep-03 | 19.0 | 82 | 7.1 | 4.6 | 12.6 | 79 | 5.1 | 4.4 | 102 | 9.8 | 2.2 | 16.5 | 3.8 | 46 | 58 | 398 | 7.1 | 23.3 | 0.9 | 7.4 | |
| 2-Oct-03 | 18.2 | 80 | 6.7 | 4.6 | 15.8 | 5.1 | 4.4 | 129 | 0.7 | 2.2 | 13.5 | 3.6 | 122 | 22 | 335 | 7.1 | 25.2 | 0.5 | 7.7 | ||
| 31-Oct-03 | 19.8 | 140 | 7.4 | 4.7 | 20.8 | 73 | 4.8 | 5.1 | 129 | 0.7 | 2.3 | 8.3 | 3.8 | 30 | 18 | 284 | 7.3 | 20.1 | 0.5 | 7.6 | |
| 2-Jun-04 | 95 | 7.6 | 4.4 | 20.2 | 71 | 4.2 | 5.1 | 98 | 0.6 | 2.1 | 8.0 | 3.4 | 28 | 60 | 299 | 6.7 | 12.1 | 1.0 | 7.3 | ||
| 8-Jul-04 | 17.1 | 91 | 6.5 | 4.1 | 21.0 | 70 | 4.5 | 5.3 | 93 | 0.7 | 2.1 | 8.6 | 3.4 | 36 | 40 | 243 | 7.3 | 18.4 | 0.3 | 6.6 | |
| 9-Sep-04 | 17.2 | 29 | 6.7 | 4.1 | 17.0 | 73 | 5.2 | 5.5 | 41 | 0.7 | 2.2 | 5.6 | 3.2 | 40 | 4 | 341 | 7.3 | 14.4 | 0.4 | 6.9 | |
| 1-Oct-04 | 18.6 | 27 | 6.7 | 4.3 | 17.0 | 74 | 5.3 | 5.5 | 44 | 0.7 | 2.1 | 6.9 | 3.3 | 32 | 8 | 277 | 7.2 | 12.9 | 0.4 | 7.5 | |
| 14-Oct-04 | 19.4 | 36 | 10.3 | 4.3 | 16.0 | 77 | 5.1 | 5.1 | 49 | 0.7 | 2.4 | 7.3 | 3.3 | 16 | 2 | 192 | 7.3 | 15.1 | 0.6 | 7.6 | |
| mean | 18.4 | 66 | 7.3 | 1.8 | 4.4 | 17.5 | 76 | 4.9 | 5.3 | 81 | 1.5 | 2.2 | 11.1 | 3.5 | 38 | 36 | 416 | 7.1 | 16.6 | 0.5 | 7.3 |
| 88-90 mean | 18.6 | 81 | 7.4 | 3.9 | 3.6 | 21.0 | 79 | 4.7 | 4.9 | 60 | 0.7 | 2.4 | 16.4 | 3.3 | 18 | 25 | 313 | 7.4 | 11.9 | 0.5 | 10.8 |
| Date | ALKti CaCO3 | Al mg/L | Ca mg/L | Chl µg/L | Cl mg/L | Coltr true | Cond µS | DIC mg/L | DOC mg/L | Fe µg/L | K mg/L | Mg mg/L | Mn mg/L | Na mg/L | NH µg/L | NO µg/L | TKN µg/L | pH | TP µg/L | SiO3 mg/L | SO4 mg/L |
|---|---|---|---|---|---|---|---|---|---|---|---|---|---|---|---|---|---|---|---|---|---|
| 18-May-03 | 16.9 | 46 | 6.5 | 3.2 | 28.6 | 66 | 4.9 | 6.4 | 73 | 0.7 | 2.1 | 3.5 | 2.6 | 90 | 16 | 502 | 7.1 | 22.6 | 0.6 | 7.5 | |
| 2-Jul-03 | 22.8 | 119 | 8.0 | 3.7 | 30.2 | 77 | 6.1 | 7.5 | 86 | 0.9 | 2.6 | 14.0 | 3.1 | 76 | 10 | 495 | 7.0 | 24.9 | 0.3 | 6.7 | |
| 20-Jul-03 | 20.2 | 41 | 7.1 | 2.6 | 3.7 | 25.8 | 72 | 5.3 | 5.9 | 101 | 0.7 | 2.3 | 14.2 | 3.0 | 38 | 46 | 447 | 7.1 | 20.3 | 0.3 | 6.6 |
| 28-Aug-03 | 20.2 | 33 | 6.9 | 3.9 | 16.8 | 74 | 5.0 | 5.5 | 90 | 0.5 | 2.3 | 13.9 | 3.1 | 56 | 2 | 373 | 7.3 | 19.0 | 0.6 | 7.0 | |
| 29-Sep-03 | 22.5 | 44 | 7.7 | 4.0 | 18.6 | 81 | 5.9 | 6.0 | 126 | 0.6 | 2.5 | 17.6 | 3.2 | 66 | 6 | 381 | 7.4 | 24.7 | 1.0 | 6.9 | |
| 23-Oct-03 | 19.5 | 106 | 7.1 | 4.0 | 17.4 | 73 | 5.4 | 5.5 | 224 | 0.6 | 2.5 | 22.1 | 3.3 | 44 | 2 | 253 | 7.3 | 26.5 | 0.5 | 6.8 | |
| 2-Jun-04 | 16.3 | 93 | 8.6 | 3.5 | 33.6 | 75 | 6.0 | 6.1 | 152 | 0.9 | 2.6 | 10.6 | 2.7 | 86 | 24 | 439 | 7.3 | 21.7 | 0.9 | 5.5 | |
| 28-Jun-04 | 17.7 | 92 | 6.1 | 2.5 | 37.6 | 61 | 4.9 | 7.9 | 138 | 0.7 | 2.2 | 14.5 | 2.2 | 50 | 8 | 300 | 7.1 | 21.3 | 0.4 | 5.5 | |
| 21-Jul-04 | 18.1 | 80 | 6.5 | 3.3 | 23.4 | 66 | 4.6 | 6.4 | 100 | 0.6 | 2.0 | 9.3 | 2.5 | 26 | 2 | 5 | 7.3 | 16.1 | 0.3 | 4.9 | |
| 27-Aug-04 | 20.8 | 6.8 | 3.4 | 18.0 | 72 | 4.9 | 5.5 | 0.6 | 2.3 | 2.9 | 2 | 36 | 352 | 7.4 | 16.3 | 0.5 | 6.5 | ||||
| 1-Oct-04 | 20.7 | 40 | 7.0 | 3.7 | 16.0 | 73 | 5.3 | 6.0 | 90 | 0.6 | 2.3 | 10.8 | 2.9 | 38 | 8 | 348 | 7.3 | 18.0 | 0.6 | 6.7 | |
| mean | 19.6 | 69 | 7.1 | 2.6 | 3.5 | 24.2 | 72 | 5.3 | 6.2 | 118 | 0.7 | 2.3 | 13.0 | 2.9 | 52 | 15 | 354 | 7.2 | 21.0 | 0.5 | 6.4 |
| 88-90 mean | 23.4 | 70 | 8.0 | 5.3 | 2.5 | 31.2 | 81 | 6.2 | 6.2 | 160 | 0.8 | 2.9 | 13.8 | 2.4 | 49 | 7 | 453 | 7.6 | 24.0 | 0.6 | 9.3 |
| Date | ALKti CaCO3 | Al mg/L | Ca mg/L | Chl µg/L | Cl mg/L | Coltr true | Cond µS | DIC mg/L | DOC mg/L | Fe µg/L | K mg/L | Mg mg/L | Mn mg/L | Na mg/L | NH µg/L | NO µg/L | TKN µg/L | pH | TP µg/L | SiO3 mg/L | SO4 mg/L |
|---|---|---|---|---|---|---|---|---|---|---|---|---|---|---|---|---|---|---|---|---|---|
| 2-Jun-04 | 22.4 | 101 | 6.4 | 2.6 | 25.2 | 56 | 4.2 | 5.0 | 146 | 0.6 | 1.8 | 9.4 | 2.1 | 80 | 20 | 387 | 7.3 | 21.0 | 0.9 | 5.8 | |
| 28-Jun-04 | 15.6 | 183 | 5.6 | 2.3 | 41.0 | 55 | 4.5 | 7.1 | 183 | 0.7 | 2.0 | 13.7 | 2.1 | 58 | 14 | 274 | 7.0 | 27.2 | 0.5 | 5.5 | |
| 21-Jul-04 | 17.3 | 152 | 6.3 | 3.3 | 23.4 | 66 | 4.4 | 6.0 | 136 | 0.6 | 2.2 | 9.0 | 2.8 | 32 | 4 | 205 | 7.3 | 17.0 | 0.2 | 5.3 | |
| 27-Aug-04 | 19.6 | 6.6 | 3.4 | 23.0 | 71 | 4.9 | 5.5 | 0.6 | 2.3 | 3.0 | 2 | 30 | 331 | 7.4 | 17.1 | 0.4 | 6.8 | ||||
| 1-Oct-04 | 18.2 | 68 | 6.5 | 3.6 | 21.0 | 69 | 4.7 | 5.8 | 86 | 0.6 | 2.2 | 7.7 | 3.0 | 32 | 8 | 320 | 7.3 | 15.8 | 0.6 | 7.1 | |
| mean | 18.6 | 126 | 6.3 | 3.1 | 26.7 | 64 | 4.6 | 5.9 | 138 | 0.6 | 2.1 | 9.9 | 2.6 | 41 | 15 | 303 | 7.3 | 19.6 | 0.5 | 6.1 | |
| 88-90 mean | 19.2 | 81 | 7.3 | 3.2 | 2.5 | 25.6 | 73 | 4.5 | 5.7 | 168 | 0.7 | 2.4 | 13.7 | 2.4 | 26 | 7 | 373 | 7.5 | 17.5 | 0.7 | 9.8 |
| Date | ALKti CaCO3 | Al mg/L | Ca mg/L | Chl µg/L | Cl mg/L | Coltr true | Cond µS | DIC mg/L | DOC mg/L | Fe µg/L | K mg/L | Mg mg/L | Mn mg/L | Na mg/L | NH µg/L | NO µg/L | TKN µg/L | pH | TP µg/L | SiO3 mg/L | SO4 mg/L |
|---|---|---|---|---|---|---|---|---|---|---|---|---|---|---|---|---|---|---|---|---|---|
| 18-May-03 | 15.7 | 45 | 5.4 | 2.5 | 22.6 | 54 | 4.4 | 6.4 | 105 | 0.7 | 1.9 | 13.6 | 2.2 | 52 | 6 | 418 | 7.1 | 22.9 | 0.5 | 5.7 | |
| 2-Jul-03 | 16.3 | 119 | 5.7 | 2.6 | 22.4 | 58 | 4.2 | 7.0 | 58 | 0.8 | 2.0 | 9.8 | 2.3 | 58 | 8 | 460 | 7.1 | 20.3 | 0.4 | 5.8 | |
| 19-Jul-03 | 17.9 | 31 | 6.0 | 1.6 | 2.9 | 22.0 | 65 | 4.9 | 5.8 | 84 | 0.6 | 2.2 | 18.0 | 2.7 | 34 | 62 | 404 | 7.0 | 21.7 | 0.4 | 5.9 |
| 28-Aug-03 | 19.3 | 20 | 6.1 | 2.9 | 18.6 | 76 | 5.3 | 6.4 | 72 | 0.7 | 2.2 | 31.1 | 2.4 | 44 | 90 | 346 | 7.0 | 22.0 | 0.9 | 6.0 | |
| 29-Sep-03 | 18.9 | 26 | 6.4 | 3.0 | 17.8 | 69 | 5.1 | 6.3 | 64 | 0.7 | 2.3 | 16.0 | 2.5 | 96 | 4 | 441 | 7.2 | 19.9 | 0.8 | 6.0 | |
| 19-Oct-03 | 20.2 | 32 | 6.0 | 2.9 | 18.6 | 62 | 5.0 | 6.7 | 95 | 0.8 | 2.3 | 19.6 | 2.6 | 70 | 12 | 398 | 7.4 | 23.5 | 0.8 | 5.7 | |
| 2-Jun-04 | 14.4 | 54 | 6.0 | 2.3 | 29.4 | 54 | 4.4 | 6.4 | 142 | 0.6 | 1.8 | 16.1 | 2.1 | 56 | 6 | 391 | 6.9 | 25.0 | 0.7 | 4.2 | |
| 7-Jul-04 | 17.9 | 96 | 5.6 | 2.8 | 32.4 | 58 | 4.9 | 7.7 | 160 | 0.9 | 2.2 | 15.1 | 2.2 | 34 | 6 | 411 | 6.9 | 38.2 | 0.2 | 5.0 | |
| 23-Jul-04 | 17.4 | 44 | 5.6 | 2.6 | 29.0 | 59 | 4.8 | 6.5 | 90 | 0.7 | 2.1 | 11.4 | 2.3 | 92 | 4 | 570 | 7.2 | 35.0 | 0.5 | 4.0 | |
| 27-Aug-04 | 19.5 | 5.9 | 2.6 | 24.0 | 64 | 5.0 | 6.6 | 0.8 | 2.6 | 2.6 | 2 | 56 | 484 | 7.0 | 27.0 | 0.8 | 5.1 | ||||
| 1-Oct-04 | 18.7 | 62 | 5.9 | 2.9 | 22.0 | 65 | 5.6 | 6.8 | 111 | 0.8 | 2.1 | 12.7 | 2.4 | 86 | 8 | 511 | 7.0 | 34.3 | 1.0 | 5.9 | |
| 26-Oct-04 | 18.7 | 44 | 6.2 | 1.1 | 20.2 | 65 | 5.1 | 6.2 | 83 | 0.7 | 2.3 | 10.6 | 2.3 | 60 | 6 | 274 | 7.1 | 23.2 | 1.2 | 2.6 | |
| mean | 17.9 | 52 | 5.9 | 1.6 | 2.6 | 23.3 | 63 | 4.9 | 6.6 | 97 | 0.7 | 2.2 | 15.8 | 2.4 | 57 | 22 | 426 | 7.1 | 26.1 | 0.7 | 5.1 |
| 88-90 mean | 18.4 | 53 | 6.9 | 3.7 | 2.3 | 24.5 | 69 | 4.6 | 6.2 | 131 | 0.7 | 2.5 | 11.8 | 2.0 | 24 | 6 | 420 | 7.4 | 18.7 | 0.8 | 8.6 |
| Date | ALKti CaCO3 | Al mg/L | Ca mg/L | Chl µg/L | Cl mg/L | Coltr true | Cond µS | DIC mg/L | DOC mg/L | Fe µg/L | K mg/L | Mg mg/L | Mn mg/L | Na mg/L | NH µg/L | NO µg/L | TKN µg/L | pH | TP µg/L | SiO3 mg/L | SO4 mg/L |
|---|---|---|---|---|---|---|---|---|---|---|---|---|---|---|---|---|---|---|---|---|---|
| 18-May-03 | 17.2 | 100 | 6.5 | 3.3 | 22.8 | 64 | 5.4 | 5.3 | 153 | 0.7 | 2.1 | 13.3 | 2.6 | 8 | 64 | 283 | 6.6 | 23.2 | 0.4 | 6.8 | |
| 6-Jul-03 | 18.3 | 124 | 6.7 | 4.4 | 17.4 | 72 | 5.0 | 5.5 | 128 | 0.6 | 2.1 | 12.3 | 3.4 | 56 | 18 | 338 | 7.2 | 16.6 | 0.2 | 7.4 | |
| 25-Jul-03 | 18.5 | 113 | 6.7 | 4.0 | 17.4 | 94 | 4.9 | 5.4 | 120 | 0.6 | 2.2 | 10.7 | 3.1 | 54 | 18 | 322 | 7.2 | 19.1 | 0.5 | 7.2 | |
| 9-Sep-03 | 19.3 | 76 | 7.1 | 4.2 | 14.2 | 76 | 5.0 | 4.6 | 75 | 0.9 | 2.2 | 8.4 | 3.5 | 52 | 2 | 316 | 7.2 | 14.5 | 0.9 | 7.4 | |
| 2-Jun-04 | 16.0 | 133 | 6.3 | 2.2 | 30.0 | 52 | 3.3 | 5.4 | 163 | 0.5 | 1.7 | 10.8 | 1.9 | 46 | 66 | 307 | 7.1 | 16.5 | 1.4 | 6.3 | |
| 28-Jun-04 | 16.0 | 76 | 5.8 | 2.3 | 31.6 | 57 | 4.3 | 7.0 | 102 | 0.6 | 2.0 | 8.7 | 2.2 | 42 | 10 | 253 | 7.2 | 17.4 | 0.5 | 5.4 | |
| 21-Jul-04 | 20.0 | 59 | 7.1 | 3.3 | 39.4 | 70 | 5.0 | 7.6 | 134 | 0.7 | 2.6 | 10.8 | 3.2 | 42 | 6 | 321 | 7.5 | 16.0 | 0.5 | 4.9 | |
| 27-Aug-04 | 19.3 | 6.6 | 4.0 | 20.0 | 74 | 4.8 | 4.8 | 0.7 | 2.1 | 3.2 | 2 | 30 | 258 | 7.4 | 14.9 | 0.3 | 7.0 | ||||
| 1-Oct-04 | 18.8 | 28 | 6.7 | 3.9 | 16.0 | 73 | 4.9 | 5.4 | 56 | 0.6 | 2.1 | 11.4 | 3.1 | 26 | 198 | 270 | 7.4 | 13.2 | 0.6 | 7.5 | |
| mean | 18.2 | 89 | 6.6 | 3.5 | 23.2 | 70 | 4.7 | 5.7 | 116 | 0.7 | 2.1 | 10.8 | 2.9 | 36 | 46 | 296 | 7.2 | 16.8 | 0.6 | 6.6 | |
| 88-90 mean | 17.6 | 207 | 7.2 | 3.0 | 2.6 | 28.3 | 73 | 4.5 | 8.4 | 243 | 0.7 | 2.3 | 12.0 | 2.6 | 19 | 12 | 339 | 7.4 | 16.7 | 0.8 | 10.3 |
| Date | ALKti CaCO3 | Al mg/L | Ca mg/L | Chl µg/L | Cl mg/L | Coltr true | Cond µS | DIC mg/L | DOC mg/L | Fe µg/L | K mg/L | Mg mg/L | Mn mg/L | Na mg/L | NH µg/L | NO µg/L | TKN µg/L | pH | TP µg/L | SiO3 mg/L | SO4 mg/L |
|---|---|---|---|---|---|---|---|---|---|---|---|---|---|---|---|---|---|---|---|---|---|
| 18-May-03 | 14.3 | 105 | 5.9 | 3.5 | 29.0 | 60 | 4.2 | 6.4 | 149 | 0.6 | 1.8 | 15.6 | 2.8 | 24 | 56 | 264 | 6.8 | 17.6 | 1.1 | 7.1 | |
| 6-Jul-03 | 18.1 | 92 | 6.8 | 4.4 | 21.0 | 73 | 5.3 | 5.6 | 69 | 0.6 | 2.1 | 3.8 | 3.4 | 14 | 82 | 362 | 7.0 | 23.6 | 0.4 | 7.4 | |
| 25-Jul-03 | 18.2 | 180 | 6.8 | 3.7 | 20.8 | 93 | 4.7 | 5.4 | 188 | 0.6 | 2.2 | 14.5 | 2.9 | 34 | 38 | 335 | 7.2 | 18.0 | 0.6 | 7.3 | |
| 9-Sep-03 | 19.9 | 108 | 7.2 | 4.4 | 12.6 | 78 | 5.2 | 4.5 | 111 | 1.0 | 2.1 | 14.3 | 3.5 | 62 | 2 | 358 | 7.2 | 22.6 | 0.9 | 7.4 | |
| 2-Jun-04 | 12.3 | 129 | 6.7 | 2.9 | 28.2 | 59 | 3.8 | 5.5 | 162 | 0.6 | 1.8 | 13.5 | 2.4 | 58 | 72 | 317 | 7.0 | 20.2 | 1.3 | 6.4 | |
| 28-Jun-04 | 15.8 | 89 | 6.2 | 3.3 | 33.2 | 63 | 4.3 | 6.5 | 97 | 0.6 | 2.0 | 8.7 | 2.9 | 38 | 46 | 212 | 7.2 | 14.4 | 0.8 | 6.4 | |
| 21-Jul-04 | 17.1 | 54 | 6.6 | 3.5 | 23.2 | 68 | 4.3 | 5.7 | 66 | 0.6 | 2.1 | 6.0 | 3.0 | 20 | 8 | 92 | 7.4 | 10.1 | 0.1 | 4.9 | |
| 27-Aug-04 | 19.6 | 6.8 | 4.2 | 20.0 | 74 | 4.7 | 4.5 | 0.8 | 2.3 | 3.7 | 10 | 24 | 292 | 7.4 | 12.1 | 0.3 | 1.2 | ||||
| 1-Oct-04 | 18.7 | 28 | 6.7 | 3.9 | 16.0 | 72 | 4.9 | 5.2 | 40 | 0.6 | 2.2 | 7.4 | 3.1 | 32 | 14 | 259 | 7.3 | 10.1 | 0.6 | 7.2 | |
| mean | 17.1 | 98 | 6.6 | 3.8 | 22.7 | 71 | 4.6 | 5.5 | 110 | 0.7 | 2.1 | 10.5 | 3.1 | 32 | 38 | 277 | 7.2 | 16.5 | 0.7 | 6.1 | |
| 88-90 mean | 18.0 | 129 | 7.2 | 2.5 | 2.9 | 26.3 | 75 | 4.5 | 5.6 | 189 | 1.1 | 2.3 | 16.8 | 2.8 | 19 | 23 | 312 | 7.4 | 15.2 | 0.8 | 10.7 |
| Date | ALKti CaCO3 | Al mg/L | Ca mg/L | Chl µg/L | Cl mg/L | Coltr true | Cond µS | DIC mg/L | DOC mg/L | Fe µg/L | K mg/L | Mg mg/L | Mn mg/L | Na mg/L | NH µg/L | NO µg/L | TKN µg/L | pH | TP µg/L | SiO3 mg/L | SO4 mg/L |
|---|---|---|---|---|---|---|---|---|---|---|---|---|---|---|---|---|---|---|---|---|---|
| 18-May-03 | 18.9 | 45 | 7.0 | 5.6 | 16.4 | 78 | 5.6 | 5.2 | 82 | 0.7 | 2.3 | 15.2 | 4.1 | 10 | 64 | 265 | 7.0 | 15.4 | 0.4 | 7.4 | |
| 6-Jul-03 | 18.2 | 76 | 6.8 | 4.5 | 17.8 | 74 | 4.8 | 5.3 | 72 | 0.6 | 2.1 | 10.5 | 3.4 | 36 | 28 | 327 | 7.1 | 13.2 | 0.2 | 7.5 | |
| 25-Jul-03 | 18.6 | 135 | 6.9 | 4.4 | 17.0 | 99 | 4.9 | 4.9 | 124 | 0.6 | 2.2 | 13.4 | 3.5 | 40 | 28 | 295 | 7.3 | 16.7 | 0.4 | 7.4 | |
| 9-Sep-03 | 19.3 | 81 | 7.2 | 4.5 | 12.6 | 76 | 5.1 | 4.6 | 98 | 0.8 | 2.2 | 20.6 | 3.6 | 50 | 2 | 305 | 7.1 | 22.5 | 0.9 | 7.4 | |
| 2-Jun-04 | 14.0 | 105 | 7.1 | 3.7 | 23.0 | 64 | 4.1 | 4.9 | 124 | 0.6 | 1.9 | 8.5 | 2.9 | 46 | 60 | 301 | 7.1 | 12.7 | 1.1 | 6.8 | |
| 28-Jun-04 | 15.8 | 73 | 6.2 | 3.2 | 28.6 | 65 | 4.2 | 6.6 | 85 | 0.6 | 2.0 | 7.2 | 2.8 | 34 | 44 | 198 | 7.2 | 12.5 | 1.0 | 6.4 | |
| 21-Jul-04 | 17.6 | 70 | 6.6 | 4.1 | 22.6 | 70 | 4.5 | 5.6 | 72 | 0.6 | 2.2 | 5.8 | 3.1 | 20 | 16 | 220 | 7.4 | 12.0 | 0.1 | 6.0 | |
| 27-Aug-04 | 19.6 | 6.7 | 4.1 | 20.0 | 73 | 4.6 | 5.0 | 0.7 | 2.2 | 3.3 | 22 | 24 | 281 | 7.4 | 14.5 | 0.4 | 7.0 | ||||
| 1-Oct-04 | 12.4 | 22 | 6.6 | 4.1 | 17.0 | 74 | 4.8 | 4.8 | 36 | 0.7 | 2.1 | 6.8 | 3.2 | 26 | 8 | 243 | 6.9 | 10.4 | 0.4 | 7.3 | |
| mean | 17.2 | 76 | 6.8 | 4.2 | 19.4 | 75 | 4.7 | 5.2 | 87 | 0.6 | 2.1 | 11.0 | 3.3 | 32 | 30 | 271 | 7.2 | 14.4 | 0.5 | 7.0 | |
| 88-90 mean | 19.2 | 46 | 7.7 | 3.1 | 3.4 | 21.9 | 80 | 5.1 | 5.1 | 101 | 0.7 | 2.5 | 15.8 | 3.2 | 19 | 21 | 304 | 7.4 | 12.6 | 0.5 | 10.7 |
| Date | ALKti CaCO3 | Al mg/L | Ca mg/L | Chl µg/L | Cl mg/L | Coltr true | Cond µS | DIC mg/L | DOC mg/L | Fe µg/L | K mg/L | Mg mg/L | Mn mg/L | Na mg/L | NH µg/L | NO µg/L | TKN µg/L | pH | TP µg/L | SiO3 mg/L | SO4 mg/L |
|---|---|---|---|---|---|---|---|---|---|---|---|---|---|---|---|---|---|---|---|---|---|
| 18-May-03 | 18.8 | 28 | 7.1 | 4.7 | 16.8 | 75 | 5.3 | 5.3 | 55 | 0.6 | 2.3 | 26.4 | 3.5 | 58 | 52 | 327 | 7.0 | 11.6 | 0.9 | 7.7 | |
| 21-Jun-03 | 18.1 | 54 | 6.8 | 4.8 | 17.2 | 73 | 4.9 | 5.5 | 56 | 0.5 | 2.3 | 5.6 | 3.7 | 30 | 12 | 318 | 7.1 | 0.2 | 7.5 | ||
| 20-Jul-03 | 18.3 | 46 | 6.9 | 2.0 | 4.9 | 14.8 | 102 | 4.9 | 5.3 | 74 | 0.8 | 2.2 | 12.0 | 4.1 | 12 | 98 | 338 | 7.1 | 18.8 | 0.3 | 7.4 |
| 28-Aug-03 | 19.5 | 50 | 6.9 | 4.8 | 13.4 | 78 | 5.3 | 4.7 | 75 | 0.7 | 2.1 | 15.9 | 3.6 | 30 | 56 | 304 | 7.1 | 18.6 | 0.8 | 7.6 | |
| 29-Sep-03 | 19.0 | 89 | 7.1 | 4.5 | 17.2 | 79 | 5.1 | 5.1 | 114 | 0.7 | 2.3 | 15.3 | 3.6 | 40 | 16 | 295 | 7.3 | 15.4 | 1.1 | 7.6 | |
| 23-Oct-03 | 20.8 | 96 | 7.1 | 4.5 | 18.2 | 74 | 5.1 | 4.9 | 136 | 0.6 | 2.4 | 12.4 | 3.7 | 26 | 6 | 179 | 7.3 | 21.3 | 0.5 | 7.7 | |
| 2-Jun-04 | 15.1 | 82 | 7.8 | 4.5 | 20.2 | 72 | 4.3 | 4.5 | 87 | 0.6 | 2.1 | 8.3 | 3.5 | 18 | 56 | 310 | 7.1 | 12.3 | 1.0 | 7.3 | |
| 21-Jul-04 | 16.8 | 55 | 6.4 | 4.3 | 20.8 | 70 | 4.4 | 5.4 | 61 | 0.6 | 2.1 | 6.0 | 3.3 | 26 | 20 | 176 | 7.4 | 14.6 | 0.1 | 5.5 | |
| 9-Sep-04 | 20.2 | 47 | 6.8 | 4.2 | 18.0 | 72 | 4.7 | 5.5 | 47 | 0.7 | 2.2 | 5.5 | 3.1 | 16 | 4 | 373 | 7.2 | 12.4 | 0.4 | 7.3 | |
| mean | 18.5 | 61 | 7.0 | 2.0 | 4.6 | 17.4 | 77 | 4.9 | 5.1 | 78 | 0.7 | 2.2 | 11.9 | 3.6 | 28 | 36 | 291 | 7.2 | 15.6 | 0.6 | 7.2 |
| 88-90 mean | 19.3 | 77 | 7.5 | 3.2 | 3.6 | 20.7 | 80 | 4.9 | 5.1 | 73 | 0.7 | 2.4 | 14.1 | 3.1 | 22 | 20 | 296 | 7.4 | 12.2 | 0.5 | 10.6 |
| Date | ALKti CaCO3 | Al mg/L | Ca mg/L | Chl µg/L | Cl mg/L | Coltr true | Cond µS | DIC mg/L | DOC mg/L | Fe µg/L | K mg/L | Mg mg/L | Mn mg/L | Na mg/L | NH µg/L | NO µg/L | TKN µg/L | pH | TP µg/L | SiO3 mg/L | SO4 mg/L |
|---|---|---|---|---|---|---|---|---|---|---|---|---|---|---|---|---|---|---|---|---|---|
| 29-Jun-03 | 18.2 | 99 | 6.8 | 4.5 | 20.0 | 70 | 4.8 | 5.7 | 95 | 0.5 | 2.2 | 13.0 | 3.5 | 46 | 14 | 379 | 7.1 | 18.3 | 0.2 | 7.5 | |
| 20-Jul-03 | 18.6 | 46 | 6.9 | 3.8 | 4.6 | 16.2 | 74 | 5.1 | 4.3 | 74 | 0.8 | 2.1 | 10.6 | 3.4 | 10 | 82 | 330 | 7.2 | 34.7 | 0.3 | 7.3 |
| 28-Aug-03 | 19.5 | 46 | 6.8 | 4.7 | 13.2 | 78 | 5.2 | 4.7 | 71 | 0.7 | 2.2 | 16.6 | 3.6 | 2 | 88 | 289 | 7.1 | 19.9 | 0.8 | 7.6 | |
| 29-Sep-03 | 19.2 | 102 | 7.2 | 4.5 | 21.4 | 79 | 5.1 | 5.1 | 133 | 0.7 | 2.3 | 18.8 | 3.6 | 36 | 20 | 285 | 7.3 | 21.8 | 1.1 | 7.6 | |
| 23-Oct-03 | 19.3 | 174 | 7.0 | 4.4 | 18.0 | 74 | 5.1 | 4.9 | 210 | 0.6 | 2.3 | 21.4 | 3.7 | 24 | 10 | 248 | 7.3 | 21.6 | 0.6 | 7.7 | |
| 2-Jun-04 | 16.7 | 120 | 6.4 | 4.5 | 24.0 | 70 | 4.3 | 4.7 | 119 | 0.6 | 2.1 | 8.2 | 3.5 | 14 | 58 | 334 | 7.3 | 13.7 | 1.0 | 7.2 | |
| 21-Jul-04 | 17.1 | 84 | 6.4 | 4.3 | 22.0 | 69 | 4.4 | 5.4 | 77 | 0.6 | 2.1 | 6.4 | 3.3 | 32 | 18 | 203 | 7.3 | 18.5 | 0.0 | 6.0 | |
| 9-Sep-04 | 47 | 6.7 | 4.1 | 8.0 | 73 | 4.8 | 5.3 | 51 | 0.7 | 2.2 | 7.3 | 3.2 | 18 | 2 | 385 | 5.3 | 17.4 | 0.4 | 7.3 | ||
| mean | 18.4 | 90 | 6.8 | 3.8 | 4.5 | 17.9 | 73 | 4.8 | 5.0 | 104 | 0.7 | 2.2 | 12.8 | 3.5 | 23 | 37 | 307 | 7.0 | 20.7 | 0.6 | 7.2 |
| 88-90 mean | 19.2 | 50 | 7.6 | 3.3 | 3.3 | 20.8 | 80 | 5.1 | 5.0 | 83 | 0.7 | 2.4 | 15.1 | 3.1 | 18 | 21 | 294 | 7.4 | 11.5 | 0.5 | 10.8 |
| Date | ALKti CaCO3 | Al mg/L | Ca mg/L | Chl µg/L | Cl mg/L | Coltr true | Cond µS | DIC mg/L | DOC mg/L | Fe µg/L | K mg/L | Mg mg/L | Mn mg/L | Na mg/L | NH µg/L | NO µg/L | TKN µg/L | pH | TP µg/L | SiO3 mg/L | SO4 mg/L |
|---|---|---|---|---|---|---|---|---|---|---|---|---|---|---|---|---|---|---|---|---|---|
| 18-May-03 | 15.6 | 32 | 6.2 | 3.2 | 20.6 | 64 | 4.7 | 5.6 | 58 | 0.6 | 1.9 | 10.3 | 2.7 | 76 | 48 | 467 | 7.0 | 15.7 | 0.8 | 7.4 | |
| 2-Jul-03 | 17.6 | 6.6 | 4.3 | 18.6 | 72 | 4.6 | 5.9 | 0.9 | 2.0 | 3.4 | 42 | 34 | 328 | 7.1 | 12.7 | 0.2 | 7.4 | ||||
| 20-Jul-03 | 18.2 | 32 | 6.7 | 1.6 | 4.5 | 15.0 | 100 | 4.9 | 5.2 | 48 | 1.9 | 1.8 | 13.9 | 4.5 | 22 | 46 | 299 | 7.1 | 13.6 | 0.1 | 7.3 |
| 28-Aug-03 | 19.3 | 27 | 6.8 | 4.5 | 14.4 | 77 | 5.2 | 4.7 | 21 | 0.7 | 2.1 | 7.1 | 3.5 | 58 | 194 | 378 | 7.1 | 22.8 | 0.7 | 7.5 | |
| 2-Oct-03 | 18.9 | 37 | 6.6 | 4.5 | 13.8 | 5.1 | 4.6 | 81 | 0.7 | 2.2 | 42.3 | 3.6 | 38 | 18 | 301 | 7.1 | 19.4 | 0.4 | 7.5 | ||
| 23-Oct-03 | 20.1 | 49 | 7.1 | 4.4 | 16.8 | 74 | 5.2 | 5.0 | 107 | 0.6 | 2.3 | 42.4 | 3.7 | 36 | 36 | 271 | 7.4 | 21.5 | 0.6 | 7.6 | |
| 2-Jun-04 | 16.5 | 81 | 7.3 | 3.6 | 26.0 | 65 | 4.1 | 4.6 | 95 | 0.6 | 1.9 | 7.2 | 2.9 | 30 | 58 | 317 | 7.3 | 12.0 | 1.0 | 6.8 | |
| 7-Jul-04 | 16.3 | 57 | 6.4 | 3.9 | 23.6 | 67 | 4.6 | 5.3 | 57 | 0.6 | 2.0 | 8.0 | 3.1 | 30 | 48 | 232 | 7.1 | 11.4 | 0.7 | 6.7 | |
| 9-Sep-04 | 30 | 6.5 | 4.2 | 10.0 | 70 | 4.5 | 5.0 | 31 | 0.7 | 2.1 | 7.6 | 3.1 | 30 | 4 | 332 | 5.4 | 12.5 | 0.4 | 7.0 | ||
| 14-Oct-04 | 18.3 | 24 | 10.6 | 4.1 | 17.0 | 74 | 4.8 | 5.0 | 39 | 0.4 | 2.5 | 13.6 | 3.2 | 20 | 20 | 126 | 7.3 | 14.5 | 0.6 | 7.1 | |
| mean | 17.9 | 41 | 7.1 | 1.6 | 4.1 | 17.6 | 74 | 4.7 | 5.1 | 60 | 0.8 | 2.1 | 16.9 | 3.4 | 38 | 51 | 305 | 7.0 | 15.6 | 0.6 | 7.2 |
| 88-90 mean | 18.0 | 49 | 7.4 | 3.2 | 3.2 | 25.6 | 77 | 4.8 | 5.1 | 54 | 0.7 | 2.3 | 20.3 | 3.0 | 21 | 26 | 301 | 7.3 | 11.3 | 0.5 | 10.7 |
| Date | ALKti CaCO3 | Al mg/L | Ca mg/L | Chl µg/L | Cl mg/L | Coltr true | Cond µS | DIC mg/L | DOC mg/L | Fe µg/L | K mg/L | Mg mg/L | Mn mg/L | Na mg/L | NH µg/L | NO µg/L | TKN µg/L | pH | TP µg/L | SiO3 mg/L | SO4 mg/L |
|---|---|---|---|---|---|---|---|---|---|---|---|---|---|---|---|---|---|---|---|---|---|
| 18-May-03 | 35 | 6.2 | 3.2 | 21.2 | 63 | 4.5 | 5.6 | 61 | 0.6 | 1.9 | 10.3 | 2.7 | 74 | 42 | 641 | 15.0 | 0.8 | 7.5 | |||
| 2-Jul-03 | 17.0 | 53 | 7.1 | 4.9 | 20.8 | 73 | 4.7 | 6.4 | 59 | 0.7 | 2.0 | 6.5 | 3.4 | 52 | 220 | 359 | 7.1 | 10.6 | 0.2 | 7.4 | |
| 20-Jul-03 | 18.2 | 22 | 6.8 | 2.6 | 4.4 | 15.6 | 99 | 4.8 | 5.8 | 32 | 0.5 | 1.7 | 9.0 | 3.0 | 46 | 28 | 305 | 7.2 | 28.2 | 0.0 | 7.2 |
| 28-Aug-03 | 19.2 | 25 | 6.7 | 4.5 | 14.2 | 75 | 5.3 | 4.7 | 41 | 0.6 | 2.2 | 12.2 | 3.4 | 62 | 102 | 389 | 7.1 | 18.8 | 0.7 | 7.4 | |
| 2-Oct-03 | 18.8 | 27 | 6.6 | 4.5 | 13.8 | 5.1 | 4.7 | 48 | 0.7 | 2.2 | 17.2 | 3.5 | 34 | 38 | 296 | 7.1 | 16.1 | 0.4 | 7.5 | ||
| 23-Oct-03 | 19.6 | 43 | 7.1 | 4.4 | 16.8 | 76 | 5.2 | 5.0 | 74 | 0.7 | 2.3 | 28.3 | 3.7 | 26 | 28 | 223 | 7.4 | 19.2 | 0.6 | 7.6 | |
| 2-Jun-04 | 15.5 | 60 | 6.8 | 2.9 | 30.4 | 58 | 3.9 | 5.4 | 93 | 0.5 | 1.9 | 11.1 | 2.5 | 32 | 58 | 347 | 7.2 | 11.7 | 0.9 | 6.5 | |
| 9-Sep-04 | -1.5 | 15 | 6.3 | 3.9 | 15.0 | 68 | 4.3 | 5.6 | 40 | 0.6 | 2.0 | 12.8 | 2.9 | 20 | 4 | 313 | 4.7 | 11.5 | 0.3 | 6.8 | |
| 14-Oct-04 | 17.1 | 27 | 4.0 | 18.0 | 71 | 4.7 | 5.2 | 95 | 0.6 | 2.2 | 47.3 | 3.1 | 26 | 2 | 164 | 7.2 | 14.5 | 0.6 | 7.0 | ||
| mean | 15.5 | 34 | 6.7 | 2.6 | 4.1 | 18.4 | 73 | 4.7 | 5.4 | 60 | 0.6 | 2.0 | 17.2 | 3.1 | 41 | 58 | 337 | 6.9 | 16.2 | 0.5 | 7.2 |
| 88-90 mean | 17.8 | 49 | 7.1 | 3.8 | 3.0 | 25.4 | 74 | 4.7 | 5.3 | 52 | 0.7 | 2.2 | 19.4 | 2.9 | 24 | 18 | 308 | 7.3 | 11.4 | 0.5 | 10.4 |
| Date | ALKti CaCO3 | Al mg/L | Ca mg/L | Chl µg/L | Cl mg/L | Coltr true | Cond µS | DIC mg/L | DOC mg/L | Fe µg/L | K mg/L | Mg mg/L | Mn mg/L | Na mg/L | NH µg/L | NO µg/L | TKN µg/L | pH | TP µg/L | SiO3 mg/L | SO4 mg/L |
|---|---|---|---|---|---|---|---|---|---|---|---|---|---|---|---|---|---|---|---|---|---|
| 18-May-03 | 8.6 | 85 | 3.5 | 1.5 | 42.2 | 41 | 2.6 | 8.1 | 211 | 0.7 | 1.4 | 28.8 | 1.6 | 88 | 10 | 488 | 6.8 | 25.0 | 0.9 | 5.8 | |
| 2-Jul-03 | 8.7 | 95 | 3.4 | 1.0 | 53.6 | 45 | 2.5 | 9.9 | 185 | 3.8 | 1.4 | 29.4 | 1.4 | 36 | 12 | 454 | 6.6 | 19.8 | 0.6 | 5.4 | |
| 20-Jul-03 | 9.4 | 58 | 3.6 | 1.6 | 0.6 | 50.8 | 39 | 2.7 | 10.8 | 292 | 0.7 | 1.3 | 64.4 | 1.2 | 80 | 14 | 469 | 6.7 | 18.3 | 0.4 | 4.9 |
| 28-Aug-03 | 8.9 | 50 | 3.2 | 0.4 | 47.8 | 36 | 2.9 | 9.4 | 211 | 0.5 | 1.4 | 32.9 | 1.0 | 78 | 2 | 479 | 6.5 | 19.7 | 0.6 | 4.9 | |
| 29-Sep-03 | 11.2 | 26 | 4.1 | 1.2 | 41.6 | 46 | 3.2 | 8.7 | 189 | 0.5 | 1.7 | 51.8 | 1.6 | 80 | 8 | 499 | 6.8 | 25.1 | 0.6 | 4.7 | |
| 18-Oct-03 | 20.1 | 67 | 3.7 | 1.1 | 50.0 | 41 | 3.0 | 10.2 | 250 | 0.4 | 1.6 | 26.8 | 1.5 | 66 | 14 | 474 | 7.1 | 17.4 | 0.7 | 4.7 | |
| 1-Jun-04 | 7.6 | 87 | 3.3 | 1.0 | 47.6 | 37 | 8.1 | 7.8 | 220 | 0.6 | 1.4 | 20.4 | 1.3 | 86 | 40 | 479 | 6.7 | 1.1 | 4.6 | ||
| 28-Jun-04 | 9.0 | 65 | 3.5 | 1.1 | 55.2 | 37 | 2.6 | 9.2 | 191 | 0.6 | 1.5 | 44.5 | 1.4 | 44 | 10 | 338 | 6.8 | 19.3 | 0.7 | 4.6 | |
| 23-Jul-04 | 9.9 | 59 | 3.6 | 1.3 | 55.6 | 40 | 2.3 | 9.2 | 230 | 0.6 | 1.5 | 24.2 | 1.6 | 30 | 4 | 453 | 6.9 | 17.6 | 0.4 | 4.0 | |
| 27-Aug-04 | 13.9 | 4.1 | 1.5 | 50.0 | 45 | 3.5 | 9.9 | 0.7 | 1.8 | 1.9 | 10 | 56 | 476 | 6.8 | 21.7 | 0.3 | 4.2 | ||||
| 1-Oct-04 | 27.1 | 23 | 4.0 | 1.8 | 37.0 | 45 | 3.2 | 8.2 | 153 | 0.6 | 1.8 | 20.4 | 1.7 | 62 | 8 | 498 | 7.2 | 21.2 | 0.5 | 4.3 | |
| 28-Oct-04 | 12.5 | 33 | 4.9 | 1.7 | 43.6 | 46 | 3.3 | 8.1 | 196 | 0.6 | 1.8 | 21.4 | 1.7 | 54 | 20 | 187 | 7.0 | 24.8 | 0.6 | 5.0 | |
| mean | 12.2 | 59 | 3.8 | 1.6 | 1.2 | 47.9 | 41 | 3.3 | 9.1 | 212 | 0.9 | 1.5 | 33.2 | 1.5 | 60 | 17 | 441 | 6.8 | 20.9 | 0.6 | 4.7 |
| new site |
| Date | ALKti CaCO3 | Al mg/L | Ca mg/L | Chl µg/L | Cl mg/L | Coltr true | Cond µS | DIC mg/L | DOC mg/L | Fe µg/L | K mg/L | Mg mg/L | Mn mg/L | Na mg/L | NH µg/L | NO µg/L | TKN µg/L | pH | TP µg/L | SiO3 mg/L | SO4 mg/L |
|---|---|---|---|---|---|---|---|---|---|---|---|---|---|---|---|---|---|---|---|---|---|
| 18-May-03 | 7.7 | 79 | 3.3 | 0.7 | 43.0 | 36 | 2.4 | 8.3 | 205 | 0.6 | 1.3 | 24.2 | 1.1 | 98 | 10 | 604 | 6.7 | 24.2 | 0.9 | 5.7 | |
| 20-Jul-03 | 9.9 | 60 | 3.8 | 1.2 | 1.4 | 45.2 | 44 | 3.2 | 10.5 | 291 | 0.8 | 1.3 | 60.7 | 1.7 | 108 | 22 | 513 | 6.7 | 21.9 | 0.5 | 4.9 |
| 18-Oct-03 | 63 | 3.5 | 0.6 | 55.0 | 35 | 2.8 | 10.7 | 322 | 0.4 | 1.5 | 40.6 | 1.2 | 62 | 22 | 530 | 7.3 | 17.3 | 0.8 | 4.5 | ||
| 1-Jun-04 | 7.7 | 89 | 3.2 | 0.8 | 49.4 | 35 | 2.5 | 8.3 | 226 | 0.6 | 1.4 | 20.4 | 1.1 | 74 | 46 | 470 | 6.7 | 19.8 | 1.1 | 4.7 | |
| 28-Jun-04 | 8.0 | 76 | 3.2 | 0.5 | 56.0 | 33 | 2.2 | 8.8 | 189 | 0.6 | 1.4 | 26.4 | 1.1 | 26 | 8 | 332 | 6.8 | 16.8 | 0.7 | 4.6 | |
| 23-Jul-04 | 9.2 | 56 | 3.4 | 0.6 | 57.0 | 36 | 2.1 | 9.4 | 240 | 0.5 | 1.5 | 15.7 | 1.1 | 26 | 4 | 470 | 7.0 | 20.6 | 0.4 | 3.3 | |
| 27-Aug-04 | 10.9 | 3.5 | 0.6 | 57.0 | 37 | 2.6 | 9.5 | 0.6 | 1.5 | 1.2 | 2 | 36 | 464 | 6.8 | 19.3 | 0.3 | 4.3 | ||||
| 1-Oct-04 | 18.6 | 36 | 3.3 | 0.7 | 47.0 | 38 | 2.4 | 8.6 | 195 | 0.5 | 1.5 | 17.4 | 1.2 | 56 | 8 | 475 | 9.8 | 24.5 | 0.4 | 4.6 | |
| 28-Oct-04 | 10.1 | 46 | 3.5 | 0.7 | 38.2 | 38 | 2.5 | 8.1 | 260 | 0.6 | 1.6 | 39.7 | 1.2 | 46 | 26 | 132 | 6.9 | 20.2 | 0.6 | 5.3 | |
| 2-Jul-03 | 7.2 | 95 | 3.1 | 0.4 | 54.6 | 35 | 2.2 | 10.2 | 192 | 0.6 | 1.3 | 24.6 | 1.1 | 60 | 10 | 478 | 6.6 | 21.2 | 0.6 | 5.4 | |
| 28-Aug-03 | 20.8 | 15 | 6.2 | 2.7 | 31.6 | 67 | 6.0 | 8.2 | 72 | 0.7 | 2.4 | 28.6 | 2.4 | 230 | 2 | 680 | 6.9 | 39.3 | 1.1 | 5.4 | |
| 29-Sep-03 | 8.8 | 35 | 3.5 | 0.5 | 45.8 | 40 | 2.6 | 9.0 | 156 | 0.6 | 1.5 | 37.9 | 1.2 | 102 | 8 | 542 | 6.8 | 21.3 | 0.6 | 4.8 | |
| mean | 10.8 | 59 | 3.6 | 1.2 | 0.9 | 48.3 | 40 | 2.8 | 9.1 | 213 | 0.6 | 1.5 | 30.6 | 1.3 | 74 | 17 | 474 | 7.1 | 22.2 | 0.7 | 4.8 |
| new site |
PIBS 8609e