Technical Memorandum for 2011: Soil Sampling Former Robson-Lang Tannery Site, Oshawa, Ontario
This memorandum was used to help assess the extent of metal and other contaminants in the soil resulting from past industrial activities on the Central Lake Ontario Conservation Authority property (former Robson-Lang Tannery site). Part of the focus of this study is the paved public walking trail that extends across the property. The Durham Region Health Department has stated that when persons stay on the paved trail areas, no unacceptable health risks are predicted, and while there is some potential for exposure (in particular, in areas beyond the paved path), with normal use of the paved trail (walking, running, biking etc.), the potential for unacceptable risk is very low.
Prepared by:
Terrestrial Assessment Unit Air Monitoring
Transboundary Air Sciences Section
Environmental Monitoring and Reporting Branch
Report No. S3047-2011(a)
September 2011
Introduction
The offices of the Central Lake Ontario Conservation Authority (CLOCA), located at 100 Whiting Avenue, Oshawa, Ontario, reside on lands that were formerly occupied by the Robson-Lang Leathers Limited (Robson-Lang) tannery. In the early 1860s, A.S. Whiting established a farm implement manufacturing facility on the property which was in operation until 1886 (Weymark, 2009). In 1899, a tannery, which was to become the Robson Leather Company Ltd., moved into the vacated buildings of the former farm implement manufacturing facility (Weymark, 2009). By 1905, the tannery had become one of the foremost tanneries in Canada. In 1963, the Robson Leather Company combined with the James Lang Leather Company Limited and the name was changed to Robson-Lang Leathers Limited. In 1977, the Oshawa tannery was closed and in 1980 the buildings were destroyed by fire. Soon after, most of the buildings were demolished however the main office building and former stables were converted into offices for CLOCA (Map 1).
In April 2010, the Ontario Ministry of the Environment’s (MOE or Ministry) York-Durham District Office requested the assistance of the Ministry’s Terrestrial Assessment Unit (TAU) to help delineate and document the extent of contamination associated with past industrial activities on the former Robson-Lang property, with particular emphasis on the walking trail and the forested northeast area of the property.
Methods
On November 10th and 24th, 2010, TAU staff sampled soil at 20 sites on the former Robson-Lang property (Map 1). The Universal Transverse Mercator (UTM) coordinates for the sampling sites are given in Table A1. At each site, duplicate composite soil samples were collected at four depth ranges (0-5 cm, 5-10 cm, 10-15 cm and 15-30 cm) using a stainless steel soil corer (2.5 cm internal diameter). To collect the soil, the soil corer was inserted vertically into the soil to a depth greater than 30 cm or to refusal and extracted. The resulting soil plug was divided into the four depth ranges and the soil core from each depth range was placed in a new polyethylene bag. This process was repeated until a composite sample comprised of nine cores was collected for each depth range. The composite samples were collected over a 10 m × 10 m area using in a 3 × 3 grid sampling pattern. In total, eight bags of soil (nine plugs of soil from each of four depths × two replicates) were collected at each sampling site. The soil corer was washed with a solution of laboratory detergent and rinsed with distilled/de-ionized water prior to sampling at each site
Following collection, the soil samples were taken to the TAU sample processing laboratory at 125 Resources Road in Toronto, where they were processed (air-dried, homogenized, and sieved, first through a 2 mm sieve and then ground and passed through a 355µm sieve). The processed samples were submitted to the Ministry’s Laboratory Services Branch where they were analyzed for metals (laboratory-accredited method E3470), mercury (laboratory-accredited method E3059) and antimony, arsenic and selenium (laboratory-accredited method E3245).
Concentration contour maps for the chromium (all depths) and lead (0-5 cm only) were produced using the Kriging gridding method via the grid-based graphics software program Surfer® 7 (Golden Software, Inc.).
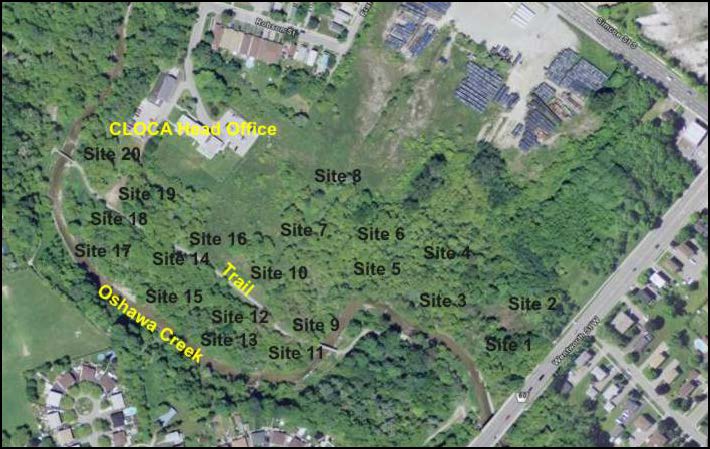
Map 1: Aerial image of former site of Robson-Lang tannery property with sampling site numbers, CLOCA head office, trail and Oshawa Creek labels superimposed on the image Source: Google Earth.
Results and Discussion
Historic contamination of the former Robson-Lang tannery site has been documented by various investigations and sampling programs in the past (PGL, 2007). The current survey was not designed to determine whether contamination existed at this site, but rather to delineate and document the extent of contamination in the vicinity of the walking trail and in the forested northeast area of the property.
Soil samples were collected over an area of approximately 200 m × 450 m (Map 1). Composite soil samples were collected over a 10 × 10 m grid at each of the 20 sampling sites to provide an estimate of the average soil contaminant concentrations at each sampling site. Sampling sites were established along more or less parallel lines; one line transecting the south-southwestern flood plain of the Oshawa Creek, two lines running along on either side of the walking tail and two lines transecting the forested area northeast of Oshawa Creek as shown in Map 1. The former Robson-Lang property is part of the Oshawa Valleylands and the Oshawa Creek flows through the property in a southeasterly direction (Map 1). Old building foundations were evident throughout the area sampled and slag-like material was evident on the creek bank close to Site 9 (Photo 1).
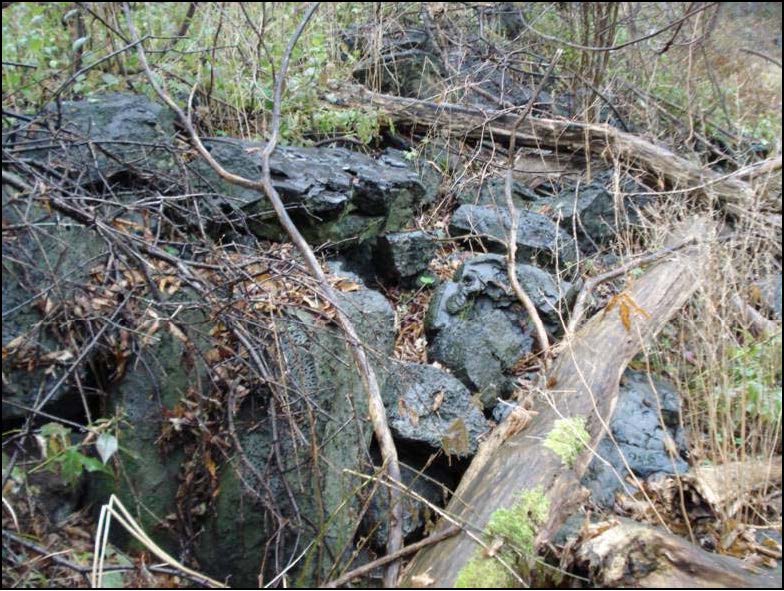
Photo 1: Slag-like material on bank of the Oshawa Creek bank east of Site 9.
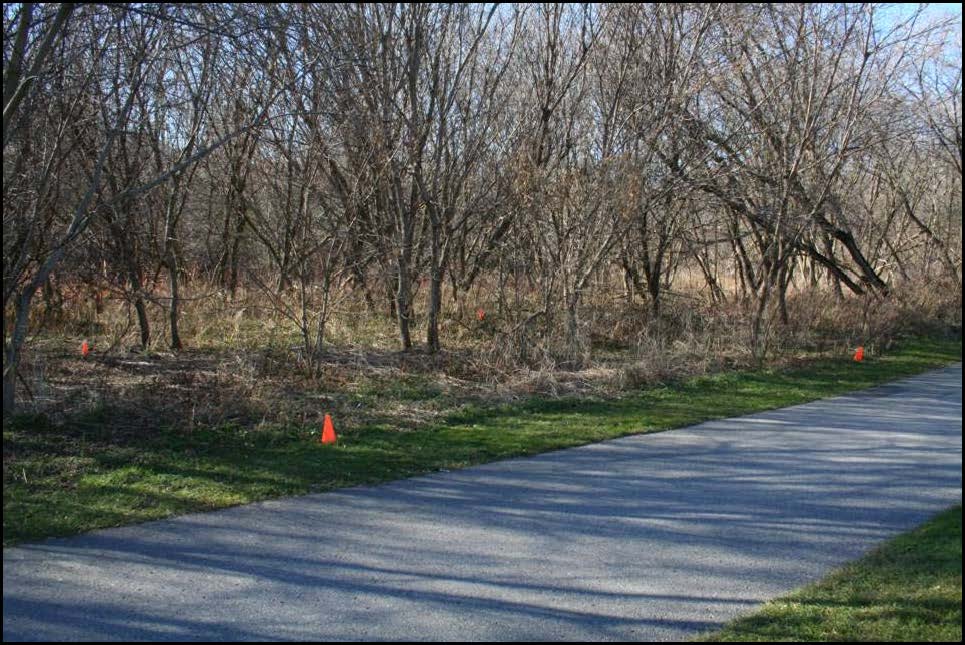
Photo 2: View looking south to Site 14 from the walking trail.
The ash, willow and other hardwood trees in the vicinity of the walking trail and along the Creek tended to be small (Photo 2) with larger trees found generally in the areas of Sites 1 to 6. No visible symptoms of chromium phytotoxicity, which can include stunted growth, purple-green leaves, curled leaves, purpling of leaf basal tissues, and brownish-red leaves containing small necrotic areas (Pratt, 1966) were observed on the vegetation during the collection of the soil samples. This was not unexpected, since chromium phytotoxicity is considered nonexistent under field conditions, except possibly in soils derived from ultrabasic or serpentine rocks (Adriano, 2001). Chromium [both Chromium (III) and Chromium (VI)], is relatively unavailable for plant uptake and tends to accumulate in the roots and not be translocated to plant shoots (Adriano, 2001). Although the trees in the survey area tended to be small and scrubby, this was not attributed to metal toxicity, but rather to the relatively short period of time since the tannery was demolished and the less than ideal substrate (rubble, concrete foundations, old road beds) in which the trees are growing.
At most sampling sites, collecting soil cores to a depth of 30 cm was a challenge due to the shallow soils and buried debris associated with the former industrial facilities that once occupied this site. Consequently, it was not possible to collect soil samples at depth from Sites 10 and 16 and no data is reported for the 15-30 cm depth interval for these sites (Table D).
In general, there were no obvious signs of soil contamination, such as staining, discolouration, chemical/petroleum odours, apart from debris, such as bricks, concrete and glass, from the demolition of the tannery. However, in one soil core, collected at Site 11, there was obvious blue-green staining (Photo 3).
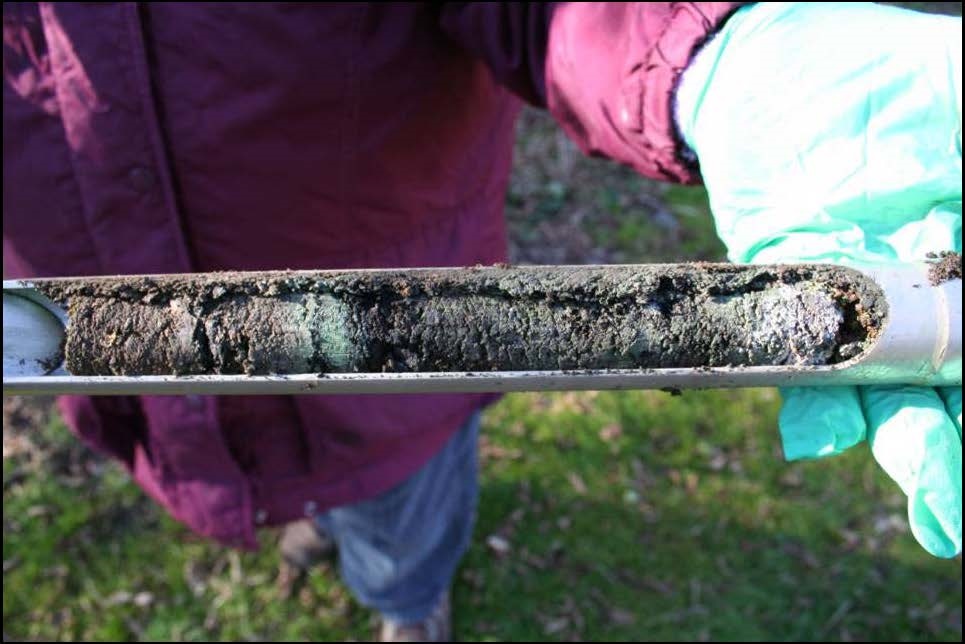
Photo 3: Soil core collected at Site 11 showing blue-green staining.
Chrome tanneries are known to be sources of chromium, lead, copper and zinc contamination, with chromium (III) being by far the most abundant and potentially hazardous constituent of tannery waste (Conrad et. al., 1976). In the current soil survey, chromium concentrations exceeded the MOE Table 9 background-based and Table 3 effects-based standards at all sites sampled except Sites 1 and 2, with concentrations ranging up to 56,000 ug/g (Site 19, Table D). Antimony, arsenic, barium, cadmium, copper, lead, mercury, molybdenum, nickel, thallium and zinc soil concentrations also exceeded these standards (see Tables A to D) at these sites although not to the same degree as chromium. Exceedences for numerous metals were detected at Sites 4, 6, 9, 11, and 19 (see Tables A to D). The high concentrations of metals reported at sites where chromium concentrations were also highly elevated suggesting that the former Robson-Lang tannery was a contributing source of metal contamination.
The reported chromium concentrations are considered "total" concentrations, however, chromium is difficult to extract from soil with the aqua regia digest method used by the Ministry’s analytical laboratory. Therefore, it is possible that the actual chromium concentrations found in the soil are potentially higher than those reported. No metals speciation work was conducted as part of this survey however it is likely that most of the chromium is chromium (III), since only chromium (III) is used in the production of leather (Conrad et. al., 1976).
In this report, the element concentrations are compared to the Ministry’s Ontario Regulation 153/04 Table 9 and Table 3 soil quality standards. Table 9 standards (Generic Site Condition Standards for Use within 30 m of a Water Body in a Non-Potable Ground Water Condition) were applied as the Oshawa Creek runs along the western and southern areas of this property. The Non-Potable Ground Water Condition (Table 3) standards were also applied since this area is serviced by a Municipal water supply. The Table 9 standards are based on the upper limits of typical Ontario-wide background concentrations of element/compounds in soils that are not contaminated by point sources of pollution. The Ministry’s Table 3 standards (Full Depth Generic Site Condition Standards in a Non-Potable Ground Water Condition) are effects-based standards that are derived from effects-based data reported in the scientific literature. The "Parkland" land-use category was applied in comparing the results to these standards since a walking trail, which is used by the public, runs through the southern part of the property.
Concentration contour maps (Figures 1 to 4) were produced for the chromium data based on the four sampling depths (0-5 cm, 5-10 cm, 10-15 cm and 15-30 cm). Overall, chromium concentrations exceeded both the MOE Table 9 and Table 3 soil standards over most of the area sampled. As can be seen in Figure 1, surface soil chromium concentrations tended to be highest in the vicinity of Sites 4 and 6 in the eastern part of the property and lowest in the vicinity of the walking trail. The contamination in the vicinity of Sites 4 to 6 did not extend to Site 1 and 2 which suggests that the contamination may not extend to Wentworth Avenue. Also, the contamination in this area tended to decrease with increasing sampling depth. However, at Sites 9 and 19, the extent of contamination tended to increase with sampling depth (Figures 1 to 4). These concentration contour maps provide statistical approximations of the spatial distribution of chromium concentrations. It should be noted that these concentration contour maps cannot be used to determine actual concentrations of a contaminant at a location where a sample was not taken.
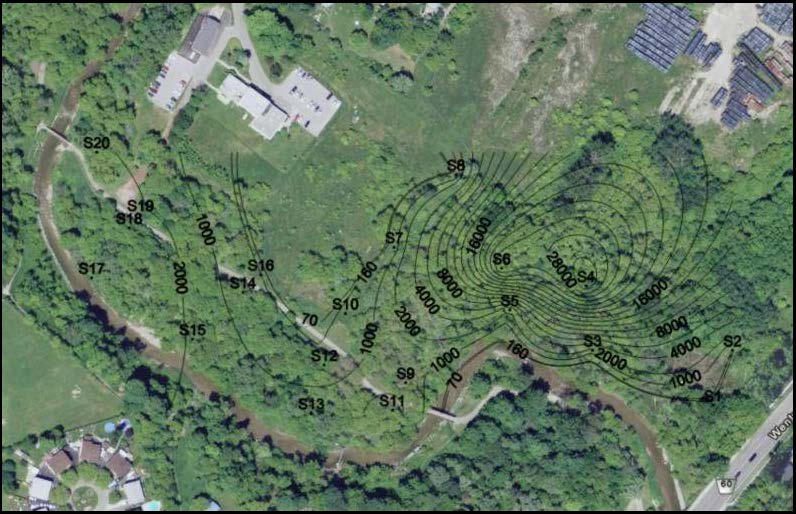
Figure 1: Chromium concentration (ug/g) contours based on the analytical results from soil samples collected at a depth of 0-5 cm. Contour lines are superimposed on an aerial image of the former Robson-Lang tannery site. Source: Google Earth

Figure 2: Chromium concentration (ug/g) contours based on the analytical results from soil samples collected at a depth of 5-10 cm. Contour lines are superimposed on an aerial image of the former Robson-Lang tannery site. Source: Google Earth
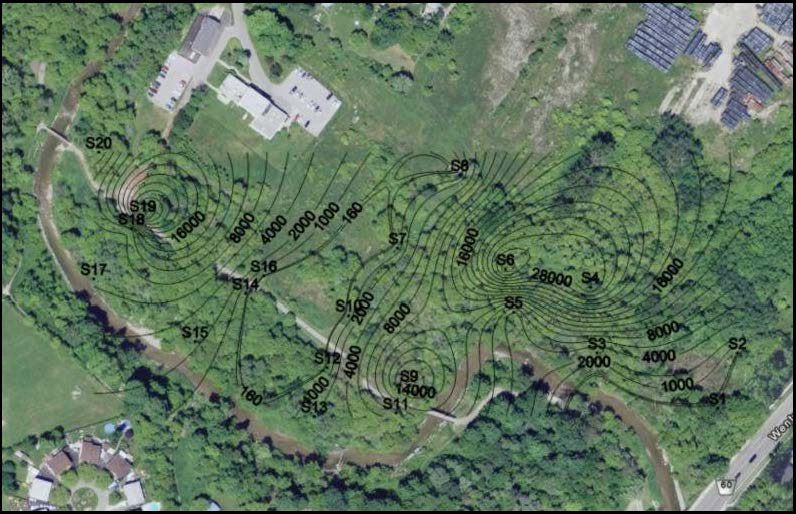
Figure 3: Chromium concentration (ug/g) contours based on the analytical results from soil samples collected at a depth of 10-15 cm. Contour lines are superimposed on an aerial image of the former Robson-Lang tannery site. Source: Google Earth

Figure 4: Chromium concentration (ug/g) contours based on the analytical results from soil samples collected at a depth of 15-30 cm. Contour lines are superimposed on an aerial image of the former Robson-Lang tannery site. Source: Google Earth
In addition, a concentration contour map was constructed from surface lead (0-5 cm) (Figure 5). Surface soil lead concentrations were highest in the wooded areas around Sites 3, 4 and 6 and at background concentrations along some sections of the walking trail (between Site 12 and 14).
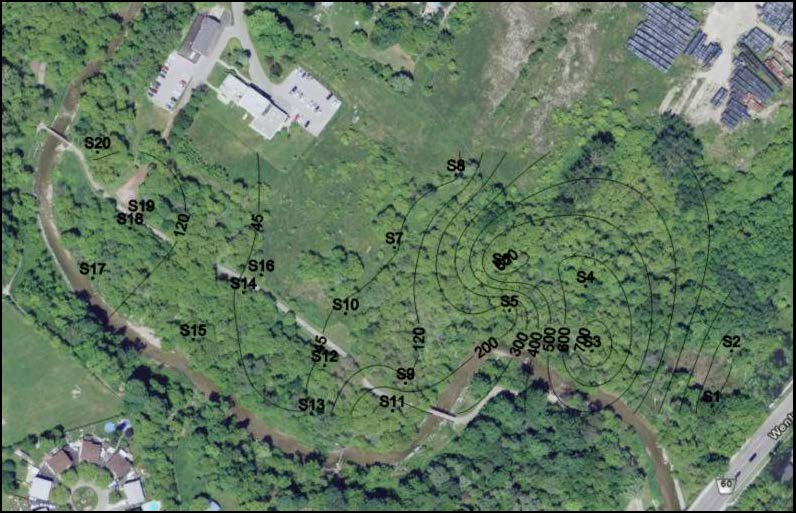
Figure 5: Lead concentration (ug/g) contours based on the analytical results from soil samples collected at a depth of 0-5 cm. Contour lines are superimposed on an aerial image of the former Robson-Lang tannery site. Source: Google Earth
Conclusion
High levels of chromium, barium, lead and zinc contamination, well above the MOE Table 3 effects-based standards, were detected at most sites sampled on the former Robson-Lang tannery lands. In addition, concentrations of antimony, arsenic, cadmium, copper, mercury, molybdenum, nickel and silver consistently exceeded the MOE Table 9 background-based standards at most sites.
Contour maps of surface soil concentrations (0-5 cm) of chromium and lead showed that contamination was greatest in the wooded northeastern area of the property but did not extend to Wentworth Avenue. In this area, contaminant concentrations tended to decrease with increasing soil depth. However, at Sites 9 and 19, chromium concentrations were high in surface soil but tended to increase with sampling depth. The highest chromium concentration detected (56,000 ug/g chromium) was reported at Site 19 at a depth of 15-30 cm. Overall, the soil samples collected from the former Robson-Lang property were found to be highly contaminated with metals which are primarily attributable to tannery wastes from the former Robson-Lang tannery.
| Site | Replicate | Aluminum | Antimony | Arsenic | Barium | Beryllium | Boron |
|---|---|---|---|---|---|---|---|
| 1 | A | 4300 | 0.5 <T | 4.2 | 120 | 0.33 | 11 |
| 1 | B | 4400 | 0.4 <T | 3.1 | 120 | 0.33 | 9.5 |
| 2 | A | 13000 | 0.2 ≤W | 1.9 | 120 | 0.58 | 11 |
| 2 | B | 11000 | 0.2 ≤W | 2.2 | 110 | 0.5 | 8.8 |
| 3 | A | 9500 | 0.5 <T | 3.3 | 140 | 0.65 | 15 |
| 3 | B | 9200 | 0.5 <T | 2.6 | 110 | 0.5 | 16 |
| 4 | A | 4400 | 7.2* | 17 | 160 | 0.43 | 15 |
| 4 | B | 5400 | 8.3** | 15 | 170 | 0.53 | 13 |
| 5 | A | 7200 | 1.6* | 2.3 | 93 | 0.38 | 12 |
| 5 | B | 8600 | 1.1 | 2.1 | 100 | 0.45 | 15 |
| 6 | A | 6600 | 8.3** | 32** | 1000** | 0.83 | 19 |
| 6 | B | 6800 | 6.8** | 21** | 650** | 0.98 | 19 |
| 7 | A | 8100 | 0.3 <T | 4.5 | 82 | 0.43 | 10 |
| 7 | B | 9300 | 0.4 <T | 4.8 | 90 | 0.5 | 12 |
| 8 | A | 6900 | 0.2 ≤W | 1.8 | 49 | 0.38 | 9.5 |
| 8 | B | 7800 | 0.2 ≤W | 2 | 57 | 0.38 | 9.8 |
| 9 | A | 7200 | 1.2 | 2.7 | 680** | 0.33 | 16 |
| 9 | B | 6800 | 1.8* | 2.4 | 710** | 0.33 | 14 |
| 10 | A | 9800 | 0.5 <T | 2 | 110 | 0.43 | 10 |
| 10 | B | 10000 | 0.5 <T | 1.9 | 110 | 0.48 | 12 |
| 11 | A | 9500 | 4.6* | 4.4 | 1900** | 0.35 | 18 |
| 11 | B | 10000 | 4.4* | 4 | 1900** | 0.33 | 18 |
| 12 | A | 9800 | 0.5 <T | 2 | 87 | 0.33 | 9.8 |
| 12 | B | 11000 | 0.5 <T | 2.8 | 91 | 0.35 | 10 |
| 13 | A | 5700 | 1 | 7.9 | 120 | 0.28 | 22 |
| 13 | B | 4700 | 0.7 <T | 6.1 | 140 | 0.2 | 14 |
| 14 | A | 9500 | 0.4 <T | 2.4 | 71 | 0.3 | 9 |
| 14 | B | 9200 | 0.3 <T | 2.1 | 69 | 0.25 | 8 |
| 15 | A | 5800 | 0.7 <T | 3.1 | 180 | 0.23 | 13 |
| 15 | B | 5300 | 0.6 <T | 2.5 | 170 | 0.23 | 12 |
| 16 | A | 9700 | 0.3 <T | 2.2 | 62 | 0.4 | 7.3 |
| 16 | B | 10000 | 0.3 <T | 2.1 | 63 | 0.43 | 7.5 |
| 17 | A | 6100 | 1.2 | 4.9 | 320 | 0.43 | 18 |
| 17 | B | 6900 | 1.2 | 6.2 | 390 | 0.48 | 20 |
| 18 | A | 9400 | 1 | 6.9 | 350 | 0.58 | 15 |
| 18 | B | 11000 | 1.2 | 8.3 | 460** | 0.68 | 19 |
| 19 | A | 10000 | 1.4 | 6.7 | 320 | 0.63 | 13 |
| 19 | B | 9200 | 1.3 | 8.1 | 210 | 0.58 | 12 |
| 20 | A | 10000 | 0.7 <T | 4.8 | 230* | 0.58 | 19 |
| 20 | B | 11000 | 0.9 <T | 4.4 | 200 | 0.55 | 18 |
| Maximum | 13000 | 8.3 | 32 | 1900 | 0.98 | 22 | |
| MOE Table 9 | NV | 1.3 | 18 | 220 | 2.5 | 36 | |
| MOE Table 3 | NV | 7.5 | 18 | 390 | 4 | 120 | |
| Site | Replicate | Cadmium | Calcium | Chromium | Cobalt | Copper | Iron |
|---|---|---|---|---|---|---|---|
| 1 | A | 0.4 | 240000 | 43 | 2.4 | 30 | 6900 |
| 1 | B | 0.4 | 290000 | 44 | 2.4 | 17 | 6000 |
| 2 | A | 0.1 <MDL | 120000 | 46 | 5.6 | 22 | 15000 |
| 2 | B | 0.2 | 99000 | 48 | 4.7 | 20 | 13000 |
| 3 | A | 0.4 | 74000 | 1400** | 5.6 | 35 | 16000 |
| 3 | B | 0.4 | 79000 | 950** | 5 | 31 | 15000 |
| 4 | A | 0.8 | 82000 | 35000** | 7.8 | 48 | 65000 |
| 4 | B | 0.9 | 84000 | 29000** | 7.8 | 44 | 60000 |
| 5 | A | 0.3 | 95000 | 1400** | 3.9 | 19 | 15000 |
| 5 | B | 0.4 | 100000 | 1700** | 4.9 | 22 | 14000 |
| 6 | A | 4.9** | 89000 | 31000** | 7.8 | 76 | 50000 |
| 6 | B | 4.1** | 88000 | 27000** | 8.5 | 65 | 45000 |
| 7 | A | 0.2 | 110000 | 440** | 4.8 | 16 | 16000 |
| 7 | B | 0.2 | 110000 | 470** | 5.4 | 17 | 17000 |
| 8 | A | 0.1 <MDL | 110000 | 150* | 4.1 | 11 | 13000 |
| 8 | B | 0.1 <MDL | 110000 | 180** | 4.2 | 13 | 14000 |
| 9 | A | 0.6 | 77000 | 1200** | 3.5 | 56 | 17000 |
| 9 | B | 0.8 | 81000 | 1600** | 3.2 | 55 | 15000 |
| 10 | A | 0.3 | 87000 | 260** | 4.8 | 18 | 16000 |
| 10 | B | 0.4 | 96000 | 300** | 5.2 | 19 | 17000 |
| 11 | A | 1.9** | 81000 | 2500** | 4.9 | 130* | 23000 |
| 11 | B | 2.6** | 80000 | 2700** | 4.7 | 150** | 22000 |
| 12 | A | 0.2 | 77000 | 160* | 4.7 | 18 | 15000 |
| 12 | B | 0.3 | 72000 | 200** | 5.2 | 19 | 15000 |
| 13 | A | 0.9 | 43000 | 1600** | 4.5 | 80 | 49000 |
| 13 | B | 0.8 | 55000 | 2000** | 3.5 | 48 | 33000 |
| 14 | A | 0.3 | 38000 | 510** | 3.8 | 15 | 16000 |
| 14 | B | 0.3 | 37000 | 530** | 3.6 | 13 | 15000 |
| 15 | A | 0.8 | 79000 | 2000** | 3.2 | 25 | 12000 |
| 15 | B | 0.8 | 84000 | 1800** | 3 | 22 | 11000 |
| 16 | A | 0.3 | 49000 | 170** | 4.2 | 15 | 16000 |
| 16 | B | 0.2 | 50000 | 170** | 4.5 | 16 | 17000 |
| 17 | A | 3.3** | 64000 | 3600** | 3.8 | 40 | 14000 |
| 17 | B | 3.4** | 56000 | 3700** | 4.3 | 47 | 15000 |
| 18 | A | 2** | 76000 | 3500** | 4.8 | 38 | 18000 |
| 18 | B | 2.6** | 81000 | 4500** | 5.5 | 46 | 19000 |
| 19 | A | 1 | 45000 | 2100** | 5.7 | 37 | 20000 |
| 19 | B | 1 | 50000 | 2300** | 5.2 | 32 | 19000 |
| 20 | A | 1.8** | 66000 | 2200** | 6.3 | 34 | 19000 |
| 20 | B | 1.5** | 65000 | 2200** | 6 | 34 | 19000 |
| Maximum | 4.9 | 290000 | 35000 | 8.5 | 150 | 65000 | |
| MOE Table 9 | 1.2 | NV | 70 | 22 | 92 | NV | |
| MOE Table 3 | 1.2 | NV | 160 | 22 | 140 | NV | |
| Site | Replicate | Lead | Magnesium | Manganese | Mercury | Molybdenum | Nickel |
|---|---|---|---|---|---|---|---|
| 1 | A | 42 | 2200 | 180 | 0.03 <T | 0.5 <MDL | 14 |
| 1 | B | 39 | 2200 | 160 | 0.06 | 0.5 | 12 |
| 2 | A | 48 | 5100 | 280 | 0.04 <T | 0.5 <MDL | 17 |
| 2 | B | 56 | 4300 | 260 | 0.04 <T | 0.5 <MDL | 16 |
| 3 | A | 300** | 4400 | 500 | 0.06 | 1 | 19 |
| 3 | B | 1300** | 4500 | 500 | 0.08 | 0.5 | 17 |
| 4 | A | 790** | 4900 | 440 | 1.1** | 18** | 180** |
| 4 | B | 540** | 5100 | 460 | 1.3** | 16** | 140** |
| 5 | A | 130** | 5100 | 290 | 0.05 | 1 | 18 |
| 5 | B | 90 | 5400 | 350 | 0.06 | 1 | 17 |
| 6 | A | 750** | 5100 | 440 | 1.1** | 16** | 150** |
| 6 | B | 620** | 5400 | 450 | 1.2** | 14** | 150** |
| 7 | A | 27 | 5800 | 310 | 0.02 <T | 0.5 <MDL | 14 |
| 7 | B | 33 | 5900 | 320 | 0.04 <T | 0.5 <MDL | 16 |
| 8 | A | 23 | 6700 | 290 | 0.04 <T | 0.5 <MDL | 29 |
| 8 | B | 23 | 7100 | 320 | 0.04 <T | 0.5 <MDL | 29 |
| 9 | A | 120** | 4000 | 290 | 0.07 | 2.5* | 25 |
| 9 | B | 120** | 4000 | 260 | 0.08 | 2 | 22 |
| 10 | A | 52 | 5900 | 320 | 0.04 <T | 0.5 <MDL | 13 |
| 10 | B | 62 | 6200 | 350 | 0.04 <T | 0.5 <MDL | 15 |
| 11 | A | 390** | 4200 | 290 | 0.26 | 6.5* | 28 |
| 11 | B | 420** | 4300 | 300 | 0.32** | 6.5* | 30 |
| 12 | A | 53 | 6000 | 390 | 0.03 <T | 0.5 <MDL | 19 |
| 12 | B | 56 | 5600 | 380 | 0.03 <T | 0.5 <MDL | 19 |
| 13 | A | 50 | 3100 | 970 | 0.04 <T | 8.5** | 36 |
| 13 | B | 43 | 3200 | 590 | 0.05 | 4.5* | 22 |
| 14 | A | 37 | 4100 | 290 | 0.06 | 0.5 <MDL | 13 |
| 14 | B | 36 | 4000 | 280 | 0.06 | 0.5 <MDL | 13 |
| 15 | A | 80 | 4000 | 250 | 0.07 | 0.5 <MDL | 13 |
| 15 | B | 75 | 4000 | 240 | 0.08 | 0.5 <MDL | 12 |
| 16 | A | 35 | 3900 | 340 | 0.04 <T | 0.5 <MDL | 12 |
| 16 | B | 34 | 4100 | 340 | 0.05 | 0.5 <MDL | 13 |
| 17 | A | 130** | 3600 | 240 | 0.18 | 1 | 21 |
| 17 | B | 140** | 3500 | 250 | 0.21 | 1 | 24 |
| 18 | A | 130** | 4700 | 260 | 0.1 | 1.5 | 21 |
| 18 | B | 160** | 5100 | 280 | 0.12 | 1 | 25 |
| 19 | A | 210** | 4400 | 290 | 0.18 | 1.5 | 20 |
| 19 | B | 150** | 4300 | 260 | 0.22 | 1 | 18 |
| 20 | A | 120 | 5600 | 330 | 0.1 | 1 | 32 |
| 20 | B | 110 | 5300 | 310 | 0.1 | 0.5 | 30 |
| Maximum | 1300 | 7100 | 970 | 1.3 | 18 | 180 | |
| MOE Table 9 | 120 | NV | NV | 0.27 | 2 | 82 | |
| MOE Table 3 | 120 | NV | NV | 0.27 | 6.9 | 100 | |
| Site | Replicate | Phosphorus | Potassium | Selenium | Silver | Sodium | Strontium |
|---|---|---|---|---|---|---|---|
| 1 | A | 850 | 750 | 0.7 <T | 0.2 <MDL | 100 | 100 |
| 1 | B | 950 | 700 | 0.6 <T | 0.2 <MDL | 100 | 110 |
| 2 | A | 850 | 2300 | 1 | 0.2 <MDL | 750 | 110 |
| 2 | B | 900 | 1800 | 1 | 0.2 <MDL | 800 | 92 |
| 3 | A | 1300 | 1900 | 0.3 <T | 0.2 <MDL | 250 | 87 |
| 3 | B | 1100 | 1800 | 0.3 <T | 0.2 <MDL | 250 | 87 |
| 4 | A | 2000 | 1100 | 0.6 <T | 1.6* | 100 | 120 |
| 4 | B | 1300 | 1300 | 0.5 <T | 1.4* | 150 | 120 |
| 5 | A | 1300 | 1500 | 0.2 ≤W | 0.2 <MDL | 200 | 110 |
| 5 | B | 1200 | 1800 | 0.2 ≤W | 0.2 <MDL | 250 | 110 |
| 6 | A | 1100 | 1400 | 0.9 <T | 1.6* | 200 | 160 |
| 6 | B | 100 | 1500 | 0.9 <T | 0.4 | 150 | 150 |
| 7 | A | 1100 | 2300 | 0.2 ≤W | 0.2 <MDL | 250 | 140 |
| 7 | B | 1100 | 2500 | 0.2 ≥W | 0.2 <MDL | 250 | 140 |
| 8 | A | 900 | 1800 | 0.2 ≤W | 0.2 <MDL | 250 | 150 |
| 8 | B | 800 | 2000 | 0.2 ≤W | 0.2 <MDL | 250 | 150 |
| 9 | A | 1300 | 1300 | 0.2 ≤W | 0.4 | 300 | 110 |
| 9 | B | 1100 | 1200 | 0.2 ≤W | 0.4 | 300 | 120 |
| 10 | A | 950 | 2500 | 0.2 ≤W | 0.2 <MDL | 250 | 120 |
| 10 | B | 950 | 2800 | 0.2 ≤W | 0.2 <MDL | 250 | 120 |
| 11 | A | 1100 | 1400 | 0.2 ≤W | 0.4 | 350 | 150 |
| 11 | B | 1200 | 1400 | 0.2 ≤W | 0.2 <MDL | 400 | 150 |
| 12 | A | 950 | 2200 | 0.2 ≤W | 0.2 <MDL | 250 | 110 |
| 12 | B | 1100 | 2300 | 0.2 ≤W | 0.2 <MDL | 250 | 100 |
| 13 | A | 750 | 750 | 0.3 <T | 0.2 <MDL | 200 | 170 |
| 13 | B | 750 | 750 | 0.3 <T | 0.2 <T | 200 | 140 |
| 14 | A | 1100 | 1500 | 0.2 ≤W | 0.2 <MDL | 150 | 58 |
| 14 | B | 850 | 1300 | 0.2 ≤W | 0.2 <MDL | 150 | 56 |
| 15 | A | 1000 | 1100 | 0.3 <T | 0.2 <MDL | 200 | 110 |
| 15 | B | 1200 | 1000 | 0.2 ≤W | 0.2 <MDL | 200 | 130 |
| 16 | A | 950 | 1700 | 0.2 ≤W | 0.2 <MDL | 200 | 69 |
| 16 | B | 1000 | 1700 | 0.2 ≤W | 0.2 <MDL | 200 | 69 |
| 17 | A | 1100 | 1100 | 0.4 <T | 0.2 <MDL | 200 | 110 |
| 17 | B | 1200 | 1200 | 0.5 <T | 0.2 <MDL | 200 | 110 |
| 18 | A | 1300 | 2000 | 0.3 <T | 0.2 <MDL | 200 | 130 |
| 18 | B | 1400 | 2400 | 0.4 <T | 0.2 <MDL | 200 | 140 |
| 19 | A | 1200 | 2200 | 0.3 <T | 0.2 <MDL | 200 | 85 |
| 19 | B | 1300 | 1900 | 0.4 <T | 0.2 <MDL | 200 | 89 |
| 20 | A | 1400 | 2400 | 0.4 <T | 0.2 <MDL | 250 | 99 |
| 20 | B | 1100 | 2200 | 0.3 <T | 0.2 <MDL | 250 | 98 |
| Maximum | 2000 | 2800 | 1 | 1.6 | 800 | 170 | |
| MOE Table 9 | NV | NV | 1.5 | 0.5 | NA | NV | |
| MOE Table 3 | NV | NV | 2.4 | 20 | NA | NV | |
| Site | Replicate | Sulphur | Thallium | Tin | Titanium | Vanadium | Zinc |
|---|---|---|---|---|---|---|---|
| 1 | A | 50 | 10** | 2.5 <MDL | 130 | 12 | 81 |
| 1 | B | 50 | 10** | 5 | 140 | 9.8 | 67 |
| 2 | A | 700 | 5 <MDL | 2.5 <MDL | 610 | 27 | 51 |
| 2 | B | 1200 | 5 <MDL | 2.5 <MDL | 450 | 23 | 48 |
| 3 | A | 400 | 5 <MDL | 2.5 <MDL | 580 | 27 | 140 |
| 3 | B | 450 | 5 <MDL | 2.5 <MDL | 550 | 25 | 110 |
| 4 | A | 3900 | 30** | 2.5 <MDL | 240 | 26 | 250 |
| 4 | B | 2700 | 30** | 5 | 290 | 28 | 240 |
| 5 | A | 150 | 5 <MDL | 2.5 <MDL | 480 | 22 | 130 |
| 5 | B | 350 | 5 <MDL | 5 | 540 | 25 | 110 |
| 6 | A | 2400 | 35** | 5 | 380 | 29 | 660** |
| 6 | B | 1400 | 30** | 2.5 <MDL | 350 | 27 | 560** |
| 7 | A | 500 | 5 <MDL | 2.5 <MDL | 550 | 25 | 64 |
| 7 | B | 50 | 5 <MDL | 2.5 <MDL | 630 | 28 | 71 |
| 8 | A | 500 | 5 <MDL | 2.5 <MDL | 520 | 23 | 67 |
| 8 | B | 50 | 5 <MDL | 2.5 <MDL | 570 | 25 | 68 |
| 9 | A | 250 | 5 <MDL | 7.5 | 490 | 27 | 410** |
| 9 | B | 150 | 5 <MDL | 5 | 480 | 24 | 360** |
| 10 | A | 450 | 5 <MDL | 2.5 <MDL | 710 | 29 | 79 |
| 10 | B | 500 | 5 <MDL | 2.5 <MDL | 730 | 30 | 84 |
| 11 | A | 850 | 5 <MDL | 15 | 450 | 26 | 900** |
| 11 | B | 800 | 5 <MDL | 18 | 420 | 27 | 980** |
| 12 | A | 50 | 5 <MDL | 2.5 <MDL | 610 | 27 | 110 |
| 12 | B | 500 | 5 <MDL | 2.5 <MDL | 660 | 29 | 110 |
| 13 | A | 450 | 5 <MDL | 5 | 340 | 17 | 160 |
| 13 | B | 300 | 5 <MDL | 2.5 <MDL | 360 | 16 | 120 |
| 14 | A | 100 | 5 <MDL | 2.5 <MDL | 580 | 29 | 84 |
| 14 | B | 500 | 5 <MDL | 2.5 <MDL | 570 | 28 | 79 |
| 15 | A | 50 | 5 <MDL | 2.5 <MDL | 410 | 19 | 140 |
| 15 | B | 200 | 5 <MDL | 2.5 <MDL | 380 | 18 | 130 |
| 16 | A | 400 | 5 <MDL | 2.5 <MDL | 560 | 27 | 71 |
| 16 | B | 450 | 5 <MDL | 2.5 <MDL | 610 | 30 | 72 |
| 17 | A | 650 | 5 <MDL | 5 | 350 | 21 | 320* |
| 17 | B | 900 | 5 <MDL | 5 | 340 | 21 | 400** |
| 18 | A | 450 | 5 <MDL | 5 | 470 | 25 | 260 |
| 18 | B | 700 | 5 <MDL | 7.5 | 460 | 28 | 340* |
| 19 | A | 500 | 5 <MDL | 63 | 550 | 33 | 430** |
| 19 | B | 350 | 5 <MDL | 35 | 540 | 31 | 280 |
| 20 | A | 450 | 5 <MDL | 5 | 630 | 34 | 220 |
| 20 | B | 350 | 5 <MDL | 5 | 600 | 32 | 190 |
| Maximum | 3900 | 35 | 63 | 730 | 34 | 980 | |
| MOE Table 9 | NV | 1 | NV | NV | 86 | 290 | |
| MOE Table 3 | NV | 1 | NV | NV | 86 | 340 | |
| Site | Replicate | Aluminum | Antimony | Arsenic | Barium | Beryllium | Boron |
|---|---|---|---|---|---|---|---|
| 1 | A | 6000 | 0.5 | 4.2 | 140 | 0.43 | 14 |
| 1 | B | 5000 | 0.4 | 3.9 | 120 | 0.38 | 9.8 |
| 2 | A | 12000 | 0.2 | 2 | 120 | 0.53 | 10 |
| 2 | B | 19000 | 0.2 | 3.5 | 190 | 0.85 | 13 |
| 3 | A | 9400 | 0.3 | 2.8 | 110 | 0.5 | 8 |
| 3 | B | 9800 | 3.8* | 3.3 | 140 | 0.6 | 13 |
| 4 | A | 3500 | 7.6** | 15 | 140 | 0.53 | 7.5 |
| 4 | B | 3900 | 6.2* | 16 | 130 | 0.35 | 9.5 |
| 5 | A | 7400 | 1.6* | 2.4 | 110 | 0.4 | 11 |
| 5 | B | 8200 | 1 | 2.2 | 110 | 0.43 | 12 |
| 6 | A | 5900 | 6.2* | 23** | 610** | 0.93 | 18 |
| 6 | B | 7000 | 10** | 30** | 1100** | 0.88 | 18 |
| 7 | A | 9300 | 0.3 | 5.9 | 89 | 0.5 | 11 |
| 7 | B | 10000 | 0.3 | 7.3 | 110 | 0.58 | 12 |
| 8 | A | 7400 | 0.2 | 1.9 | 51 | 0.35 | 8.8 |
| 8 | B | 8000 | 0.2 | 2.1 | 55 | 0.4 | 9.5 |
| 9 | A | 17000 | 3.7* | 4.6 | 2800** | 0.53 | 28 |
| 9 | B | 18000 | 22** | 5.8 | 2900** | 0.45 | 29 |
| 10 | A | 10000 | 0.4 | 2.3 | 140 | 0.45 | 9.8 |
| 10 | B | 10000 | 0.4 | 2.1 | 130 | 0.45 | 10 |
| 11 | A | 12000 | 8** | 6.5 | 3100** | 0.43 | 18 |
| 11 | B | 16000 | 8.2** | 4.7 | 3200** | 0.35 | 23 |
| 12 | A | 11000 | 0.7 | 2.1 | 82 | 0.35 | 9.3 |
| 12 | B | 11000 | 0.4 | 2.7 | 100 | 0.38 | 9.5 |
| 13 | A | 5800 | 1.1 | 10 | 120 | 0.25 | 22 |
| 13 | B | 5900 | 1 | 9.9 | 180 | 0.3 | 20 |
| 14 | A | 8800 | 0.4 | 2.2 | 73 | 0.28 | 7 |
| 14 | B | 9000 | 0.4 | 2.2 | 68 | 0.25 | 6.8 |
| 15 | A | 5200 | 0.7 | 2.9 | 190 | 0.2 | 10 |
| 15 | B | 5100 | 0.7 | 3 | 160 | 0.2 | 9.8 |
| 16 | A | 11000 | 0.3 | 2.4 | 63 | 0.45 | 7.3 |
| 16 | B | 9700 | 0.3 | 2.1 | 59 | 0.38 | 6.3 |
| 17 | A | 5900 | 1.4* | 5.5 | 310** | 0.4 | 12 |
| 17 | B | 6900 | 2* | 7.6 | 420** | 0.48 | 15 |
| 18 | A | 11000 | 1.4* | 9.9 | 510** | 0.68 | 17 |
| 18 | B | 9300 | 1.7* | 11 | 620** | 0.65 | 14 |
| 19 | A | 9100 | 1.5* | 9.2 | 430** | 0.7 | 11 |
| 19 | B | 8100 | 1.4* | 7.5 | 450** | 0.53 | 10 |
| 20 | A | 10000 | 0.6 | 3.4 | 160 | 0.5 | 13 |
| 20 | B | 9800 | 0.7 | 4.9 | 180 | 0.55 | 14 |
| Maximum | 19000 | 22 | 30 | 3200 | 0.93 | 29 | |
| MOE Table 9 | NV | 1.3 | 18 | 220 | 2.5 | 36 | |
| MOE Table 3 | NV | 7.5 | 18 | 390 | 4 | 120 | |
| Site | Replicate | Cadmium | Calcium | Chromium | Cobalt | Copper | Iron |
|---|---|---|---|---|---|---|---|
| 1 | A | 0.6 | 250000 | 59 | 3.1 | 21 | 8600 |
| 1 | B | 0.5 | 260000 | 41 | 2.7 | 20 | 7700 |
| 2 | A | 0.2 | 98000 | 48 | 4.9 | 21 | 13000 |
| 2 | B | 0.2 | 210000 | 59 | 8.9 | 28 | 26000 |
| 3 | A | 0.2 | 68000 | 620** | 5 | 26 | 17000 |
| 3 | B | 0.5 | 78000 | 1300** | 5.4 | 30 | 17000 |
| 4 | A | 0.2 | 92000 | 33000** | 7.6 | 41 | 68000 |
| 4 | B | 1.2 | 82000 | 34000** | 7.9 | 40 | 67000 |
| 5 | A | 0.3 | 98000 | 2700** | 4.1 | 20 | 19000 |
| 5 | B | 0.3 | 92000 | 1700** | 4.5 | 20 | 14000 |
| 6 | A | 5.9** | 94000 | 38000** | 8.6 | 66 | 61000 |
| 6 | B | 6.2** | 100000 | 34000** | 8.8 | 83 | 49000 |
| 7 | A | 0.2 | 110000 | 650** | 5.3 | 19 | 17000 |
| 7 | B | 0.2 | 110000 | 690** | 6.1 | 19 | 19000 |
| 8 | A | 0.1 <MDL | 110000 | 150* | 4 | 11 | 13000 |
| 8 | B | 0.1 <MDL | 120000 | 200** | 4.3 | 12 | 14000 |
| 9 | A | 2.4** | 77000 | 7700** | 5 | 290** | 26000 |
| 9 | B | 3.4** | 70000 | 2800** | 5.1 | 410** | 31000 |
| 10 | A | 0.5 | 100000 | 430** | 5.3 | 22 | 18000 |
| 10 | B | 0.5 | 98000 | 310** | 5.4 | 21 | 17000 |
| 11 | A | 4.4** | 69000 | 3100** | 5.4 | 210** | 32000 |
| 11 | B | 3.6** | 64000 | 4400** | 4.8 | 230** | 28000 |
| 12 | A | 0.3 | 73000 | 110* | 5.1 | 18 | 16000 |
| 12 | B | 0.4 | 73000 | 190** | 5.6 | 21 | 17000 |
| 13 | A | 0.6 | 34000 | 1100** | 4.7 | 97* | 67000 |
| 13 | B | 1.3** | 48000 | 2500** | 4.8 | 82 | 53000 |
| 14 | A | 0.3 | 37000 | 520** | 3.5 | 14 | 16000 |
| 14 | B | 0.3 | 36000 | 390** | 3.5 | 13 | 15000 |
| 15 | A | 0.9 | 79000 | 2100** | 2.9 | 26 | 11000 |
| 15 | B | 0.9 | 79000 | 1900** | 2.9 | 22 | 11000 |
| 16 | A | 0.2 | 53000 | 130* | 4.7 | 15 | 17000 |
| 16 | B | 0.2 | 55000 | 130* | 4.2 | 13 | 17000 |
| 17 | A | 3.4** | 70000 | 4100** | 3.7 | 41 | 15000 |
| 17 | B | 3.2** | 60000 | 3800** | 4.4 | 42 | 15000 |
| 18 | A | 3** | 88000 | 5100** | 5.4 | 48 | 21000 |
| 18 | B | 3.2** | 91000 | 5600** | 5 | 56 | 20000 |
| 19 | A | 2.4** | 72000 | 8100** | 5.7 | 56 | 21000 |
| 19 | B | 3.1** | 78000 | 8000** | 4.4 | 46 | 17000 |
| 20 | A | 0.7 | 76000 | 970** | 5.7 | 25 | 19000 |
| 20 | B | 1.1 | 68000 | 1200** | 6.2 | 34 | 20000 |
| Maximum | 6.2 | 260000 | 38000 | 8.9 | 410 | 68000 | |
| MOE Table 9 | 1.2 | NV | 70 | 22 | 92 | NV | |
| MOE Table 3 | 1.2 | NV | 160 | 22 | 140 | NV | |
| Site | Replicate | Lead | Magnesium | Manganese | Mercury | Molybdenum | Nickel |
|---|---|---|---|---|---|---|---|
| 1 | A | 51 | 2400 | 220 | 0.06 | 0.5 <MDL | 16 |
| 1 | B | 43 | 2300 | 190 | 0.07 | 0.5 <MDL | 14 |
| 2 | A | 38 | 4400 | 260 | 0.02 <T | 0.5 <MDL | 16 |
| 2 | B | 27 | 8600 | 520 | 0.03 <T | 0.5 <MDL | 25 |
| 3 | A | 640** | 4300 | 430 | 0.06 | 0.5 <MDL | 14 |
| 3 | B | 97 | 4500 | 480 | 0.07 | 0.5 <MDL | 17 |
| 4 | A | 570** | 4300 | 380 | 1.5** | 20** | 190** |
| 4 | B | 570** | 4300 | 420 | 1.6** | 19** | 180** |
| 5 | A | 120 | 5600 | 300 | 0.06 | 1.5 | 28 |
| 5 | B | 85 | 5100 | 350 | 0.06 | 1 | 15 |
| 6 | A | 790** | 5000 | 440 | 1.2** | 24** | 200** |
| 6 | B | 770** | 5600 | 460 | 1.5** | 17** | 160** |
| 7 | A | 32 | 5800 | 310 | 0.04 <T | 0.5 <MDL | 15 |
| 7 | B | 34 | 5900 | 320 | 0.04 <T | 0.5 <MDL | 16 |
| 8 | A | 21 | 7200 | 290 | 0.03 <T | 0.5 <MDL | 20 |
| 8 | B | 23 | 7500 | 310 | 0.04 <T | 0.5 <MDL | 24 |
| 9 | A | 420** | 3800 | 340 | 0.13 | 8.5** | 40 |
| 9 | B | 780** | 3800 | 360 | 0.14 | 12** | 61 |
| 10 | A | 88 | 6300 | 350 | 0.04 <T | 0.5 <MDL | 15 |
| 10 | B | 54 | 6300 | 340 | 0.05 | 0.5 <MDL | 15 |
| 11 | A | 710** | 3700 | 280 | 0.35** | 8** | 32 |
| 11 | B | 780** | 3700 | 300 | 0.44** | 8.5** | 33 |
| 12 | A | 47 | 5700 | 390 | 0.02 <T | 0.5 <MDL | 19 |
| 12 | B | 54 | 5900 | 430 | 0.03 <T | 0.5 <MDL | 24 |
| 13 | A | 36 | 2900 | 1300 | 0.04 <T | 13** | 37 |
| 13 | B | 54 | 3200 | 930 | 0.04 <T | 8.5** | 34 |
| 14 | A | 36 | 4200 | 280 | 0.04 <T | 0.5 <MDL | 12 |
| 14 | B | 36 | 4300 | 310 | 0.05 | 0.5 <MDL | 11 |
| 15 | A | 80 | 3800 | 240 | 0.08 | 0.5 <MDL | 11 |
| 15 | B | 76 | 3900 | 240 | 0.08 | 0.5 <MDL | 11 |
| 16 | A | 52 | 4200 | 350 | 0.04 <T | 0.5 <MDL | 13 |
| 16 | B | 33 | 4000 | 340 | 0.05 | 0.5 <MDL | 12 |
| 17 | A | 150** | 3500 | 220 | 0.17 | 1 | 17 |
| 17 | B | 160** | 3300 | 220 | 0.24 | 1.5 | 21 |
| 18 | A | 170** | 5100 | 280 | 0.11 | 1 | 24 |
| 18 | B | 180** | 4900 | 260 | 0.12 | 1 | 24 |
| 19 | A | 270** | 4700 | 310 | 0.19 | 2 | 21 |
| 19 | B | 270** | 4300 | 260 | 0.23 | 1 | 16 |
| 20 | A | 75 | 5800 | 340 | 0.11 | 0.5 | 27 |
| 20 | B | 100 | 5400 | 310 | 0.13 | 1 | 30 |
| Maximum | 790 | 8600 | 1300 | 1.6 | 24 | 200 | |
| MOE Table 9 | 120 | NV | NV | 0.27 | 2 | 82 | |
| MOE Table 3 | 120 | NV | NV | 0.27 | 6.9 | 100 | |
Table B continued: Element concentrations (ug/g) in surface soil (5-10 cm) collected from 20 sites on the property of the former Robson-Lang tannery, Oshawa, Ontario
| Site | Replicate | Phosphorus | Potassium | Selenium | Silver | Sodium | Strontium |
|---|---|---|---|---|---|---|---|
| 1 | A | 1200 | 750 | 0.8 <T | 0.2 <MDL | 150 | 100 |
| 1 | B | 1200 | 750 | 0.9 <T | 0.2 <MDL | 100 | 110 |
| 2 | A | 900 | 2000 | 1.1 | 0.2 <MDL | 800 | 94 |
| 2 | B | 1400 | 3600 | 1.2 | 0.2 <MDL | 1100 | 200 |
| 3 | A | 850 | 1600 | 0.2 ≤W | 0.2 <MDL | 250 | 93 |
| 3 | B | 1100 | 1700 | 0.2 ≤W | 0.2 <MDL | 250 | 94 |
| 4 | A | 3700 | 700 | 0.4 <T | 1.6* | 150 | 120 |
| 4 | B | 3600 | 750 | 0.5 <T | 1* | 100 | 110 |
| 5 | A | 1400 | 1300 | 0.2 ≤W | 0.2 <MDL | 250 | 110 |
| 5 | B | 1200 | 1500 | 0.2 ≤W | 0.2 <MDL | 250 | 110 |
| 6 | A | 1000 | 1200 | 0.8 <T | 1.4* | 150 | 160 |
| 6 | B | 1200 | 1300 | 1.1 | 0.2 <MDL | 200 | 170 |
| 7 | A | 950 | 2400 | 0.2 ≤W | 0.2 <MDL | 250 | 150 |
| 7 | B | 950 | 2400 | 0.2 ≤W | 0.2 <MDL | 250 | 150 |
| 8 | A | 900 | 1800 | 0.2 ≤W | 0.2 <MDL | 250 | 150 |
| 8 | B | 1000 | 2000 | 0.2 ≤W | 0.2 <MDL | 250 | 160 |
| 9 | A | 1400 | 1200 | 0.2 ≤W | 8.8* | 900 | 150 |
| 9 | B | 1500 | 1100 | 0.2 ≤W | 11* | 1100 | 140 |
| 10 | A | 1000 | 2400 | 0.2 ≤W | 0.2 <MDL | 300 | 130 |
| 10 | B | 1100 | 2500 | 0.2 ≤W | 0.2 <MDL | 250 | 130 |
| 11 | A | 1100 | 1100 | 0.2 ≤W | 0.4 | 550 | 170 |
| 11 | B | 1300 | 1200 | 0.2 ≤W | 0.6 | 750 | 160 |
| 12 | A | 1000 | 2200 | 0.2 ≤W | 0.2 <MDL | 250 | 100 |
| 12 | B | 1100 | 2300 | 0.2 ≤W | 0.2 <MDL | 250 | 100 |
| 13 | A | 500 | 550 | 0.3 <T | 0.2 <MDL | 200 | 180 |
| 13 | B | 800 | 700 | 0.3 <T | 0.2 <MDL | 200 | 170 |
| 14 | A | 900 | 1100 | 0.2 ≤W | 0.2 <MDL | 150 | 57 |
| 14 | B | 950 | 1100 | 0.3 <T | 0.2 <MDL | 150 | 51 |
| 15 | A | 1100 | 850 | 0.2 ≤W | 0.2 <MDL | 200 | 120 |
| 15 | B | 1100 | 850 | 0.2 ≤W | 0.2 <MDL | 200 | 120 |
| 16 | A | 800 | 1700 | 0.2 ≤W | 0.2 <MDL | 200 | 74 |
| 16 | B | 850 | 1400 | 0.2 ≤W | 0.2 <MDL | 200 | 74 |
| 17 | A | 1000 | 950 | 0.3 <T | 0.2 <MDL | 200 | 120 |
| 17 | B | 1100 | 1000 | 0.5 <T | 0.2 <MDL | 200 | 110 |
| 18 | A | 1500 | 2200 | 0.4 <T | 0.2 <MDL | 250 | 140 |
| 18 | B | 1000 | 1800 | 0.4 <T | 0.2 <MDL | 200 | 160 |
| 19 | A | 1500 | 1800 | 0.3 <T | 0.2 <MDL | 200 | 120 |
| 19 | B | 1200 | 1600 | 0.4 <T | 0.2 <MDL | 250 | 120 |
| 20 | A | 950 | 2100 | 0.3 <T | 0.2 <MDL | 250 | 100 |
| 20 | B | 1200 | 1900 | 0.4 <T | 0.2 <MDL | 250 | 110 |
| Maximum | 3700 | 3600 | 1.2 | 11 | 1100 | 200 | |
| MOE Table 9 | NV | NV | 1.5 | 0.5 | NA | NV | |
| MOE Table 3 | NV | NV | 2.4 | 20 | NA | NV | |
| Site | Replicate | Sulphur | Thallium | Tin | Titanium | Vanadium | Zinc |
|---|---|---|---|---|---|---|---|
| 1 | A | 50 | 10** | 2.5 <MDL | 160 | 15 | 100 |
| 1 | B | 50 | 10** | 2.5 <MDL | 120 | 13 | 78 |
| 2 | A | 1300 | 5 <MDL | 2.5 <MDL | 490 | 24 | 50 |
| 2 | B | 1400 | 10** | 2.5 <MDL | 770 | 40 | 75 |
| 3 | A | 400 | 5 <MDL | 2.5 <MDL | 650 | 28 | 88 |
| 3 | B | 200 | 5 <MDL | 7.5 | 660 | 29 | 110 |
| 4 | A | 3400 | 35** | 2.5 <MDL | 250 | 29 | 190 |
| 4 | B | 3200 | 30** | 2.5 <MDL | 270 | 27 | 210 |
| 5 | A | 150 | 5 <MDL | 2.5 <MDL | 480 | 25 | 180 |
| 5 | B | 100 | 5 <MDL | 2.5 <MDL | 500 | 24 | 99 |
| 6 | A | 3100 | 35** | 2.5 <MDL | 360 | 27 | 480** |
| 6 | B | 2100 | 35** | 2.5 <MDL | 370 | 29 | 840** |
| 7 | A | 450 | 5 <MDL | 2.5 <MDL | 660 | 28 | 71 |
| 7 | B | 500 | 5 <MDL | 2.5 <MDL | 720 | 30 | 72 |
| 8 | A | 400 | 5 <MDL | 2.5 <MDL | 610 | 25 | 52 |
| 8 | B | 450 | 5 <MDL | 2.5 <MDL | 660 | 26 | 58 |
| 9 | A | 1200 | 5 <MDL | 23 | 490 | 37 | 1100** |
| 9 | B | 700 | 5 <MDL | 40 | 560 | 42 | 1100** |
| 10 | A | 400 | 5 <MDL | 2.5 <MDL | 740 | 30 | 95 |
| 10 | B | 450 | 5 <MDL | 2.5 <MDL | 690 | 30 | 88 |
| 11 | A | 950 | 5 <MDL | 25 | 490 | 30 | 1500** |
| 11 | B | 1200 | 5 <MDL | 25 | 540 | 34 | 1600** |
| 12 | A | 400 | 5 <MDL | 2.5 <MDL | 660 | 28 | 100 |
| 12 | B | 450 | 5 <MDL | 2.5 <MDL | 690 | 29 | 130 |
| 13 | A | 400 | 5 <MDL | 5 | 380 | 17 | 100 |
| 13 | B | 400 | 5 <MDL | 5 | 380 | 19 | 140 |
| 14 | A | 450 | 5 <MDL | 2.5 <MDL | 530 | 29 | 76 |
| 14 | B | 450 | 5 <MDL | 2.5 <MDL | 450 | 27 | 77 |
| 15 | A | 50 | 5 <MDL | 2.5 <MDL | 400 | 18 | 140 |
| 15 | B | 50 | 5 <MDL | 5 | 390 | 18 | 120 |
| 16 | A | 350 | 5 <MDL | 2.5 <MDL | 670 | 32 | 71 |
| 16 | B | 300 | 5 <MDL | 2.5 <MDL | 570 | 28 | 66 |
| 17 | A | 250 | 5 <MDL | 5 | 440 | 21 | 230 |
| 17 | B | 400 | 5 <MDL | 5 | 390 | 23 | 320** |
| 18 | A | 550 | 5 <MDL | 7.5 | 520 | 29 | 360** |
| 18 | B | 350 | 10** | 7.5 | 460 | 27 | 370** |
| 19 | A | 600 | 10** | 53 | 520 | 31 | 470** |
| 19 | B | 800 | 10** | 58 | 460 | 27 | 490** |
| 20 | A | 50 | 5 <MDL | 2.5 <MDL | 620 | 31 | 150 |
| 20 | B | 200 | 5 <MDL | 5 | 580 | 32 | 170 |
| Maximum | 3400 | 35 | 58 | 770 | 42 | 1600 | |
| MOE Table 9 | NV | 1 | NV | NV | 86 | 290 | |
| MOE Table 3 | NV | 1 | NV | NV | 86 | 340 | |
| Site | Replicate | Aluminum | Antimony | Arsenic | Barium | Beryllium | Boron |
|---|---|---|---|---|---|---|---|
| 1 | A | 5100 | 0.4 <T | 4.3 | 130 | 0.38 | 11 |
| 1 | B | 6300 | 0.3 <T | 3.4 | 130 | 0.43 | 12 |
| 2 | A | 10000 | 0.2 ≤W | 1.5 | 89 | 0.45 | 8 |
| 2 | B | 16000 | 0.2 ≤W | 1.6 | 120 | 0.68 | 12 |
| 3 | A | 10000 | 0.5 <T | 3.3 | 150 | 0.63 | 13 |
| 3 | B | 9200 | 0.6 <T | 3.6 | 140 | 0.58 | 9.8 |
| 4 | A | 3900 | 8.5** | 15 | 150 | 0.55 | 8.3 |
| 4 | B | 3900 | 8.2** | 15 | 110 | 0.5 | 6.8 |
| 5 | A | 7100 | 1.5* | 1.9 | 97 | 0.35 | 8.3 |
| 5 | B | 8000 | 1 | 2 | 110 | 0.4 | 8.5 |
| 6 | A | 7000 | 7.6** | 23** | 1300** | 1 | 17 |
| 6 | B | 7100 | 7.4* | 28** | 1000** | 1.1 | 10 |
| 7 | A | 9400 | 0.2 ≤W | 2.4 | 88 | 0.45 | 9.3 |
| 7 | B | 9800 | 0.2 ≤W | 4.3 | 89 | 0.5 | 8 |
| 8 | A | 6100 | 0.2 ≤W | 1.7 | 49 | 0.33 | 6.3 |
| 8 | B | 7000 | 0.2 ≤W | 1.8 | 52 | 0.35 | 7.8 |
| 9 | A | 13000 | 13** | 18 | 1500** | 1.2 | 30 |
| 9 | B | 9400 | 8.3** | 20** | 1400** | 0.58 | 16 |
| 10 | A | 11000 | 0.5 <T | 2.1 | 160 | 0.38 | 8.8 |
| 10 | B | 9600 | 0.6 <T | 2.8 | 130 | 0.43 | 8.5 |
| 11 | A | 14000 | 6.5* | 5.8 | 3300** | 0.53 | 20 |
| 11 | B | 12000 | 7.3* | 6.6 | 1600** | 0.43 | 22 |
| 12 | A | 11000 | 0.4 <T | 2.2 | 88 | 0.33 | 7.8 |
| 12 | B | 11000 | 0.4 <T | 2.2 | 90 | 0.35 | 7.3 |
| 13 | A | 5000 | 0.8 <T | 7.2 | 170 | 0.18 | 18 |
| 13 | B | 5200 | 1 | 7.8 | 160 | 0.23 | 16 |
| 14 | A | 10000 | 0.3 <T | 2.3 | 56 | 0.28 | 6 |
| 14 | B | 10000 | 0.3 <T | 2.4 | 59 | 0.3 | 5.8 |
| 15 | A | 5100 | 0.6 <T | 2.5 | 190 | 0.3 | 9 |
| 15 | B | 4800 | 0.6 <T | 2.8 | 180 | 0.28 | 8.5 |
| 16 | A | 9100 | 0.2 ≤W | 1.7 | 52 | 0.38 | 5.3 |
| 16 | B | 8800 | 0.3 <T | 2.2 | 52 | 0.35 | 4.8 |
| 17 | A | 5600 | 1.7* | 4.8 | 220 | 0.38 | 10 |
| 17 | B | 6200 | 2.3* | 6.4 | 630** | 0.43 | 14 |
| 18 | A | 19000 | 6.3* | 11 | 1000** | 1.3 | 25 |
| 18 | B | 9900 | 2.3* | 26** | 1100** | 0.68 | 13 |
| 19 | A | 7100 | 9.2** | 11 | 540** | 0.58 | 12 |
| 19 | B | 7400 | 8.8** | 14 | 450** | 0.53 | 8.8 |
| 20 | A | 11000 | 0.7 <T | 6.6 | 450** | 0.65 | 13 |
| 20 | B | 9200 | 1.3 | 8.5 | 240* | 0.58 | 10 |
| Maximum | 19000 | 13 | 28 | 3300 | 1.3 | 30 | |
| MOE Table 9 | NV | 1.3 | 18 | 220 | 2.5 | 36 | |
| MOE Table 3 | NV | 7.5 | 18 | 390 | 4 | 120 | |
| Site | Replicate | Cadmium | Calcium | Chromium | Cobalt | Copper | Iron |
|---|---|---|---|---|---|---|---|
| 1 | A | 0.5 | 270000 | 42 | 2.7 | 19 | 7200 |
| 1 | B | 0.5 | 260000 | 47 | 3 | 19 | 8600 |
| 2 | A | 0.1 <MDL | 110000 | 32 | 4.6 | 14 | 13000 |
| 2 | B | 0.1 <MDL | 140000 | 49 | 6.1 | 22 | 16000 |
| 3 | A | 0.4 | 70000 | 1400** | 5.6 | 34 | 16000 |
| 3 | B | 0.4 | 74000 | 1100** | 5 | 27 | 16000 |
| 4 | A | 1.7** | 94000 | 34000** | 8.2 | 50 | 74000 |
| 4 | B | 0.6 | 100000 | 27000** | 7.3 | 33 | 55000 |
| 5 | A | 0.2 | 100000 | 2500** | 3.9 | 15 | 19000 |
| 5 | B | 0.4 | 87000 | 2500** | 4.2 | 17 | 15000 |
| 6 | A | 7** | 120000 | 38000** | 8.9 | 81 | 59000 |
| 6 | B | 5.3** | 120000 | 31000** | 10 | 73 | 59000 |
| 7 | A | 0.1 <MDL | 120000 | 210** | 5.3 | 14 | 16000 |
| 7 | B | 0.1 <MDL | 120000 | 300** | 5.9 | 15 | 18000 |
| 8 | A | 0.1 <MDL | 110000 | 110* | 3.6 | 9 | 12000 |
| 8 | B | 0.1 <MDL | 120000 | 140* | 4 | 14 | 13000 |
| 9 | A | 2** | 80000 | 32000** | 6.9 | 660** | 34000 |
| 9 | B | 1 | 83000 | 11000** | 6.6 | 110* | 26000 |
| 10 | A | 0.4 | 100000 | 480** | 5.5 | 24 | 18000 |
| 10 | B | 0.4 | 91000 | 210** | 4.7 | 17 | 16000 |
| 11 | A | 4 | 66000 | 4900** | 6.8 | 230** | 33000 |
| 11 | B | 5.2** | 63000 | 8400** | 6.7 | 240** | 32000 |
| 12 | A | 0.2 | 74000 | 72* | 5.3 | 18 | 16000 |
| 12 | B | 0.3 | 68000 | 100* | 5.2 | 17 | 17000 |
| 13 | A | 0.5 | 32000 | 1400** | 4.2 | 82 | 55000 |
| 13 | B | 0.9 | 56000 | 2400** | 4.1 | 64 | 40000 |
| 14 | A | 0.2 | 32000 | 210** | 3.8 | 11 | 17000 |
| 14 | B | 0.2 | 28000 | 190** | 3.8 | 10 | 17000 |
| 15 | A | 0.7 | 85000 | 2500** | 2.8 | 32 | 11000 |
| 15 | B | 1.8** | 82000 | 2100** | 2.6 | 28 | 11000 |
| 16 | A | 0.2 | 56000 | 55 | 3.9 | 31 | 16000 |
| 16 | B | 0.1 <MDL | 58000 | 44 | 3.9 | 11 | 16000 |
| 17 | A | 4.8** | 81000 | 5100** | 3.5 | 40 | 13000 |
| 17 | B | 5.1** | 75000 | 7600** | 3.5 | 67 | 17000 |
| 18 | A | 5.7** | 180000 | 9500** | 11 | 110* | 39000 |
| 18 | B | 4.2** | 98000 | 7400** | 5.4 | 65 | 23000 |
| 19 | A | 9** | 140000 | 39000** | 3 | 130* | 12000 |
| 19 | B | 5.3** | 110000 | 25000** | 3.8 | 81 | 15000 |
| 20 | A | 4** | 72000 | 7000** | 6.6 | 43 | 21000 |
| 20 | B | 0.9 | 68000 | 1200** | 6.1 | 29 | 21000 |
| Maximum | 9 | 270000 | 39000 | 11 | 660 | 74000 | |
| MOE Table 9 | 1.2 | NV | 70 | 22 | 92 | NV | |
| MOE Table 3 | 1.2 | NV | 160 | 22 | 140 | NV | |
| Site | Replicate | Lead | Magnesium | Manganese | Mercury | Molybdenum | Nickel |
|---|---|---|---|---|---|---|---|
| 1 | A | 40 | 2200 | 200 | 0.05 | 0.5 <MDL | 13 |
| 1 | B | 45 | 2400 | 210 | 0.07 | 0.5 <MDL | 14 |
| 2 | A | 8.5 | 4600 | 220 | 0.02 <T | 0.5 <MDL | 12 |
| 2 | B | 7.5 | 5900 | 240 | 0.03 <T | 0.5 <MDL | 18 |
| 3 | A | 68 | 4300 | 470 | 0.07 | 1 | 18 |
| 3 | B | 55 | 4600 | 450 | 0.08 | 0.5 <MDL | 15 |
| 4 | A | 590** | 4400 | 460 | 1** | 23** | 210** |
| 4 | B | 480** | 4800 | 410 | 1.3** | 18** | 140** |
| 5 | A | 110 | 5700 | 310 | 0.05 | 1 | 24 |
| 5 | B | 94 | 5500 | 350 | 0.05 | 1 | 12 |
| 6 | A | 880** | 5500 | 460 | 1.3** | 24** | 200** |
| 6 | B | 710** | 6000 | 490 | 1.3** | 22** | 240** |
| 7 | A | 23 | 6100 | 330 | 0.03 <T | 0.5 <MDL | 14 |
| 7 | B | 42 | 5800 | 330 | 0.04 <T | 0.5 <MDL | 15 |
| 8 | A | 18 | 6800 | 270 | 0.02 <T | 0.5 <MDL | 12 |
| 8 | B | 23 | 6800 | 280 | 0.03 <T | 0.5 <MDL | 21 |
| 9 | A | 250** | 3000 | 340 | 0.08 | 17** | 28 |
| 9 | B | 180** | 4200 | 310 | 0.09 | 6** | 35 |
| 10 | A | 89 | 6700 | 360 | 0.04 <T | 0.5 <MDL | 15 |
| 10 | B | 62 | 6000 | 330 | 0.05 | 0.5 <MDL | 13 |
| 11 | A | 1100** | 3800 | 300 | 0.46** | 11** | 35 |
| 11 | B | 790** | 3700 | 300 | 0.64** | 11** | 35 |
| 12 | A | 74 | 5700 | 390 | 0.02 <T | 0.5 <MDL | 20 |
| 12 | B | 85 | 5500 | 380 | 0.03 <T | 0.5 <MDL | 19 |
| 13 | A | 37 | 2300 | 1000 | 0.03 <T | 8.5** | 36 |
| 13 | B | 40 | 3200 | 750 | 0.04 <T | 6* | 28 |
| 14 | A | 31 | 3700 | 290 | 0.04 <T | 0.5 <MDL | 11 |
| 14 | B | 31 | 3500 | 310 | 0.05 | 1 | 14 |
| 15 | A | 79 | 3800 | 230 | 0.07 | 0.5 <MDL | 10 |
| 15 | B | 75 | 3800 | 220 | 0.09 | 0.5 <MDL | 10 |
| 16 | A | 32 | 3800 | 370 | 0.04 <T | 0.5 <MDL | 12 |
| 16 | B | 27 | 3900 | 350 | 0.05 | 0.5 <MDL | 10 |
| 17 | A | 150** | 4000 | 210 | 0.08 | 0.5 <MDL | 14 |
| 17 | B | 220** | 3800 | 230 | 0.52** | 1.5 | 18 |
| 18 | A | 340** | 9700 | 530 | 0.13 | 2.5* | 49 |
| 18 | B | 260** | 5000 | 280 | 0.14 | 1 | 26 |
| 19 | A | 370** | 4100 | 350 | 0.1 | 3* | 12 |
| 19 | B | 290** | 4600 | 280 | 0.13 | 1.5 | 13 |
| 20 | A | 150** | 5600 | 340 | 0.09 | 1.5 | 30 |
| 20 | B | 110 | 4700 | 270 | 0.13 | 0.5 | 25 |
| Maximum | 1100 | 9700 | 1000 | 1.3 | 24 | 240 | |
| MOE Table 9 | 120 | NV | NV | 0.27 | 2 | 82 | |
| MOE Table 3 | 120 | NV | NV | 0.27 | 6.9 | 100 | |
| Site | Replicate | Phosphorus | Potassium | Selenium | Silver | Sodium | Strontium |
|---|---|---|---|---|---|---|---|
| 1 | A | 1100 | 650 | 0.7 <T | 0.2 <MDL | 100 | 110 |
| 1 | B | 1100 | 850 | 0.9 <T | 0.4 | 150 | 100 |
| 2 | A | 850 | 2100 | 0.6 <T | 0.2 <MDL | 550 | 110 |
| 2 | B | 1100 | 3100 | 0.7 <T | 0.2 <MDL | 600 | 130 |
| 3 | A | 900 | 1800 | 0.2 ≤W | 0.2 <MDL | 250 | 89 |
| 3 | B | 900 | 1500 | 0.2 <W | 0.2 <MDL | 250 | 95 |
| 4 | A | 2700 | 750 | 0.3 <T | 1.6* | 150 | 120 |
| 4 | B | 750 | 650 | 0.4 <T | 0.4 | 150 | 120 |
| 5 | A | 1100 | 1200 | 0.2 ≤W | 0.2 <MDL | 200 | 120 |
| 5 | B | 1200 | 1300 | 0.2 ≤W | 0.2 <MDL | 200 | 110 |
| 6 | A | 3300 | 1200 | 0.7 <T | 1* | 250 | 200 |
| 6 | B | 50 | 1300 | 0.7 <T | 1* | 250 | 190 |
| 7 | A | 1000 | 2300 | 0.2 ≤W | 0.2 <MDL | 250 | 160 |
| 7 | B | 900 | 2200 | 0.2 ≤W | 0.2 <MDL | 250 | 160 |
| 8 | A | 1000 | 1500 | 0.2 ≤W | 0.2 <MDL | 250 | 150 |
| 8 | B | 750 | 1600 | 0.2 ≤W | 0.2 <MDL | 250 | 150 |
| 9 | A | 50 | 850 | 0.2 ≤W | 4.6* | 700 | 210 |
| 9 | B | 800 | 850 | 0.2 ≤W | 0.8* | 500 | 180 |
| 10 | A | 950 | 2200 | 0.2 ≤W | 0.2 <MDL | 300 | 140 |
| 10 | B | 950 | 2200 | 0.2 ≤W | 0.2 <MDL | 300 | 130 |
| 11 | A | 1200 | 1000 | 0.2 ≤W | 0.6* | 700 | 180 |
| 11 | B | 1400 | 1000 | 0.2 ≤W | 0.6* | 700 | 170 |
| 12 | A | 850 | 2100 | 0.2 ≤W | 0.2 <MDL | 250 | 110 |
| 12 | B | 1000 | 2000 | 0.2 ≤W | 0.2 <MDL | 250 | 96 |
| 13 | A | 450 | 450 | 0.2 ≤W | 0.2 <MDL | 200 | 150 |
| 13 | B | 650 | 650 | 0.2 ≤W | 0.2 <MDL | 200 | 150 |
| 14 | A | 850 | 1100 | 0.2 ≤W | 0.2 <MDL | 150 | 48 |
| 14 | B | 750 | 1100 | 0.3 <T | 0.2 <MDL | 150 | 43 |
| 15 | A | 850 | 800 | 0.2 ≤W | 0.2 <MDL | 200 | 120 |
| 15 | B | 1000 | 750 | 0.2 ≤W | 0.2 <MDL | 200 | 120 |
| 16 | A | 850 | 1300 | 0.2 ≤W | 0.2 <MDL | 200 | 78 |
| 16 | B | 800 | 1200 | 0.2 ≤W | 0.2 <MDL | 200 | 77 |
| 17 | A | 1100 | 800 | 0.2 ≤W | 0.2 <MDL | 200 | 130 |
| 17 | B | 1300 | 900 | 0.2 ≤W | 0.2 <MDL | 200 | 140 |
| 18 | A | 2300 | 3500 | 0.3 <T | 0.2 <MDL | 450 | 360 |
| 18 | B | 1200 | 1700 | 0.7 <T | 0.2 <MDL | 250 | 180 |
| 19 | A | 1200 | 1000 | 0.2 ≤W | 0.2 <MDL | 350 | 190 |
| 19 | B | 2300 | 1200 | 0.2 ≤W | 0.4 | 300 | 150 |
| 20 | A | 1200 | 1800 | 0.3 <T | 0.2 <MDL | 250 | 110 |
| 20 | B | 950 | 1500 | 0.3 <T | 0.2 <MDL | 200 | 120 |
| Maximum | 3300 | 3500 | 0.9 | 4.6 | 700 | 360 | |
| MOE Table 9 | NV | NV | 1.5 | 0.5 | NA | NV | |
| MOE Table 3 | NV | NV | 2.4 | 20 | NA | NV | |
| Site | Replicate | Sulphur | Thallium | Tin | Titanium | Vanadium | Zinc |
|---|---|---|---|---|---|---|---|
| 1 | A | 50 | 10** | 2.5 <MDL | 120 | 12 | 77 |
| 1 | B | 50 | 10** | 2.5 <MDL | 190 | 15 | 83 |
| 2 | A | 50 | 5 <MDL | 2.5 <MDL | 540 | 24 | 34 |
| 2 | B | 300 | 5 <MDL | 2.5 <MDL | 740 | 30 | 49 |
| 3 | A | 150 | 5 <MDL | 2.5 <MDL | 640 | 29 | 130 |
| 3 | B | 50 | 5 <MDL | 2.5 <MDL | 520 | 26 | 96 |
| 4 | A | 2700 | 35** | 2.5 <MDL | 250 | 25 | 210 |
| 4 | B | 1300 | 25** | 2.5 <MDL | 310 | 23 | 170 |
| 5 | A | 50 | 5 <MDL | 2.5 <MDL | 550 | 24 | 110 |
| 5 | B | 50 | 5 <MDL | 2.5 <MDL | 570 | 26 | 88 |
| 6 | A | 3200 | 35** | 2.5 <MDL | 380 | 24 | 910** |
| 6 | B | 2500 | 35** | 5 | 350 | 28 | 850** |
| 7 | A | 300 | 5 <MDL | 2.5 <MDL | 690 | 28 | 56 |
| 7 | B | 250 | 5 <MDL | 2.5 <MDL | 640 | 28 | 50 |
| 8 | A | 250 | 5 <MDL | 2.5 <MDL | 570 | 24 | 36 |
| 8 | B | 300 | 5 <MDL | 2.5 <MDL | 590 | 26 | 52 |
| 9 | A | 2200 | 35** | 7.5 | 500 | 34 | 880** |
| 9 | B | 250 | 25** | 2.5 <MDL | 600 | 29 | 660** |
| 10 | A | 350 | 5 <MDL | 5 | 720 | 28 | 110 |
| 10 | B | 350 | 5 <MDL | 2.5 <MDL | 680 | 29 | 86 |
| 11 | A | 1200 | 5 <MDL | 30 | 530 | 31 | 1800** |
| 11 | B | 2700 | 5 <MDL | 28 | 650 | 29 | 2000** |
| 12 | A | 300 | 5 <MDL | 2.5 <MDL | 670 | 28 | 110 |
| 12 | B | 350 | 5 <MDL | 2.5 <MDL | 710 | 29 | 110 |
| 13 | A | 300 | 5 <MDL | 5 | 330 | 15 | 96 |
| 13 | B | 300 | 5 <MDL | 2.5 <MDL | 380 | 16 | 100 |
| 14 | A | 350 | 5 <MDL | 2.5 <MDL | 650 | 31 | 64 |
| 14 | B | 350 | 5 <MDL | 2.5 <MDL | 670 | 32 | 63 |
| 15 | A | 50 | 5 <MDL | 2.5 <MDL | 410 | 18 | 140 |
| 15 | B | 50 | 5 <MDL | 2.5 <MDL | 390 | 18 | 130 |
| 16 | A | 200 | 5 <MDL | 2.5 <MDL | 590 | 28 | 97 |
| 16 | B | 200 | 5 <MDL | 2.5 <MDL | 550 | 26 | 57 |
| 17 | A | 50 | 5 <MDL | 5 | 380 | 20 | 200 |
| 17 | B | 300 | 5 <MDL | 7.5 | 380 | 20 | 450** |
| 18 | A | 1400 | 10** | 15 | 750 | 50 | 660** |
| 18 | B | 650 | 10** | 15 | 460 | 26 | 470** |
| 19 | A | 750 | 35** | 2.5 <MDL | 340 | 24 | 510** |
| 19 | B | 50 | 30** | 28 | 470 | 24 | 420** |
| 20 | A | 150 | 5 <MDL | 2.5 <MDL | 410 | 31 | 260 |
| 20 | B | 50 | 5 <MDL | 2.5 <MDL | 550 | 31 | 130 |
| Maximum | 3200 | 35 | 30 | 750 | 50 | 2000 | |
| MOE Table 9 | NV | 1 | NV | NV | 86 | 290 | |
| MOE Table 3 | NV | 1 | NV | NV | 86 | 340 | |
| Site | Replicate | Aluminum | Antimony | Arsenic | Barium | Beryllium | Boron |
|---|---|---|---|---|---|---|---|
| 1 | A | 3400 | 0.2 ≤W | 1.7 | 110 | 0.28 | 6.5 |
| 1 | B | 4100 | 0.2 ≤W | 2.1 | 110 | 0.3 | 7.5 |
| 2 | A | 11000 | 0.2 ≤W | 1.4 | 90 | 0.5 | 8.3 |
| 2 | B | 12000 | 0.2 ≤W | 1.3 | 93 | 0.55 | 8 |
| 3 | A | 20000 | 0.4 <T | 2 | 130 | 0.93 | 18 |
| 3 | B | 10000 | 0.6 <T | 4 | 64 | 0.45 | 9.3 |
| 4 | A | 4800 | 2.8* | 4.2 | 87 | 0.35 | 7.3 |
| 4 | B | 5100 | 3.7* | 4.5 | 62 | 0.33 | 6.3 |
| 5 | A | 5500 | 1 | 1.6 | 70 | 0.28 | 6 |
| 5 | B | 7700 | 0.9 <T | 1.9 | 120 | 0.38 | 8.8 |
| 6 | A | 7400 | 6.8* | 31 | 1300** | 1.6 | 15 |
| 6 | B | 750 | 4.2* | 43 | 130 | 0.15 | 1.5 |
| 7 | A | 8500 | 0.2 ≤W | 2.3 | 65 | 0.43 | 7.5 |
| 7 | B | 11000 | 0.2 ≤W | 3.7 | 85 | 0.5 | 9 |
| 8 | A | 7000 | 0.2 ≤W | 1.7 | 57 | 0.35 | 7 |
| 8 | B | 6800 | 0.2 ≤W | 1.9 | 58 | 0.35 | 6.8 |
| 9 | A | 6800 | 7.4* | 37 | 810** | 1.1 | 30 |
| 9 | B | 7500 | 6.9* | 45 | 700** | 1.6 | 24 |
| 11 | A | 16000 | 12** | 5.6 | 2300** | 0.38 | 24 |
| 11 | B | 14000 | 12** | 5.8 | 930** | 0.5 | 19 |
| 12 | A | 10000 | 0.5 <T | 1.9 | 140 | 0.35 | 7.5 |
| 12 | B | 12000 | 0.3 <T | 2 | 110 | 0.4 | 8.3 |
| 13 | A | 4200 | 0.8 <T | 3.8 | 130 | 0.15 | 15 |
| 13 | B | 4400 | 0.8 <T | 4.6 | 140 | 0.18 | 10 |
| 14 | A | 11000 | 0.2 ≤W | 2.2 | 55 | 0.33 | 6.3 |
| 14 | B | 12000 | 0.3 <T | 3.2 | 66 | 0.35 | 6.3 |
| 15 | A | 5300 | 0.6 <T | 2.6 | 380* | 0.3 | 9.5 |
| 15 | B | 4500 | 0.7 <T | 3.2 | 330* | 0.28 | 9.5 |
| 17 | A | 4000 | 0.6 <T | 2 | 120 | 0.25 | 5.5 |
| 17 | B | 5200 | 1.3 | 3.8 | 1000** | 0.33 | 10 |
| 18 | A | 9500 | 1.4* | 20 | 470** | 2 | 18 |
| 18 | B | 10000 | 1.4* | 99 | 550** | 0.95 | 11 |
| 19 | A | 5400 | 8.1** | 12 | 520** | 0.6 | 12 |
| 19 | B | 5800 | 8.3** | 14 | 770** | 0.58 | 17 |
| 20 | A | 12000 | 0.8 <T | 2.2 | 590** | 0.65 | 16 |
| 20 | B | 8500 | 0.6 <T | 5.8 | 89 | 0.4 | 8.5 |
| Maximum | 20000 | 12 | 99 | 2300 | 2 | 30 | |
| MOE Table 9 | NV | 1.3 | 18 | 220 | 2.5 | 36 | |
| MOE Table 3 | NV | 7.5 | 18 | 390 | 4 | 120 | |
| Site | Replicate | Cadmium | Calcium | Chromium | Cobalt | Copper | Iron |
|---|---|---|---|---|---|---|---|
| 1 | A | 0.2 | 330000 | 26 | 1.9 | 11 | 4300 |
| 1 | B | 0.2 | 300000 | 31 | 2.2 | 13 | 5200 |
| 2 | A | 0.1 <MDL | 130000 | 42 | 4.4 | 19 | 13000 |
| 2 | B | 0.1 <MDL | 110000 | 36 | 5.6 | 17 | 16000 |
| 3 | A | 0.3 | 140000 | 610** | 10 | 39 | 34000 |
| 3 | B | 0.2 | 76000 | 370** | 5.3 | 19 | 17000 |
| 4 | A | 0.2 | 110000 | 11000** | 4.8 | 46 | 27000 |
| 4 | B | 0.1 <MDL | 100000 | 7300** | 4.3 | 23 | 26000 |
| 5 | A | 0.1<MDL | 110000 | 190** | 3 | 9.6 | 12000 |
| 5 | B | 0.2 | 87000 | 4600** | 4 | 17 | 14000 |
| 6 | A | 5.7** | 120000 | 29000** | 9.3 | 83 | 50000 |
| 6 | B | 1.4** | 12000 | 2900** | 1 | 9 | 4900 |
| 7 | A | 0.1 <MDL | 130000 | 170** | 5.5 | 17 | 16000 |
| 7 | B | 0.1 <MDL | 110000 | 140* | 6.1 | 14 | 17000 |
| 8 | A | 0.1 <MDL | 130000 | 130* | 4 | 11 | 14000 |
| 8 | B | 0.1 <MDL | 120000 | 120* | 3.8 | 11 | 15000 |
| 9 | A | 1.2 | 99000 | 31000** | 6.3 | 160** | 29000 |
| 9 | B | 0.2 | 96000 | 31000** | 7.6 | 170** | 34000 |
| 11 | A | 4.7** | 68000 | 12000** | 5.2 | 260** | 35000 |
| 11 | B | 3** | 81000 | 7100** | 6.6 | 240** | 31000 |
| 12 | A | 0.4 | 91000 | 45 | 5.3 | 17 | 16000 |
| 12 | B | 0.2 | 97000 | 51 | 5.7 | 15 | 17000 |
| 13 | A | 3.1** | 60000 | 6200** | 3.4 | 63 | 32000 |
| 13 | B | 1.1 | 70000 | 3000** | 3.3 | 34 | 21000 |
| 14 | A | 0.2 | 36000 | 69 | 4.3 | 11 | 18000 |
| 14 | B | 0.2 | 29000 | 42 | 5 | 13 | 18000 |
| 15 | A | 0.7 | 96000 | 2800** | 2.8 | 24 | 12000 |
| 15 | B | 0.7 | 99000 | 3100** | 2.5 | 21 | 11000 |
| 17 | A | 2.6** | 80000 | 3100** | 2.3 | 17 | 9400 |
| 17 | B | 5.6** | 89000 | 8000** | 2.3 | 44 | 12000 |
| 18 | A | 1.7** | 44000 | 2800** | 8.5 | 50 | 31000 |
| 18 | B | 2.7** | 99000 | 5300** | 6.7 | 62 | 27000 |
| 19 | A | 12** | 160000 | 48000** | 1.7 | 150** | 8400 |
| 19 | B | 11** | 190000 | 56000** | 1.9 | 170** | 7400 |
| 20 | A | 1.1 | 62000 | 2100** | 7.2 | 30 | 22000 |
| 20 | B | 0.5 | 92000 | 680** | 4.6 | 24 | 16000 |
| Maximum | 12 | 330000 | 56000 | 10 | 260 | 50000 | |
| MOE Table 9 | 1.2 | NV | 70 | 22 | 92 | NV | |
| MOE Table 3 | 1.2 | NV | 160 | 22 | 140 | NV | |
| Site | Replicate | Lead | Magnesium | Manganese | Mercury | Molybdenum | Nickel |
|---|---|---|---|---|---|---|---|
| 1 | A | 14 | 2000 | 120 | 0.03 <T | 0.5 <MDL | 7.1 |
| 1 | B | 18 | 2000 | 140 | 0.03 <T | 0.5 <MDL | 8 |
| 2 | A | 3.5 | 4900 | 200 | 0.02 <T | 0.5 <MDL | 14 |
| 2 | B | 2 | 5800 | 260 | 0.02 <T | 0.5 <MDL | 15 |
| 3 | A | 120 | 9500 | 920 | 0.05 | 2 | 29 |
| 3 | B | 140** | 4800 | 480 | 0.06 | 1 | 14 |
| 4 | A | 310** | 5500 | 350 | 0.29** | 8** | 65 |
| 4 | B | 260** | 5200 | 350 | 0.35** | 5.5* | 46 |
| 5 | A | 60 | 5400 | 280 | 0.03 <T | 0.5 <MDL | 8.2 |
| 5 | B | 120 | 6000 | 360 | 0.06 | 1.5 | 13 |
| 6 | A | 630** | 5300 | 400 | 0.61 | 12 | 180** |
| 6 | B | 63 | 550 | 43 | 0.73 | 1.5 | 22 |
| 7 | A | 20 | 5800 | 340 | 0.03 <T | 0.5 <MDL | 15 |
| 7 | B | 31 | 5600 | 340 | 0.04 <T | 0.5 <MDL | 14 |
| 8 | A | 26 | 7500 | 300 | 0.02 <T | 0.5 <MDL | 12 |
| 8 | B | 25 | 7200 | 290 | 0.03 <T | 0.5 <MDL | 13 |
| 9 | A | 110 | 2900 | 250 | 0.08 | 10** | 22 |
| 9 | B | 110 | 3300 | 250 | 0.35** | 9** | 23 |
| 11 | A | 870** | 3300 | 320 | 0.44** | 16** | 34 |
| 11 | B | 720** | 3500 | 330 | 0.63** | 9.5** | 35 |
| 12 | A | 180** | 8300 | 490 | 0.01 ≤W | 0.5 <MDL | 19 |
| 12 | B | 160** | 6800 | 400 | 0.01 ≤W | 0.5 <MDL | 17 |
| 13 | A | 89 | 2900 | 640 | 0.03 <T | 4.5* | 26 |
| 13 | B | 50 | 3600 | 390 | 0.04 <T | 2 | 19 |
| 14 | A | 27 | 3500 | 320 | 0.06 | 0.5 <MDL | 13 |
| 14 | B | 31 | 3700 | 350 | 0.08 | 0.5 <MDL | 15 |
| 15 | A | 83 | 4100 | 250 | 0.05 | 0.5 <MDL | 10 |
| 15 | B | 79 | 3900 | 220 | 0.08 | 0.5 <MDL | 8.5 |
| 17 | A | 86 | 4000 | 200 | 0.05 | 0.5 <MDL | 12 |
| 17 | B | 200** | 3900 | 210 | 0.21 | 0.5 <MDL | 16 |
| 18 | A | 100 | 2200 | 240 | 0.11 | 4.5* | 31 |
| 18 | B | 200** | 5200 | 280 | 0.23 | 2.5* | 26 |
| 19 | A | 440** | 3700 | 260 | 0.08 | 1.5 | 7.9 |
| 19 | B | 490** | 3600 | 220 | 0.08 | 4 | 8.2 |
| 20 | A | 72 | 6400 | 350 | 0.06 | 1 | 32 |
| 20 | B | 75 | 5600 | 310 | 0.09 | 0.5 <MDL | 21 |
| Maximum | 870 | 9500 | 920 | 0.73 | 16 | 180 | |
| MOE Table 9 | 120 | NV | NV | 0.27 | 2 | 82 | |
| MOE Table 3 | 120 | NV | NV | 0.27 | 6.9 | 100 | |
| Site | Replicate | Phosphorus | Potassium | Selenium | Silver | Sodium | Strontium | |
|---|---|---|---|---|---|---|---|---|
| 1 | A | 400 | 500 | 0.4 | <T | 0.2 <MDL | 100 | 110 |
| 1 | B | 450 | 550 | 0.5 | <T | 0.2 <MDL | 100 | 110 |
| 2 | A | 800 | 2100 | 0.3 | <T | 0.2 <MDL | 550 | 130 |
| 2 | B | 850 | 2500 | 0.6 | <T | 0.2 <MDL | 500 | 130 |
| 3 | A | 1800 | 3500 | 0.2 | ≤W | 0.2 <MDL | 550 | 170 |
| 3 | B | 950 | 1700 | 0.2 | ≤W | 0.2 <MDL | 250 | 96 |
| 4 | A | 1400 | 950 | 0.2 | ≤W | 0.2<MDL | 200 | 130 |
| 4 | B | 1000 | 1100 | 0.2 | ≤W | 0.2 <MDL | 200 | 130 |
| 5 | A | 900 | 1100 | 0.2 | ≤W | 0.2 <MDL | 200 | 130 |
| 5 | B | 1200 | 1200 | 0.2 | ≤W | 0.2 <MDL | 200 | 110 |
| 6 | A | 800 | 1200 | 0.6 | <T | 0.4 <MDL | 300 | 190 |
| 6 | B | 200 | 100 | 0.8 | <T | 0.2 <MDL | 50 | 21 |
| 7 | A | 1000 | 1900 | 0.2 | ≤W | 0.2 <MDL | 250 | 160 |
| 7 | B | 750 | 2200 | 0.2 | ≤W | 0.2 <MDL | 250 | 150 |
| 8 | A | 950 | 1600 | 0.2 | ≤W | 0.2 <MDL | 300 | 160 |
| 8 | B | 850 | 1600 | 0.2 | ≤W | 0.2 <MDL | 300 | 150 |
| 9 | A | 50 | 750 | 0.5 | <T | 2* | 450 | 220 |
| 9 | B | 50 | 800 | 0.6 | <T | 0.6* | 400 | 210 |
| 11 | A | 1600 | 850 | 0.2 | ≤W | 1.2* | 1000 | 190 |
| 11 | B | 1400 | 950 | 0.2 | ≤W | 0.6* | 800 | 180 |
| 12 | A | 950 | 2000 | 0.2 | ≤W | 0.2 | 300 | 120 |
| 12 | B | 1000 | 2500 | 0.2 | ≤W | 0.2 <MDL | 300 | 130 |
| 13 | A | 750 | 550 | 0.2 | ≤W | 0.2 <MDL | 200 | 140 |
| 13 | B | 650 | 650 | 0.2 | ≤W | 0.2 <MDL | 200 | 130 |
| 14 | A | 750 | 1300 | 0.2 | ≤W | 0.2 <MDL | 150 | 55 |
| 14 | B | 800 | 1500 | 0.2 | ≤W | 0.2 <MDL | 200 | 48 |
| 15 | A | 1000 | 850 | 0.2 | ≤W | 0.2 <MDL | 250 | 140 |
| 15 | B | 950 | 700 | 0.2 | ≤W | 0.2 <MDL | 250 | 140 |
| 17 | A | 850 | 650 | 0.2 | ≤W | 0.2 <MDL | 150 | 110 |
| 17 | B | 1300 | 800 | 0.2 | ≤W | 0.2 <MDL | 250 | 140 |
| 18 | A | 800 | 1400 | 0.4 | <T | 0.2 <MDL | 200 | 220 |
| 18 | B | 1200 | 1500 | 0.9 | <T | 0.2 <MDL | 400 | 190 |
| 19 | A | 1700 | 550 | 0.2 | ≤W | 0.4 | 400 | 180 |
| 19 | B | 3500 | 550 | 0.2 | ≤W | 0.8 | 400 | 180 |
| 20 | A | 950 | 2300 | 0.2 | ≤W | 0.2 <MDL | 300 | 110 |
| 20 | B | 950 | 1500 | 0.3 | <T | 0.2 <MDL | 200 | 120 |
| Maximum | 3500 | 3500 | 0.9 | 2 | 1000 | 220 | ||
| MOE Table 9 | NV | NV | 1.5 | 0.5 | NA | NV | ||
| MOE Table 3 | NV | NV | 2.4 | 20 | NA | NV | ||
| Site | Replicate | Sulphur | Thallium | Tin | Titanium | Vanadium | Zinc |
|---|---|---|---|---|---|---|---|
| 1 | A | 50 | 10** | 2.5 <MDL | 120 | 6.8 | 43 |
| 1 | B | 50 | 10** | 2.5 <MDL | 100 | 8 | 49 |
| 2 | A | 50 | 5 <MDL | 2.5 <MDL | 590 | 23 | 35 |
| 2 | B | 350 | 5 <MDL | 2.5 <MDL | 770 | 28 | 39 |
| 3 | A | 50 | 5 <MDL | 5 | 1400 | 56 | 130 |
| 3 | B | 400 | 5 <MDL | 2.5 <MDL | 780 | 29 | 66 |
| 4 | A | 950 | 10** | 5 | 400 | 24 | 140 |
| 4 | B | 300 | 5 <MDL | 10 | 490 | 21 | 120 |
| 5 | A | 250 | 5 <MDL | 2.5 <MDL | 550 | 21 | 41 |
| 5 | B | 50 | 5 <MDL | 2.5 <MDL | 440 | 25 | 93 |
| 6 | A | 100 | 40** | 10 | 430 | 28 | 810** |
| 6 | B | 450 | 5 <MDL | 2.5 <MDL | 41 | 2.5 | 84 |
| 7 | A | 200 | 5 <MDL | 2.5 <MDL | 610 | 27 | 45 |
| 7 | B | 150 | 5 <MDL | 2.5 <MDL | 790 | 31 | 49 |
| 8 | A | 250 | 5 <MDL | 2.5 <MDL | 680 | 27 | 46 |
| 8 | B | 250 | 5 <MDL | 2.5 <MDL | 690 | 26 | 43 |
| 9 | A | 450 | 30** | 2.5 <MDL | 420 | 26 | 270 |
| 9 | B | 750 | 35** | 2.5 <MDL | 450 | 24 | 220 |
| 11 | A | 1800 | 5 <MDL | 33 | 480 | 30 | 2000** |
| 11 | B | 3500 | 5 <MDL | 43 | 520 | 32 | 1400** |
| 12 | A | 250 | 5 <MDL | 2.5 <MDL | 660 | 28 | 120 |
| 12 | B | 200 | 5 <MDL | 2.5 <MDL | 760 | 29 | 81 |
| 13 | A | 150 | 5 <MDL | 2.5 <MDL | 400 | 14 | 110 |
| 13 | B | 50 | 5 <MDL | 2.5 <MDL | 460 | 17 | 85 |
| 14 | A | 300 | 5 <MDL | 2.5 <MDL | 670 | 33 | 69 |
| 14 | B | 250 | 5 <MDL | 2.5 <MDL | 770 | 34 | 72 |
| 15 | A | 50 | 5 <MDL | 5 | 470 | 19 | 180 |
| 15 | B | 50 | 5 <MDL | 2.5 <MDL | 420 | 17 | 160 |
| 17 | A | 50 | 5 <MDL | 2.5 <MDL | 370 | 18 | 120 |
| 17 | B | 600 | 10** | 5 | 360 | 18 | 570* |
| 18 | A | 600 | 10** | 5 | 570 | 35 | 250 |
| 18 | B | 150 | 10** | 7.5 | 540 | 32 | 330* |
| 19 | A | 1500 | 40** | 2.5 <MDL | 200 | 17 | 530** |
| 19 | B | 2300 | 45** | 2.5 <MDL | 180 | 14 | 600** |
| 20 | A | 250 | 5 <MDL | 5 | 720 | 34 | 230 |
| 20 | B | 350 | 5 <MDL | 2.5 <MDL | 590 | 27 | 91 |
| Maximum | 3500 | 45 | 43 | 1400 | 56 | 2000 | |
| MOE Table 9 | NV | 1 | NV | NV | 86 | 290 | |
| MOE Table 3 | NV | 1 | NV | NV | 86 | 340 | |
* Value exceeds the MOE Table 9 standards (2011)
** Value exceeds the MOE Table 3 standards (2011)
- <MDL
- less than the laboratory Method Detection Limit
- W
- no measurable response
- <T
- trace amount
- NV
- no value
References
Adriano, D.C., 2001. Trace Elements in Terrestrial Environments: Biogeochemistry, Bioavailability, and Risk of Metals. Springer, New York, pp. 867.
Conrad, E.T., G.L. Mitchell, and D.H. Bauer. 1976. Leather Tanning and Finishing Industry: Assessment of Industrial Hazardous Waste Practices. Contract No. 6801-3261. U.S. Environmental Protection Agency, 1976.
PGL, 2007. Surface and Groundwater Sampling 100 Whiting Avenue, Oshawa, Ontario. PGL File:3174-01.01. Prepared for: Central Lake Ontario Conservation Authority by Pottinger Gaherty Environmental Consultants Ltd., December 2007.
Pratt, P.F., 1966. Chromium. In H.D. Chapman ed., Diagnostic Criteria for Plants and Soils. Quality Printing Company Inc., Abilene, Texas.
Weymark, J., 2009. The Village of Cedar Dale. The Oshawa Express, March 4, 2009
Appendix A
| Site | Zone | Easting | Northing |
|---|---|---|---|
| 1 | 17 | 672909 | 4859968 |
| 2 | 17 | 672921 | 4860002 |
| 3 | 17 | 672835 | 4860002 |
| 4 | 17 | 672831 | 4860042 |
| 5 | 17 | 672784 | 4860027 |
| 6 | 17 | 672779 | 4860053 |
| 7 | 17 | 672713 | 4860066 |
| 8 | 17 | 672751 | 4860111 |
| 9 | 17 | 672720 | 4859982 |
| 10 | 17 | 672683 | 4860025 |
| 11 | 17 | 672712 | 4859965 |
| 12 | 17 | 672670 | 4859993 |
| 13 | 17 | 672662 | 4859963 |
| 14 | 17 | 672620 | 4860038 |
| 15 | 17 | 672589 | 4860009 |
| 16 | 17 | 672631 | 4860049 |
| 17 | 17 | 672527 | 4860047 |
| 18 | 17 | 672550 | 4860078 |
| 19 | 17 | 672557 | 4860086 |
| 20 | 17 | 672530 | 4860125 |
PIBS 8680e