Ground-level ozone
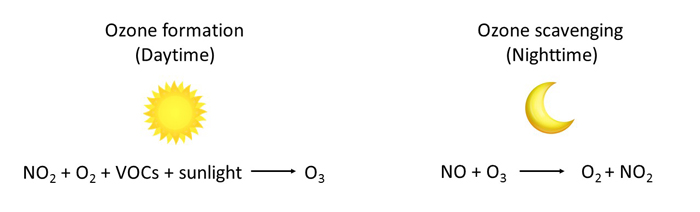
Ground-level ozone is a gas formed when NOx and VOCs react in the presence of sunlight. NOx is comprised of NO2 and nitric oxide (NO). NO2 breaks down in the presence of sunlight to form oxygen atoms (O) and NO. These oxygen atoms then react rapidly with molecular oxygen (O2) in the atmosphere to produce ground-level ozone. This series of reactions, however, can be influenced by the presence of other chemicals, such as VOCs. Ground-level ozone is depleted when it reacts with nitric oxide to form NO2 (a process known as scavenging) decreasing ozone concentrations. Figure 7 shows ozone formation and scavenging.
Figure 7: Schematic of formation and scavenging of ozone
Ozone is a colourless, odourless gas at typical ambient concentrations, and is a major component of smog. The formation and transport of ozone is strongly dependent on weather conditions and emissions of chemicals that contribute to the formation of ozone, such as NOx and VOCs. Changing weather patterns contribute to differences in ozone concentrations hour-to-hour, day-to-day, season-to-season, and year-to-year. In Ontario, the highest concentrations of ground-level ozone are typically recorded on hot and sunny days mainly from May to September, between noon and early evening.
Ozone irritates the respiratory tract and eyes. Exposure to ozone in sensitive people can result in chest tightness, coughing and wheezing. Children who are active outdoors during the summer, when ozone levels are highest, are particularly at risk. Individuals with pre-existing respiratory disorders, such as asthma and chronic obstructive pulmonary disease, are also at risk. Ozone is associated with increased hospital admissions and premature deaths. Ozone may also be harmful to vegetation causing losses in agricultural crops each year in Ontario, with visible leaf damage in many crops, garden plants and trees, especially during the summer months. While ozone at ground level is a significant environmental and health concern, the naturally occurring ozone in the stratosphere, 10 to 40 kilometres (km) above the earth’s surface, is beneficial as it shields the earth from harmful ultraviolet radiation.
VOCs are ozone precursors. Figure 8 shows the 2017 estimates of Ontario’s VOCs emissions from point, area and transportation sources. General solvent use (e.g. degreasing, adhesives and sealants, consumer and commercial products) accounted for approximately 29% of VOCs and the second largest source was the transportation sector, accounting for approximately 28% (Air Pollutant Emission Inventory 1990-2017, 2019). NOx is also an ozone precursor; see Figure 1 for estimates for Ontario’s NOx emissions from point, area and transportation sources.
Figure 8: Ontario VOC emissions by sector (2017 estimates for point/area/transportation sources)
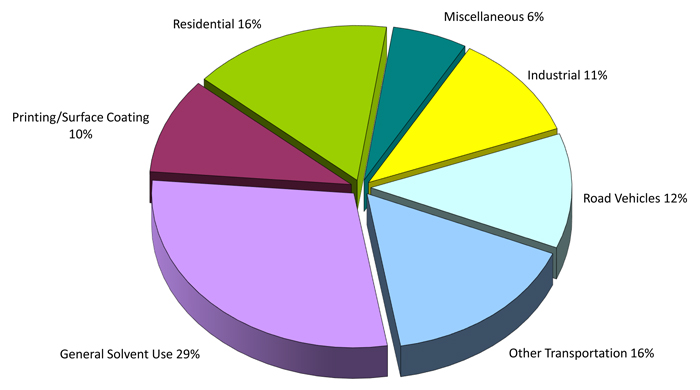
General solvent: 29%, residential: 16%, other transportation: 16%, road vehicles: 12%, industrial: 11%, printing/surface coating: 10%, miscellaneous: 6%.
Note: Excludes emissions from open and natural sources.
In 2017, ozone was monitored at all 39 of the Ministry’s AQHI air monitoring stations. The highest annual mean was 33.0 parts per billion (ppb), measured at Port Stanley, a transboundary-influenced site on the northern shore of Lake Erie. The lowest annual mean, 22.1 ppb, was measured at Toronto West, an urban site located near a major transportation corridor, Highway 401, and directly impacted by local NOx emissions from vehicles. Generally, ozone concentrations are lower in urban areas because ozone is depleted by reacting with NO emitted by vehicles and other local combustion sources.
The maximum one-hour ozone concentrations ranged from 51 ppb recorded in Thunder Bay, to 94 ppb recorded in Kingston. In 2017, 16 AQHI air monitoring stations located in 13 communities across the province measured ozone levels above Ontario’s one-hour AAQC of 80 ppb for at least one hour. Ontario’s one-hour AAQC for ozone was exceeded the most often at three air monitoring stations - Grand Bend, Burlington, and Belleville - on 4 occasions. A summary of the 2017 O3 annual statistics for individual AQHI air monitoring stations in Ontario are presented in Table A6 of the Appendix.
The ozone annual means for Ontario are presented in Figure 9 for the 10-year period from 2008 to 2017. Although there was no significant trend detected in ozone annual means, progressive reductions of NOx emissions in Ontario and the U.S. have resulted in a decrease in maximum ozone concentrations and the duration of elevated ozone events in the province (OMOECC, 2018). In addition to reduced local ozone formation and transboundary influences especially during the summer months, rising global background concentrations (Reid et al, 2008) and reduced scavenging effect (due to decreases in NOx emissions in the province) also influence ozone concentrations. Industrial activities in Europe, the United States (U.S.) and rapidly growing Asia contribute to this global background (Reid et al, 2008; Parrish et al, 2012). Ozone 10-year trends for individual AQHI air monitoring stations in Ontario are presented in Table A14 of the Appendix.
Figure 9: Trend of ozone annual means across Ontario (2008-2017)
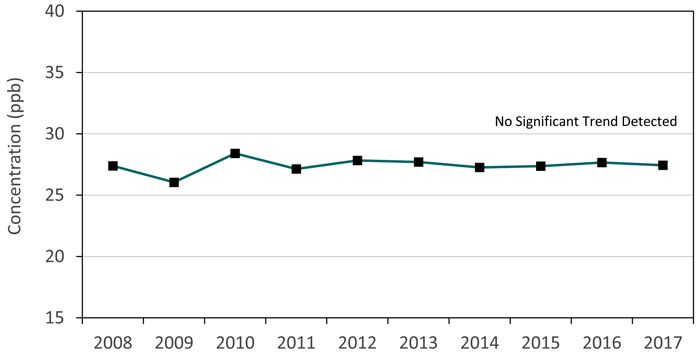
No significant trend was detected for the 10-year period.
Note:
10-year trend based on data from 39 ambient air monitoring stations.
Ontario does not have an annual AAQC for ozone.
Figure 10: Trend of ozone summer and winter means across Ontario (2008-2017)
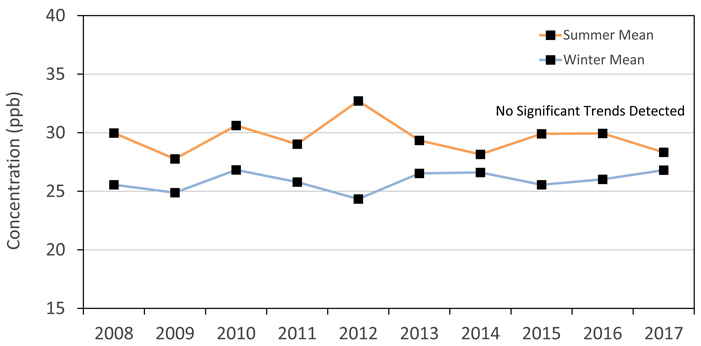
No significant trends were detected over the 10-year period.
Note:
10-year trends are based on data from 39 ambient air monitoring stations.
Summer: May to September; Winter: January to April and October to December.
Ontario does not have an annual AAQC for ozone.
The trend for ozone summer means and ozone winter means are shown in Figure 10. Similarly, no significant trends were detected in either the ozone summer or winter means from 2008 to 2017. Ozone levels continue to exceed Ontario’s AAQC for ozone during the warmer months and remain a challenge in areas of the province. However, ozone concentrations during the winter months were well below Ontario’s ozone AAQC of 80 ppb. Ozone summer and winter 10-year trends for individual AQHI air monitoring stations in Ontario are presented in Tables A15 and A16 of the Appendix.
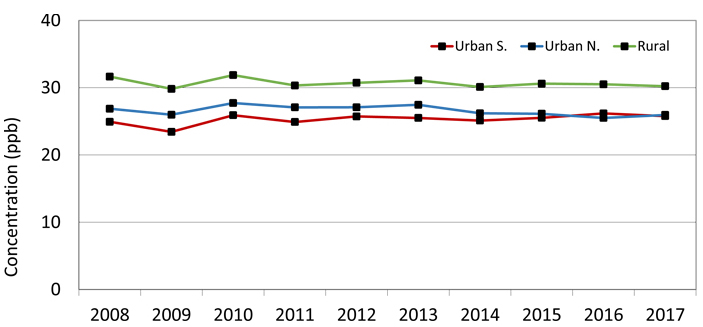
The ozone annual means for urban and rural sites in Ontario from 2008 to 2017 are shown in Figure 11. Ozone annual mean concentrations for urban areas in southern Ontario have been more comparable to those of urban areas in northern Ontario in recent years. This indicates that the decrease in ozone scavenging (see Figure 7) over the past 10 years due to local NOx emission reductions has been greater in urban areas in southern Ontario than in northern Ontario. Over the 10-year period, annual ozone mean concentrations in rural locations were 3-7 ppb higher than urban locations in Ontario. The scavenging of ozone by nitric oxide is more significant in urban areas where there are more NOx emission sources compared to rural areas which generally experience higher ozone concentrations.
Figure 11: Ozone annual means for urban and rural Ontario (2008-2017)
Note:
Urban S. are urban areas in southern Ontario - Windsor, London, Hamilton, Toronto;
Urban N. are urban areas in northern Ontario - Thunder Bay, Sault Ste. Marie, Sudbury, North Bay;
Rural areas in Ontario - Port Stanley, Tiverton, Parry Sound, Petawawa.
Ontario does not have an annual AAQC for ozone.
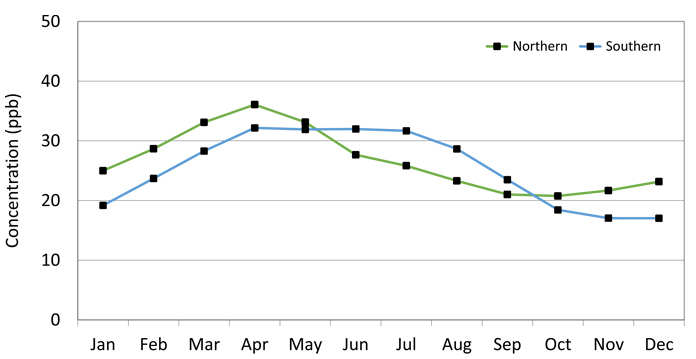
In Figure 12, the ozone monthly means are compared in southern and northern Ontario from 2008 to 2017. The ozone monthly mean concentrations are higher in northern Ontario during the cooler months of the year by approximately 5 ppb on average. Local emissions of nitric oxide are lower in the north so there is less scavenging of ozone than in southern urban areas. There is also a greater potential for stratospheric ozone to be mixed into the troposphere in northern Ontario during the spring (Penkett & Brice, 1986). During the summer months, ozone and its precursors are transported into southern Ontario from the mid-western U.S. causing ozone levels to rise in southern Ontario.
Figure 12: ozone monthly means in southern and northern Ontario (2008 -2017)
Note:
Northern - Thunder Bay, Sault Ste. Marie, Sudbury, North Bay;
Southern - Windsor, London, Hamilton, Toronto.
Ontario does not have an annual AAQC for ozone.