Identification and Assessment
Section I: Identification
The identification of contaminated sediment is achieved through the comparison of sediment chemistry to numerical sediment quality guidelines as previously provided in MOE 1993, Guidelines for the Protection and Management of Aquatic Sediment Quality in Ontario. This section provides a description (or listing) of inorganic and organic Provincial Sediment Quality Guidelines (PSQGs) and their application for assessing sediment contamination.
2. Provincial Sediment Quality Guidelines
2.1 Overview
The purpose of the Provincial Sediment Quality Guidelines is to protect the aquatic environment by setting safe levels for metals, nutrients (substances which promote the growth of algae) and organic compounds.
The guidelines establish three levels of effect - No Effect Level, Lowest Effect Level and Severe Effect Level. The Lowest Effect Level and Severe Effect Level are based on the long-term effects which the contaminants may have on the sediment-dwelling organisms. The No Effect Level is based on levels of chemicals which are so low that significant amounts of contaminants are not expected to be passed through the food chain.
The three levels of effect are:
- The No Effect Level
- indicates a concentration of a chemical in the sediment that does not affect fish or sediment-dwelling organisms. At this level negligible transfer of chemicals through the food chain and no effect on water quality is expected. Sediment meeting the NEL are considered clean.
- The Lowest Effect Level
- indicates a level of contamination that can be tolerated by the majority of sediment-dwelling organisms. Sediments meeting the LEL are considered clean to marginally polluted.
- The Severe Effect Level
- indicates a level of contamination that is expected to be detrimental to the majority of sediment-dwelling organisms. Sediments exceeding the SEL are considered heavily contaminated.
The protocol and rationale for setting PSQGs is provided in Appendix A. PSQGs are provided below in the following tables for metals and nutrients (Table 1), PCBs and organochlorine pesticides (Table 2a), and Polycyclic Aromatic Hydrocarbons (Table 2b). Background concentrations for metals and organic compounds are provided on Table 3 and 4, respectively.
| Metals | No Effect Level | Lowest Effect Level | Severe Effect Level |
|---|---|---|---|
| Arsenic | -b | 6 | 33 |
| Cadmium | - | 0.6 | 10 |
| Chromium | - | 26 | 110 |
| Copper | - | 16 | 110 |
| Iron (%) | - | 2 | 4 |
| Lead | - | 31 | 250 |
| Manganese | - | 460 | 1100 |
| Mercury | - | 0.2 | 2 |
| Nickel | - | 16 | 75 |
| Zinc | - | 120 | 820 |
| Nutrients | No Effect Level | Lowest Effect Level | Severe Effect Level |
|---|---|---|---|
| TOC(%) | -b | 1 | 10 |
| TKN | - | 550 | 4800 |
| TP | - | 600 | 2000 |
a Values in µg/g dry weight unless otherwise noted (µg/g = ppm). Values less than 10 have been rounded to one significant digit. Values greater than 10 have been rounded to two significant digits except for round numbers which remain unchanged (e.g., 400).
b “-” denotes insufficient data/no suitable method
| Compound | No Effect Level | Lowest Effect Level b | Severe Effect Level b (µg/g organic carbon) * |
|---|---|---|---|
| Aldrin | -c | 0.002 | 8 |
| BHC | - | 0.003 | 12 |
| α-BHC | - | 0.006 | 10 |
| β-BHC | - | 0.005 | 21 |
| γ-BHC | 0.0002 | (0.003) d, e | (1) f |
| Chlordane | 0.005 | 0.007 | 6 |
| DDT (total) | - | 0.007 | 12 |
| op + pp-DDT | - | 0.008 | 71 |
| pp-DDD | - | 0.008 | 6 |
| pp-DDE | - | 0.005 | 19 |
| Dieldrin | 0.0006 | 0.002 | 91 |
| Endrin | 0.0005 | 0.003 | 130 |
| HCB | 0.01 | 0.02 | 24 |
| Heptachlor | 0.0003 | - | - |
| Heptachlor epoxide | - | 0.005 e | 5 f |
| Mirex | - | 0.007 | 130 |
| PCB (total) | 0.01 | 0.07 | 530 |
| PCB 1254g | - | (0.06)e | (34)f |
| PCB 1248g | - | (0.03)e | (150) f |
| PCB 1016g | - | (0.007)e | (53)f |
| PCB 1260g | - | (0.005)e | (24)f |
a Values in µg/g dry weight unless otherwise noted (µg/g = ppm). Values less than 10 have been rounded to one significant digit. Values greater than 10 have been rounded to two significant digits except for round numbers which remain unchanged.
b Lowest Effect Levels and Severe Effect Levels are based on the 5th and 95thpercentiles respectively of the Screening Level Concentration (SLC) except where noted otherwise (See Appendix A).
c “-” denotes insufficient data/no suitable method
d Values in round brackets “( )” are tentative guidelines
e 10% SLC
f 90% SLC
g Analyses for PCB Aroclors are not mandatory unless specifically requested by MOE.
* Numbers in this column are to be converted to bulk sediment values by multiplying by the actual TOC concentration of the sediments (to a maximum of 10%). For example, analysis of a sediment sample gave a PCB value of 30 ppm and a TOC of 5%. The value for PCB in the Severe Effects column is first converted to a bulk sediment value for sediment with 5% TOC by multiplying 530 × 0.05 = 26.5 ppm as the Severe Effect Level guideline for that sediment. The measured value of 30 ppm is then compared with this bulk sediment value and is found to exceed the guideline.
| Compoundb | No Effect Level | Lowest Effect Levelc | Severe Effect Levelc (µg/g organic carbon)* |
|---|---|---|---|
| Anthracene | -d | 0.220 | 370 |
| Benzo[a]anthracene | - | 0.320 | 1,480 |
| Benzo[k]fluoranthene | - | 0.240 | 1,340 |
| Benzo[a]pyrene | - | 0.370 | 1,440 |
| Benzo[g,h,i]perylene | - | 0.170 | 320 |
| Chrysene | - | 0.340 | 460 |
| Dibenzo[a,h]anthracene | - | 0.060 | 130 |
| Fluoranthene | - | 0.750 | 1,020 |
| Fluorene | - | 0.190 | 160 |
| Indeno[1,2,3-cd]pyrene | - | 0.200 | 320 |
| Phenanthrene | - | 0.560 | 950 |
| Pyrene | - | 0.490 | 850 |
| PAH (total)e | - | 4 | 10,000 |
a Values in µg/g dry weight unless otherwise noted (µg/g = ppm).
b Guidelines could not be calculated for Acenaphthene, Acenaphthylene, Benzo[b]fluorene and Naphthalene due to insufficient data.
c Lowest Effect Levels and Severe Effect Levels are based on the 5th and 95th percentiles respectively of the Screening Level Concentration (SLC) except where noted otherwise (See Appendix A).
d “-” denotes insufficient data/no suitable method
e PAH (total) is the sum of 16 PAH compounds: Acenaphthene, Acenaphthylene, Anthracene, Benzo[k]fluoranthene, Benzo[b]fluorine, Benzo[a]anthracene, Benzo[a]pyrene, Benzo[g,h,i]perylene, Chrysene, Dibenzo[a,h]anthracene, Fluoranthene, Fluorene, Indeno[1,2,3-cd]pyrene, Naphthalene, Phenanthrene, and Pyrene.
* Numbers in this column are to be converted to bulk sediment values by multiplying by the actual TOC concentration of the sediments (to a maximum of 10%). For example, analysis of a sediment sample gave a B[a]P value of 30 ppm and a TOC of 5%. The value for B[a]P in the Severe Effects column is first converted to a bulk sediment value for sediment with 5% TOC by multiplying 1443 × 0.05 = 72 ppm as the Severe Effect Level guideline for that sediment. The measured value of 30 ppm is then compared with this bulk sediment value and is found to not exceed the guideline.
| Metal | Background (µg/g) |
|---|---|
| Arsenic | 4 |
| Cadmium | 1 |
| Chromium | 31 |
| Copper | 25 |
| Iron (%) | 3 |
| Lead | 23 |
| Manganese | 400 |
| Mercury | 0.1 |
| Nickel | 31 |
| Zinc | 65 |
a Values are based on analysis of Great Lakes pre-colonial sediment horizon
| Compound | Background (µg/g dry wt.) |
|---|---|
| Aldrin | 0.001 |
| α-BHC | 0.001 |
| β-BHC | 0.001 |
| γ-BHC | 0.001 |
| Chlordane | 0.001 |
| DDT (total) | 0.010 |
| op + pp-DDT | 0.005 |
| pp-DDD | 0.002 |
| pp-DDE | 0.003 |
| Dieldrin | 0.001 |
| Endrin | 0.001 |
| HCB | 0.001 |
| Heptachlor | 0.001 |
| Heptachlor epoxide | 0.001 |
| Mirex | 0.001 |
| PCB (total) | 0.020 |
a Values are based on the highest of the Lake Huron or Lake Superior mean surficial sediment concentration
2.2 Application of Sediment Quality Guidelines
The Provincial Sediment Quality Guidelines (PSQGs) shown in Tables 1 and 2 provide the basis for all sediment (or potential lakefill materials to be placed in water) evaluations in Ontario. The guidelines pertain mainly to activities within the aquatic environment and adherence to them is not to be construed as exemption from the requirements of other guidelines, policies, or regulations of this Ministry or other agencies (e.g., the placement of contaminated sediment at an upland site or facility will be subject to the requirements of the Ministry’s Waste Management Regulations). The PSQGs can be used in making decisions on a number of sediment-related issues ranging from prevention of sediment contamination to remedial action for contaminated sediment. Issues to be addressed include, but are not limited to, the following:
- As one line of evidence for assessing contaminated sediments as described in the sediment decision making framework (see Section II).
- Determining appropriate action with regard to sediment clean-up in areas with historic sediment contamination, as well as other areas of potential impact to the environment.
- Determining fill quality for lakefilling associated with shoreline development programs.
- Establishing the chemical suitability of substrate material for the restoration of benthic habitat.
- Determining the appropriate degree of sediment clean-up as a result of chemical spills or unauthorized discharge.
2.3 The evaluation process
Initial evaluation of bottom sediment or fill material is conducted by comparing the chemical concentrations of the material to the appropriate parameter values listed in Tables 1, 2a and 2b, and where required Tables 3 and 4, based on the conditions described in Section 2.3.1.
2.3.1 General conditions governing evaluation
- Material will be tested by bulk sediment analyses and results reported on a dry weight basis, ideally as per MOE analytical methods (MOE 2004a,b,c; 2005a,b,c), or MOE approved equivalent analytical procedures.
- When comparing analytical results with the PSQGs, the results will be rounded as follows: if the reported value is less than ten, it will be rounded to one significant digit. Values greater than 10 will be rounded to two significant digits.
Examples of rounded values for analytical results Example Reported Value Rounded Value < 10 1.78 2 < 10 0.0364 0.04 < 10 0.0052 0.005 > 10 10.827 11 > 10 128.4 130 - If all parameter values for a given material are at (or below) the NEL (if available), that material passes the guideline and it is anticipated that the material will have no adverse chemical effects on aquatic life or water quality.
- If a single parameter value for a given material, based on a sampling program, exceeds the NEL but is below the LEL, the material fails the NEL and would be considered as having a negligible potential to impair the aquatic environment.
- If a single parameter value for a given material, based on a sampling program, is at or above the LEL, that material fails the guideline and it is anticipated that such material may have an adverse effect on some benthic biological resources. If all values are below the LEL, no significant effects on benthic biological resources are anticipated.
- If any single parameter value for a given material, as determined by a sampling program, is at or above the SEL, that material is considered highly contaminated and will likely have a significant effect on benthic biological resources.
- The Ministry recognizes that in an area as geologically diverse as Ontario, local natural sediment levels of metals may vary considerably and in certain areas, such as wetlands, the organic matter content and nutrient levels may be naturally high.
Metals: In areas where local background levels are above the LEL, the local background level will form the practical lower limit for management decisions. In some waterbodies, surficial sediments upstream of all discharges may be acceptable for calculation of background values. Where it cannot be shown that such areas are unaffected by local discharges, the pre-colonial sediment horizon can be used. Site specific background for metals is calculated as the mean of 5 replicate samples from surficial sediment that has not been directly affected by human activity or from the ‘pre-colonial’ sediment horizon. The calculations are described in Appendix A of this document. Alternatively, the mean background values for the Great Lakes Basin as presented in Table 3 may be used.
Nutrients: Areas of high natural organic matter content, such as marshes and other types of wetlands, can be readily distinguished from those resulting from anthropogenic sources. In such cases, for the nutrients listed in Table 1, the local background would serve as the practical lower limit for management action.
- It is also recognized that long-range sources such as atmospheric deposition have contributed to accumulation of organic compounds in areas remote from any specific source. Therefore, in those areas where specific sources cannot be determined, the practical lower limit for management action is the Upper Great Lakes deep basin surficial sediment concentration. These have been defined for a number of organic compounds and are presented in Table 4.
2.3.2 Specific applications
If the sediment concentration exceeds the Lowest Effect Level, then the concentration is compared with the local background values for that parameter. Background values can be derived from physically contiguous areas that are unaffected by point-source discharges, or if these do not exist, then from the "pre-colonial" sediment horizon. The latter would represent background levels in existence before European colonization of the area and is generally considered as the area below the Ambrosia pollen horizon. In those instances where local values are not available, the concentration may be compared to the background values listed in Tables 4. These are based on values from the Great Lakes and may not be applicable to inland sites.
If the sediment concentration is below the natural background then no further management decisions need to be considered. In areas where contaminants in sediment are at or above the Severe Effect Level, the sediment is deemed to be highly contaminated. When there are exceedances of the LEL or SEL, further testing and the development of a management plan may be required.
Section II: Assessment
3. Sediment assessment – the sediment decision-making framework
The assessment of contaminated sediments in Ontario is based on the Canada-Ontario Decision Making Framework for Assessment of Great Lakes Contaminated Sediment (COA, 2007). The COA Sediment Decision-Making Framework builds on previous MOE guidance to assess contaminated sediment (MOE 1993, Guidelines for the Protection and Management of Aquatic Sediment Quality in Ontario and MOE 1996, An Integrated Approach to the Evaluation and Management of Contaminated Sediments). The COA framework provides a consistent and harmonized approach to assessing contaminated sediment, is more structured and transparent in how it assesses information, and provides more specific direction on next steps in making sediment management decisions. The decision matrix, which is compiled following the assessment of the four lines of evidence, allows areas to be identified that require no additional action, further assessment or management decisions.
3.1 Guidance for implementation
There are four general guidance “rules” for the use in the implementation of the framework:
- Sediment chemistry data will not be used alone for remediation decisions except for two cases:
- Where contamination is such that adverse biological effects are likely and the costs of further investigation outweigh the costs of remediation, and there is agreement to act instead of conducting further investigations (Wenning and Ingersoll, 2002).
- Where sites are subject to regulatory action.
- Any remediation decisions will be based primarily on biology, not chemistry since chemical PSQGs (or other criteria in the absence of a PSQG value) are not clean-up numbers by themselves, and need to be used in a risk assessment framework.
- Lines of Evidence (LOE, e.g., laboratory toxicity tests, models) that contradict the results of properly conducted field surveys with appropriate power to detect changes (e.g., see Environment Canada, 2002) should be considered incorrect (Suter, 1996), to the extent that other LOE are not indicative of adverse biological effects in the field.
- When the impacts of a remedial action will result in more environmental harm than leaving the contaminants in place, the remedial action should not be implemented (USEPA, 1998).
3.2 Framework
The framework is a tiered approach, and proceeds through a series of sequential steps; the rationale for each step is provided. However, different steps do not need to be completed separately; two or more steps can (and in some cases should) be completed jointly (i.e., where this will reduce overall time and costs related to sampling and analysis). For example, if available data are insufficient to rule out management action, sediment toxicity tests may be conducted before chemical analyses are conducted for all chemicals with a corresponding guideline or criterion. If toxicity tests show that the sediment is not toxic, and bioaccumulative substances have historically not been observed in the area, there would be no reason to conduct a costly chemical analysis.
The framework is therefore linear in terms of thought processes; however, that linearity does not necessarily have to be followed in actions such as sample collections or analyses. For example, initial field sampling can involve all possible LOEs (e.g., sediments for chemical analyses and toxicity testing; benthos for chemical analyses and taxonomy) with the recognition that, while samples for chemical analyses and taxonomy can be archived, those for toxicity testing cannot be archived and should be tested as soon as possible and no later than 8 weeks following collection (EPA/USACOE, 1998).
The framework is conceptually divided into a series of Steps and Decisions that correspond to different ERA tiers. Screening Assessment (Section 4.2.1) comprises Steps 1-3 and Decisions 1-2. Preliminary Quantitative Assessment (Section 4.2.2) comprises Steps 4-5 and Decisions 3-4. Detailed Quantitative Assessment (Section 4.2.3) comprises Step 6 and Decision 5. Step 7 and Decision 6 deal with deeper sediments (i.e. greater than 10cm depth). The framework is illustrated schematically in its entirety in Figure 1 and in terms of the different ERA tiers at the start of Sections 4.2.1 (Figure 2), 4.2.2 (Figure 3), 4.2.3 (Figure 4), and 4.2.3.2 (Figure 5). The individual steps and the decisions made (and rationale) are described in detail in the sections that follow.
“Due to the complexity involved in evaluating contaminated sediment, it is essential that scientists with strong expertise in sediment chemistry (chemical fate, transport and speciation), sediment toxicity testing, benthic community assessment, food chain effects and environmental statistics assist stakeholder groups in the interpretation of the data. This is especially important in determining differences or effects of sediment contamination compared to reference conditions.” (MOE, 1996)
Figure 1. Decision-Making Framework for Contaminated Sediments. For Explanations of Acronyms, Steps and Decisions, see Text.
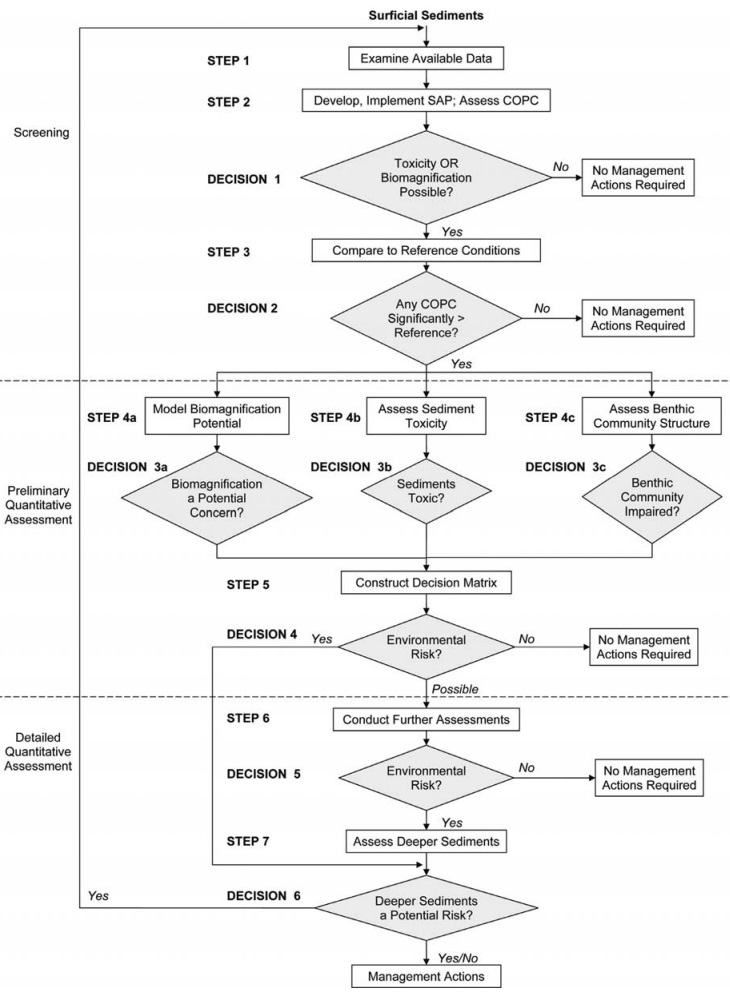
Figure 1 illustrates the decision-making framework for evaluating contaminated sediments. It has three major sections that are discussed in more detail in Figures 2, 3, 4, and 5. The sections are: (1) screening assessment, (2) preliminary quantitative assessment, and (3) detailed quantitative assessment. Each section has a number of steps that need to be considered when assessing contaminated sediments and key decision points. The title of this Figure indicates that the reader should refer to the main text of this report for explanations of acronyms, steps, and decisions.
3.2.1 Screening
Figure 2. Initial Screening Assessment (Steps 1-3, Decisions 1-2). Conservative (worst case) assumptions are used to screen out locations and substances that are clearly not of concern and to focus on those that may be of concern.
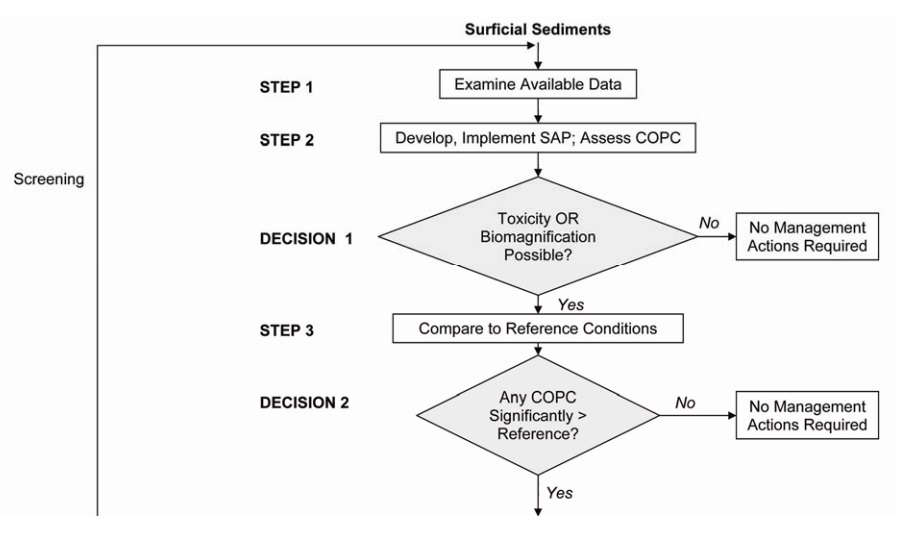
Figure 2 provides a flowchart of the Screening Assessment stage of the decision-making framework for evaluating contaminated sediments. There are 3 steps (Step 1, 2, and 3) and 2 decisions (Decision 1, and 2) as part of this stage. At the top of the figure is the text 'surficial sediments' with a downward arrow to Step 1 'Examine Available Data'. This is followed by a downward arrow to Step 2 'Develop and Implement a Sample and Analysis Plan, and Assess Contaminants of Potential Concern'. Based on the results from Steps 1 and 2, the first decision is: 'Decision 1: Toxicity or Biomagnification Possible?' If the answer is 'No', then no sediment management action is required. If the answer is 'Yes', then proceed to Step 3 'Compare to Reference Conditions'. Based on the results from Step 3, the second decision is: 'Decision 2: Are any Contaminants of Potential Concern Significantly Greater than Reference?' If the answer is 'No', then no sediment management action is required. If the answer is 'Yes', then proceed to Steps 4a, 4b, and 4c as described in Figure 3. There is also an upward arrow that refers to Decision 6 from the detailed quantitative assessment stage of the decision-making framework. If the answer to Decision 6 'Deeper Sediment a Potential Risk?' is 'Yes', then the screening assessment stage needs to consider deeper sediments as well as surficial sediments.
3.2.1.1 Step 1: Examine available data
Examine all readily available data for the site (see Section 4.1: Site Definition), reports and information to determine:
- Contaminants of potential concern (COPC: Section 4.2) and their concentrations at surface (e.g., < 10 cm) and at depth (e.g., > 10 cm);
- Receptors of potential concern (ROPC; i.e. the organisms that may be affected by COPC: Section 4.3); this information may also assist in selection of toxicity test species should the standard MOE protocols (Bedard et al. 1992; Environment Canada 1997a,b; ASTM 2000) be deemed inappropriate (see Section 3.2.2.2);
- Exposure pathways (by which COPCs may reach ROPCs);
- Any human health consumption advisories;
- Sediment stability;
- Appropriate assessment endpoints (what is to be protected, e.g., benthos: organisms living in the sediments – see Section 4.4);
- Measures of effect and the level of any effects determined (what is actually measured, e.g., for benthos: species diversity, abundance, dominance – see Section 4.4);
- Appropriate reference areas/locations and their characteristics (see Section 4.5).
Determine whether the site (defined in Section 4.1) has a high level of environmental sensitivity (based on habitat, not land use), and whether contamination is only from off- site sources. A site is defined as the area under investigation which, dependent on size, COPCs and other considerations, will generally require multiple samples to assess any environmental impact. Develop an initial Conceptual Site Model (CSM – showing the interrelationships of COPCs and ROPCs – see Section 4.6), which will be updated as more information becomes available through further investigation.
Information gathered should consider not only surficial sediments (to about 10 cm depth), which are the initial focus, as this is where the majority of sediment-dwelling organisms live, but also deeper sediments and their contamination level and likelihood of being uncovered or even possibly moved such that they could affect surrounding areas. The status of deeper sediments (Step 7, Decision 6) should be considered as data become available.
Rationale: Make use of historic information to appropriately guide subsequent sampling and analyses (which will almost always be required), and to avoid generating new data where data already exist.
3.2.1.2 Step 2: Develop and implement sampling plan
Based on Step 1 above, develop a Sampling and Analysis Plan (SAP – see Section 4.7) for review and approval by stakeholders, then implement same at both exposed and reference sites. The objective of the SAP is to fill in data gaps related to both COPCs and ROPCs. The SAP should not necessarily be restricted to surficial sediments. A determination is required as to whether there are any COPCs in the sediments that could be toxic and/or biomagnify up food chains (increase in concentrations through three or more trophic levels).
Some common contaminants that biomagnify
1 Measure both total and methyl mercury concentrations in sediments (mercury only biomagnifies in the methylated form)
2 Measure total PCBs (sum of seven Aroclors: 1016, 1221, 1232, 1242, 1248, 1254, 1260; or the sum of congeners) as the PSQG are typically based on total PCBs or specific Aroclors.
3 If a detailed quantitative assessment is conducted, congener specific information may be required for sediments contaminated with PCBs, dioxins and/or furans to evaluate dioxin-like PCB congeners, dioxins and furans when converted into equivalent concentrations of 2,3,7,8-Tetrachlorodibenzo-p-dioxin (2,3,7,8-TCDD)
4 DDT breakdown products, DDD and DDE, should also be measured.
Decision Point 1:
Two questions now need to be addressed. First, are COPC present in sediments above levels that have been shown to have minimal effects to biota living in the sediments? In other words, could the COPC possibly cause toxic effects? Typically only chemistry data will be available to characterize a site. These data are used in an initial pre-screening step to remove sites from further consideration if concentrations are below appropriate sediment toxicity thresholds. However, occasionally, biomonitoring data may be available for a site that indicates potential adverse effects are occurring. In this situation, the biomonitoring data are sufficient to suggest that additional assessment is needed regardless of the results of the screening step based on chemistry data alone. Second, do COPC present in sediments comprise substances that could biomagnify and affect the health of biological communities at higher trophic levels or of humans consuming biota contaminated with those substances?
The first question is addressed by comparing COPCs to the PSQG-LEL or other appropriate criterion (e.g., an SQG that predicts toxicity to less than 5% of the sediment-dwelling fauna, such as the Canadian Threshold Effect Level (TEL), or to a SQG-low from another jurisdiction). If no SQG exists, compare the COPC concentrations to those of the reference areas; sediments where concentrations are greater than 20% of the concentrations in the reference areas, and are statistically higher than the reference areas, suggest anthropogenic exposure has occurred. These substances should be considered as having the potential to cause toxic effects or biomagnify, and further assessment of the sediment is required. The second question is addressed by determining whether substances that can biomagnify are present at quantifiable concentrations. Two decisions are possible:
| Comparison | Decision |
|---|---|
| All sediment COPC < SQG-low, and no substances present that can biomagnify | No further assessment or remediation required. stop |
| One or more sediment COPC > SQG-low, and/or one or more substances present that can biomagnify | Potential risk; further assessment required. proceed to step 3. |
Rationale:
Conduct initial analyses as necessary to make a decision as to whether or not the sediments may pose a potential risk to the environment and/or to human health. By design, SQGs are typically conservative, in other words, over-protective. Thus, if sediment COPC concentrations are below SQG that predict minimal effects (SQG-low), there is negligible ecological risk. For example, Porebski et al. (1999) found that such SQG performed well as “levels below which unacceptable biological effects were unlikely to occur.” Because SQGs have no role in evaluating human health risks or biomagnification (Wenning and Ingersoll, 2002), and there are no such sediment guidelines, initial (conservative) decisions regarding biomagnification potential are simply based on the presence or absence of quantifiable amounts of substances that may biomagnify.
3.2.1.3 Step 3: Compare to reference
Determine whether the concentrations of COPC exceeding SQG-low and/or concentrations of substances that can biomagnify statistically exceed reference concentrations as determined from reference area comparisons.
Decision Point 2:
Two separate questions need to be addressed. First, are concentrations of COPC in sediments that are above SQG-low levels statistically different (p < 0.05) than reference conditions? Second, are concentrations of COPC that could biomagnify, which are present in sediments at quantifiable levels, not statistically different (p < 0.05) than those same COPC in reference areas? Note that in cases where there is little discriminatory power in statistical significance determinations due to very low variability in the reference areas (i.e., a very small difference from reference would be statistically significant but of arguable environmental significance), an additional comparison is possible, specifically: are concentrations of COPC less than 20% above those same COPC in reference areas? The +20% comparison is a straight arithmetic comparison of either mean or individual values, depending on site-specific circumstances (alpha = 0.05; beta = 0.10). Reference conditions include background conditions – either measured or determined from historical data. Note, in making these comparisons, the data for an immensely contaminated (e.g., > 10 fold the SQGs that predict likelihood of toxicity), but relatively small area, should not necessarily be diluted with data from other, much less contaminated areas.
| Comparison | Decision |
|---|---|
| [Concentrations of all sediment COPC > SQG-low and substances present that can biomagnify] < reference conditions and statistically no different than reference | No further assessment or remediation required. stop |
| [Concentrations of one or more sediment COPC > SQG-low and/or one or more substances present that can biomagnify] > reference conditions and statistically higher than reference | Potential risk; further assessment required. proceed to step 4a |
Rationale:
In this step, the framework is considering two possibilities: (1) Either all COPCs which are greater than SQG-low, and those which can biomagnify, are lower than reference (in this case there is no action required because sediment quality reflects background conditions) or (2) there is a difference from reference between one or more COPCs (which exceed SQG-low) and/or there is a difference from reference between one of more substances that can biomagnify. Inorganic and some organic substances occur naturally and may be naturally enriched in some areas (e.g., naturally mineralized areas, oil seeps). The focus of remediation efforts needs to be on anthropogenic (human) contamination, not natural enrichment. The additional possible determination of a difference of 20% between two sets of chemistry data is well within the bounds of typical analytical variability, may not represent a true (significant) difference because it is likely a consequence of natural sediment heterogeneity (MOE, 1996), and is highly unlikely to be of any environmental concern. The additional use of reference + 20% could be useful to screen out areas of marginal environmental concern, and is the same criterion as used for sediment toxicity test results comparisons Section 3.2.2.2).
3.2.2 Preliminary quantitative assessment
Figure 3. Preliminary Quantitative Assessment (Steps 4-5, Decisions 3-4). Contaminated areas screened in are further investigated, preparatory to determining whether there is or is not a problem, or whether additional investigations are required.
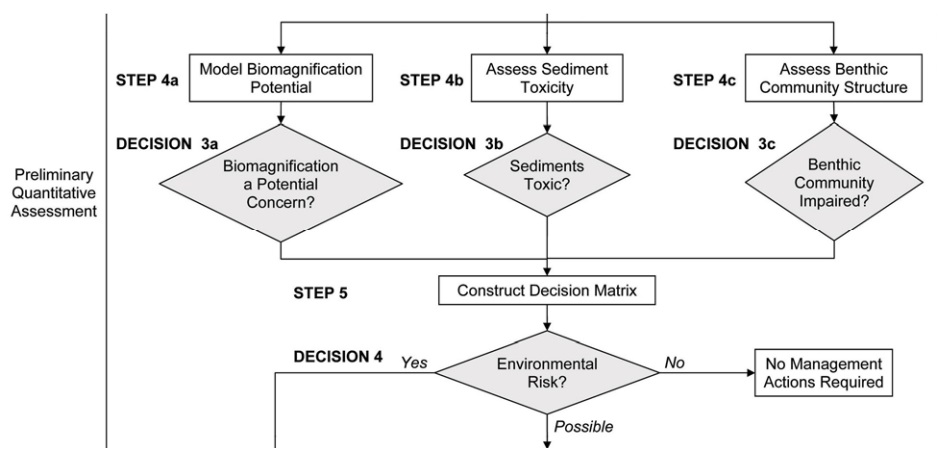
Figure 3 provides a flowchart of the Preliminary Quantitative Assessment stage of the decision-making framework for evaluating contaminated sediments. In this stage, contaminated areas 'screened in' are further investigated, preparatory to determining whether there is or is not a problem, or whether additional investigation is required. There are 2 steps (Step 4 and 5) and 2 decisions (Decision 3 and 4) as part of this stage but Step 4 and Decision 3 are subdivided into 3 subgroups: 'a, b, and c'. At the top of the figure is a downward arrow following the 'Yes' answer from Decision 2 'Are any Contaminants of Potential Concern Significantly Greater than Reference?' from Figure 2. This arrow splits into 3 sections that all must be considered at the same time (Steps 4a, 4b and 4c). Step 4a is 'Model Biomagnification Potential' and is followed by a downward arrow to Decision 3a 'Is Biomagnification a Potential Concern?' Step 4b is 'Assess Sediment Toxicity' and is followed by a downward arrow to Decision 3b 'Sediment Toxic?' Step 4c is 'Assess Benthic Community Structure' and is followed by a downward arrow to Decision 3c 'Benthic Community Impaired?' Regardless of the answers to Decisions 3a, 3b, or 3c, all of the results (from the analysis of potential concern for biomagnification, sediment toxicity, and benthic community assessment) are used to construct a decision matrix in Step 5. Refer to text and Tables 5 and 6 for additional information on the decision matrix. Based on the results from Step 5, the next decision is: 'Decision 4: Environmental Risk?' If the answer is 'No', then no sediment management action is required. If the answer is 'Possible', then proceed to Step 6 as described in Figure 4. If the answer is 'Yes', then proceed to Decision 6 'Deeper Sediment a Potential Risk?' in Figure 5.
3.2.2.1 Step 4a: Biomagnification potential
If substances that can biomagnify remain of concern in sediment-dwelling organisms and in predators of those organisms through to top predators, concentrations in the sediments should be conservatively modeled to determine whether or not there is a potential risk (Grapentine et al., 2003a,b – See Section 5.2). Conservative modelling includes, for example: the assumption that maximum contaminant concentrations occur throughout the exposed area; the use of maximum biomagnification factors (BMFs); the assumption that fish feeding is limited to the exposure area. Basically, worst case scenarios, some of which may be unrealistic, are used to allow environmental risks to be either screened out or identified as possibilities to be investigated further.
Decision Point 3a:
Determine whether or not contaminant biomagnification is a potential concern.
| Comparison | Decision |
|---|---|
| There is no potential for contaminant biomagnification from the sediments through aquatic food chains | No further assessment or remediation required relative to biomagnification. proceed to step 4b |
| There is potential for contaminant biomagnification from the sediments through aquatic food chains | Potential risk; further assessment of biomagnification potential required. proceed to step 4b |
Rationale:
Conservative assumptions inherent in such a modeling exercise (i.e., worst case assumptions) will allow a determination either that biomagnification is not a concern, or that it may be a concern. In the latter case, additional site-specific assessment may be required (Step 6).
3.2.2.2 Step 4b: Sediment toxicity
For the remaining COPC, the PSQG LEL (SQG-low) and PSQG SEL (SQG-high) or equivalent should be used to map spatial patterns of contamination. For situations where no PSQG SEL exists, compare COPC concentrations to the Canadian Probable Effects Level (PEL) or to a SQG-high from another jurisdiction. The SQG-high should predict toxicity to 50% or more of the sediment infauna. Determine the toxicity of representative areas including those most heavily contaminated as well as those moderately and minimally contaminated, and reference areas, synoptic with sediment chemistry determinations (i.e., use subsamples of the same sample for both chemical analyses and toxicity testing). For situations where COPCs are greater than SQG-low but substantially less than SQG-high, best professional judgement should be used to determine if subsequent toxicity testing or bioassessment is required. Typically, laboratory sediment toxicity tests are conducted with three or four appropriately sensitive, standardized sediment-dwelling and/or sediment associated test organisms (e.g., Hexagenia, Hyalella, chironomids, oligochaetes) that are reasonably similar to those found (or expected to be found) at the site (based on available data – Step 1), and combined end-points that involve survival, growth and reproduction (i.e., acute and chronic endpoints); recognised methodologies and organisms (e.g. Bedard et al. 1992; Environment Canada 1997a,b; ASTM 2000) should be used in the assessment of sediment toxicity.
Decision Point 3b:
Bulk sediment chemical analyses do not consider contaminant bioavailability, nor do they provide reliable information on the toxicity of sediment contaminants (reasonably reliable information can be obtained on the non-toxicity of sediment contaminants, cf. Decision Point 1). Thus, a determination is required as to whether or not the sediments that were previously assessed as contaminated are toxic to individual organisms, and the extent of any toxicity.
| Comparison | Decision |
|---|---|
| All sediment toxicity endpoints < 20% difference from reference and not statistically significantly different than reference | No further assessment required relative to laboratory toxicity. proceed to step 4c |
| One or more sediment endpoints > 20% difference from reference and statistically significantly different than reference | Potential risk; further assessment required. proceed to step 4c |
Rationale:
Although sediment toxicity tests have good power to detect differences between responses, a difference of 20% between controls and test/reference sediments is neither different nor environmentally relevant in short-term (e.g., 10 day), acute tests (Mearns et al., 1986; Suter, 1996; EPA/USACOE, 1998; Environment Canada, 1998, 1999). For this framework, sediments with less than a 20% difference between controls and test/reference sediments are not considered to be toxic, even if the difference is statistically significant.
3.2.2.3 Step 4c: Benthic community structure
Determine whether the benthic community is significantly different from appropriate reference sites. Two questions need to be addressed. First, is it appropriate or realistic to assess the benthic community? There may be situations where benthic community structure assessments relative to possible sediment contaminant effects are not appropriate or realistically possible (e.g., shallow harbours where propeller scour, dredging or other habitat disturbances alter benthic communities independent of any contaminant effects; dynamic sediment bedflow that may alter the biological zone as a result of deposition or scour). Benthic community structure assessments will also not be possible for sediments deeper than about 10 cm because the vast majority of the sediment-dwelling organisms live in shallower depths than 10 cm although some organisms (e.g., some bivalves) can burrow much deeper. Second, is the benthic community at the site significantly different from the benthic community in reference areas? Benthic community structure is often described in terms of the diversity, abundance, and dominance of different invertebrate species living in or on the sediment. Assessment of benthic community could include multimetric and/or multivariate analysis (as appropriate) to properly characterize the benthic community. Data interpretation using multivariate approaches are strongly recommended; however, the use of other metrics may have merit (Reynoldson et al., 1995, Hawkins et al, 2000, Barbour et al., 1999, Bailey et al., 2004, Environment Canada 2002).
Decision Point 3c:
Determine benthic community impairment.
| Comparison | Decision |
|---|---|
| It is inappropriate to assess the benthic community. | proceed to step 5 |
| Benthic community is not significantly different from reference areas. | proceed to step 5 |
| Benthic community is significantly different from reference areas. | proceed to step 5 |
Rationale:
Assessing the benthic community at a site, and comparing results to the community at appropriate reference areas, provides valuable information on the cumulative effect of multiple stressors on the invertebrate species that live in or on the sediment. Typically, benthic organisms reside at a site over most of their life span, and therefore integrate the effects of exposure to COPCs as well as other biological and physical stressors. Alteration in the benthic community may be related to the presence of elevated substances in the sediment but may also be due to other factors either natural (e.g., competition/predation, habitat differences) or human-related (e.g., water column contamination). A properly conducted field study and selection of appropriate reference sites are crucial for accurately assessing potential adverse effects to the benthic community at the site.
3.2.2.4 Step 5: Decision matrix
Develop a decision matrix based on, and ranking data from, the available Lines of Evidence (LOE): sediment chemistry, toxicity, benthos [if available and appropriate] and biomagnification potential (Table 5: adapted from Grapentine et al., 2002a). Samples for sediment chemistry and toxicity should be collected synoptically (sub-samples of the same samples); samples for benthos are collected coincidentally (i.e., at the same locations but not on the same samples). Samples for benthos and chemistry analyses can be collected during initial field sampling and archived until and unless needed, thus reducing field costs. However, samples for sediment toxicity cannot be archived for longer than 8 weeks and should ideally be tested as soon as possible following collection (EPA/USACOE, 1998). If benthos studies are not reasonably possible, fit other LOE into Table 6 and use best professional judgement in Step 6.
Decision Point 4
At this point a definitive decision may be possible. Specifically, sufficient information has now been gathered to allow for an assessment of three possibilities: (1) the contaminated sediments pose an environmental risk (see Section 9: Risk Management); (2) the contaminated sediments may pose an environmental risk, but further assessment is required before a definitive decision can be made; (3) the contaminated sediments pose a negligible environmental risk. In Table 6, definitive determinations are possible in four of the 16 possible scenarios (two determinations of negligible environmental risk requiring no further actions; two of environmental risk requiring management actions).
Rationale
At this point definitive determinations are possible in some cases with the provision that sediment stability may still need to be assessed (Step 7); in other cases, further assessment is needed, but can be guided by the results of this data integration. As noted by Wong (2004), SQGs do not provide definitive information for decisions regarding contaminated sediments, including remediation; a weight of evidence (WOE) approach is required. In a WOE approach, sediment chemistry data are given the least weight (Section 3.1, “rules” 1 and 2); benthic community data are given the most weight (Section 3.1, “rule” 3).
The type of WOE integration of LOE shown in Table 7 is usually applied on a station-bystation basis. Thus, although initial screening (Steps 1-3) is intended to screen out areas with relatively low contaminant concentrations, subsequent more detailed sampling of these areas may include stations with contaminant concentrations below levels of concern. Mapping of the results is one means to apply the findings on a large sample basis (i.e., to all sample locations), as a tool for expert/stakeholder groups to identify and focus on obvious problem areas/patterns.
| Lines of Evidence | Rank 1 | Rank 2 | Rank 3 |
|---|---|---|---|
| Bulk Chemistry (compared to SQG) | Adverse Effects Likely: One or more exceedances of SQG-high | Adverse Effects May or May not Occur: One or more exceedances of SQG-low | Adverse Effects Unlikely: All contaminant concentrations below SQG-low |
| Toxicity Endpoints (relative to reference) | Major: Statistically significant reduction of more than 50% in one or more toxicological endpoints | Minor: Statistically significant reduction of more than 20% in one or more toxicological endpoints | Negligible: Reduction of 20% or less in all toxicological endpoints |
| Overall Toxicity | Significant: Multiple tests/endpoints exhibit major toxicological effects | Potential: Multiple tests/endpoints exhibit minor toxicological effects and/or one test/endpoint exhibits major effect | Negligible: Minor toxicological effects observed in no more than one endpoint |
| Benthos Alteration (multivariate assessment, e.g., ordination) | “different” or “very different” from reference stations | “possibly different” from reference stations | “equivalent” to reference stations |
| Biomagnification Potential (relative to reference) | Significant: Based on Step 6 | Possible: Based on Step 4a | Negligible: Based on Steps 4a or 6 |
| Overall WOE assessment | Significant adverse effects:
|
Potential adverse effects:
|
No significant adverse effects:
|
Note that the overall definition of “No Significant Adverse Effects” is independent of sediment chemistry.
| Scenario | Bulk Sediment Chemistry | Overall Toxicity1 | Benthos Alteration2 | Biomagnification Potential3 | Assessment |
|---|---|---|---|---|---|
| 1 | Rank 3 | Rank 3 | Rank 3 | Rank 3 | No further actions needed |
| 2 | Rank 1 or Rank 2 | Rank 3 | Rank 3 | Rank 3 | No further actions needed |
| 3 | Rank 3 | Rank 3 | Rank 1 or Rank 2 | Rank 3 | Determine reason(s) for benthos alteration (Section 7.3) |
| 4 | Rank 3 | Rank 1 or Rank 2 | Rank 3 | Rank 3 | Determine reason(s) for sediment toxicity (Section 7.3) |
| 5 | Rank 3 | Rank 3 | Rank 3 | Rank 2 | Fully assess risk of biomagnification (Section 6.3) |
| 6 | Rank 1 or Rank 2 | Rank 1 or Rank 2 | Rank 3 | Rank 3 | Determine reason(s) for sediment toxicity (Section 7.3) |
| 7 | Rank 3 | Rank 3 | Rank 1 or Rank 2 | Rank 2 | Determine reason(s) for benthos alteration (Section 7.3) and fully assess risk of biomagnification (Section 6.3) |
| 8 | Rank 1 or Rank 2 | Rank 3 | Rank 1 or Rank 2 | Rank 3 | Determine reason(s) for benthos alteration (Section 7.3) |
| 9 | Rank 1 or Rank 2 | Rank 3 | Rank 3 | Rank 2 | Fully assess risk of biomagnification (Section 6.3) |
| 10 | Rank 1 or Rank 2 | Rank 1 or Rank 2 | Rank 3 | Rank 2 | Determine reason(s) for sediment toxicity (Section 7.3) and fully assess risk of biomagnification (Section 6.3) |
| 11 | Rank 1 or Rank 2 | Rank 3 | Rank 1 or Rank 2 | Rank 2 | Determine reason(s) for benthos alteration (Section 7.3) and fully assess risk of biomagnification (Section 6.3) |
| 12 | Rank 3 | Rank 1 or Rank 2 | Rank 3 | Rank 2 | Determine reason(s) for sediment toxicity (Section 7.3) and fully assess risk of biomagnification (Section 6.3) |
| 13 | Rank 3 | Rank 1 or Rank 2 | Rank 1 or Rank 2 | Rank 3 | Determine reason(s) for sediment toxicity and benthos alteration (Section 7.3) |
| 14 | Rank 3 | Rank 1 or Rank 2 | Rank 1 or Rank 2 | Rank 2 | Determine reason(s) for sediment toxicity and benthos alteration (Section 7.3), and fully assess risk of biomagnification (Section 6.3) |
| 15 | Rank 1 or Rank 2 | Rank 1 or Rank 2 | Rank 1 or Rank 2 | Rank 3 | Management actions required4 |
| 16 | Rank 1 or Rank 2 | Rank 1 or Rank 2 | Rank 1 or Rank 2 | Rank 2 | Management actions required4 |
1 Overall toxicity refers to the results of laboratory sediment toxicity tests conducted with a range of test organisms and toxicity endpoints. A positive finding of sediment toxicity may suggest that elevated concentrations of COPCs are adversely affecting test organisms. However, toxicity may also occur that is not related to sediment contamination as a result of laboratory error, problems with the testing protocol, or with the test organisms used.
2 Benthos alteration may be due to other factors, either natural (e.g., competition/predation, habitat differences) or human-related (e.g., water column contamination). Benthos alteration may also be related to sediment toxicity if a substance is present that was not measured in the sediment or for which no sediment quality guidelines exist, or due to toxicity associated with the combined exposure to multiple substances.
3 Per Table 5, significant biomagnification (z) can typically only be determined in Step 6; Step 3 only allows a determination that there either is negligible biomagnification potential or that there is possible biomagnification potential. However, there may be site-specific situations where sufficient evidence is already available from fish advisories and prior research to consider biomagnification at a site significant; this would be determined in Step 1 (examination of available data). Thus, for example, if significant biomagnification were indicated in Scenario 5, above, management actions would be required. The other three LOE do allow for definitive determinations in prior Steps of this framework.
4 Definitive determination possible. Ideally elevated chemistry should be shown to in fact be linked to observed biological effects (i.e., is causal), to ensure management actions address the problem(s). For example, there is no point in removing contaminated sediment if the source of contamination has not been addressed. Ensuring causality may require additional investigations such as toxicity identification evaluation (TIE) and/or contaminant body residue (CBR) analyses (see Section 6.3). If bulk sediment chemistry, toxicity and benthos alteration all indicate that adverse effects are occurring, further assessments of biomagnification should await management actions dealing with the clearly identified problem of contaminated and toxic sediments adversely affecting sediments. In other words, deal with the obvious problem, which may obviate the possible problem (e.g., dredging to deal with unacceptable contaminant-induced alterations to the benthos will effectively also address possible biomagnification issues).
3.2.3 Detailed quantitative assessment
Figure 4. Detailed Quantitative Assessment (Step 6, Decision 5). Decisions can be made regarding management actions for specific situations. In other situations, additional, focused investigations will be required.
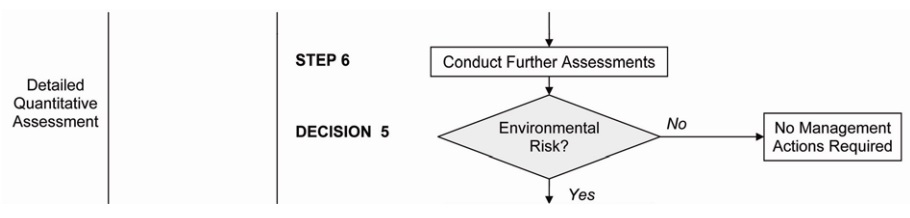
Figure 4 provides a flowchart of the first part of the Detailed Quantitative Assessment stage of the decision-making framework for evaluating contaminated sediments. In this stage, decisions can be made regarding management actions for specific situations or if additional, focused investigations are required. There is 1 step (Step 6) and 1 decision (Decision 5) as part of this stage. At the top of the figure is a downward arrow following the 'Possible' answer from Decision 4: 'Environmental Risk?' from Figure 3. This is followed by a downward arrow to Step 6 'Conduct Further Assessment'. Based on the results from Step 6, the next decision is: 'Decision 5: Environmental Risk?' If the answer is 'No', then no sediment management action is required. If the answer is 'Yes', then proceed to Step 7 as described in Figure 5.
3.2.3.1 Step 6: Further assessment
As per the 16 possible scenarios in Table 6, four result in definite decisions and 12 scenarios result in a determination that the contaminated sediments may pose an environmental risk, but further assessment, outlined in Table 6, is required before a definitive decision is made.
Decision Point 5:
Based on additional investigation, determine whether or not an environmental risk exists. This is where, in particular, and as noted in Section 3.2., it is critical that the study team include scientists with strong expertise in sediment chemistry (chemical fate, transport and speciation), sediment toxicity testing, benthic community assessment, food chain effects and environmental statistics for the design, implementation, and interpretation of both the previous and any additional investigative studies required.
Rationale:
(1) If there is no clear link between elevated chemistry (i.e., sediment contaminant concentrations > SQG-low) and biological effects (i.e., sediment toxicity and/or benthos alteration), there may be no point to sediment remediation as, if the sediment contaminants are not causative, sediment remediation will not ameliorate the biological effects. It is necessary to conduct more detailed studies to determine the cause of biological effects. (2) Observed toxicity and/or benthos alteration in the absence of elevated chemistry may be due to unmeasured contaminants or non-contaminant-related factors; either way, certainty as to causation is required (e.g., toxicity identification evaluation, TIE). (3) Modeling biomagnification only indicates whether there is no problem or may be a problem; if there is a potential biomagnification problem, more definitive assessments involving field measurements (e.g., contaminant body residue [CBR] analyses), laboratory studies, and/or more realistic modeling scenarios are required (see Section 6.3).
The previous assessments typically focus on surficial sediments (up to about 10 cm depth). Surficial sediments effectively cover deeper sediments, which may be similarly or differently contaminated. If so, there is a need to determine whether, under unusual but possible natural or human-related circumstances, these deeper sediments may be uncovered. Such studies involve an assessment of both sediment stability and sediment deposition rates.
3.2.3.2 Step 7: Deeper sediments
Figure 5. Assessment of Deeper (Below Surficial) Sediments (Step 7, Decision 6). If deeper sediments may pose a risk and could be exposed, the risk posed and need for management actions need to be determined.
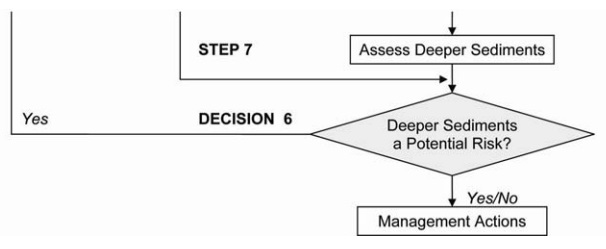
Figure 5 provides a flowchart of the second part of the Detailed Quantitative Assessment stage of the decision-making framework for evaluating contaminated sediments. In this stage, deeper sediments are evaluated. If deeper sediment may pose a risk and could be exposed, then risk posed and need for management actions needs to be determined. There is 1 step (Step 7) and 1 decision (Decision 6) as part of this stage. At the top of the figure are two downward arrows from previous decisions that ultimately point to Decision 6. One arrow at the top of the figure is a downward arrow following the 'Yes' answer from Decision 5: 'Environmental Risk?' from Figure 4. This arrow points to Step 7: 'Assess Deeper Sediments'. The result of this assessment leads to Decision 6: 'Deeper Sediment a Potential Risk?' A second downward arrow to Decision 6 comes from a 'Yes' results from Decision 4 in Figure 3. Based on the results from Step 7 or Decision 4, the next decision is: 'Decision 6: Deeper Sediment a Potential Risk?' If the answer is 'Yes', then the screening assessment stage needs to consider deeper sediments as well as surficial sediments and an arrow points back to Step 1. In addition, if the answer is 'Yes' or 'No', appropriate management actions need to be determined.
| Comparison | Decision |
|---|---|
| Levels of COPC in deeper sediments below SQG-low and no substances present that can biomagnify, or deeper sediments very unlikely to be uncovered under any reasonably possible set of circumstances | No further assessment or remediation required. stop. Management options for polluted surficial sediments should be determined. |
| Levels of COPC in deeper sediments above SQG-low and/or one or more substances present that can biomagnify, and these sediments may be uncovered under one or more reasonably possible set of circumstances | Potential risk; further assessment may be required (See Guidance, Section 1, “rule” 1). follow the framework from step 1 (if necessary). Necessary information will probably already have been gathered for some initial steps. |
Rationale:
If deeper sediments are contaminated, and could be uncovered, they could pose an environmental risk, which needs to be evaluated. If the sediments are not likely to be uncovered, i.e., to become surface sediments, under any reasonably likely set of circumstances (e.g., a 100-year flood), then they do not require further assessment as any contaminants they contain will remain buried and there will be no exposure routes to biota.
4. ERA components of the framework: problem definition (screening assessment)
The following four sections of this document (section 4, 5, 6, and 7) provide information regarding key components of the ecological risk assessment (ERA) approach upon which the decision-making framework is explicitly based. The information provided is not, and is not intended to be, exhaustive (i.e., this document is not a “cook book”); rather, it is intended to provide readily understandable supporting information.
A Screening Assessment (Figure 2, Sections 3.2.1 to 3.2.3) involves simple, qualitative and/or comparative methods, with heavy reliance on literature information and previously collected data (CCME, 1996). Uncertainty (Section 7.4) is highest at this level of an ERA due to the use of conservative methodology and assumptions. Screening on both a conservative and a less conservative basis can provide a range of possible outcomes (which thus need to be investigated). Note that there is no single correct way to conduct this or other levels of an ERA. Subsequent ERA levels or tiers are conducted in an iterative approach, which generally means testing of hypotheses and conclusions and re-evaluating assumptions as new information is gathered.
4.1 Site definition
Sites typically comprise samples from multiple stations, and can be delineated based on ecologically defined scales (Section 7.1), on contaminant concentrations, or on other site-specific conditions. Within such delineations, species at risk and their habitats need to be considered, including the minimum home range of fish feeding on benthic invertebrates. Two additional determinations are needed: (1) does the site have a high level of environmental sensitivity based on habitat (not land use), e.g., is it a wetland used by migrating waterfowl or a feeding ground for shellfish or fish; (2) is it contaminated only from off-site sources, which themselves need to be evaluated? These determinations will affect the design and implementation of subsequent investigations.
Further, the energy of the aquatic system should be considered in determining site boundaries. In a high energy system, sediments may be washed downstream and deposited distal to the site. Likewise, evaluations of scour and deposition may show that sediments at depth may or may not be of concern or that the study area is potentially impacted from upstream sites.
4.2 Contaminants of potential concern (COPCs)
Two classes of COPCs need to be considered:
- Contaminants that can cause acute (short-term, e.g., death) or chronic (longer-term, e.g., effects on growth and/or reproduction) effects to biota. The potential risk from these contaminants is assessed based on comparisons to SQG-low. Where SQG-low are not available for particular contaminants, it may be possible to derive similar values using numerical methods from compilations of toxicity test data, such as species sensitivity distributions (SSDs). Note that SQGs of any sort are, by definition, preliminary, due to data limitations (O’Connor, 2004).
- Contaminants that can biomagnify up food chains. Biomagnification is restricted to organic substances, e.g.: methyl Hg; PCBs; DDT; 2,3,7,8-TCDD.
4.3 Receptors of potential concern (ROPCs)
Primary receptor species must both be potentially exposed to sediment contaminants (the COPCs), and be relevant to the area being assessed (i.e., live or be expected to live primarily in that area). Secondary receptor species are the consumers of the primary receptor species. If it is not appropriate to follow the MOE protocol (Bedard et al. 1992) or other standard toxicity test methods (e.g. Environment Canada 1997a,b; ASTM 2000), agreement among stakeholders is required a priori regarding which receptor species to use for assessments and what surrogate species (if necessary) to use for toxicity testing.
4.4 Assessment of endpoints and measures of effects
An assessment endpoint is defined as the explicit expression of the environmental value that is to be protected. Examples of assessment endpoints include survival, growth and reproduction of major aquatic communities (e.g., aquatic plants, benthic invertebrates (bottom-dwelling animals without backbones), fish, aquatic-dependent birds and mammals). Generic ERA assessment endpoints are provided by the USEPA (2003). A measure of effect is defined as the measurable ecological characteristic that is related to the assessment endpoint. Measures of effect comprise the actual measurements (e.g., actual determinations of survival, growth and reproduction via laboratory or other tests and/or field observations).
4.5 Reference areas/locations
Reference areas/locations serve as the benchmarks against which to compare the contaminated sites. Typically, reference areas/locations represent “the optimal range of minimally impaired conditions that can be achieved at sites anticipated to be ecologically similar” and should be acceptable by local stakeholders and appropriately represent reference conditions (Krantzberg et al., 2000). Ideally the same number of reference sites would be assessed as exposed sites; realistically, a smaller number can be used provided reference conditions are adequately quantified. However, some study areas may provide few or no suitable reference sites, and would be better sampled with a gradient array of sites.
Environment Canada has developed reference conditions for Great Lakes sediments based on a large data set of stations for three groups of parameters: physico-chemical attributes; toxicity; and, benthic community structure. Thus, exposed areas/locations can be compared to appropriate reference conditions by a variety of statistical methodologies (Reynoldson and Day, 1998; Reynoldson et al., 2002a).
Reference areas/locations can be used for three main applications (Apitz et al., 2002): to determine whether or not a contaminated area may require remediation; to determine incremental risk (between an exposed and reference site); and, in a post-remedial monitoring program.
4.6 Conceptual site model (CSM)
The conceptual site model (CSM) is a critical component of any sediment (or other) ERA assessment. It should involve both temporal and spatial components and be reviewed by regulatory agencies and other stakeholders prior to commencing field or laboratory studies to ensure there is agreement. It comprises “a three-dimensional description of a site and its environment that represents what is known (or suspected) about the contaminant source area(s), as well as, the physical, chemical, and biological processes that affect contaminant transport from the source(s) through site environmental media to potential environmental receptors. The CSM identifies assumptions used in site characterization, documents the relevant exposure pathways at the site, provides a template to conduct the exposure pathway evaluation and identifies relevant receptors and endpoints for evaluation. CSM development is an on- going, iterative process that should be initiated as early as possible in the investigative process. The CSM should be as simple or as complex as required to meet site objective(s). The CSM is also an important communication tool to facilitate the decision-making processes at the site” (Apitz et al., 2002). Work done at similar sites can assist in identifying potential shortcomings and pitfalls, and help focus the CSM to the extent possible.
4.7 Sampling and analysis plan (SAP)
The Sampling and Analysis Plan (SAP) is developed based on all of the previous considerations (Sections 4.1 to 4.6). Its initial goal is to identify potential contaminant sources and to delineate areas of contamination (their full nature and their spatial – vertical and lateral – distribution) for subsequent investigation. Subsequent goals involve other LOE as per Figure 1. If a detailed quantitative assessment is conducted, congener specific information may be required for sediments contaminated with PCBs, dioxins and/or furans to evaluate dioxin-like PCB congeners, dioxins and furans when converted into equivalent concentrations of 2,3,7,8-Tetrachlorodibenzo-p-dioxin (2,3,7,8-TCDD).
5. ERA components of the framework: exposure assessment
The decision-making framework is specific for environmental concerns associated with contaminated sediment, including not only ecological, but also human health concerns related to biomagnification. However, there may be situations where potential human health concerns are associated with dermal contact to contaminated sediment (e.g., swimming, wading), or by other exposure routes (e.g., flooding resulting in aquatic sediments contaminating residential soils or gardens, unacceptably high levels of contaminants that do not biomagnify such as Cd, Pb, PAHs in shellfish or fish). In such situations, a screening level HHRA should be considered to assess potential risks and inform the public.
5.1 Sediment chemistry – preliminary quantitative
Preliminary quantitative assessment of sediment contaminants (Figure 2, Sections 3.2.1.1 to 3.2.1.3) can be done on the basis of individual contaminants or by using specific groups of contaminants as surrogates (Grapentine et al., 2002b). Combining information on different contaminants (e.g., Marvin et al., 2004) is not recommended due to information loss. However, where the mode of action and target effect of a toxicant are the same, additivity of contaminants can be considered. In some circumstances, an examination of integrated information from several types of contaminants (i.e., use of a Sediment Quality Index) could contribute to the overall interpretation of the data. Relying solely on such integrated information is not advised. Ancillary information required includes, but is not limited to, sediment particle size and total organic carbon (TOC) data. The extent of contamination can be characterized using techniques such as grids, random and stratified random sampling; the decision regarding which particular method to use will be site-specific.
5.2 Biomagnification potential – preliminary quantitative
Uptake, bioaccumulation and biomagnification of chemicals through the food chain, which is restricted to very few organic chemicals (e.g., methyl mercury; DDT; PCBs; 2,3,7,8-TCDD) should be considered on a case-by-case basis (Figure 3, Section 3.2.2.1). Fish advisories can provide useful information regarding issues (chemicals and species) related to biomagnification. Guidance in initial modeling efforts is provided in Grapentine et al. (2003a,b). Essentially, “this approach relies on the application of conservative (i.e., protective) assumptions regarding BMFs and tissue residue criteria (TRC) to screen for potential toxicological effects to receptor species at higher trophic levels as the result of biomagnification from benthic invertebrate tissue through the food web” (Duncan Boyd, pers. comm.). Benthic invertebrate tissue concentrations are used to predict concentrations in higher trophic levels.
5.3 Detailed quantitative
Detailed quantitative assessment within the framework is outlined in Figure 4 (Sections 3.2.3.1 and 3.2.3.2). Because fish are mobile, their entire feeding area needs to be considered in order to fully assess the potential for some organic contaminants to biomagnify (e.g., through area curve modeling - Freshman and Menzie, 1996). Factors such as site- and species-specific BMFs, lipid content, age/size, and receptor food preference can also be incorporated. Utilizing more realistic assumptions than those used for preliminary quantitative assessment should allow for a better determination regarding the toxicological outcome for upper trophic level receptor species. Whereas the preliminary quantitative assessment is solely a modeling exercise based on sediment and benthos, this more detailed quantitative assessment involves other food chain measurements including fish and possibly plankton.
Natural fate and transport processes affecting sediment contaminants must also be considered, and could include: in-bed fate processes, including irreversible adsorption and chemical or biological reactions; in-bed transport processes, including diffusion and advection; interfacial transport processes, including sediment deposition and resuspension and bioturbation. Potential contaminant sources from groundwater should also be considered. Direct field evidence will be required in some cases. In other cases, reasonable assumptions may be possible based on scientific knowledge and best professional judgement.
More detailed sediment chemistry exposure assessment related to determination of causation could, in some cases, involve the use of biomarkers. Multiple biomarkers can be used in their own WOE assessment as part of the overall ERA (Galloway et al., 2004).
6. ERA components of the framework: effects assessment
6.1 Toxicity testing – preliminary quantitative
The magnitude of any toxicity (Figure 3, Section 3.2.2.2) associated with exposure to contaminants in the sediments is assessed. Such information is typically determined from sediment toxicity tests with well-established, standard test organisms (e.g. Bedard et al. 1992; Environment Canada 1997a,b; ASTM 2000). The possibility of toxicity due to factors other than the COPCs (e.g., grain size, ammonia, sulphides) is typically considered as part of standardized test procedures. Various approaches are possible for integrating multiple toxicological endpoints into a single LOE, however the results of laboratory toxicity tests do not reliably predict effects to field populations (Suter, 1996; Reynoldson et al., 2002a; Chapman et al., 2002).
6.2 Benthos alteration – preliminary quantitative
Benthos alteration (Figure 3, Section 3.2.2.3) is assessed by identifying and enumerating benthic assemblages, and using both univariate (e.g., species richness, abundance, dominance) and multivariate analyses (e.g., ordination, principle component analysis [PCA]) to determine similarities and differences from reference areas and/or conditions (Chapman, 1996; Simpson et al., 2005).
6.3 Detailed quantitative
Detailed quantitative toxicity assessment (Figure 4, Table 6; Section 3.2.3.2) involves additional or more extensive studies as appropriate to site-specific circumstances, for example: spiked sediment toxicity tests; Toxicity Identification Evaluation (TIE); Critical Body Residue (CBR) analyses; tests with resident organisms; in situ bioassays.
Spiked sediment toxicity tests involve adding increasing concentrations of one or more suspected toxicants to reference sediment, and determining concentrations at which effects occur compared to exposed sediments. This procedure can also be applied to exposed sediments. It assists in identifying causative agents for observed toxicity and/or benthic community alterations. Similar information can be provided by TIE and CBR.
TIE were originally based on water or effluent toxicity tests and involve manipulating the chemical composition of toxic samples to remove specific substances (e.g., metals, ammonia) followed by retesting (Burgess, 2000). When an expected toxic effect is not observed as a result of removing specific substance(s), those substance(s) are added back, and the toxic effect is reassessed to confirm that those substances are indeed responsible for the initially observed toxicity, and that toxicity recurs at about the same levels as initially. TIE were subsequently applied to sediment pore waters (assuming that most of the toxicity observed in sediments was due to aqueous exposure routes) (Ankley and Schubauer-Berigan, 1995). They have recently been applied to whole sediments in the marine environment, and although procedures are not yet available to perform full TIE on whole sediments, those procedures that are available show good promise (Burgess et al., 2000; Pelletier et al., 2001; Burgess et al., 2003; Ho et al., 2004). A chemical fractionation scheme has been used together with toxicity testing, to attempt to determine causation in whole sediment freshwater toxicity tests in Lake Ontario (McCarthy et al., 2004).
CBR determinations are based on the fact that, for a contaminant to cause toxicity to an organism, that contaminant has to contact a biological receptor, which generally means the contaminant must be bioaccumulated (taken up) by the organism. Though this remains an active area of research, contaminant concentrations in organisms have been linked to effects (Jarvinen and Ankley, 1999), and used to determine causation in WOE determinations (e.g., Borgmann et al., 2001).
Testing the responses of resident organisms may be appropriate to determine, for instance, why laboratory tests with standard organisms indicate toxicity, but there are no alterations to resident benthic communities. It is entirely possible that resident organisms are more tolerant to sediment contaminants than laboratory organisms (Chapman et al., 2003). If tolerance has been established, then whether or not there are also costs in terms of the loss of intolerant species or energetic costs to the tolerant organisms should be determined.
In a similar manner, in situ bioassays (toxicity and/or bioaccumulation) can be used to test for differences between responses in the laboratory and in the field. Laboratory bioassays are conducted under controlled conditions that will not mimic field conditions to which resident populations are exposed. Conducting bioassays in situ and comparing the results to laboratory tests can assist in determining why differences in responses occur, and whether or not resident populations are at risk (laboratory bioassays tend to be conservative).
7. Risk characterization
The basic approach of starting with chemical hazard assessment (i.e., the use of SQGs: Figure 2), then adding toxicity tests, followed by receiving environment evaluations (Figure 3), matches current practices in the Great Lakes and other parts of Canada as well as the USA (Krantzberg et al., 2000), and international trends (Power and Boumphrey, 2004; Apitz et al., 2005). The framework, outlined here, can be applied to large and small sites in terms of both preliminary and more detailed assessments. It fits within the ERA paradigm, and provides information necessary for the protection of both local aquatic communities and endangered species. The framework also differentiates between those scenarios where elevated concentrations of contaminants are associated with adverse biological effects and those scenarios where they are not (since the presence of substances in sediments where they would not normally be found, or at concentrations above natural background levels, does not necessarily mean that adverse biological effects are occurring). The following documents provide additional detailed information regarding various LOE mentioned herein and their eventual use in risk characterization: MacDonald et al. (2002a,b); Ingersoll and MacDonald (2002); Suter et al. (2002).
7.1 Issues of scale
Issues of scale need to be considered on a site- and situation-specific basis, and are an important factor in choosing between management actions and further study. Estimated exposure from a large area is usually much lower than exposure from a specific, localized site. Under the Contaminated Sites process, the Ministry (MOE) does not allow the relatively high risks of small “hot spots” to be “averaged down” by the relatively small risks of the less contaminated surrounding area. Further, ERA should not be used to avoid addressing an extreme, local “hot spot”. However, considerations of biomagnification potential at a Detailed Quantitative level need to consider the feeding ranges (area use) and preferences of fish and waterfowl (i.e., the measured or assumed fraction of a predator’s diet that is represented by a particular prey species). Area use represents the proportion of a prey species’ home range associated with a particular area of contaminated sediments, and can include seasonal exposure during critical life stages or diminished exposure of migratory species.
7.2 Preliminary quantitative
A Preliminary Quantitative ERA (Tables 1 and 2, Section 3.2.3.1) provides more quantitative information than a Screening Assessment, reduces uncertainty, and is more extensive and expensive (CCME, 1996). Exposure and effects assessments are integrated to determine whether or not significant effects are occurring or are likely to occur. In addition, the nature, magnitude, and extent of effects on the selected assessment points are described. The substances that may be causing or substantially contributing to such effects (the contaminants of potential concern: COPCs) are identified to the extent possible.
The results for each LOE are compiled and interpreted separately. Subsequently, they are combined and integrated, including uncertainty and best professional judgement, to establish a WOE for assessing risks (e.g., Chapman et al., 2002; Reynoldson et al., 2002b). WOE approaches need to be: as quantitative as possible; transparent; and, draw on a broad range of interdisciplinary expertise (Burton et al., 2002). Risks of adverse effects can generally be considered in four categories:
- Negligible – similar to those for reference conditions
- Moderate – minor or potential differences compared to reference conditions
- High – major or significant differences compared to reference conditions
- Uncertain – requiring further study (e.g., a Detailed Quantitative assessment).
7.3 Detailed quantitative
A detailed quantitative assessment (Table 6, Section 3.2.3.2) is the most extensive form of ERA, relying on site-specific data and predictive modeling; information is as quantitative as possible (CCME, 1996). It is intended to reduce key uncertainties in a transparent and scientifically sound manner such that final decisions can be made for all potential contaminated sediment scenarios. Typically, lower ERA tiers involve conservative or ‘worst case” assumptions. This higher tier of ERA typically involves more realistic assumptions.
Detailed quantitative assessment also generally involves determination of causation, specifically answering the question as to whether or not any observed biological effects are due to sediment contaminants and, if so, which contaminant(s) and at what concentration(s) (e.g., Suter et al., 2002). Although sediment stability issues can be addressed initially in a Preliminary Quantitative ERA, they are conclusively addressed here.
Risks will generally be considered in three categories:
- Negligible – similar to those for reference conditions
- Moderate – minor or potential differences compared to reference conditions
- High – major or significant differences compared to reference conditions.
7.4 Uncertainty
Scientific investigations do not always result in easy answers. Uncertainty is inherent in any and all ERA. However, the ERA process is designed to accommodate the relationship between scientific uncertainty and the ability of risk managers to make risk management decisions. The goal in progressing from screening to more quantitative assessment is to diminish key uncertainties and improve confidence in the decision-making process.
In the case of biomagnification assessments, site-specific data and locally relevant food-web structure will diminish the uncertainty associated with extrapolations from literature-based models. However, food-web modeling and predictions will still be required to evaluate possible effects related to biomagnification. Thus, uncertainty cannot be totally eliminated.
There are two general types of uncertainty. Stochastic uncertainty refers to the inherent randomness of the system being assessed, and can be described and estimated but cannot be reduced. Uncertainty arising from human error or from imperfect knowledge can, however, be reduced. In the case of biomagnification assessments, the major sources of the latter type of uncertainty are variability in model inputs (empirically observed variation and/or lack of data for key parameters, and the assumptions and simplifications which are inherent to the structure of any particular model).
Stochastic uncertainty results in intrinsic model limitations that are not the result of a lack of data or computational power. For example, food web model predictions are considered good if they are within a factor of five of observed concentrations for upper trophic level receptors. This leaves a considerable measure of uncertainty for decision-makers to deal with, since this margin of error will frequently exceed the scale of the relative improvement in ecosystem outcome which is desired.
CCME (1996) requires the identification of “key uncertainties”, a management decision as to whether they are acceptable or not, and an evaluation as to whether a preliminary quantitative ERA exposure assessment would significantly reduce uncertainty. The USEPA (1988) identifies the importance of quantitative uncertainty analysis and has published a policy for use of probabilistic analysis in risk assessment.
Three common methods for dealing with sources of uncertainty are sensitivity analysis, Monte Carlo simulation, and the use of monitoring data for model calibration. Sensitivity analysis is a fundamental requirement of any model application and geared to ensuring that the level of effort applied to improving the accuracy of model input parameters is commensurate with their effect on the accuracy of modeled output. Input parameters which have only a small effect on the accuracy of modeled output can be estimated by less accurate and costly methods. Once sensitivity analysis has identified the critical input parameters, a Monte Carlo analysis provides a stochastic approach to generating probabilistic model output through repetitive model runs using the distribution characteristics of uncertain model input parameters. The probability distributions associated with this approach provide an excellent means of quantifying model uncertainty. However, unless the input parameter distribution characteristics are derived from actual data, the uncertainty in outputs is purely a function of assumptions made about the uncertainty of input parameters. Model calibration using monitoring data is an obvious and necessary means of diminishing uncertainty, but good modeling practice requires that model calibration and validation use independent data to avoid assuming that which is to be predicted.
Progression from a screening level assessment, to a more quantitative assessment incorporating site-specifically derived values such as biomagnification factors (BMF), area use factors, and food preference factors for receptor species may result in some reduction of uncertainty compared with the use of literature values. It may also improve the ability to quantify and partition uncertainty. However, the achievable reduction in uncertainty requires careful evaluation before the decision is made to proceed with a more quantitative risk assessment, since it may not diminish uncertainty to the point where decision-making becomes any more straightforward. If the analysis demonstrates that the potential for significant reduction in uncertainty is limited, then the risk manager must evaluate whether the benefits of the ensuing marginal decrease in uncertainty justify the corresponding time and costs. It may prove more expedient to proceed to an examination of risk management options, particularly in cases where socio-economic or technological constraints may limit these options.
In order to ensure that the allocation of time and resources to a quantitative ERA will sufficiently diminish uncertainty for risk management decision-makers, a quantitative uncertainty analysis must be applied at all sites as a prerequisite for proceeding from a screening level ERA to a quantitative ERA. This requirement is generic and not specific to biomagnification assessment.
In the specific case of biomagnification assessment, the accuracy of model predictions of tissue residues in third or fourth trophic level receptor species cannot be quantitatively validated using site-specific data due to the complexity of such food chain transfers, and hence site-specific tissue residue data should only be used to qualitatively ground-truth model predictions. Because sensitivity analysis will generally identify benthic invertebrate tissue concentrations as the most critical measurable input parameter in food chain models, measurement of invertebrate tissue residues should be used as the primary means of assessing biological exposure.