Ontario's context
Ontario’s housing context, challenges and needs
The pandemic has exposed some weaknesses in the province’s social safeguards, particularly in its attempt to keep people safe in shelters and provide adequate housing for the most vulnerable people.
While most Ontario households live in acceptable housing—housing which is affordable, does not require major repairs, and is not overcrowded—the proportion of people experiencing challenges accessing acceptable housing has grown over the past several years. Some of these issues predate the COVID-19 pandemic, and most critically, housing need is more prevalent amongst some of Ontario’s most vulnerable groups.
Housing challenges faced by Ontarians relate to affordability, supply, and support services including:
- affordability challenges, as house prices and rents have risen much faster than household incomes, creating a widening affordability gap
- insufficient supply, as substantial new rental construction is needed to keep up with rapid population growth and demand
- aging social and affordable housing stock, as a large proportion of the most affordable housing, especially rental and government-subsidized housing, is 40 years old or more and at risk of loss due to poor condition and expiring obligations to provide subsidized housing
In addition, Ontario has a very high level of housing need relative to the Canadian average (as measured through the CMHC indicator of core housing need).
The following sections discuss each challenge in detail:
Housing affordability
While the proportion of households experiencing suitability and adequacy issues has remained relatively stable over the past 10 years, the proportion of household who do not live in housing that is affordable has increased. Aside from the short pause caused by the pandemic, rents and house prices have increased rapidly over this period but incomes have not risen at the same rate.
In 2019, the year before the pandemic, owner incomes had risen 14.5%, while renter incomes had increased only 9.6%. While incomes have risen faster in the Toronto area, this area has also experienced higher price and rent growth than in most of the country. Even accounting for temporary supports, prices and rents have risen much faster than incomes.
Rental housing has traditionally provided the more affordable housing option in Ontario, especially in urban areas. However, affordability of rental housing has eroded as rent growth has remained high for the past decade and has accelerated in the past few years as unplanned population growth has occurred. While the last 2 years have seen record construction of purpose-built rental, this is a recent shift after 3 decades of very low rental construction, which has put additional pressure on existing supply.
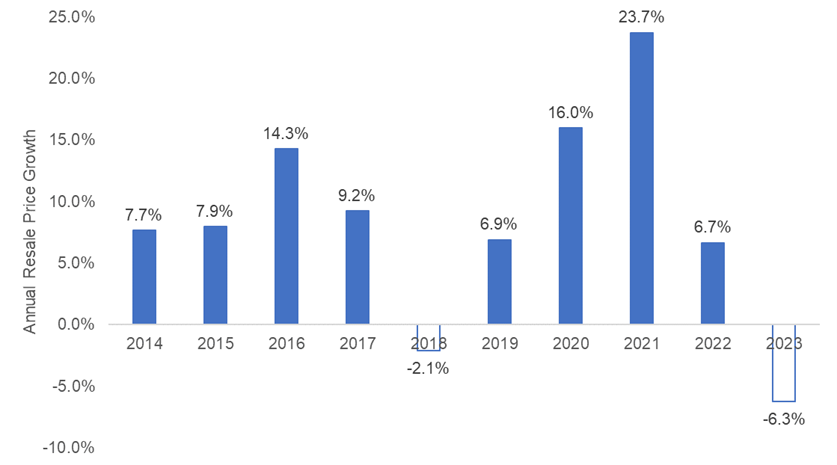
The following chart shows year-over-year average resale price growth in Ontario for residential Multiple Listing Service (MLS) sales from 2014-2023:
Figure 1: MLS resale price growth from 2014-2023
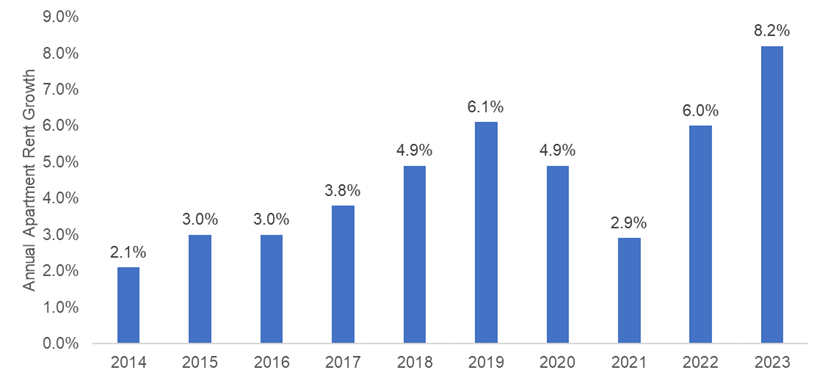
Another source of reduced affordability is rising residential rents, particularly for purpose-built apartments as they tend to be somewhat more affordable than rates in other types of rental dwelling (such as condo rentals). The following chart shows year-over-year growth in average market rents for purpose-built apartments in Ontario from 2014-2023:
Figure 2: Annual rent growth for purpose-built apartments from 2014-2023
Housing supply
A key objective of the NHS programs is to increase the supply of affordable rental housing through the creation of new units and the preservation of existing units.
Need for creating new market rental housing
Rental housing construction in Ontario has lagged behind demand over the past 2 decades, contributing to tight market conditions and the need for more new rental supply, especially in the Toronto area. Since 2000, only 9.2% of all housing starts in Ontario have been purpose-built rentals, compared to 13.0% for the previous decade (1990-1999). There are signs this trend is improving, however, rental starts have increased each year for 10 successive years, and 2023 had the highest rental starts on record.
Condominium developments are still providing a large portion of the new rental supply. Since 2000, 33.9% of housing starts have been condominium units, and about one-third of condominium units are rented in major Ontario centres. These condominium units usually have higher average monthly rents, especially compared to older purpose-built rentals. In the Toronto area, condominium apartments have average monthly rents 49% higher than purpose-built apartments.
Through the NHS’s Ontario Priorities Housing Initiative (OPHI), Service Managers and Indigenous Program Administrators have the flexibility to use program funding towards the creation of new affordable rental housing.
Need for creating new community housing
Before the launch of NHS programs in 2019, no new social housing had been constructed through federal or provincial social housing programs in Ontario since 1995, although some housing providers had created units that offer below market rents to households under affordable housing programs.
As community housing providers’ historical operating agreements expire, mortgages mature and buildings age, there is a risk of losing community stock as providers’ original obligations end and some providers’ financial sustainability is at risk.
Ontario’s Community Renewal Housing Strategy leverages the National Housing Strategy, specifically the Canada-Ontario Community Housing Initiative (COCHI), to prevent the loss of community housing stock and, over time, to grow the stock to help meet the demand for subsidized housing.
As of December 2022, Service Managers reported the number of unique households on Centralized Waitlists for social housing (rent-geared-to-income (RGI) assistance) in Ontario to be estimated to be 176,804. In that same year, 16,449 households were able to move from the waitlists into housing (both RGI and portable housing benefits).
Need for preserving market rental housing
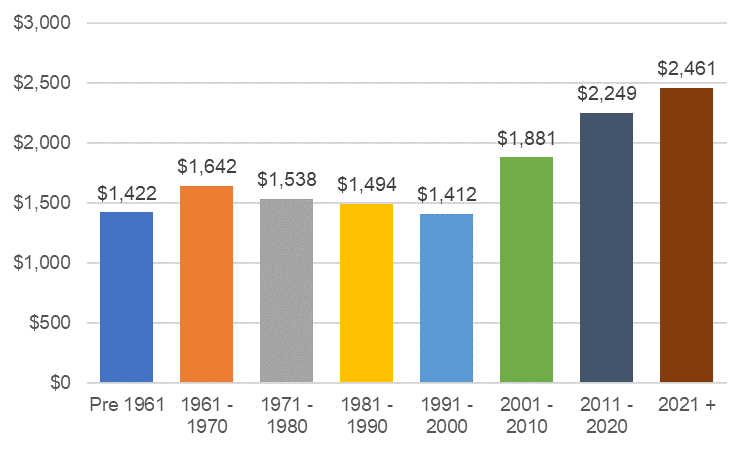
Most of Ontario’s purpose-built rental supply is now 40 years old or more—81% of all purpose-built units were built in 1980 or earlier. This aging stock is a much more affordable segment of the market rental sector, with a noticeable jump in average rent for units built since 2000. The next 2 charts provide evidence of these developments:
The following chart shows the proportion of purpose-built rental units in Ontario, grouped by year of construction
- pre-1961: 22%
- 1961-1970: 31%
- 1971-1980: 27%
- 1981-1990: 7%
- 1991-2000: 2%
- 2001-2010: 3%
- 2011-2020: 6%
- 2021+: 2%
Figure 3: Proportion of purpose-built rental units in Ontario, by year of construction, as of 2023
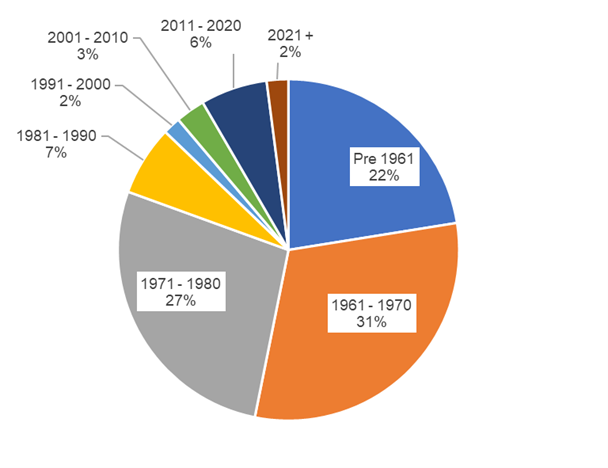
Figure 4 below shows average market rents for purpose-built rental units in Ontario, grouped by year of construction:
Figure 4: Average market rents, by year of construction, as of 2023
Need for preserving community housing
Many of the housing system’s older units are at risk of sitting vacant and unfit for occupancy due to poor condition and a growing backlog of repairs, especially in the community housing sector. While 5.6% of Ontario households report that their dwelling required major repairs in 2021, this figure was 8.3% for renter households (Statistics Canada, Census of Population 2021). These rates are significantly higher for units built in 1980 or earlier.
As part of the multi-year Community Housing Renewal Strategy, the province has introduced measures to incent community housing providers to stay in the system once their original obligations end. Ontario worked in partnership with the community housing sector to develop an improved regulatory environment for Service Managers and housing providers to deliver community housing, improve access to community housing, and grow supply by enabling new community housing providers to enter into the regulatory framework. (See Section C for further details on the new regulatory framework for community housing).
Supportive housing and homelessness
Access to appropriate and affordable housing is a challenge across the province, particularly for those who need ongoing supports to remain housed (such as those with mental health issues). In addition, the protracted economic recovery and high inflation have put more people at risk of homelessness (for example, the impact of sustained reductions in or loss of income and increase in rent arrears).
The COVID-19 pandemic increased pressure on Ontario’s homelessness sector which has not abated. Post-pandemic, the province has seen a significant rise in the number of individuals facing mental health and addictions challenges and increasing complexity in the supports needed. With rates of homelessness on the rise, there has been increasing demand on the emergency shelter system which is at maximum capacity.
Adding further pressure on the shelter and homelessness sector has been the significant increase in the number of individuals seeking asylum in Ontario. In the 2023 calendar year, over 76,000 asylum claimants arrived in Ontario, including those arriving from other provinces. Compared to approximately 26,500 in 2022, this was an increase of 187% in one year. The high level of arrivals is expected to grow by a further 24% in 2024, with the current estimated number of arrivals at over 94,000. Asylum claimants arriving in Ontario are experiencing significant challenges in securing appropriate housing and the shelter systems in many municipalities across the province are at, or over, capacity and cannot accommodate the influx.
Homelessness services in Ontario are funded through a combination of provincial, federal and municipal investments. The province has historically provided approximately 60% of the funding for homelessness programs (municipal 30%; federal 10%). Additional long-term investments are needed to increase supply to address long-term housing needs and to help prevent homelessness.
Providing support services to affordable and social housing tenants is an eligible funding activity under the NHS’s Ontario Priorities Housing Initiative (OPHI). However, funding for these supports and services is restricted to a maximum of 20% of the cost match funding.
Housing need and impacts on vulnerable populations
Two different measures of poverty and housing need, core housing need (CHN) and the Low-Income Measure-After Tax (LIM-AT), suggest that more than 10% of Ontarians fall below the threshold for each measure, with about 639,805 households in CHN and 1.4 million people below the LIM-AT (Statistics Canada, Census of Population, 2021).
Households in core housing need
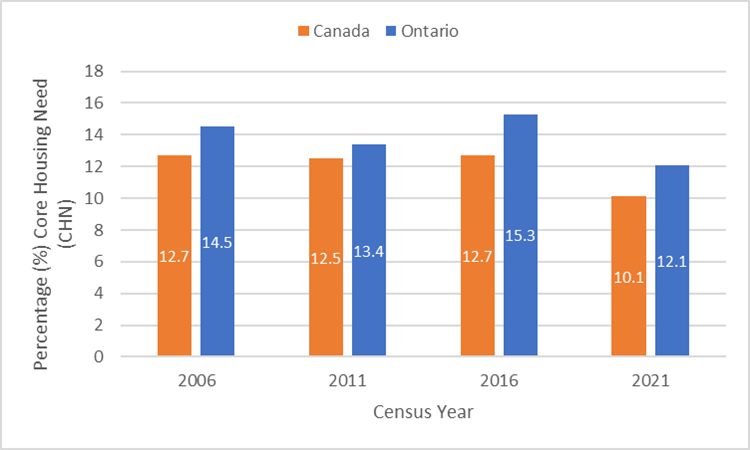
As of 2021, Ontario households experienced one of the highest rates of CHN among PTs, with 12.1% of all households in CHN. The most common reason for a household to be in CHN is affordability challenges. The rate of CHN has declined more than 2 full percentage points over the past 5 years (from 15.3% in 2016). This decrease in CHN is driven largely by improvements in household incomes.
Another way of looking at Ontario’s high rate of CHN is by considering the provincial share of all households in CHN across the nation. When assessed this way, 44% of all Canadian households in CHN reside in Ontario. This is by far the highest proportion in Canada (British Columbia is in second place with 18%).
The following chart compares the percentage of households in core housing need for Ontario and Canada from 2006–2021:
Figure 5: Percentage of households in core housing need (CHN) for Ontario and Canada, by census year
Core housing need by population
There are also differences in the prevalence of CHN across certain subsets of the population (such as seniors, Indigenous people)
Figure 6: Percentage of overall Ontario population in core housing need (CHN), including by seniors and Indigenous identity

Seniors
In 2021, seniors had slightly elevated levels of CHN need overall (10.7%) compared to the overall Ontario population (9.3%). However, the percentage of seniors residing in unaffordable housing (costing 30% or more of total before-tax household income) was lower (18.4%) compared to the overall Ontario population (20%) (Source: Statistics Canada, Census of Population 2021).
As of 2022, approximately 75,335 seniors were living in rent-geared-to-income (RGI) social housing units, representing about 41% of all RGI social housing tenants, and approximately 75,234 seniors were on RGI wait lists. As this population continues to increase, more accessibility supports will be needed for seniors to age in place.
(Source: Service Manager Annual Information Return 2022)
Figure 7: Percentage of overall Ontario population in unaffordable housing including by seniors and Indigenous identity

Figure 8: Percentage of Ontario population in inadequate housing, including by seniors and Indigenous identity
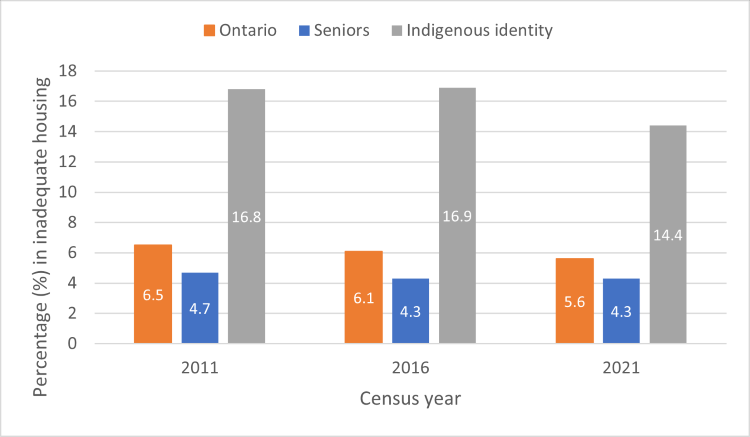
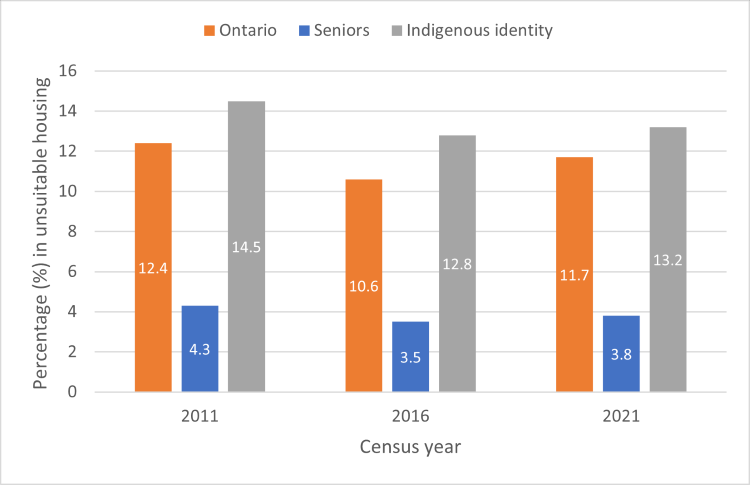
Figure 9: Percentage of Ontario population in unsuitable housing, including by seniors and Indigenous identity
Indigenous households (off-reserve)
Individuals who identify as Indigenous living off-reserve experience higher rates of core housing need (11.3%) compared to the Ontario population overall (9.3%). These individuals experience more than twice the average rate of housing adequacy problems (14.4% vs. 5.6% overall) (Statistics Canada, Census of Population 2021). As of the 2021 Census, 16.9% of Indigenous individuals were in low income (LIM-AT), almost double the rate of low income for all Ontarians (Statistics Canada, Census of Population, 2021)
Proportion of Ontario’s population in low-income-after tax (LIM-AT) for select demographics
The chart below shows the proportion of Ontario’s population falling below the LIM-AT by demographic group for 2021 (latest year available):
Figure 10: Percentage of Population in Low-Income After-Tax (LIM-AT)
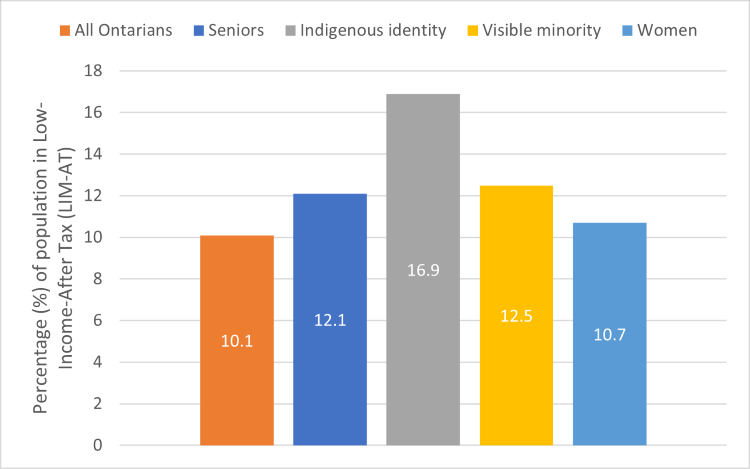
Visible minorities
Visible minorities comprise 34% of Ontario’s population. One-eighth of visible minorities in Ontario (12.5% of the population) live below the low-income measure threshold.
Women
Compared to men (9.7%), women in Ontario (10.7%) are slightly more likely to be below the low income (LIM-AT) threshold. One area of concern is lone-parent households. Women make up the vast majority of this group, which has a particular challenge of sufficient space (such as living in overcrowded housing). This is linked to the affordability challenges of single-income households.
Ontarians experiencing mental illness or substance dependence
While information on the housing situation of Ontarians experiencing mental illness or substance dependence is not available, these issues affect a large segment of the population. In 2022, 15.7% of Ontarians rated their perceived mental health as “fair” or “poor”, a substantial increase from just 2 years previous (10.7% in 2020). 11.8% reported a mood disorder (9.4% in 2020). 18.1% reported heavy drinking (15.0% in 2020; Statistics Canada, Canadian Community Health Survey 2022).
Mental health and substance dependence issues may contribute to difficulty accessing or retaining stable housing, and in some cases, households will require housing with supports.
Ontario’s housing and homelessness system and program delivery
Ontario’s housing and homelessness programs are delivered locally by provincial service-delivery partners, within a framework that is overseen by the province.
The Ontario government sets the overall vision and establishes the legislative and policy framework for housing and homelessness prevention initiatives through the Housing Services Act, 2011. Within the framework, 47 local Service Managers (SMs) identify needs in their communities, develop 10-year local housing and homelessness plans and design and deliver services to people either directly or through delivery partners (such as housing providers). SMs (which consist of municipalities and District Social Services Administration Boards (DSSABs) that serve northern communities) integrate housing and homelessness planning and service delivery with other local activities. This approach allows them to address unique local circumstances, challenges and opportunities and helps ensure that the solutions they implement respond to the highest priority need.
Ontario also works in partnership with 2 Indigenous Program Administrators (IPAs) to deliver housing and homelessness services that best serve Indigenous peoples off-reserve. To do this, it engages with the IPAs on both systems planning and program design.
Footnotes
- footnote[1] Back to paragraph Considering that individual households can be on multiple Service Manager waiting lists, this number represents an estimated unduplicated count of the number of households waiting for social housing across the province, which the ministry began collecting in 2020.
- footnote[2] Back to paragraph Note that CHN data on seniors and Indigenous people are presented at the population level, rather than the household level, as above. Households may have a mix of individuals across these categories and therefore population-level measures may more clearly represent the actual prevalence for seniors and Indigenous people.