State of Ontario’s Protected Areas Report
The Minister of Natural Resources must report on the protected area system at least once every 10 years. The ministry developed a comprehensive framework to monitor the ecological, social and economic aspects that support sustainable planning and management. This is the basis for the State of Ontario’s Protected Areas Report, which describes the state of the province’s protected areas. It covers the period from 2001 to 2009.
Executive summary
Ontario’s system of protected areas includes over 630 provincial parks and conservation reserves covering an area of 9.5 million hectares, or about nine per cent of Ontario. The Provincial Parks and Conservation Reserves Act, 2006 requires that the Minister of Natural Resources report publicly on the state of the protected area system at least once every five years. To meet this commitment the Ministry of Natural Resources developed a comprehensive framework to monitor ecological, social and economic aspects to support sustainable planning and management of provincial parks and conservation reserves. This information, covering the period 2001-09, forms the basis for this State of Ontario’s Protected Areas Report. The report consists of four chapters that collectively describe the state of Ontario’s diverse protected areas.
The first chapter, Background Information, provides context regarding the planning and management of Ontario’s protected areas. Included are a description of the legislative and strategic direction for the protected area system, a brief history of the development of the system and an overview of the planning process for protected areas. Together, these aspects demonstrate an ongoing and evolving commitment to the integrity of the areas that are protected.
In chapter two, Protecting Ontario’s Natural Diversity, information is provided on the representation of ecological, geological and cultural heritage features within Ontario’s provincial parks and conservation reserves. Ontario has adopted an Ecological Land Classification system as a framework for terrestrial ecosystem representation within the protected areas system. Geological representation is based on environmental themes organized by time, landform evolution and geologic process. Cultural heritage representation is based on a framework that organizes history in relation to aspects of the landscape and physical environment that are basic to human development, including Aboriginal and European settlement.
Chapter three, Ecological Integrity, defines and interprets the term ecological integrity. Factors that contribute to the integrity of protected areas and to the maintenance of ecological integrity over time are discussed. The discussion addresses known pressures, responses to those pressures and the benefits of the protected area system, including the conservation of biodiversity.
The fourth chapter, Opportunities and Benefits, provides information on the diverse social and economic benefits associated with Ontario’s protected area system. These benefits include opportunities for recreation, traditional uses, research and education, as well as broader ecological and societal benefits. There are about 10 million visits to provincial parks each year, with the majority being day users.
Résumé
Le réseau ontarien de zones protégées comprend plus de 630 parcs provinciaux et réserves de conservation qui couvrent une superficie de 9,5 millions d’hectares au total, soit neuf pour cent du territoire de l’Ontario. En vertu de la Loi de 2006 sur les parcs provinciaux et les réserves de conservation, le ministre des Richesses naturelles est tenu de donner un rapport pbulic sur l’état du réseau de zones protégées au moins tous les cinq ans. Pour satisfaire à cette obligation, le ministère des Richesses naturelles a mis au point un cadre complet de surveillance des aspects écologiques, sociaux et économiques afin de soutenir la planification et la gestion durables des parcs provinciaux et réserves de conservation. Cette information, qui porte sur la période de 2001 à 2009, forme la base du rapport State of Ontario’s Protected Areas Report (rapport sur l’état des zones protégées de l’Ontario). Ce rapport (disponible en anglais seulement) est constitué de quatre chapitres qui, ensemble, décrivent l’état des diverses zones protégées de l’Ontario.
Le premier chapitre décrit le contexte dans lequel s’inscrit la planification et la gestion des zones protégées de l’Ontario. Il comprend notamment la description des dispositions législatives et orientations stratégiques qui s’appliquent au réseau de zones protégées, un bref historique de la mise en place de ce réseau et une vue d’ensemble du processus de planification des zones protégées. Ces éléments démontrent un engagement permanent et évolutif à assurer l’intégrité des zones protégées.
Le deuxième chapitre traite de la protection de la diversité naturelle de l’Ontario. Il fournit des renseignements sur la représentation des particularités écologiques, géologiques et de patrimoine culturel dans les parcs provinciaux et les réserves de conservation de l’Ontario. L’Ontario a adopté un système de classification écologique des terres comme cadre pour la représentation des écosystèmes terrestres au sein du réseau de zones protégées. La représentation géologique repose sur des thèmes environnementaux organisés selon l’époque, l’évolution du terrain et le processus géologique. La représentation du patrimoine culturel repose sur une structure qui organise les antécédents historiques en rapport avec les aspects du paysage et du milieu physique qui sont fondamentaux du point de vue du développement humain, notamment l’établissement des communautés autochtones et des Européens.
Le troisième chapitre définit et interprète ce que l’on entend par « intégrité écologique ». Il examine également les facteurs qui contribuent à l’intégrité des zones protégées et à la préservation de l’intégrité écologique au fil du temps. Cet examen traite notamment des pressions connues, des réponses à ces pressions ainsi que des avantages du réseau de zones protégées, dont la préservation de la biodiversité.
Le quatrième chapitre fournit des renseignements sur les divers avantages sociaux et économiques liés au réseau de zones protégées de l’Ontario. Ces avantages incluent les possibilités d’activités de loisirs, d’utilisations traditionnelles, de recherche scientifique et d’éducation, ainsi que des avantages plus larges pour la société et sur le plan de l’écologie. Chaque année, il y a environ 10 millions de visites dans les parcs provinciaux, en majorité pour des visites pendant la journée.
Chapter 1: Background information
1.1 Introduction
The State of Ontario’s Protected Areas Report (SOPAR) is the first state of the resource report for Ontario’s provincial parks and conservation reserves. It is based on analysis included in four technical reports.
This report meets a legislative requirement from the Provincial Parks and Conservation Reserves Act, 2006 in which the Minister of Natural Resources must report on the state of Ontario’s provincial park and conservation reserve system.
Ontario’s provincial park and conservation reserve policy is founded on the concept that a naturally diverse and well managed system of protected areas supports a high quality of life for Ontario’s residents and ensures ecological, social and economic benefits now, and into the future.
SOPAR reports on four key program areas.
- It provides context for the planning and management of provincial parks and conservation reserves.
- It outlines the degree to which representative ecosystems, biodiversity and elements of our natural and cultural heritage have been protected.
- It describes the ecological condition, potential pressures and efforts to maintain and enhance the protected areas system.
- It looks at traditional uses, recreational, research and educational opportunities and economic values and impacts at local and provincial scales.
SOPAR details progress made by the Ministry of Natural Resources (MNR). It is one of a series of provincial reports produced by MNR such as State of the Forests and other state of resources reporting as well as the State of Ontario’s Biodiversity Report which was produced by the Ontario Biodiversity Council.
SOPAR establishes benchmarks to measure the future progress of the provincial parks and conservation reserves program. It also lets people of Ontario know what’s happening in the province’s parks and conservation reserves.
1.2 Legislative requirements
The Provincial Parks and Conservation Reserves Act, 2006 (PPCRA) provides direction for provincial parks and conservation reserves in Ontario. The PPCRA came into effect September 4, 2007. The constitutional protection provided under existing Aboriginal and treaty rights for the Aboriginal peoples of Canada is recognized by the act.
To permanently protect a system of provincial parks and conservation reserves that includes ecosystems that are representative of all of Ontario’s natural regions, protects provincially significant elements of Ontario’s natural and cultural heritage, maintains biodiversity and provides opportunities for compatible, ecologically sustainable recreation.
The PPCRA describes two fundamental principles to guide the planning and management of all provincial parks and conservation reserves: to maintain and restore ecological integrity where possible and to provide opportunities for consultation.
The PPCRA includes the following planning and management principle for ecological integrity:
Maintenance of ecological integrity shall be the first priority and the restoration of ecological integrity shall be considered.
The PPCRA includes balanced objectives for establishing and managing provincial parks and conservation reserves (Table 1.1).
Finally, the PPCRA requires that MNR report on the state of the provincial park and conservation reserve system at least once every five years, and that:
This first State of Ontario’s Protected Areas Report is MNR’s response to this mandate.
MNR is also responsible for protected areas established under the Wilderness Areas Act R.S.O. 1990. The Wilderness Areas Act has been used to preserve small areas to protect plants, animals and other values for recreational, research and educational activities. The value and future status of these areas is currently under review.
Table 1.1: Objectives for provincial parks and conservation reserves
[reformatted as a list for accessibility]
Provincial parks
- To permanently protect representative ecosystems, biodiversity and provincially significant elements of Ontario’s natural and cultural heritage, and to manage these areas to ensure that ecological integrity is maintained.
- To provide opportunities for ecologically sustainable outdoor recreation opportunities and encourage associated economic benefits.
- To provide opportunities for residents of Ontario and visitors to increase their knowledge and appreciation of Ontario’s natural and cultural heritage.
- To facilitate scientific research and to provide points of reference to support monitoring of ecological change on the broader landscape.
Conservation reserves
- To permanently protect representative ecosystems, biodiversity and provincially significant elements of Ontario’s natural and cultural heritage. And to manage these areas to ensure that ecological integrity is maintained.
- To provide opportunities for ecologically sustainable land uses, including traditional outdoor heritage activities and associated economic benefits.
- To facilitate scientific research and to provide points of reference to support monitoring of ecological change on the broader landscape.
1.3 Strategic direction
Strategic direction documents help to guide the Ontario government and its ministries.
Our Sustainable Future outlines MNR’s activities and long-term strategic directions.
- Its vision – sustainable development – requires balancing of social, economic and ecological values. Social and economic benefits depend on sustainable ecological systems.
- Its mission – biodiversity conservation and sustainable use – is the foundation on which sustainable development is based. Sustainability allows us to benefit from ecosystems today, while protecting them for future generations.
- Our Sustainable Future commits MNR to conserve biodiversity, and to undertake state of the resources reporting, such as this State of Ontario’s Protected Areas Report.
1.4 Protected areas – past
Ontario has established a world class protected area system. It started in 1893 with the creation of Algonquin Park, soon followed by Rondeau in 1894. The first Parks Act was introduced in 1913. By 1950, there were six provincial parks and two national parks in Ontario.
Following World War II, demand for outdoor activities led to the creation of new recreation-based parks. In 1954, the Provincial Parks Act was enacted to guide the development and management of the parks. Increasing awareness and interest in nature led to the creation of the Wilderness Areas Act and the regulation of several small wilderness areas in 1959.
By 1967, Ontario had developed a park classification system and established its first primitive (now called wilderness) and nature reserve class parks. In 1978, Ontario approved a provincial park policy, including a goal, objectives, principles and targets for completing a system of provincial parks. This policy was implemented as part of MNR’s District Land Use Planning program. By 1980, Ontario had established 124 provincial parks with an area of 4.3 million hectares.
In 1983, the Minister of Natural Resources announced 155 new provincial park proposals, including the immediate regulation of six large wilderness parks. In addition, a program to promote the stewardship of Areas of Natural and Scientific Interest (ANSIs) on private lands was launched. By 1990, Ontario had established 269 provincial parks with an area of 6.2 million hectares.
A period of expansion in the 1990s was championed by the World Wildlife Fund Canada’s Endangered Spaces campaign. Canada and the provinces signed a Statement of Commitment to Complete Canada’s Network of Protected Areas and the Government of Ontario launched its Keep it Wild Campaign. This led to the creation of conservation reserves under the Public Lands Act and the regulation of nearly a million hectares of land and water as new provincial parks, park additions, and conservation reserves.
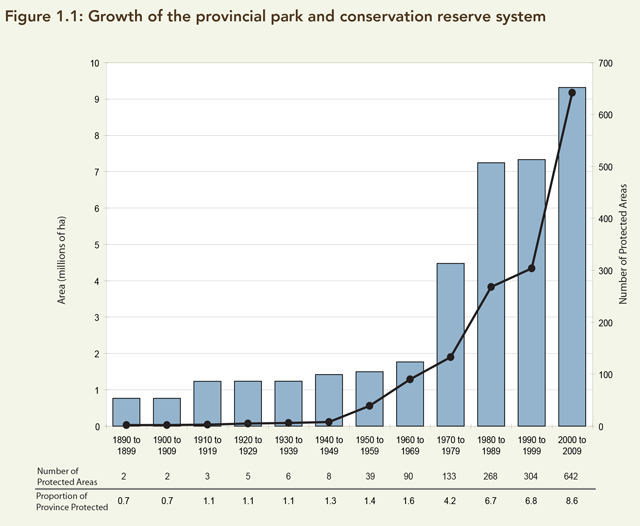
By 1997, Ontario had adopted the Nature’s Best Action Plan to complete its network of protected areas. Land use planning and public consultation took place for an area covering more than 45 per cent of the province. This Lands for Life planning process resulted in the release of the Ontario’s Living Legacy: Land Use Strategy in July 1999. The strategy identified 378 new provincial parks, conservation reserves and additions covering approximately 2.4 million additional hectares (Figure 1.1).
Agreements such as Legacy 2000 and more recently Greenlands have helped expand the protected area system through partnerships with private individuals, businesses, Aboriginal peoples and conservation organizations. The Provincial Parks and Conservation Reserves Act, 2006 took effect in 2007. This new legislation guides the planning, management and operation of these protected areas.
Dedicated protected areas on the Whitefeather Forest were identified and planned with Pikangikum First Nation under MNR’s former Northern Boreal Initiative. The first community based land use plan in the Far North called Keeping the Land – A Land Use Strategy for the Whitefeather Forest was completed in 2006. Regulation of these areas as provincial parks under the PPCRA is ongoing.
In July 2008, the Premier of Ontario announced a land use planning initiative for the province’s Far North, which accounts for 42 per cent of Ontario’s area. The initiative will lead to the protection of at least 225,000 square kilometres of the Far North of Ontario in a network of conservation lands. To achieve this objective, MNR is working jointly with First Nations in the Far North to develop community- based land use plans that will identify areas designated for protection and areas where resources are capable of supporting new economic opportunities.
1.5 Protected areas – present
There are currently 330 regulated provincial parks, 294 regulated conservation reserves, 19 recommended new provincial parks and conservation reserves, and 11 wilderness areas, comprising an area of approximately 9.7 million hectares of lands and waters, or about nine per cent of Ontario’s total area (Table 1.2; Figure 1.2).
Regulated provincial parks and conservation reserves have been formally designated by a regulation under the PPCRA. The regulation must be approved by the Lieutenant Governor-in-Council. The regulation process involves detailed mapping and consultation with adjacent landowners.
Recommended protected areas are identified in an approved land use direction, but have not yet been regulated. Recommended protected areas are under interim protection from industrial activities and land dispositions. When the area is regulated the “recommended” label is removed.
| Region | Number | Area (ha) | Percent of ON | Notes |
|---|---|---|---|---|
| Regulated Provincial Parks |
330 | 7,897,336 | 7.3 | |
| Regulated Conservation Reserves | 294 | 1,497,040 | 1.4 | |
| Recommended Provincial Parks (new) | 8 | 60,670 | 0.1 | |
| Recommended Provincial Park Additions |
5 | 132,139 | 0.1 | |
| Recommended Conservation Reserves | 11 | 143,705 | 0.1 | |
| Wilderness Areas |
11 | 838 | <0.1 | |
| Total Provincial Protected Areas | 654 | 9,730,286 | 9.0 | |
| National Parks | 5 | 208,160 | 0.2 | |
| Total Provincial and Federal Protected Areas | 659 | 9,938,446 | 9.2 | (including Algonquin R/U Zone) |
| Algonquin Recreation/Utilization Zone | 1 | 594,860 | 0.6 | |
| Total Provincial and Federal Protected Areas | 659 | 9,343,586 | 8.6 | (excluding Algonquin R/U Zone) |
| Provincial park class | Number | Area (ha) | % of Parks | % of ON |
|---|---|---|---|---|
| Cultural Heritage | 6 | 6,735 | 0.1 | <0.1 |
| Natural Environment | 80 | 1,466,430 | 18.6 | 1.4 |
| Nature Reserve | 109 | 117,935 | 1.5 | 0.1 |
| Recreational | 65 | 37,073 | 0.5 | <0.1 |
| Waterway | 62 | 1,445,416 | 18.3 | 1.3 |
| Wilderness | 8 | 4,823,745 | 61.1 | 4.5 |
| Provincial Park operating status | Number | Area (ha) | % of Parks | % of ON |
|---|---|---|---|---|
| Non-operating | 217 | 4,490,897 | 56.9 | 4.2 |
| Operating | 113 | 3,406,439 | 43.1 | 3.2 |
- All information is current as of August 1, 2009.
- Percentages are based on the official area of Ontario of 107,870,505 hectares.
There are also five national parks in Ontario protected by federal legislation.
In Ontario there are at least 40 additional protected area designations (e.g. ANSI, lands held by Conservation Authorities, the Nature Conservancy, World Heritage sites, etc.). These areas are located on publicly and privately owned lands and waters and provide various levels of protection and use.
National parks
National parks, which are managed by Parks Canada, protect examples of major natural environments that represent Canada’s natural heritage. These parks preserve biodiversity and important wildlife habitat, celebrate the beauty and infinite variety of our land and offer gateways to nature, adventure, discovery and solitude. The five national parks in Ontario also contribute to objectives and targets for provincial protected areas.
Provincial parks
Provincial parks are organized into six classes based upon their purpose. About one third of Ontario’s 330 regulated provincial parks are actively operated to provide recreation opportunities, facilities and services. All provincial parks are planned and managed by MNR to protect natural and cultural values, conserve biodiversity, and support research and monitoring.
Wilderness class parks protect large areas where nature can exist freely. Visitors mostly travel on foot or by canoe and leave little or no impact on the surrounding area. These parks offer unique and challenging wilderness experiences.
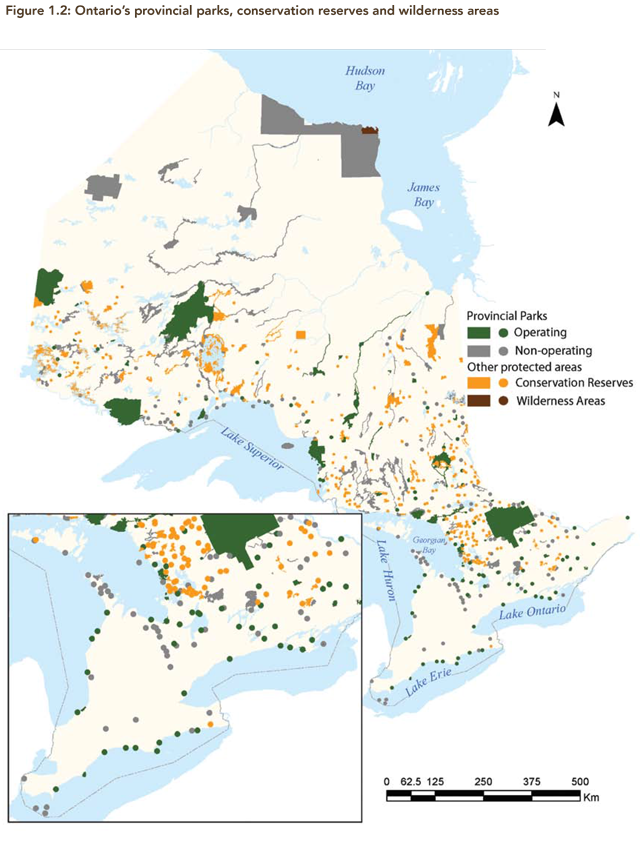
Figure 1.2: Ontario’s provincial parks, conservation reserves and wilderness areas (PDF)
Cultural heritage class parks protect elements of Ontario’s distinctive cultural heritage in open space settings. It is important to protect these areas because of their cultural and historical value and to support interpretation, education and research.
Nature reserve class parks protect a variety of ecosystems and provincially significant elements of Ontario’s natural heritage including special or rare natural habitats and landforms. These areas are protected for their natural value, to support scientific research and to maintain biodiversity.
Natural environment class parks protect outstanding recreational landscapes, representative ecosystems and provincially significant elements of Ontario’s natural and cultural heritage. They provide high quality recreational and educational experiences.
Waterway class parks protect recreational water routes and significant terrestrial and aquatic ecosystems with their associated natural and cultural features. These parks provide high quality recreational and educational experiences.
Recreational class parks provide outdoor recreation opportunities in attractive natural surroundings.
Conservation reserves
Conservation reserves protect representative ecosystems, biodiversity and important elements of Ontario’s natural and cultural heritage. They facilitate scientific research and support monitoring of ecological change and provide opportunities for ecologically sustainable, traditional outdoor heritage activities.
Wilderness areas
Wilderness areas preserve land for research and education, protection of plants and animals, and improvement of the area for its historical, aesthetic, scientific or recreational values. There are currently 11 wilderness areas located outside provincial parks and conservation reserves.
International Union for the Conservation of Nature (IUCN) classification
The International Union for the Conservation of Nature (IUCN) has developed a system for classifying protected areas around the world in a consistent manner. Ontario’s provincial parks fall into Categories I, II and III of the IUCN classification system, depending on park class (Table 1.3). An exception is the recreation-utilization portion in Algonquin Park, which does not match any IUCN category.
Conservation reserves are classified as IUCN Category I, II, or III depending upon management prescriptions. Five hundred twenty of Ontario’s 654 protected areas align with IUCN Category II (43 per cent of total land area protected).
| IUCN Category |
Number of areas | Total area (hectares) | Type of protected area | IUCN category1 |
|---|---|---|---|---|
| Ia | Strict Nature Reserve | 109 | 117,935 | Nature Reserve Class Park |
| Ib | Wilderness Area | 8 | 4,823,745 | Wilderness Class Park |
| II | National Park | 80 | 871,5702 |
Natural Environment Class Park |
| II | National Park | 62 | 1,445,416 | Waterway Class Park |
| II | National Park | 65 | 37,073 | Recreational Class Park |
| II | National Park | 294 | 1,497,040 | Conservation Reserves |
| II | National Park | 19 | 335,840 | Recommended Protected Areas |
| III | National Monument or Feature | 6 | 6,735 | Cultural Heritage Class Parks |
| III | National Monument or Feature | 11 | 838 | Wilderness Areas |
| IV | Habitat/Species Management Area | |||
| V | Protected Landscape/Seascape | |||
| VI |
Protected area with sustainable use of natural resources Not applicable |
594,860 | Algonquin Provincial Park Recreation/ Utilization Zone |
1.6 Management direction
Planning protected areas is an important role for MNR. Management planning makes sure that legislation and strategic direction are applied to a provincial park or conservation reserve. It also identifies the contribution an individual area makes to the overall protected areas system (Figure 1.3).
Management direction can be a management statement for less complex needs or a management plan for more complex situations. Both documents provide a policy framework for managing issues, natural resources, human activities and capital infrastructure within protected areas.
Management statements and plans provide direction for permitted uses and management activities within a protected area over a 20-year time frame. Management activities include activities to conserve natural and cultural heritage, provide outdoor recreation opportunities, promote heritage appreciation and education, and research and monitoring. Management direction is developed as part of a flexible adaptive management approach that includes planning, implementing, monitoring, evaluating, and adjusting.
| Level number | Planning activities | Level of impact |
|---|---|---|
| Level 1 - Direction setting |
|
Broad provincial level |
| Level 2 - Lland use direction |
|
More broad provincial than specific site level |
| Level 3 - Management direction |
|
More specific site level than broad provincial level |
| Level 4 - Implementation & operations |
|
Most specific site level |
The planning process
In 2009, MNR released Ontario’s Protected Areas Planning Manual to guide management planning for provincial parks and conservation reserves.
Two principles guide all aspects of the planning and management of Ontario’s system of protected areas: maintaining ecological integrity and providing meaningful opportunities for consultation. The new manual helps to ensure these principles are integrated into management planning.
The planning and management of provincial parks and conservation reserves must also comply with the Fish and Wildlife Conservation Act 1997, Endangered Species Act 2007, Fisheries Act, 1985, Environmental Assessment Act 1990 and other relevant legislation. They are also subject to the Ontario Provincial Park Planning and Management Policies, Conservation Reserve Policy and a variety of other MNR policies, procedures, standards and guidelines.
The management planning process, while it may contain as many as six steps, is really more of a continuous cycle of planning, implementation and improvement (Figure 1.4). For any given process some of the steps may be combined. However, the sequences of steps in the process remain the same. The nature and degree of management documentation and the number of consultation opportunities can change depending on local issues and public concern.
Secondary planning
Secondary plans are prepared for complex issues where more guidance is required. Examples include fire or vegetation management plans, or a more holistic treatment of the environment in an ecosystem management plan. An approved management direction may indicate a secondary plan is needed, or the need might be in response to an unforeseen circumstance. The process of preparing a secondary plan can be coordinated with project evaluation through the Class Environmental Assessment for Provincial Parks and Conservation Reserves (Class EA-PPCR).
Class environmental assessment
The Class EA-PPCR provides an efficient way to assess management projects based on scale, environmental impacts and level of public concern. Through this process issues, concerns and preferred strategies are identified to ensure that natural, cultural, social and economic values are considered and to reduce negative effects.
Figure 1.4: Protected area planning and management cycle
- Scoping and terms of reference
- Background information
- Management proposals
- Preliminary management direction
- Approved management direction
- Implementation
- Monitoring and assessing management direction
- Adjusting management direction
- Return to scoping and terms of reference
- Adjusting management direction
- Monitoring and assessing management direction
- Implementation
- Approved management direction
- Preliminary management direction
- Management proposals
- Background information
Aboriginal consultation
The Crown has a duty to consult Aboriginal communities where an action or decision could affect established or asserted Aboriginal and treaty rights. This may include development or establishment of new policy, if that policy may affect established or asserted treaty or Aboriginal rights.
Planning for protected areas takes into account the interest and rights of Aboriginal peoples. Aboriginal traditional knowledge is considered in the management direction for protected areas where provided.
Public consultation
Public consultation gives the public the chance to contribute to management planning decisions and MNR the opportunity to communicate its intentions and decisions. Participation ensures that the public’s concerns and aspirations are heard and taken into account. It also helps MNR to show how public input has influenced decisions and to ensure accountability.
The Learning Place interpretive centre at Petroglyphs Provincial Park where First Nations are engaged in park operations.
Chapter 2: Protecting Ontario’s natural diversity
Protected areas are selected and designed based on ecological, geological and cultural heritage features. Areas with the best examples of a feature or condition are rated provincially significant. Areas with next best examples may be considered regionally or locally significant.
Specific targets have been set for representing terrestrial ecosystems, geological features and aspects of Ontario’s cultural heritage. Selecting a site is guided in part by policy commitments based on park class. The selection of park and conservation reserve sites is based on specific criteria, including representation of the best examples of the natural and cultural heritage of the province. A similar framework for representing Ontario’s aquatic ecosystems has yet to be developed.
2.1 Ecological context
Provincial parks and conservation reserves permanently protect ecosystems, biodiversity and important pieces of Ontario’s natural and cultural heritage. This is achieved by using an ecosystem approach that sets specific targets for representing natural features and establishing various classes of provincial parks.
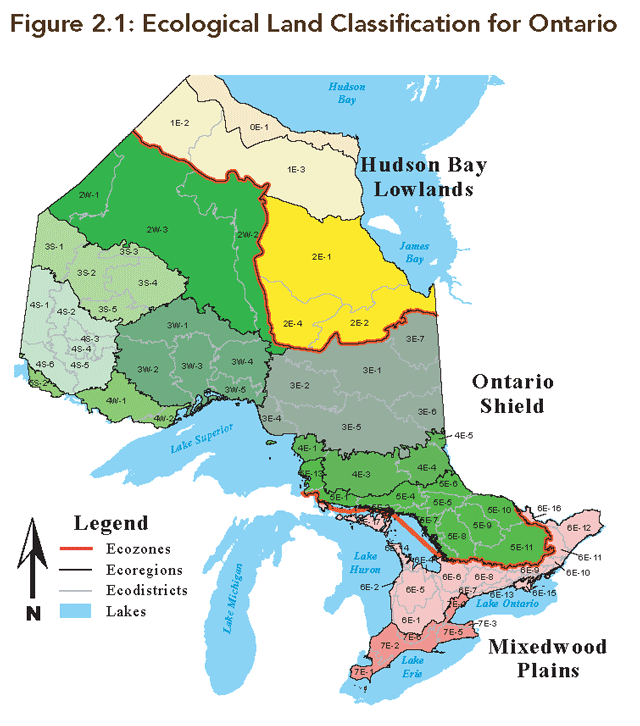
Ontario’s terrestrial ecosystems are organized by a multi- scale ecological land use classification. Factors of this classification system include bedrock geology, climatic variables, surficial geology, physiography and topography. Biological elements (plants and animals) respond to these factors, as well as to soils and microclimate at finer scales.
At the broadest level, the ecosystems include the Hudson Bay Lowlands, Ontario Shield, Mixedwood Plains and Great Lakes ecozones (Figure 2.1). These broad ecozones are further divided into 14 ecoregions and 71 ecodistricts.
An individual area’s diversity, integrity, ecological functions and special features also influence its selection as a potential new provincial park, conservation reserve, or ANSI.
Terrestrial ecosystems
Ecozones are large areas of land and water with a distinctive bedrock domain that differs in origin and chemistry from the bedrock domain immediately beside it. The characteristic bedrock, together with long term continental climatic patterns, has a major influence on ecosystem processes and species that live there. Ecozones are resilient to short-term and medium-term change and respond to global or continental cycles operating at thousands to millions of years.
Ecoregions are unique areas of land and water nested within an ecozone that are defined by a characteristic climate range and pattern, including temperature, precipitation and humidity. The climate within an ecoregion has an influence on the vegetation types, soil formations and other ecosystem processes and associated species that live there.
Ecodistricts are areas of land and water contained within an ecoregion that are defined by characteristic physical features, including bedrock and/or surficial geological features and topography. These physical features significantly influence successional pathways, patterns of species associations and habitats. Local climate patterns, such as lake effect snowfall area, characterize ecodistricts.
2.2 Ecozones of Ontario
Hudson Bay Lowlands
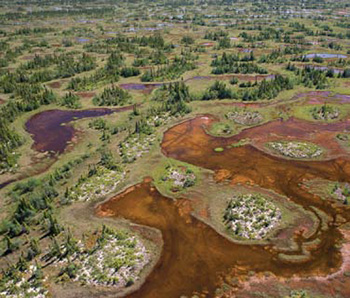
Photo: Sam Brinker
The Hudson Bay Lowlands Ecozone encompasses about one quarter the area of Ontario, between the northern edge of the Canadian Shield and the Hudson and James Bay coasts. Existing protected areas make up over 2.4 million hectares, which is about 10 per cent of the total area of the ecozone (Table 2.1).
Sedimentary rocks from the Palaeozoic and Mesozoic eras lie under the Hudson Bay Lowlands. In the last two million years, glaciers laid down sediments and deposited a thin layer of clay and till soils, eskers and lake and marine sediments. More recently, rivers flowing north into Hudson and James Bays have cut deep channels through the bedrock and the surface deposits.
This ecozone includes one of the world’s largest wetlands. Its coastal salt-marshes and mudflats provide important bird nesting areas. Ontario’s only examples of sub-arctic tundra are found near the Hudson Bay coast. The extensive wetlands in the Hudson Bay Lowlands store large amounts of carbon in their soils and provide habitat for several species at risk.
Some of the animals found in this area include woodland caribou, moose, black bear, American marten, sandhill crane, solitary sandpiper, blackpoll warbler, Arctic fox and snow goose. Polar bear inhabit coastal areas during the ice-free period from late spring to early fall. Beluga whale and walrus are often found at the mouths of some rivers and in waters next to the ecozone.
The Hudson Bay Lowlands Ecozone is home to fewer than 5,000 people, most of whom are Aboriginal peoples. Although the coast and waterways are regularly used, most of the landscape is undeveloped. Human activities include hunting, trapping, fishing, tourism, mineral exploration and mining, and some hydro-electric development.
Ontario Shield
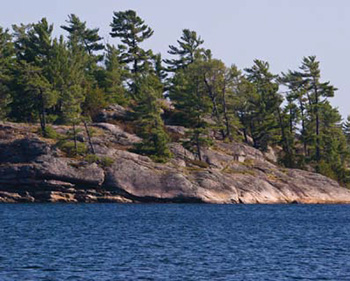
Photo: Jake Hojberg
The Ontario Shield Ecozone is located on the Canadian Shield and is Ontario’s largest ecozone. It is bounded by the Hudson Bay Lowlands and the Mixedwood Plains. Protected areas account for 7.1 million hectares, just under 10 per cent of the total area of the ecozone.
This ecozone includes ancient Precambrian rocks and Palaeozoic inliers that have been hardened and shaped by forces of nature for more than a billion years. Glaciers have scraped the Shield’s surface, stripping highlands and filling lowlands with till, silts, sands and gravel. This ecozone is filled with varied landforms including eskers, moraines, abandoned shorelines and aquatic features like countless lakes, rivers, streams, ponds and wetlands.
The Ontario Shield’s vegetation is diverse. Conifer- dominated boreal forests are found in the northern and central part of the ecozone. Mixed and deciduous forests of tolerant hardwoods are found in the southern portion of the ecozone. These forests are interspersed with rivers, lakes, ponds and wetlands, which cover almost one quarter of the ecozone.
Fires occur frequently in some areas of the Canadian Shield. Frequency, intensity and size of burns vary across the ecozone depending on climate, major forest type and local landscape features. Disturbance from wind and insects also determine the composition, structure and dynamics of forest ecosystems.
Woodland caribou, moose, black bear, gray wolf, eastern wolf, Canada lynx, beaver, American marten, red squirrel, barred owl, boreal owl, white-throated sparrow, pileated woodpecker, blue jay and gray jay are just some of the characteristic animals found in the area. Common fish species include walleye, northern pike, smallmouth bass and yellow perch.
The primary work-related and recreational activities in the ecozone are forestry, mining, resource-based tourism, hunting, trapping and angling. There are also many hydro-electric developments.
Mixedwood Plains
Photo: Phil Kor
The Mixedwood Plains Ecozone is Ontario’s smallest and most highly populated. It includes the Great Lakes-St. Lawrence Lowlands and the Frontenac Axis, the southernmost extension of the Canadian Shield. Regulated protected areas occupy just over 66,000 hectares, or less than one per cent of the total ecozone area. This figure increases to 3.5 per cent when conservation lands and easements held by Conservation Authorities, Nature Conservancy of Canada, Ducks Unlimited, Ontario Nature and affiliated clubs, Ontario Heritage Trust and member associations of the Ontario Land Trust Alliance are considered.
The ecozone’s underlying bedrock is primarily Palaeozoic age limestone, dolostone, shale and sandstone with outcroppings of Precambrian age granite and marble. The topography includes flat limestone plains, escarpments and deep glacial deposits. The Niagara Escarpment and Oak Ridges Moraine are two of the more well-known landforms in this ecoregion. Other glacial landforms include moraines, spillways, eskers, kames, kettles and drumlins.
The area’s natural vegetation is mostly Great Lakes- St. Lawrence forest characterized by American beech, sugar maple and yellow birch. It also includes the only remnants of Carolinian forests in Canada. The ecozone also supports rare habitats including tallgrass prairies, savannahs and alvars.
This ecozone is the most densely populated area in Canada. Since European contact, many of its natural ecosystems have been converted from forest and wetlands, to human-dominated land uses such as agriculture and settlement.
Despite high rates of conversion of forests and wetlands to agricultural and industrial uses, the Mixedwood Plains is one of the most biologically diverse areas of Canada. Among the characteristic terrestrial species in the ecozone are white-tailed deer, red fox, coyote, raccoon, striped skunk, beaver, eastern gray squirrel, great blue heron, red-tailed hawk, black-capped chickadee, blue jay, American robin, wood thrush, yellow warbler, painted turtle and red-backed salamander. Lakes and rivers here support the highest freshwater fish diversity in Canada. Coastal areas adjacent to the Great Lakes support migrating waterfowl, shorebirds and raptors and provide migration stopover sites for songbirds and monarch butterflies.
About four fifths of Ontario’s species at risk live in the Mixedwood Plains. Invasive species are increasingly problematic, displacing native species and altering structural and functional aspects of natural ecosystems.
| Protected area type/class | Hudson Bay Lowlands No. of protected areas | Hudson Bay Lowlands areas protected (ha) | Ontario Shield No. of protected areas | Ontario Shield areas protected (ha) | Mixedwood plains No. of protected areas | Mixedwood plains areas protected (ha) |
|---|---|---|---|---|---|---|
| Cultural heritage park | 0 | - | 3 | 6,272 | 3 | 463 |
| Natural environment park | 1 | 980 | 63 | 1,441,321 | 19 | 25,391 |
| Nature reserve park | 4 | 74 | 74 | 102,878 | 31 | 11,153 |
| Recreational park | 0 | - | 33 | 31,016 | 32 | 8,465 |
| Waterway park | 5 | 52,360 | 62 | 1,399,909 | 1 | 125 |
| Wilderness park | 2 | 2,358,047 | 7 | 2,466,790 | 0 | - |
| Conservation reserve | 2 | 54,587 | 286 | 1,494,393 | 9 | 2,632 |
| Wilderness area | 2 | 55 | 8 | 744 | 1 | 39 |
| National park | 0 | - | 2 | 190,340 | 3 | 17,820 |
| Total Number/Area Protected |
16 | 2,466,103 | 538 | 7,133,662 | 99 | 66,088 |
| Total Ecozone Area | - | 24,805,210 | - | 68,825,923 | - | 13,926,151 |
| Per cent of Ecozone Protected - 9.9% | - | 9.9% | - | 10.4% | - | 0.5% |
Great Lakes
The Great Lakes are the world’s largest freshwater inland system and hold about 18 per cent of the world’s supply of accessible freshwater.
Geologically, Lakes Huron, Erie and Ontario have a base of glacial till and outwash deposits while Lake Superior flows over volcanic bedrock.
The Great Lakes include about 28,000 km of shoreline (including islands), 5,000 tributaries and 30,000 islands. The islands provide habitat for nesting birds, plants and other land and water species. The variety of depth, climate, location and geological formation all help to sustain a rich diversity of plant and animal species.
The Great Lakes provide a source of water for fisheries, domestic and commercial use. The Great Lakes waterways create a means for transporting commercial goods, recreational opportunities and power for industries.
The Great Lakes were once abundant with native fish species, including deepwater ciscoes, lake herring, lake sturgeon, lake trout and whitefish. Human actions have had an overwhelming impact on the Great Lakes. Aquatic communities have been altered and polluted and now contain many invasive species
In 2007, Canada in co-operation with Ontario, First Nations, local communities and others announced the Lake Superior National Marine Conservation Area. Once the area is regulated and managed, it will help to conserve natural and cultural values for a significant portion of western Lake Superior and adjacent lands.
Protected areas along the Great Lakes coastline have been assigned to the respective terrestrial ecozones (i.e. Mixedwood Plains or Ontario Shield) for analysis and reporting.
2.3 Provincial park class targets
Ontario’s Provincial Park Policy, which provides the goal, objectives and guiding principles, was approved in 1978. The Ontario Provincial Parks: Planning and Management Policies which guides implementation of Ontario’s Provincial Park Policy was initially approved in 1978 and updated in 1992. That document sets specific targets for the number, size and distribution of wilderness, natural environment and waterway classparks within ecoregions and ecodistricts. Wilderness and natural environment class parks protect large pieces of Ontario’s larger ecosystems. Waterway class parks help to link protected areas.
Wilderness class parks
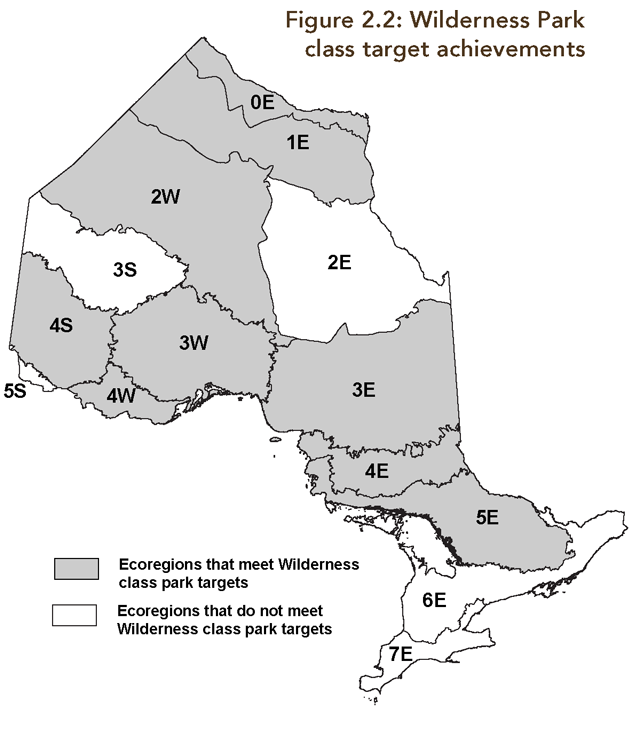
The policy target for wilderness class parks is to establish one park and at least one wilderness zone in each of Ontario’s 14 ecoregions.
In accordance with policy, wilderness parks should average 100,000 hectares and not be less than 50,000 hectares in size. Wilderness zones, in other park classes, should not be less than 2,000 hectares in size and may range up to 50,000 hectares.
Wilderness park class targets have been achieved in nine of 14 ecoregions (Figure 2.2).
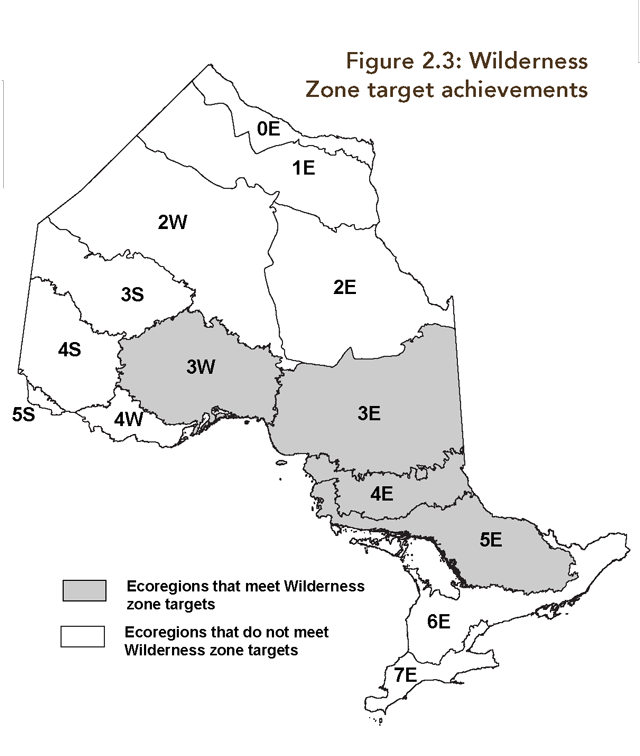
Four of 14 ecoregions include wilderness zones established within other classes of park (Figure 2.3).
Opportunities to make new wilderness zones will be looked at while management direction for natural environment and waterway parks is being developed. Since most land in southern Ontario is privately owned and many areas are developed, opportunities to establish wilderness parks are extremely limited. Ontario’s Far North Land Use Planning Initiative may provide additional opportunities to establish wilderness protected areas in northern Ontario.
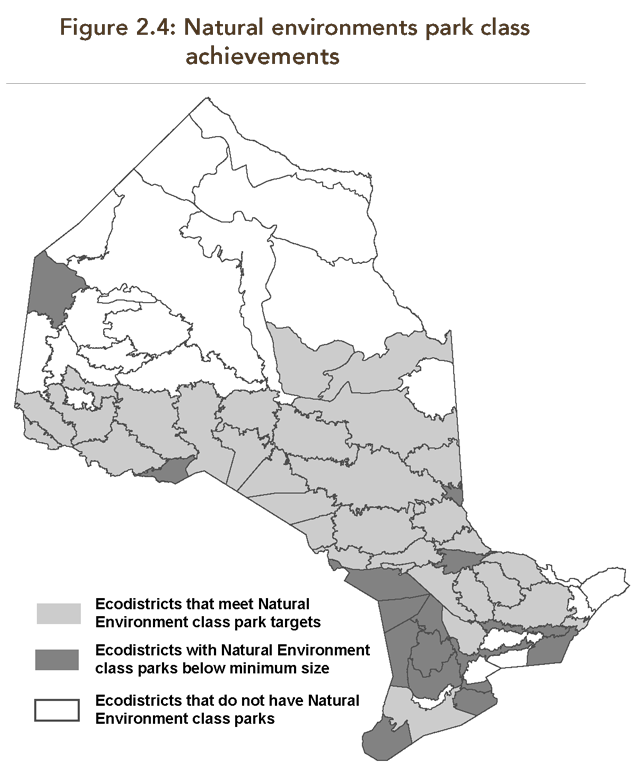
Natural environment class parks
The policy target for natural environment class parks is to establish one natural environment park, no less than 2,000 hectares, in each of Ontario’s 71 ecodistricts. An equivalent sized natural environment zone within a waterway class park or a wilderness class park containing landscapes representative of the ecodistrict may substitute for a natural environment class park.
Natural environment class park targets have been achieved in 46 of 71 ecodistricts. Another 13 ecodistricts have natural environment class parks, but fail to meet the minimum size standard. Gaps in target achievement are found in both southern and northern Ontario (Figure 2.4).
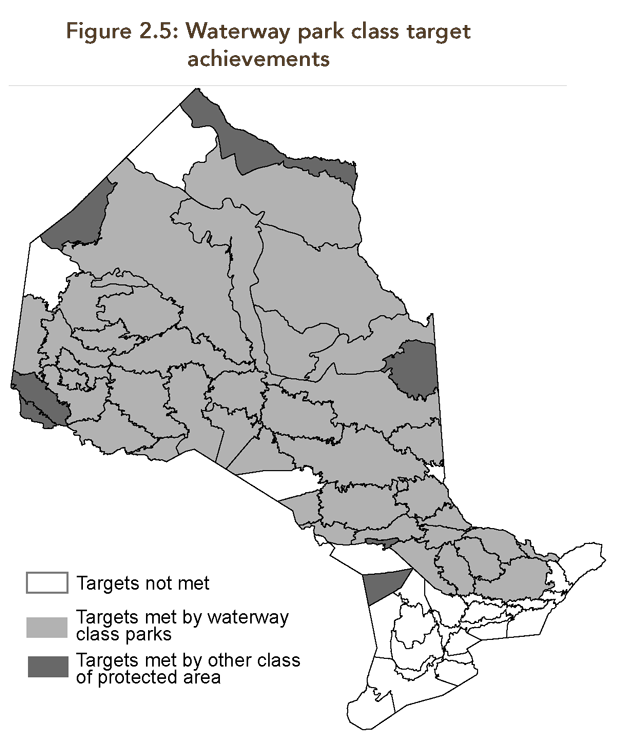
Waterway class parks
The policy target is to establish at least one representative waterway class park, or an equivalent waterway corridor in each of Ontario’s 71 ecodistricts.
Boundaries should be set back at least 200 meters inland from the high-watermarks of the shorelines of lakes and rivers and should take into account lines of sight, proximity of landforms and ecological integrity.
In some cases, it may not be necessary to establish a new waterway park if major waterway corridors are already present within a wilderness or natural environment park.
Waterway class park targets have been achieved in 47 of 71 ecodistricts. Of these, seven ecodistricts are represented by waterway corridors in other park classes (Figure 2.5).
2.4 Representation targets
Representing Ontario’s natural and cultural heritage diversity, as outlined in the PPCRA, is a cornerstone of the protected area system.
Specific selection criteria, which are similar for both life and earth science features (see Sections 2.5 and 2.6, respectively), are used to select protected areas including provincial parks, conservation reserves and ANSI.
Representation targets for provincial parks, conservation reserves and ANSI have been defined by frameworks for geological and biological conservation. These areas are selected to protect Ontario’s most significant natural features, ecosystems and species and to capture representative conditions.
Nature reserve class parks
Nature reserve class provincial parks are particularly focussed on protecting representative geological and biological features. They have the strictest policies of any category of provincial protected areas to ensure the protection of their features.
Cultural heritage class parks
Cultural heritage class parks are selected to protect elements of our cultural heritage. Representation thresholds for cultural heritage class parks are defined by A Topical Organization of Ontario’s History. Cultural heritage parks and historical zones in other classes of parks represent cultural resources. These areas are managed for interpretive, educational and research activities.
Areas of natural and scientific interest (ANSI)
There are two types of ANSI: earth and life science.
Earth science ANSI represent important examples of the bedrock, fossils and landforms in Ontario and include instances of ongoing geological processes.
Life science ANSI represent significant elements of Ontario’s biodiversity and natural landscapes. They contain relatively undisturbed vegetation and landforms and their associated species and communities.
On private lands, MNR informs landowners of the special features on their properties and provides advice and encouragement to help protect and enhance natural values.
MNR encourages other agencies, such as conservation authorities and municipalities to protect ANSI on their lands as well.
The Conservation Land Tax Incentive Program, for example, provides property tax reductions for landowners who voluntarily protect ANSI on their land.
2.5 Life science representation
Ecological selection criteria
Protected areas are chosen because they include examples of the biodiversity of natural regions.
MNR applies five ecological criteria to guide the selection and design of protected areas: representation, condition, diversity, ecological functions and special features (Table 2.2).
| Criteria | Description |
|---|---|
| Representation | The full range of Ontario’s natural diversity should be identified and protected. The protected areas system should include representative examples of the biodiversity within ecologically defined regions. Examples of biodiversity that are not adequately represented are identified as a gap in representation. |
| Condition | An underlying principle of the protected area system is to secure the best examples of the full range of the natural heritage of Ontario. The ecological condition of a site helps to determine its significance within the ecodistrict. |
| Diversity | This refers to the heterogeneity of landscapes and species within a proposed site. Sites with a greater variety of physical habitats support a wider array of species and ecosystems. |
| Ecological Function | This addresses the ecological role of a site within the surrounding landscape and watershed, and relates directly to persistence of biodiversity. Hydrologic processes and the size, shape and connectivity among protected areas are of particular importance within this criterion. |
| Special Features | This includes populations of species and vegetation communities known to be rare in Ontario, as well as localized habitat features that are important to their persistence. |
The first two criteria, representation and condition, are applied at a landscape level. They help identify areas that contain features representative of Ontario’s terrestrial biodiversity. The remaining three criteria, diversity, ecological functions and special features, are assessed at a site level. These criteria help to distinguish the best examples of representative features and to design functional protected area boundaries that help protect biodiversity.
Only the two landscape-level criteria are addressed in this report.
Representation thresholds
To represent examples of biodiversity throughout Ontario, MNR has established a minimum threshold of at least one per cent or 50 hectares of each naturally occurring landform/vegetation association within each of the 71 ecodistricts. Natural features that are not adequately represented within protected areas are known as gaps in representation.
Provincial significance
The selection criteria used to choose protected areas, including representation, aims to protect the best examples of Ontario’s nature and biodiversity. This includes natural features, species and ecosystems. These best examples are considered to be provincially significant and may be nationally or internationally significant.
Representation achievement
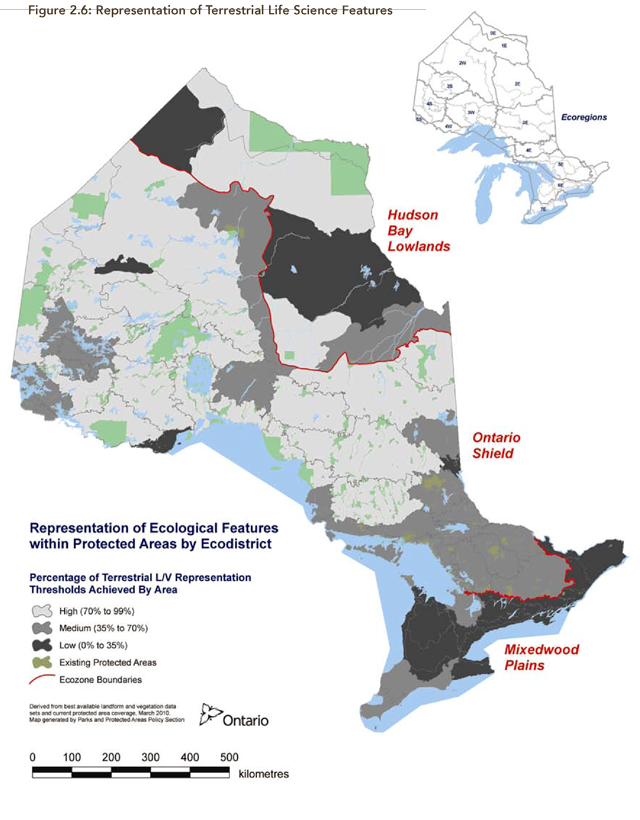
To analyze representation, MNR uses a tool called GapTool along with current data describing landforms, vegetation, ecodistricts and protected areas. These tools help provide up-to-date reporting on the status of representation and evaluate how potential protected areas contribute to ecological representation.
Minimum thresholds for all naturally-occurring landform/ vegetation associations have not yet been achieved for any ecodistrict in the province (Figure 2.6).
In the Hudson Bay Lowlands Ecozone, nearly all of the area protected is within Polar Bear Provincial Park. As a result, terrestrial biodiversity is well represented in two ecodistricts, but the remaining ecodistricts in that ecozone are almost entirely unrepresented. Additional protected areas in this ecozone (and the northern portion of the Ontario Shield) will be identified through First Nation community-led land use planning as part of the Far North Land Use Planning Initiative.
In the Ontario Shield Ecozone, life science representation in protected areas is better distributed, although some areas are still under-represented. The most commonly under-represented landform/vegetation associations are relatively rare or have potential for high commercial value. Ecodistricts that contain large wilderness or natural environment class parks come closest to meeting minimum representation thresholds.
Almost all landform/vegetation associations in the Mixedwood Plains Ecozone are under-represented in provincial parks and conservation reserves. The highest degree of representation in the Mixedwood Plains has been achieved on Manitoulin Island and the Bruce Peninsula.
Most of the land in the Mixedwood Plains Ecozone is privately owned and therefore could not become regulated protected areas unless purchased or secured by some other method. Including privately owned areas devoted to protection, such as ANSI and those held by the Nature Conservancy of Canada and Ontario Nature, would some- what improve representation, although it would still be very low.
Old growth forest
Old growth is part of a dynamic forest ecosystem. Typically, old growth forest is characterized by:
- A complex forest stand structure (e.g. old trees for the ecosite, large tree size and wide spacing, multiple canopy layers and gaps, and rates of change in species composition),
- Large dead standing trees (snags), accumulations of downed woody material, up-turned stumps, root and soil mounds, and accelerating tree mortality,
- Ecosystem functions (e.g. stand productivity, nutrient cycling and wildlife habitat) that are different from earlier stages of forest development.
The Old Growth Policy for Ontario’s Crown Forests gives two objectives for conserving old growth forest in provincial parks and conservation reserves:
- Identify representative amounts of forest communities that should be present in each ecodistrict within provincial parks and conservation reserves within their natural geographic ranges and allow these protected sites to grow naturally.
- Contribute to the maintenance of red pine and white pine, including old growth stands, by protecting and/ or restoring at least one representative forest stand (ecosite) of old growth red pine and white pine in each ecodistrict in provincial parks and conservation reserves that lie within their natural geographic ranges.
The policy further states that old growth will be assessed as part of the life science gap analysis and that gaps should be filled according to the Ontario’s Living Legacy requirements for the completion of Ontario’s system of natural heritage areas.
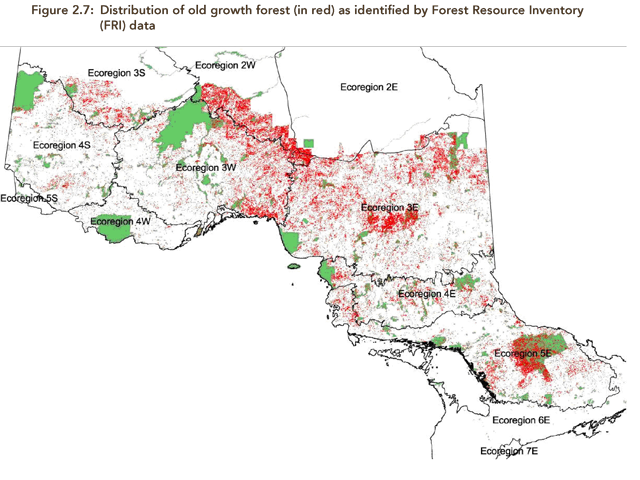
The distribution of old growth forests in Ontario and estimates of old growth conditions in provincial parks and conservation reserves are presented in Table 2.3 and Figure 2.7. These are preliminary estimates based on incomplete Forest Resource Inventory (FRI) data and modelling methodologies.
Very few FRI data are currently available in the Hudson Bay Lowlands Ecozone. In the small area that has FRI data, the dominant forest type is mixed lowland conifers. This area is north of the range for white pine and red pine, and tolerant hardwoods occur only rarely. In this limited area, protected areas have a lower proportion of old growth forest (35 per cent) than the broader landscape (51 per cent).
The Ontario Shield Ecozone contains nearly 99 per cent of the forest that has FRI coverage in the province. Lowland and upland mixed conifer are the dominant forest types. Protected areas contain a greater proportion of old growth forest (20 per cent) than the broader landscape (16 per cent) in every forest type except white birch.
In the small portion of the Mixedwood Plains Ecozone that has FRI data, the dominant forest types are mixed upland conifer and tolerant hardwoods. Overall, 11 per cent of forests in protected areas are in old growth condition, compared to five per cent for the landscape as a whole. Since only a small proportion of protected area forests has FRI data, these conclusions are an estimate.
Table 2.3: Areas of inventoried old growth forest by forest type and ecozone as identified by Forest Resource Inventory (FRI) data
| Forest type | Total forest all (hectares) | Total forest old growth (hectares) | Total forest old growth (%) | Protected area forest all (hectares) | Protected area forest old growth (hectares) | Protected area forest old growth (%) |
|---|---|---|---|---|---|---|
| White Birch | 146 | 55 | 38 | 0 | 0 | 0 |
| Mixed Lowland Conifers | 131,048 | 71,793 | 55 | 9,780 | 2,486 | 25 |
| Mixed Upland Conifers | 45,661 | 23,116 | 51 | 1,445 | 561 | 39 |
| Mixedwood | 7,468 | 1,281 | 17 | 913 | 208 | 23 |
| Jack Pine | 2,752 | 297 | 11 | 421 | 0 | 0 |
| Poplar and Aspen | 4,769 | 2,071 | 43 | 2,133 | 1,880 | 88 |
| White and Red Pine | 0 | 0 | 0 | 0 | 0 | 0 |
| Tolerant Hardwoods | 14 | 0 | 0 | 0 | 0 | 0 |
| Total | 191,858 | 98,613 | 51 | 14,692 | 5,135 | 35 |
| Forest type | Total forest all (hectares) | Total forest old growth (hectares) | Total forest old growth (%) | Protected area forest all (hectares) | Protected area forest old growth (hectares) | Protected area forest old growth (%) |
|---|---|---|---|---|---|---|
| White Birch | 1,966,690 | 258,682 | 13 | 207,992 | 25,943 | 12 |
| Mixed Lowland Conifers | 6,655,448 | 1,717,706 | 26 | 364,602 | 119,648 | 33 |
| Mixed Upland Conifers | 7,578,056 | 1,672,053 | 22 | 505,988 | 134,165 | 27 |
| Mixedwood | 5,279,177 | 458,475 | 9 | 382,575 | 40,932 | 11 |
| Jack Pine | 4,067,480 | 171,154 | 4 | 257,114 | 17,846 | 7 |
| Poplar and Aspen | 2,836,073 | 368,091 | 13 | 156,140 | 35,481 | 23 |
| White and Red Pine | 1,051,190 | 48,402 | 5 | 148,989 | 14,514 | 10 |
| Tolerant Hardwoods | 2,846,896 | 603,332 | 21 | 207,065 | 54,344 | 26 |
| Total | 32,281,010 | 5,297,895 | 16 | 2,230,465 | 442,873 | 20 |
| Forest type | Total forest all (hectares) | Total forest old growth (hectares) | Total forest old growth (%) | Protected area forest all (hectares) | Protected area forest old growth (hectares) | Protected area forest old growth (%) |
|---|---|---|---|---|---|---|
| White Birch | 16,256 | 1,422 | 9 | 414 | 92 | 22 |
| Mixed Lowland Conifers | 4,099 | 111 | 3 | 19 | 0 | 0 |
| Mixed Upland Conifers | 53,969 | 4,535 | 8 | 289 | 29 | 10 |
| Mixedwood | 18,744 | 1,181 | 6 | 122 | 6 | 5 |
| Jack Pine | 447 | 0 | 0 | 63 | 0 | 0 |
| Poplar and Aspen | 11,724 | 536 | 5 | 204 | 0 | 0 |
| White and Red Pine | 12,972 | 49 | 0 | 391 | 0 | 0 |
| Tolerant Hardwoods | 81,690 | 2,949 | 4 | 484 | 39 | 8 |
| Total | 199,901 | 10,783 | 5 | 1,986 | 166 | 8 |
Aquatic representation
Protected areas in Ontario encompass a variety of aquatic habitats. These range from open waters and wetlands on the Great Lakes to inland lakes, rivers, streams and wetlands and finally to tidal marshes, mudflats and open waters of Ontario’s marine coastlines along James and Hudson Bays. These protected aquatic areas account for 6.4 per cent of the aquatic habitat in the province (Table 2.4).
Protected areas can play an important role in maintaining water quality and quantity. The PPCRA has recognized this role by identifying a new aquatic class of provincial parks to be proclaimed at a later date. The objective of this new park class would be to protect representative aquatic ecosystems for their intrinsic and scientific values.
A method of classifying aquatic ecosystems is required to better understand which aquatic values should be protected. An aquatic ecosystem classification system would help us understand and report on freshwater ecosystems. Several aquatic ecosystem classification systems exist, but no system has yet been adopted by the province for planning representation in protected areas.
In 2004, MNR introduced an Ecological Framework for Fisheries Management which takes a landscape, rather than a lake-by-lake approach to fisheries planning, management and monitoring. In 2008, MNR began the Broad-scale Monitoring Program, a long-term effort to monitor the health of lakes and their fisheries across the province, including those within protected areas.
| Aquatic habitat category | Area of habitat category (ha) | Protected area type | Area protected (ha) | % of Habitat category area |
|---|---|---|---|---|
| Water of Hudson – James Bays | 8,667 | Provincial Park | 0 | 0.0 |
| Water of Hudson – James Bays | 8,667 | Conservation Reserve | 0 | 0.0 |
| Water of Hudson – James Bays | 8,667 | Wilderness Area | 2 | <0.1% |
| Water of Hudson – James Bays | 8,667 | All | 2 | <0.1% |
| Intertidal Marsh or Mudflat of Hudson – James Bays | 153,843 | Provincial Park | 31,231 | 20.3 |
| Intertidal Marsh or Mudflat of Hudson – James Bays | 153,843 | Conservation Reserve | 0 | 0.0 |
| Intertidal Marsh or Mudflat of Hudson – James Bays | 153,843 | Wilderness Area | 0 | 0.0 |
| Intertidal Marsh or Mudflat of Hudson – James Bays | 153,843 | All | 31,231 | 20.3 |
| Supertidal Marsh of Hudson- James Bay | 114,939 | Provincial Park | 33,828 | 29.4 |
| Supertidal Marsh of Hudson- James Bay | 114,939 | Conservation Reserve | 0 | 0.0 |
| Supertidal Marsh of Hudson- James Bay | 114,939 | Wilderness Area | 0 | 0.0 |
| Supertidal Marsh of Hudson- James Bay | 114,939 | All | 33,828 | 29.4 |
| Inland Lakes and Rivers | 10,447,311 | Provincial Park | 1,017,626 | 9.7 |
| Inland Lakes and Rivers | 10,447,311 | Conservation Reserve | 91,722 | 0.9 |
| Inland Lakes and Rivers | 10,447,311 | Wilderness Area | 252 | <0.1% |
| Inland Lakes and Rivers | 10,447,311 | National Park | 7,815 | 0.1 |
| Inland Lakes and Rivers | 10,447,311 | All | 1,117,416 | 10.7 |
| Water of Ontario Great Lakes | 8,837,480 | Provincial Park | 68,646 | 0.8 |
| Water of Ontario Great Lakes | 8,837,480 | Conservation Reserve | 3,474 | <0.1% |
| Water of Ontario Great Lakes | 8,837,480 | Wilderness Area | 0 | 0.0 |
| Water of Ontario Great Lakes | 8,837,480 | National Park | 1,563 | <0.1% |
| Water of Ontario Great Lakes | 8,837,480 | All | 73,683 | 0.8 |
| Coastal Wetland of Ontario Great Lakes | 66,896 | Provincial Park | 3,033 | 4.5 |
| Coastal Wetland of Ontario Great Lakes | 66,896 | Conservation Reserve | 1 | <0.1% |
| Coastal Wetland of Ontario Great Lakes | 66,896 | Wilderness Area | 0 | 0.0 |
| Coastal Wetland of Ontario Great Lakes | 66,896 | National Park | 1,325 | 2.0 |
| Coastal Wetland of Ontario Great Lakes | 66,896 | All | 4,359 | 6.5 |
| All Aquatic Components | 19,629,135 | All Protected Areas | 1,260,519 | 6.4 |
Definitions and data sources
- Intertidal Marsh
- Coastal marshes of the Hudson Bay-James Bay Lowlands lying between the coastal mudflats and the supertidal zone. Data Source: MNR Landcover 2000.
- Supertidal Marsh
- Coastal marshes of the Hudson Bay-James Bay Lowlands lying inland of both the coastal mudflats and intertidal marshes, and subject to only exceptionally high tides. Data Source: MNR Landcover 2000.
- Coastal Mudflats
- Unvegetated coastal areas of the Hudson Bay-James Bay Lowlands, partly submerged at high tide. Data Source: MNR Landcover 2000.
- Inland Lakes and Rivers
- Lakes, rivers, streams and creeks within Ontario. All mapped through the Ontario Base Mapping project. Note, this coverage is only comprised of 80 per cent of the province, so hectares are underrepresented. Data Source: MNR Water Segment and Water Line.
- Great Lakes Coastal Wetlands
- A comprehensive Great Lakes Coastal Wetlands Inventory. Built upon the best coastal wetland data currently available and incorporating a standard classification process, the binational inventory provides a standard reference for the Great Lakes wetland community. Data Source: Great Lakes Commission.
2.6 Earth science representation
Some protected areas are selected, designed and managed to conserve earth science features and landscapes for science, education and as a foundation for biodiversity. Identifying representative features helps conserve Ontario’s diverse geological legacy. This has been accomplished by organizing Ontario’s earth science features into 43 distinctive environmental themes related by time, origin and geography.
These 43 themes characterize more than three billion years of geological history. They include the ancient rocks and primitive life forms of the Canadian Shield, the sedimentary rocks and fossils of the Hudson Bay Lowlands and the Great Lakes, and the complex landscapes remaining at the end of the Ice Age glaciation. They also include the dynamic processes that shaped and continue to shape Ontario’s landscapes.
An evaluation called “gap analysis” is used to decide what areas should be protected. This involves describing the earth science diversity of a selected theme, identifying specific protection thresholds and assessing which thresholds have been met within existing protected areas. The resulting “gaps” in representation are then identified and potential protected areas that best illustrate those features are located.
Selection criteria
Earth science gap analysis is guided by five selection criteria: representation, diversity, integrity, special features and life science values (Table 2.5).
| Criteria | Description |
|---|---|
| Representation | A feature that best displays its components or make-up and its environments of formation. A representative feature of the geological record can generally be thought of as one that is typical or normal, or one that shows typical elements of the feature. |
| Special Features | Features that include unique aspects of an individual earth science feature or theme or presents exceptional scientific or educational opportunities. Special features may determine the selection of a preferred site. |
| Diversity | This addresses the variability of earth science features at a site. An area is more desirable when it incorporates a variety of features within a relatively small area. |
| Integrity | This refers to the completeness or condition of the feature within the site and the degree of human-induced impacts on them. This is most applicable to landforms. |
| Life Science Values | This is a consideration when comparing sites with similar earth science features and is most relevant to landscape sites large enough to support significant vegetation stands or communities. |
Representation achievement
Our understanding of Ontario’s geological history and diversity continues to evolve. In addition, an inventory of geological features within recent protected areas identified in Ontario’s Living Legacy Land Use Plan is still underway. Therefore, the current assessment of earth science representation is not entirely complete and the estimates are conservative.
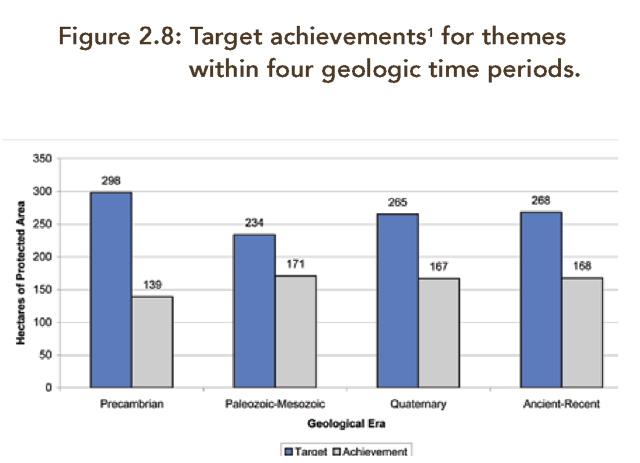
A broad analysis of protected areas using Geology of Ontario maps shows that the identification of Precambrian targets may be close to being complete. Based on this analysis, about 47 per cent of Precambrian earth science representation thresholds have been achieved in protected areas (Figure 2.8). Work is now underway to update Precambrian feature and theme targets, record new information and complete inventories.
About 73 per cent of the representation thresholds for Palaeozoic – Mesozoic geological themes have been achieved. The features associated with these themes include natural outcroppings of bedrock and fossils along rivers, lakes, escarpments and disturbed areas near roads and quarries where they are exposed. ANSI play a significant role in the protection of many of these features.
Overall about 63 per cent of the representation thresholds for Quaternary geological themes have been achieved.
The features of these themes include small outcrops and landforms, large landform complexes and expansive glaciated landscapes. In southern Ontario, ANSI again play a significant role in protecting these features.
There are eight Ancient and Recent Landform themes based upon the classification of geological environments. About 63 per cent of their representation thresholds have been achieved.
2.7 Cultural heritage representation
Ontario’s prehistory reaches back some 13,000 years when the first people migrated northward at the foot of the retreating continental glaciers. A rich archaeological record traces these early settlers, their tools, pottery, trade routes and agricultural achievements. Written history describes the first contact between Aboriginal peoples and Europeans and tells the stories of early fur traders, homesteaders, loggers and miners. It also records the building of railroads, military engagements and provincial politics.
Cultural heritage representation helps identify and protect Ontario’s archaeological and historical features. This is done by organizing historical activities and development, including Aboriginal and European settlement into themes. This topical organization includes 13 themes; each based upon a distinct phase of activity such as mining, logging, fur trading and agriculture and linked to a certain time and place in Ontario’s history (Table 2.6). These themes are further divided into 115 theme segments to reflect the involvement of part of the population in a specific region.
While a comprehensive evaluation has not been completed, more than one third of historical themes and theme segments are found in provincial parks. The Ministry of Culture is developing new standards and guidelines to evaluate provincial properties, including provincial parks and conservation reserves.
| Conceptual area | Historical theme | Theme period | No. of theme segments |
|---|---|---|---|
| Economic and Social | early post-glacial immigrants | 11,000 BC – 5,500 BC | 2 |
| Economic and Social | environmental frontiersmen | 5,500 BC – 200 BC | 2 |
| Economic and Social | indigenous settlers, traders and potters | 1,000 BC – 500 AD | 4 |
| Economic and Social | indigenous peoples’ farming societies | 500 AD – 1600 AD | 4 |
| Economic and Social | northern hunters and anglers | 800 AD – European contact | 4 |
| Economic and Social | post-contact tribes and bands | 1560 – early 19th Century | 6 |
| Economic and Social | fur trade and fur trading communities | 1615 – 1930s | 16 |
| Economic and Social | agriculture and agricultural communities | 1749 – present | 22 |
| Economic and Social | forest industry and forest industry communities | 1809 – present | 16 |
| Economic and Social | mining and mining communities | 1799 – present | 17 |
| Economic and Social | transportation and integration of economies and communities | 1790s – present | 12 |
| Military | military | 1100 - 1871 | 5 |
| Political | political | 1615 - present | 5 |
2.8 Growing protected areas
Interest in protected areas to help stem the loss of natural heritage and biodiversity continues to grow worldwide. Commitments to protect additional areas have been expressed in the United Nations and Canada’s Conventions on Biodiversity. Public opinion polls repeatedly show that Canadians strongly support the creation of a healthy system of protected areas.
Land use decisions made to create new protected areas are often complex. They can provide economic opportunities, while constraining some traditional uses and future development. Landowners, resource users, Aboriginal peoples and resource sector industries may hold different or conflicting views about protected areas. Conservation planning and Aboriginal traditional knowledge can resolve issues and guide decision making.
The protection of Ontario’s natural diversity and cultural heritage is a great responsibility that cannot be achieved by government alone.
Partnering in science
MNR participates in a variety of scientific efforts to choose the best areas for biodiversity protection. For example, the Great Lakes Conservation Blueprint (2005) undertaken jointly by the Nature Conservancy of Canada and MNR, has provided valuable information to assist systematic conservation planning and to inform a priority listing of areas for future acquisition.
Ontario Parks is a founding member of the Centre for Applied Science in Ontario’s Protected Areas (CASIOPA) and its forerunner, the Parks Research Forum of Ontario. The centre is a research association led by the University of Waterloo, Parks Canada and MNR, with advice from several universities and non-governmental organizations. It provides science-based workshops and networking opportunities. It also facilitates social, natural and physical research in support of protected areas management and land use planning. The transfer of knowledge gained from these activities has been most beneficial to systematic conservation planning.
Partnering in Conservation
Particularly in more populated areas, a variety of creative approaches, including partnerships and private land stewardship, are necessary to help protect Ontario’s biodiversity. It is important for government to work closely with local communities, individuals, businesses, Aboriginal peoples, conservation organizations and others to create a better system of protected areas.
Photo: Phil Kor
Since 1970, MNR and the Nature Conservancy of Canada have worked closely with partners and donors to secure natural areas. In 1996, a formal partnership called Legacy 2000 was established to secure examples of Ontario’s natural diversity. Between 1996 and 2006, this partnership secured more than 17,000 hectares of ecologically significant land valued at more than $20 million.
In 2006, MNR and the Nature Conservancy entered into a new partnership to secure private lands. As part of the Greenlands agreement, MNR, along with other funding sources such as a Canada-Ontario Agreement Respecting the Great Lakes Ecosystem Basin, provides funds to acquire privately owned lands. The Nature Conservancy provides expertise to secure and steward new areas. MNR assesses the natural values of potential properties based on ecological and geological selection criteria and informed by the Great Lakes Conservation Blueprint and other scientific efforts. Under this new partnership agreement, more than 200 hectares of ecologically significant land valued at nearly $0.9 million has been secured and added to the protected area system since 2006.
MNR also secures land through donations and government funding. Since 2006, 17 hectares of high priority conservation lands valued at more than $1.3 million have been added to the protected areas system in this way.
MNR continues to conserve biodiversity and ecologically sensitive lands in the southern landscape, working with others to secure lands through purchase, long-term lease, conservation easements and donations. MNR participates in strategic initiatives such as the Lake Superior National Marine Conservation Area, Algonquin to Adirondacks, Heart of the Continent and Greenways Strategy. Heart of the Continent, for exam ple, is a partnership between Ontario and Minnesota to improve protected area coordination in the Quetico Provincial Park – Boundary Waters Area.
Photo: Chris Martin
MNR also continues to support the efforts of municipalities and conservation authorities in protecting natural heritage through zoning and land management practices.
In the central part of Ontario licensed for forest management, the 1999 Ontario’s Living Legacy Land Use Strategy and the related Ontario Forest Accord provide a framework to create new provincial parks and conservation reserves. The Ontario Forest Accord is an agreement between government, the forest industry and non-government organizations that supports the growth of the protected area system beyond the 12 per cent level achieved in the land use strategy.
In 2003, Pikangikum First Nation, in partnership with MNR, began a community-based land use planning initiative. Pikangikum Elders provided guidance and indigenous knowledge throughout the process. Keeping the Land – The Whitefeather Forest Land Use Strategy dedicated over 400,000 hectares of spectacular landscape and 400 kilometres of culturally significant waterways to the Ontario protected area system. These areas will be managed through a new partnership arrangement between Pikangikum First Nation and MNR.
In October 2009, the Ontario government and Pikangikum First Nation celebrated their partnership by signing a terms of reference that will support protected areas and forest management planning in the Whitefeather Forest.
| Category | Number of Sites | Area (ha) |
|---|---|---|
| newly regulated conservation reserves | 45 | 450,156 |
| newly regulated provincial parks | 14 | 52,384 |
| additions to existing provincial parks | 16 | 169,677 |
| Totals | 75 | 672,217 |
Except for Keeping the Land – Whitefeather Forest Land Use Strategy, systematic conservation (land use) planning in the Far North of Ontario has not yet occurred. Some ecodistricts in the Hudson Bay Lowlands and northern boreal region have no protected areas. Ontario’s Far North Land Use Planning Initiative represents an opportunity to for First Nations and Ontario to work together to create a new protected area framework that will result in the protection of at least 225,000 square kilometres of the Far North, while allowing for areas of sustainable economic development.
Photo: Lee Gerrish
The Far North Act will enable a community-based land use planning process that provides First Nations a leadership role in determining areas to be protected. Both Aboriginal traditional knowledge and western science will make essential contributions to these plans. MNR is currently conducting surveys of biodiversity including woodland caribou and other natural values in co-operation with Far North First Nations.
Regulating new protected areas
New protected areas that are identified through land use planning or secured for the purposes of protection may be regulated under the PPCRA. The regulation process involves consultation with affected landowners, detailed mapping and public notification. During 2005-2009, MNR regulated 59 new provincial parks and conservation reserves, and also regulated 16 additions to existing provincial parks (Table 2.7).
In the Far North, as new areas are identified for protection through community based land use plans, the protected areas may be designated under the Far North Act or the First Nations and Ontario may decide together to have the areas regulated through the Far North Act or the PPCRA.
Chapter 3: Ecological integrity
Ontario has a long history of protecting and managing natural landscapes for posterity and for recreation. Change to the protected area system has been enabled by legislation and associated regulations, developed based on specific selection criteria and planned and managed according to specific policies and guidelines. These tools help choose the best representative examples available and maintain the condition or integrity of those protected areas over time.
3.1 Monitoring framework
In order to report on the ecological condition of Ontario’s regulated protected areas, the following questions need to be addressed:
What is ecological integrity?
What factors contribute to its maintenance? What pressures affect ecological integrity?
What is the status of natural ecological processes?
To help answer these questions, MNR has developed a monitoring framework for protected areas. This framework is based on three fundamental principles and a series of criteria, indicators and measures (Figure 3.1).

If you need alternate formats or communication supports, please contact us
| Principles | Criteria |
|---|---|
| Ecological integrity |
|
| Social Well-being |
|
| Economic Health |
|
Based on this monitoring framework, MNR has collected data, conducted analyses and drafted reports for each measure. This information supports planning and management of individual protected areas. This State of Ontario’s Protected Areas Report provides provincial summaries based on these more detailed analyses and reports. It is based on the most accessible, relevant data available as of 2009.
3.2 Ecological integrity
Ecological integrity is not a new concept. In the last two decades, however, it has become the guiding principle for managing national parks and some other protected areas across Canada. The PPCRA clearly identifies the maintenance of ecological integrity as the first priority when planning and managing regulated protected areas.
Ecological integrity refers to a condition in which biotic and abiotic components of ecosystems and the composition and abundance of native species and biological communities are characteristic for their natural regions and rates of change and ecosystem processes are unimpeded.
Provincial Parks and Conservation Reserves Act, 2006
Ecological integrity is a complex human concept about the way things should exist in nature. The definition can be interpreted based on the three fundamental aspects of ecosystems. These include composition (abundance of native species and communities); structure (biotic and abiotic (i.e. living and non- living) components); and function (ecosystem processes and rates of change).
The concept of ecological integrity holds to the idea that aspects of composition and structure should be characteristic of their natural regions and that ecosystem functions should be allowed to proceed normally.
Ecological integrity:
Ecosystems occur at many scales and are far too complex to be completely understood. As a result, ecological integrity cannot be measured directly and only some aspects of ecosystems can be monitored. Despite these difficulties, ecological integrity is a key part of the planning and management process (Figure 3.2). MNR continues to monitor ecological change, minimize detrimental impacts and restore the integrity of ecosystems within protected areas.
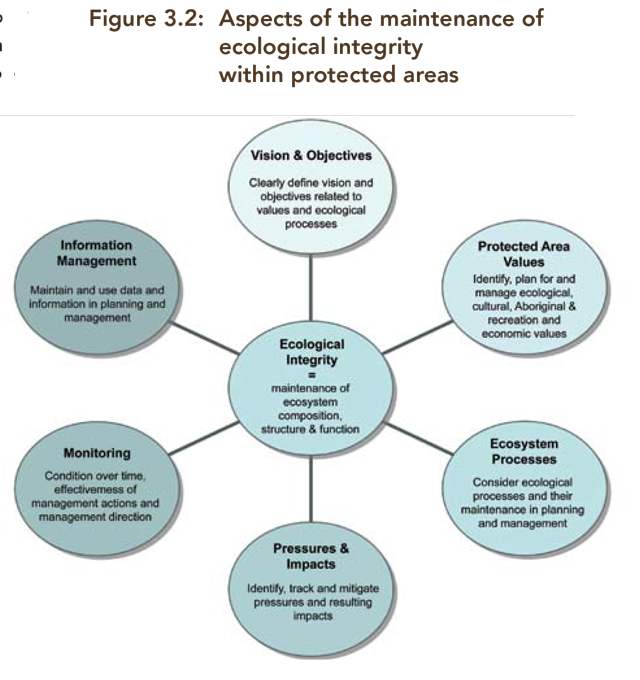
If you need alternate formats or communication supports, please contact us
3.3 Contributing factors
A well designed system of protected areas can greatly enhance ecological integrity. For example, while all protected areas are beneficial, larger areas are better than smaller ones. A boundary that takes in an entire ecological feature is better than a boundary that is purely administrative. Natural areas with ecological linkages are better than those isolated in the broader landscape (Figure 3.3).
When these and other principles of conservation biology are used with existing selection criteria and management direction, they can make a significant contribution to the maintenance of ecological integrity over time.
Location is vital
Protected areas should be strategically located to capture the spatial relationships of major physiographic and ecological regions. Protected areas tend to protect the greatest diversity of ecosystems and geological themes when they are distributed throughout Ontario’s ecoregions and ecodistricts.
Size is a factor
Large areas provide the foundation for an ecologically sustainable system of regulated protected areas. They generally contain a greater diversity of species and habitats and can support large populations. Large areas can also include the entire home range for species that travel over large distances. Large populations are less vulnerable to becoming locally extinct.
Large areas are also more likely to retain their natural landscapes and processes and are usually more resilient to the impacts of human activities and natural disturbances. Minimum size standards have been established in Ontario for wilderness and natural environment class parks.
While larger areas are desirable, clusters of smaller areas can also be valuable in conserving species with low mobility or dispersal, or particularly vulnerable or critical features. They also provide patches of habitat for migration and breeding by species that move throughout the landscape.
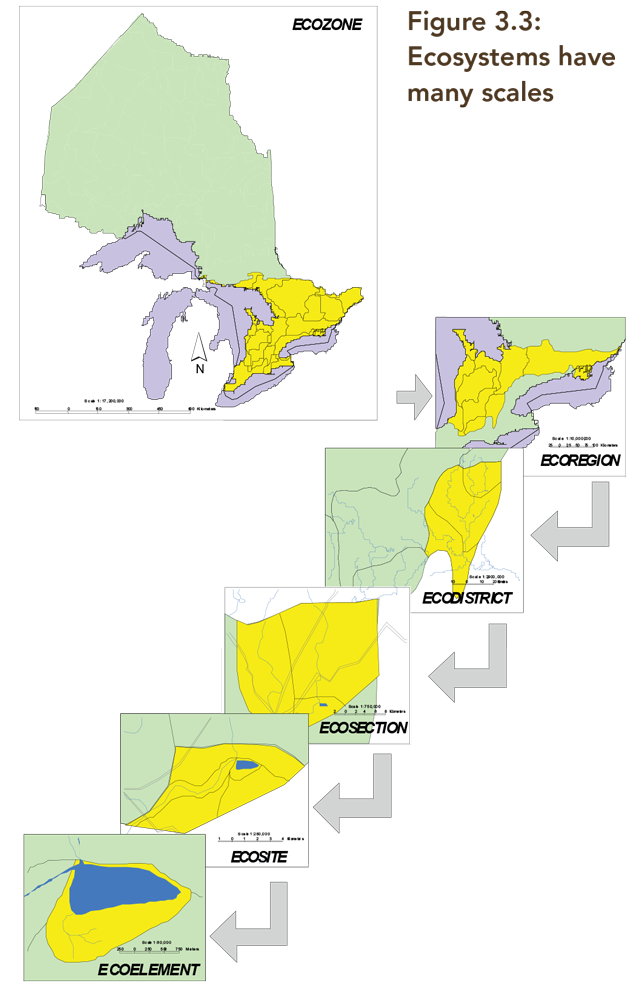
Shape is critical
Protected areas should have well defined ecological boundaries. When possible, straight-line boundaries should be redefined using natural features that enhance ecological integrity. Generally, compact shapes are better than long narrow shapes. Compact shapes have less “edge” habitat, so they can maximize the amount of undisturbed habitat. They can also minimize the impacts of exposure to sun and wind, changes in temperature and humidity, spread of alien species and human disturbances.
Linkages are essential
Natural linkages connecting areas should be maintained and restored to conserve biodiversity. These linkages allow the physical movement of species and genetic interchange among populations. Waterway class parks and other corridors like the Niagara Escarpment Parks and Open Space System provide such linkages. Similarly, lands and waters between protected areas managed in an ecologically sustainable manner are vital to the maintenance of ecological integrity.
3.4 Known pressures
Ontario’s regulated protected areas face many natural and human-induced pressures. These pressures can affect ecosystems of all sizes and shapes. They can take place slowly over long periods of time or occur suddenly as part of a single catastrophic event.
Ontario Parks and the broader MNR are responsible for measuring changes in protected areas and determining whether ecological integrity is being maintained or is in need of restoration.
On a provincial scale, climate change and the long-range transport of pollutants place enormous pressures on protected areas and the broader landscape. At regional and local scales, changes in land cover adjacent to regulated protected areas cause internal stress and a loss of integrity. Pressures from outdoor recreation and park development also have an impact. Each of these pressures can affect biodiversity and ecological integrity.
Climate change
Greenhouse gases affect the climate by increasing temperatures, altering precipitation patterns and increasing severe weather. Warming across Canada is twice the global average.
Studies predict significant warming for Ontario in the 21st Century. Temperatures may rise by 6 to 7o ℃ in the Hudson Bay Lowlands and by 5 to 6 ℃ in southern Ontario.
In 2006, MNR released a framework for addressing climate change based on three themes: understand climate change, mitigate the impacts and help the people of Ontario adapt.
MNR has implemented an adaptive approach to address climate change. This involves gathering information and understanding the reasons for change. It also involves developing and implementing measures to lessen impacts and integrating these measures into protected areas planning, policy and legislation.
Ontario Parks has taken actions to help reduce factors that contribute to climate change. In operating parks, these actions include the use of energy efficient buildings, comfort stations and vehicles; site planning that encourages the use of walking and bicycling, aggressive waste management programs and public education.
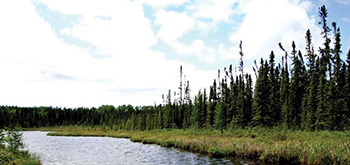
Photo: Laura Myers
A 2007 MNR research report
In 2008, the University of Waterloo completed a survey in partnership with Ontario Parks, Parks Canada, environmental non-governmental organizations and various universities. The study identified options to help the protected areas program adapt to climate change. The study has significantly advanced the thinking around climate change adaptation for protected areas in Ontario and provides a solid foundation for further action.
Pollution
Pollutants from industry, agriculture and cities enter into the environment through air, water and soil. Once in the environment, pollutants can travel long distances and spread out over large areas. Pollution affects the whole landscape, both inside and outside protected areas.
Air pollution
The Ontario Ministry of the Environment (MOE) monitors and reports on two aspects of air pollution – air quality and smog.
Air quality is a measure of the number of days that air quality has reached or exceeded established thresholds. Six key pollutants are monitored: sulphur dioxide, ozone, nitrogen dioxide, total reduced sulphur compounds, carbon monoxide and fine particulate matter.
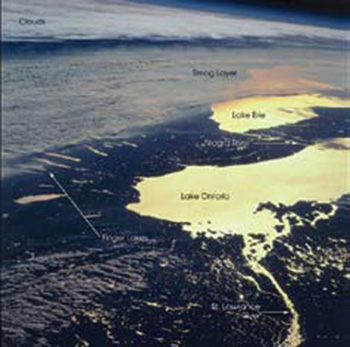
Photo: courtesy of nasaimages.org
Smog occurs when high concentrations of toxins, chemicals and particulates in the atmosphere combine with unfavourable weather conditions. “Smog day” advisories are issued when high levels of pollutants are sustained by regional weather patterns.
While air quality can vary greatly year-to-year, southern Ontario reports more poor air quality than the central part of the province. The number of smog days predicted in the south was 1.5 to 2.5 times greater than those predicted in central Ontario. A survey of staff from 214 parks across the province (2002-08) indicated that staff felt air pollution was having an impact on the integrity of the park in seven per cent of cases.
Research is needed to better understand how air pollution affects the natural functioning of flora and fauna. In particular, sulphur dioxide and ground level ozone can each have a devastating effect on plants. Poor air quality also can predispose plants to injury by other more common stresses.
Water pollution
Ontario’s regulated protected areas include countless lakes, rivers and wetlands. Headwater streams link surrounding watersheds through the transport of water, organic matter, nutrients and sediments. The natural vegetation in these watersheds contributes to the maintenance of stream conditions, including water quality and habitat for coldwater fish and invertebrates. It also contributes to the maintenance of habitat of fishes and invertebrates that are not found in coldwater communities, many of which are sensitive to habitat change associated with vegetation removal.
MNR works closely with the MOE to manage water resources. Protected areas represent about nine per cent of the area of the province. Nearly eight per cent of all lakes sampled in Ontario for water quality by the MOE are in regulated protected areas.
As required by the Ontario Clean Water Act, 2006 Ontario Parks provides safe drinking water and effective waste water systems for park visitors. Drinking water in operating provincial parks is either treated on site or supplied by local municipalities. Wastewater treatment systems include earth privies, vault privies, holding tanks, septic systems, lagoons and municipal treatment.
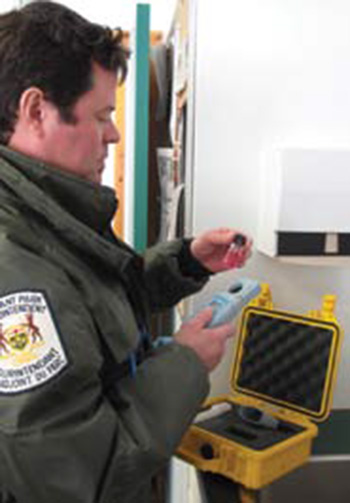
Photo: Chuck Miller
These activities conform to regulations established by the Ontario Ministry of Health and Long-Term Care for the provision of drinking water and regulations established by the MOE for the taking of water and the treatment of wastewater.
Beaches are monitored routinely for public health and safety in co-operation with local Health Units.
To reduce water consumption Ontario Parks has installed low-volume toilets, low-flow shower heads, shower timers and is investigating the re-use of in-park grey-water in toilet systems. To reduce energy consumption, Ontario Parks is installing solar water heaters where feasible.
In a survey, park staff indicated that they felt there were concerns regarding the quality of surface water in 17 per cent of the 214 parks surveyed.
Compatible research into the impacts of water pollution on ecosystems is encouraged.
Acid rain
Acid rain occurs when sulphur dioxide and nitrogen oxide produced by burning fossil fuels enter the atmosphere and are transformed into sulphuric acid, ammonium nitrate and nitric acid. These corrosive compounds and smog can be transported great distances. Acid rain reduces biodiversity and significantly affects rivers, lakes, soils, vegetation, human health and infrastructure.
Acid rain can be accompanied by other pollutants including mercury, aluminum, manganese and zinc. In fish eating birds such as the common loon, mercury can reduce breeding success and chick survival.
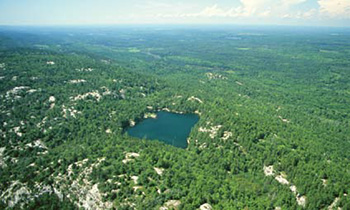
Photo: Phil Kor
An estimated 100,000 lakes in eastern Canada have been affected by acid rain. About 7,000 lakes in the Sudbury region alone have been heavily affected by acid rain. In the 1970s, water chemistry monitoring and plankton studies were initiated and recovery plans developed for these lakes, including those within Killarney Provincial Park. Much of this work was accomplished through a partnership between Laurentian University, industry and the Ontario and Canadian governments. Between 1980 and 2001, there was a 63 per cent reduction in sulphur emissions in eastern Canada. As a result, lakes in the Sudbury region, including Killarney Provincial Park, are beginning to recover.
Disruption of natural processes
The forces of nature shape ecosystems and are essential for the maintenance of ecological integrity. Water is vital to all ecosystems. Winds help shape forest structure and assist pollination and seed dispersal. Fire influences forests, savannah and prairie ecosystems. Insects and disease affect forest composition and structure. Plants and animals, especially humans, can profoundly affect natural processes and ecosystems.
Natural processes include activities that we term disturbances (e.g. fire). In some cases, disturbances can alter the availability of resources and disrupt natural processes and interactions between species. Disturbances vary in frequency, duration, size, intensity and proximity. All are ecologically important. Generally, large scale disturbances occur less frequently than small scale disturbances. As disturbance is a natural part of ecosystem function, allowing it to occur provides managers with a powerful tool to help conserve biodiversity and maintain ecological integrity.
Forest fire management
Fire is a natural disturbance that drives new growth in forests, prairies and savannahs. It results in many unique ecological processes that cannot be fully duplicated by other natural or human caused disturbances. Fire helps in the recycling of nutrients as it burns the top organic layer of the soil. It helps to control insect and disease populations. Fire also creates a variety of plant communities that are at different ages and species composition helping to maintain and enhance the diversity of species across the landscape.
The ecological imperative to maintain fire on the landscape must be balanced with the need to protect public health and safety and economic values such as infrastructure and industrial wood supplies.
At the landscape level, fire maintains a shifting mosaic of forest ecosystems. Suppressing fire increases the area of older forest stages and the amount of flammable material found within them. Over time this can alter ecosystems by creating an unnatural age distribution and by increasing the potential for large, intense fires.
Fire regimes vary greatly throughout Ontario. In the Hudson Bay Lowlands, lightning-caused fires occur frequently and are usually associated with extreme weather events which cause the peatlands to dry out enough to burn. Fires are smaller and less frequent along the Hudson and James Bay coasts, which are more moist than areas further inland.
Fire is a major agent of disturbance in the Ontario Shield Ecozone, which includes many ecosystems adapted to fire.
Historically, the Mixedwood Plains Ecozone experienced frequent low intensity surface fires, punctuated with infrequent stand-replacing fires. The remaining natural areas are generally too small to carry large fires.
The Forest Fire Management Strategy for Ontario provides for the protection of human values, while realizing ecological benefits of fire. The strategy divides the province into six fire management zones, including a Parks Fire Management Zone (Figure 3.4). The management of each fire zone is based on the characteristics of the land base and the level of protection needed to protect human values.
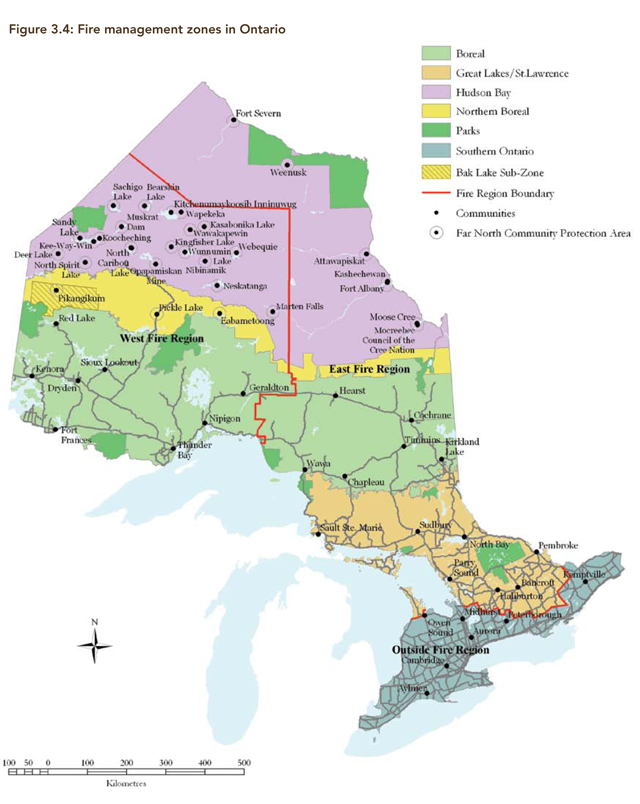
Table 3.1: Total area of prescribed burns conducted per year in protected areas for maintenance of native prairie and savannah ecosystems
(Converted to list)
- Year: Area (ha)
- 2001:339
- 2002:0
- 2003:182
- 2004:259
- 2005:214
- 2006:126
- 2007:89
- 2008:129
- 2009:25
- Total:1363
Fires occurring north of the limit of commercial forestry are usually monitored and left to burn, unless communities or other values are threatened. In areas of commercial forestry, the response is to minimize the area burned in order to protect wood supply, communities and infrastructure. Fires in southern Ontario are normally suppressed due to the intensive settlement and development.
The Parks Fire Management Zone includes the 10 largest provincial parks and Pukaskwa National Park. Fire management plans must be developed for these parks to direct how fire will be managed to achieve ecological objectives. Unless direction is provided by a fire management plan, regulated protected areas are managed according to the surrounding fire management zone. Fire management plans are based on the broad direction provided by protected area management direction and MNR Fire Management Policy for Provincial Parks and Conservation Reserves. These plans identify objectives and actions to achieve ecological benefits from fire, while protecting public health and safety.
Between 2001 and 2009, seven fire response plans were developed for protected areas in northwest Ontario. These plans detail how MNR will respond to natural and human caused fires. In addition, a new fire management plan for Quetico Provincial Park was approved in 2009 to guide the use of fire on the landscape and response to forest fires. During the same period, MNR authorized and conducted prescribed burns at Rondeau, The Pinery, Turkey Point, Beattie Pinery, Peters Woods and Ojibway Prairie Provincial Parks in southern Ontario (Table 3.1). These recurring fires help to restore and maintain native prairie and savannah ecosystems.
Hydrological function
Lakes, rivers and wetlands form an important part of Ontario’s regulated protected area system. They provide clean water, habitat for countless species and outstanding outdoor recreation opportunities. Natural hydrological function, however, can sometimes be altered by development.
Dams regulate stream flows, control flooding, enable power generation and conserve water for recreation, agriculture and industry. Water crossings provide access and facilitate the flow of traffic and transportation of goods and services.
However, dams and water crossings can pose a threat to ecological integrity. They can interrupt the natural flow of water, act as a barrier to the movement of species and degrade natural habitat by increasing deposition upstream and erosion downstream, and altering thermal regimes.
The PPCRA generally prohibits the generation of electricity in protected areas except in the following four situations:
- Facilities that existed prior to the proclamation of the act;
- Sites identified in an MNR land use plan prior to the protected area being regulated;
- For use within communities not connected to the electrical grid controlled by the Independent Electricity System Operator; or
- For use for provincial park or conservation reserve purposes.
| Structure | Number in provincial parks | Number in conservation reserves | Total in protected areas |
|---|---|---|---|
| Dams – water level control | 75 | 7 | 82 |
| Dams – electricity generation | 21 | 10 | 31 |
| Water crossings – rail | 138 | 1 | 139 |
| Water crossings – road | 2,027 | 568 | 2,595 |
| All dams and water crossings | 2,261 | 586 | 2,847 |
A total of 113 of Ontario’s 2,500 dams are found in regulated protected areas. Eighty-two of these dams are managed by MNR to regulate water levels. The remaining 31 structures are associated with hydro-electricity generation, as provided for under the exceptions in the PPCRA. All of these structures, except one generating station (Umbata Falls), were in existence prior to each provincial park or conservation reserve being established. (Table 3.2).
There are more than 223,000 water crossings in Ontario. This includes about 11,000 rail and 212,000 road crossings. A total of 2,734 of these crossings, including 139 rail and 2,595 road crossings, are found in regulated protected areas.
Guidelines for the construction of water crossings have been developed to ensure that structures are safe and environmental impacts are minimized. The construction of all MNR-related water crossings in regulated and recommended protected areas are subject to the Class EA-PPCR. Non-MNR crossings (e.g. public highways) are subject to their own environmental assessment procedures.
Land use
Protected areas can become ecologically isolated if the broader landscape is changed from a natural to a non- natural state (e.g. agriculture and urban development). This change or loss of habitat can damage biodiversity. It can cause the decline or loss of species that depend on forests, wetlands and other natural habitats. It can also affect the abundance, movement and life cycle of wildlife.
The impacts of breaking up natural cover into patches of habitat (fragmentation) become more severe as the distance between patches of natural vegetation cover increases. The impacts also worsen when the total amount of natural cover of the landscape drops to low levels. Protected areas help to lessen these impacts by maintaining the composition of natural cover, protecting core areas with habitat of adequate size and quality and through the maintenance of connectivity between protected areas.
Composition
The amount and composition of natural cover across the landscape provides insight into the ability of species, individuals and genetic materials to flow freely into, out of and between regulated protected areas.
Generally, natural cover declines and areas permanently altered by human activity (agriculture, mining, urban and industrial areas, roads) increase from north to south. The Hudson Bay Lowlands and Ontario Shield Ecozones are dominated by natural cover with only small amounts of disturbance and human-altered cover. In contrast, the Mixedwood Plains Ecozone has retained only about one quarter of its natural cover. This small amount of natural cover threatens biodiversity and increases the value of regulated protected areas (Figure 3.5).
In the Hudson Bay Lowlands and Ontario Shield Ecozones, natural cover in regulated protected areas is similar to that found in surrounding areas. In the Mixedwood Plains Ecozone, the composition of regulated protected areas is more than one half natural cover. This is twice the value of the landscape as a whole.
Regardless of the ecozone, this natural cover helps to buffer protected areas from external pressures and enhances habitat linkages to the broader landscape. However, it should be noted that in the Ontario Shield and Hudson Bay Lowlands ecozones there is a greater proportion of human-altered cover adjacent to protected areas than in the landscape as a whole.
Core area
Core areas are natural areas minimally affected by the fragmentation of natural cover. They include all interior habitats at least 200 metres from land cover permanently altered by human activities. Interior habitats are less likely to be affected by ecological changes along the edges of natural cover. Generally, core areas have greater natural diversity and are more resistant to nest predation and parasitism, and colonization by alien species. While many species require core areas to thrive, the size of area required varies from species to species.
Core area within protected areas is influenced by the size and shape of the protected area and the amount of development both inside and adjacent to its boundary. Generally, total core area increases with protected area size (Figure 3.6). Protected areas less than 1,000 hectares in size average 51 per cent core area, while those over 1,000 hectares average 79 per cent core area. Ontario’s 27 largest protected areas, all over 50,000 hectares, average 91 per cent core area.
Core area size varies north to south with the highest proportions in the Hudson Bay Lowlands and lowest in the Mixedwood Plains (see Table 3.3). Within provincial parks, the proportion of core area in operating parks is about half that of non-operating parks. Non-operating parks have minimal human intervention (i.e. development) and use compared to operating parks.
Recreation class parks have the lowest percentage of core area. These parks tend to be small in size and include infrastructure to provide a variety of outdoor recreational activities and host large numbers of visitors.
Natural environment and waterway class parks, as well as conservation reserves average 59 per cent, 76 per cent and 78 per cent core areas, respectively. These percentages are generally higher in the north and lower in the south.
Nature reserve class parks average 58 per cent core area. The relatively low core area of nature reserves is due to the small size of these parks which can result in greater impact inside the park from outside influences. Fortunately the majority of nature reserves are within the Hudson Bay Lowlands and Ontario Shield ecozones, where levels of development are lower.
Wilderness class parks have the highest proportion of core area at 96 per cent. This is expected due to their large sizes, remote locations and policies that limit use and development.
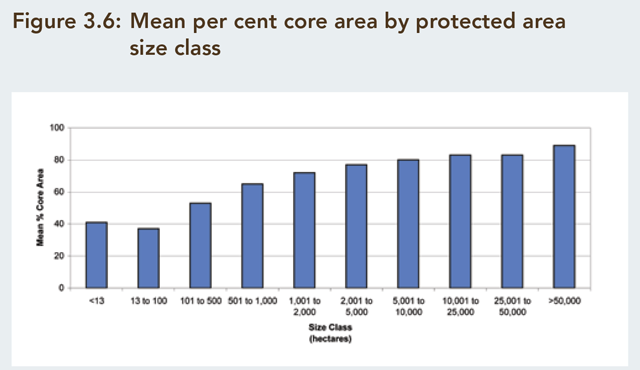
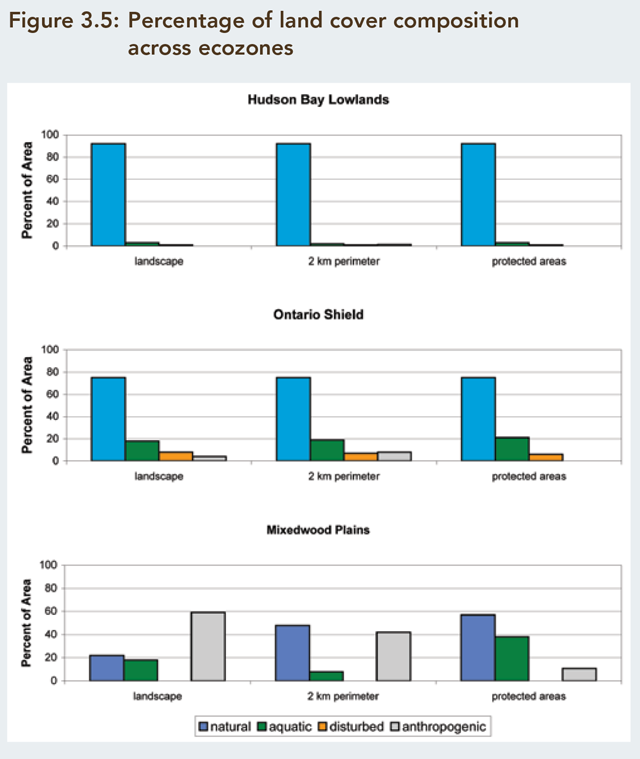
| Protected area type | Per cent core area per protected area overall | Per cent core area per protected area Hudson Bay | Per cent core area per protected area Area Ontario | Per cent core area per protected area Mixedwood | Per cent core area per protected area status: Non Operation | Per cent core area per protected area status: Operating |
|---|---|---|---|---|---|---|
| Conservation reserve | 78 | 84 | 79 | 52 | 78 | - |
| National park | 54 | - | 76 | 40 | - | 54 |
| Provincial park class: Cultural Heritage | 32 | - | 56 | 9 | 42 | 14 |
| Provincial park class: Natural Environment | 59 | 68 | 70 | 17 | 63 | 54 |
| Provincial park class: Nature reserve | 58 | 80 | 73 | 21 | 59 | 31 |
| Provincial park class: Recreational | 17 | - | 30 | 3 | 39 | 12 |
| Provincial park class: Waterway | 76 | 96 | 77 | 37 | 75 | 83 |
| Provincial park class: Wilderness | 96 | 100 | 95 | - | 99 | 96 |
| Provincial park class: Wilderness area | 55 | 96 | 73 | 0 | 54 | - |
| Overall | 65 | 80 | 73 | 16 | 72 | 36 |
| Average distance among protected areas (km) | Mixedwood plains | Ontario Shield | Hudson Bay lowlands | Province |
|---|---|---|---|---|
| Regulated areas only |
11.2 | 4.4 | 22.8 | 5.5 |
| All forms of protection |
0.9 | 4.2 | 21.4 | 2.2 |
Connectivity – linking protected areas
Connectivity is essential for the movement and interaction of wildlife and for the maintenance of species and genetic diversity.
Connectivity can be disrupted temporarily by non- permanent disturbances, whether natural (e.g. fire, blow down, insect impacts) or human caused (e.g. forestry). However, with regeneration habitat is re-established for species to move from one area to the next. This is very common in the Ontario Shield Ecozone where forest fires and forest harvesting occur throughout the broader landscape. However, connectivity can be lost altogether due to development.
The composition of the land cover on the broader landscape and the average distance between protected areas (Table 3.4) are both factors in assessing ecological connectivity between neighbouring areas.
The highest average distances between protected areas are found in the Hudson Bay Lowland Ecozone. Despite the relatively high average distances between them, the large proportion of natural cover found across the ecozone helps to ensure a high degree of connectivity.
The lowest average distances are found in the Ontario Shield Ecozone. This is a result of the high number of protected areas in this ecoregion. This concentration of protected areas combined with lots of natural cover across the ecozone, indicate a high degree of connectivity between regulated protected areas.
Average distances between protected areas in the Mixedwood Plains Ecozone lie between those of the Hudson Bay Lowland and Ontario Shield. While distances were intermediate compared to the other ecozones, natural cover is very low across the Mixedwood Plains. As a result, protected areas are isolated and connectivity between them is poor.
When non-regulated protected areas in the Mixedwood Plains are considered, the density of protected areas increases significantly and the average distance between them is reduced from 11.2 to 0.9 kilometres. The high degree of natural cover within and adjacent to regulated protected areas also helps to maintain some connectivity and reduce the isolation of regulated protected areas in this highly altered landscape.
Alien and invasive species
Invasive species are those alien species whose introduction or spread threatens the environment, the economy and/or society, including human health.
Ontario Biodiversity Strategy, 2005
Industry, trade and tourism in the Great Lakes watershed are major pathways for the introduction of new species in Ontario. These introduced species have adapted to and colonized southern Ontario’s altered landscape.
Alien species
Globally, alien species belong to all taxonomic groups. An estimated 33 per cent of all plants found in Ontario are alien species, although only a small number are considered to be invasive. In the Great Lakes watershed more than 180 aquatic alien species have been identified. Some alien species are common across the landscape, such as the dandelion and European starling.
Species native to Ontario that have been introduced into areas where they did not naturally occur are also considered alien.
Invasive species
Invasive species can displace native species and threaten ecological integrity. They cause loss of rare native species and degradation of ecosystems, biodiversity and ecological functions. Invasive species like the West Nile virus can affect human health, while others like the zebra mussel can damage critical infrastructure. The costs of controlling invasive species and lost revenues in the agricultural and forestry sectors have reached billions of dollars.
The Invading Species Hotline and the associated database are maintained in partnership between MNR and the Ontario Federation of Anglers and Hunters. In 2010, MNR released the Biodiversity Explorer, an online source for information on locations of invasive species as well as rare species and natural areas. Field guides have also been prepared by MNR to improve the identification and reporting of invasive species. These initiatives encourage members of the public and volunteers to report invasive species.
At least 13 invasive species have been identified in protected areas (Table 3.5). Most of these records are found within the Mixedwood Plains and along the southern edge of the Ontario Shield ecozones. About 81 per cent of the records are from conservation reserves and natural environment and recreational class parks. As these areas usually receive more intensive visitation and use, their large numbers of invasive species may be attributed to “hitchhikers” being dispersed by people, pets, boats, cars and other vehicles.
| Common name | Scientific name | Number protected areas |
|---|---|---|
| spiny water flea | Bythotrephes longimanus | 25 |
| fish hook water flea | Cercopagis pengoi | 1 |
| quagga mussel | Dreissena bugensis | 1 |
| zebra mussel | Dreissena polymorpha | 36 |
| Chinese mitten crab | Eriocheir sinensis | 1 |
| rusty crayfish | Orconectes rusticus | 22 |
| oscar | Astronotus ocellatus | 1 |
| round goby | Neogobius melanostomus | 20 |
| ruffe | Gymnocephalus cernuus | 1 |
| European frogbit | Hydrocharis morsus-ranae | 1 |
| purple loosestrife | Lythrum salicaria | 2 |
| common reed | Phragmites australis | 27 |
| curly-leaved pondweed | Potamogeton crispus | 3 |
During 2002-08, structured interviews held with managers from 214 provincial parks, including all park classes, indicated that invasive species were a concern in 50 provincial parks. Commonly cited species included zebra mussel, Eurasian watermilfoil, European frogbit, buckthorn and garlic mustard. Feral pets are also a concern (Tables 3.6 and 3.7).
Once established, invasive species can be extremely difficult and expensive to control. The best response is to prevent their introduction in the first place. For those already here, the next best course of action is to prevent their spread. Ontario Parks has responded by providing information to park users on invasive species through park tabloids and interpretive programs.
For more information visit MNR’s Biodiversity Explorer or call the Invasive Species Hotline (
MNR has erected signs at boat launches to warn boaters about the risk associated with invasive species and provide information on steps that they can take to avoid spreading these species to new locations.

Active programs have been implemented in individual protected areas to control species such as purple loosestrife, Scots pine, garlic mustard and buckthorn. For example, control measures have been taken for the invasive common reed (Phragmites australis) in Wasaga Beach and Rondeau Provincial Parks and for water chestnut in Voyageur Provincial Park.
Ontario Parks has mounted an intensive public awareness program to reduce the chance of visitors bringing firewood infested with Asian longhorn beetle or emerald ash borer into operating parks. Visitors from quarantined areas are asked to exchange their firewood for firewood supplied by the park.
| Category | Common name | Scientific name |
|---|---|---|
| flora | curly leaved pondweed | Potamogeton crispus |
| flora | Eurasian watermilfoil | Myriophyllum spicatum |
| flora | European frogbit | Hydrocharus morsus-ranee |
| flora | purple loosestrife | Lythrum salicaria |
| flora | St. John’s wort | Hypericum perforatum |
| flora | Cypress spurge | Euphorbia cyparissias |
| fauna | common carp | Cyprinus carpio |
| fauna | northern pike1 | Esox lucius |
| fauna | rock bass1 | Ambloplites rupestris |
| fauna | sea lamprey | Petromyzon marinus |
| fauna | smallmouth bass1 | Micropterus dolomieui |
| fauna | spiny waterflea | Bythotrephes longimanus |
| fauna | yellow perch1 | Perca flavescens |
| fauna | zebra mussel | Driessena polymorphs |
| Category | Common Name | Scientific Name |
|---|---|---|
| flora | agricultural grasses and legumes | various species |
| flora | apple | Malus pumila |
| flora | Austrian pine | Pinus nigra |
| flora | buckthorn | Rhamnus spp. |
| flora | common reed | Phragmites australis |
| flora | australis crack willow | Salix gragilis |
| flora | Cypress spurge | Euphorbia cyparissias |
| flora | dog-strangling vine | Vincetoxicum spp |
| flora | European larch | Larix decidua |
| flora | garlic mustard | Alliaria petiolata |
| flora | Japanese barberry | Berberis thunbergii |
| flora | mossy stonecrop | Sedum acre |
| flora | mugo pine | Pinus mugo |
| flora | Norway (red) pine | Pinus resinosa |
| flora | Norway maple | Acer platanoides |
| flora | Scots pine | Pinus sylvestris |
| flora | wild chervil | Anthriscus sylvestris |
| fauna | domesticated and feral pets | various species |
| fauna | gypsy moth | Lymantria dispar |
Hyper-abundant species
Hyper-abundance is usually associated with native species capable of easily adapting to habitats or food supplies altered by human development. Hyper-abundant species can negatively affect biodiversity by monopolizing resources and through introducing and spreading diseases and parasites.
Species like Canada geese and eastern chipmunks may be locally abundant to the point of being a nuisance, but they do not cause widespread impacts. Other abundant species like raccoons can affect other wildlife through the predation of eggs and the young of ground-nesting birds. In contrast, white-tailed deer, double-crested cormorants and lesser snow geese are considered to be hyper-abundant because they can cause significant ecological impacts. MNR is addressing the impacts of hyper-abundant species in some locations.
Parks Canada, 2007
White-tailed deer
An increase in edge habitat, mild winters, abundance of food, loss of natural predators such as wolves and control of hunting have allowed white-tailed deer to become hyper-abundant across portions of their range.
Research conducted at Rondeau and other provincial parks has clearly demonstrated the impacts of over- browsing by deer on the regeneration of Carolinian forest. The composition of woody and herbaceous plants in the forest understorey has been severely altered.
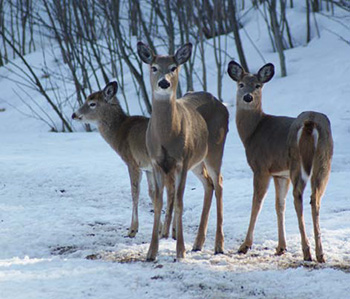
Photo: Jake Hojberg
This can indirectly affect the abundance and diversity of insects, amphibians, reptiles, small mammals and birds that depend upon understorey habitats.
In response, herd reductions are being carried out in Rondeau (1998 to present), The Pinery (2002 to present) and Presqu’ile (2003 to present). Follow-up field observations have shown positive responses by woody and herbaceous plants in the understorey due to reduced deer density.
Double-crested cormorant
Cormorant populations declined in the 1960s due to adverse effects of pesticides, primarily DDT, which caused eggshell thinning and ultimately reproductive failure.
Since the banning of DDT in the 1970s, the recovery of the cormorant population has probably exceeded historical levels in the Great Lakes basin.
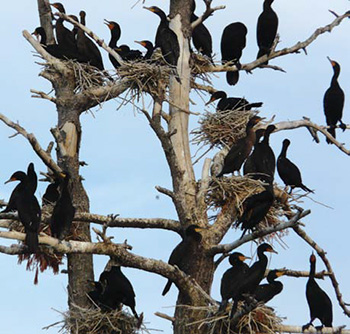
This recovery has been aided by increased food sources including the proliferation of commercial catfish farms in their southern United States wintering range and by alien species like alewife within their Great Lakes nesting range. The number of cormorant nests on the Great Lakes has increased from fewer than 1,000 in 1979 to nearly 115,000 in 2000. By 2005, the number of nests had declined to about 113,000.
Large cormorant colonies occur on High Bluff and Gull Islands at Presqu’ile Provincial Park and at East Sister Island Provincial Nature Reserve and Middle Island (managed by Parks Canada) in the western Lake Erie basin. Monitoring these colonies has shown that nesting and roosting have heavily affected the woody and herbaceous understorey.
At Presqu’ile, these impacts have also caused a decline of habitat used for nesting by great blue herons, great egrets and black-crowned night-herons. In response, a management strategy was initiated to reduce the numbers of cormorants and thus maintain woody vegetation for all colonial water birds, including the double-crested cormorant.
Lesser snow goose
The mid-continental population of lesser snow geese has increased dramatically since the 1960s. This is probably due to an increase in the availability of food on wintering grounds in the southern United States and along flyways to nesting grounds in Arctic and sub-Arctic Canada, and a decrease in hunting harvest.
In the early 1970s, the lesser snow goose population in Polar Bear Provincial Park consisted of a single colony of 25,000 to 30,000 nesting pairs at Cape Henrietta Maria. By the mid-1990s there were three colonies in the park consisting of about 165,000 to 183,000 nesting pairs. Including young of the year, there were and still can be as many as a million lesser snow geese in Polar Bear Provincial Park.
Overgrazing by lesser snow geese in Polar Bear Provincial Park has resulted in a loss of dominant freshwater and saltwater coastal vegetation. While freshwater areas could recover in as few as five to 10 years, the recovery of saltwater areas could take decades.
In 1999, hunting regulations were changed to help reduce the goose population to numbers more consistent with the carrying capacity of the habitat. While monitoring shows that the nesting population is stabilizing, ecosystem recovery cannot occur at current high goose densities.
Species at Risk
Many of the species at risk in Ontario are at risk due to ongoing threats such as loss of habitat which has led to population decline.
The Ontario Natural Heritage Information Centre tracks over 2,000 rare or threatened species, including plants, mammals, birds, reptiles, amphibians, fish and insects. Each individual location of a species that has been observed and verified is recorded as an element occurrence. Approximately 200 provincially tracked species have been formally assessed and designated as a species at risk at the provincial or national level. This represents one third of all species at risk in Canada.
Protected areas are one method for protecting species at risk. They can provide refuge for species, serve as source areas for populations and supply secure habitat for species recovery efforts.
- refers to an occurrence of an element of biodiversity on the landscape – an area of land and/ or water on/in which an element (e.g. species or ecological community) is or was present
- it has conservation value for the element – it is a location important to the conservation of the species or community
- for a species it is generally the habitat occupied by a local population.
Ontario’s regulated protected areas account for nine per cent of the province’s total area, yet about one quarter of all element occurrences for all provincially tracked species, including species at risk, are associated with protected areas. This can be attributed to both the large amount of species at risk survey work taking place in protected areas and the relative lack of disturbance in regulated protected areas.
Approximately two thirds of all element occurrences for provincially tracked species, again including species at risk, are found in the Mixedwood Plains. While regulated protected areas occupy less than one per cent of this ecozone, they account for about 15 per cent of all occurrences of provincially tracked species, including species at risk. The proportionally higher association with protected areas is probably again due to more intense survey work in protected areas of the Mixedwood Plains, but also because of the higher proportion of natural cover in protected areas.
Habitat loss and fragmentation pose serious threats to the persistence of these species. Given the large number of tracked species and species at risk in the Mixedwood Plains, protected areas alone will not be sufficient for the protection and recovery of some species.
3.5 Sustainable management of protected areas
Provincial parks provide opportunities for ecologically sustainable outdoor recreation and give visitors a knowledge and appreciation of Ontario’s natural and cultural diversity. Conservation reserves provide opportunities for ecologically sustainable land uses, including traditional outdoor heritage activities.
These opportunities and land uses can have significant environmental impacts. MNR is committed to managing these activities to maximize the benefits of human use, while minimizing environmental impacts.
Hunting, fishing and trapping are permitted in selected provincial parks and all conservation reserves. Commercial forestry, prospecting, mining and generation of electricity are not permitted, with some exceptions such as forest management in Algonquin Park and electricity generation for use within communities not connected to the IESO electrical grid.
Commercial fishing and bait harvesting are permitted under licensing regulated by the Fish and Wildlife Conservation Act, 1997. Currently, 30 commercial fishing licences have been issued for waters in 15 provincial parks, while another 606 licences have been issued to harvest bait in 133 provincial parks.
Hunting
The PPCRA prohibits hunting in provincial parks unless allowed by exception under the Fish and Wildlife Conservation Act (FWCA). In contrast, hunting is permitted in all conservation reserves unless it is prohibited by regulation under the FWCA. Hunting is also permitted in all wilderness areas outside provincial parks unless prohibited by regulation under the FWCA. Aboriginal people may hunt in protected areas pursuant to their existing Aboriginal and treaty rights.
The hunting of waterfowl is regulated by the Canadian Wildlife Service. All other hunted species in Ontario are regulated by MNR under the FWCA.
Currently, hunting is permitted in all conservation reserves and wilderness areas, and portions of over one third of provincial parks. Ninety-eight per cent of these protected areas provide opportunities to hunt game birds, game mammals and migratory birds (Table 3.8). The remaining areas restrict the type of hunting permitted.
Hunting information is collected for big game animals on a provincial basis, but is not differentiated between the harvest inside or outside of protected areas. Therefore, it is not possible to determine the extent of hunting in protected areas. Since regulated protected areas represent a relatively small percentage of the province’s total area and hunting is closely regulated to sustain populations and species, the impact of hunting on populations within protected areas is likely not significant.
Trapping
Trapping is governed by the FWCA and through policies administered by MNR. Aboriginal people may trap in protected areas pursuant to their existing Aboriginal and treaty rights.
Trapping is permitted in 81 per cent (532 of 654) of Ontario’s regulated protected areas, including some parks, all conservation reserves and wilderness areas outside protected areas (Table 3-9). Trapping is not permitted in protected areas within Crown game preserves and no new traplines are permitted in protected areas. Trapping may not actually be occurring in all of these protected areas where it is permitted. A current review of the existing policy to phase out trapping in some provincial parks is underway.
While trapper harvests are recorded, the specific location within the trapline (i.e. inside or outside protected area) is not known. Therefore, the numbers and varieties of species harvested in protected areas are unknown. The impacts of trapping, however, are probably minimal due to the small size of the area being trapped and existing regulations for sustainable trapping.
Fishing
Sport fishing is permitted in all provincial parks and conservation reserves, except where fish sanctuaries have been established. All limits and seasons made through the Ontario Fishery Regulations under the federal Fisheries Act, 1985 apply to regulated protected areas. Aboriginal people may fish in protected areas pursuant to their existing Aboriginal and treaty rights.
Recreational inventories from protected areas have shown fishing to occur in 64 per cent (391) of the 616 regulated protected areas surveyed. In a survey of staff from 106 parks where fishing was occurring, staff expressed concern regarding the impact of fishing pressure on fish populations within specific lakes in 37 per cent of those parks.
Although Ontario Parks does not have estimates of harvest levels, the percentage of campers participating in fishing can provide a measure of recreational activity as well as an indication of fishing pressure. The Ontario Parks Camper Survey reflects the fishing activity of survey respondents at 76 operating provincial parks across the province.
According to the 2008 survey, 24 per cent of respondents (an estimated 319,450 campers) participated in fishing for at least 30 minutes during their park visit. This is a modest drop from estimates of 330,500 campers who fished in 2005 and 349,700 in 2000.
Fish stocking
Stocking is carried out by MNR to establish or re-establish naturally reproducing fish populations and to provide fisheries for public use. MNR guidelines provide direction for the stocking of inland lakes and emphasize the need to minimize adverse ecological impacts. Direction on a park class basis is also provided by the Ontario Provincial Park Planning and Management Policies (Table 3.10). There are no comparable stocking policies for conservation reserves. Fish stocking in protected areas is subject to the Class EA-PPCR
Over seven million fish were stocked in 50 provincial parks and 23 conservation reserves between 2001 and 2009. Native species stocked included brook trout, aurora trout, lake trout, muskellunge and walleye. Naturalized alien species (those not native to the province or the area that have established self-sustaining populations) such as brown trout and rainbow trout, and splake (a hybrid of brook trout and lake trout) were also stocked. While variable from year to year, overall the total number of fish stocked average 0.8 million per year.
The majority of stocking in regulated protected areas occurs in the central and northeast parts of the province. Limited stocking has taken place in the south and northwest. Ninety-eight per cent of all fish stocked were released in conservation reserves and natural environment and waterway class parks. The remaining two per cent were released in recreational, nature reserve and wilderness class parks.
| Protected area type/class | Game mammals, 1game birds2 | Game mammals 1, game birds2, migratory birds3 | Migratory birds 3 | Moose, grouse, varying hare | Total |
|---|---|---|---|---|---|
| Conservation Reserve | 294 | 294 | |||
| Cultural Heritage Park | 1 | 1 | |||
| Natural Environment Park | 1 | 43 | 4 | 1 | 49 |
| Nature Reserve Park | 1 | 1 | |||
| Recreational Park | 9 | 3 | 12 | ||
| Waterway Park | 62 | 62 | |||
| Wilderness Park | 2 | 1 | 3 | ||
| Wilderness Area | 11 | 11 | |||
| Total | 1 | 423 | 8 | 1 | 433 |
1 Game mammals include black bear, cottontail rabbit, European hare, fox squirrel, gray (black) squirrel, moose, varying hare and white-tailed deer.
2Game birds include: gray (Hungarian) partridge, northern bobwhite, ring-necked pheasant, rock ptarmigan and willow ptarmigan, ruffed grouse, sharp-tailed grouse, spruce grouse and wild turkey.
3Migratory birds include: American coot, Brant, Canada goose, common snipe, common moorhen, ducks (other than harlequin), rails (other than yellow and king), snow goose, white-fronted goose and woodcock.
| Protected areas type | Protected areas class | Number of all protected areas | Area of all protected areas | Current trapping number | Current trapping area | Per cent of total number | Per cent of total area |
|---|---|---|---|---|---|---|---|
| Conservation Reserves | Regulated | 294 | 1,497,040 | 263 | 1,377,347 | 89.5 | 92.0 |
| Conservation Reserves | Recommended | 11 | 142,264 | 10 | 131,012 | 90.9 | 92.1 |
| Conservation Reserves Total | All Conservation Reserves | 305 | 1,639,304 | 273 | 1,508,359 | 89.5 47.5 | 92.0 |
| Provincial Parks | Cultural Heritage | 6 | 6,7358 | 3 | 588 | 50.0 | 8.7 |
| Provincial Parks | Natural Environment | 80 | 1,466,430 | 61 | 696,305 | 76.3 | |
| Provincial Parks | Nature Reserve | 109 | 117,935 | 81 | 97,049 | 74.3 | 82.3 |
| Provincial Parks | Recreation | 65 | 37,073 | 35 | 31,766 | 53.8 | 85.7 |
| Provincial Parks | Waterway | 62 | 1,445,416 | 61 | 1,255,240 | 98.4 | 86.8 |
| Provincial Parks | Wilderness | 8 | 4,823,745 | 8 | 4,106,051 | 100.0 | 85.1 |
| Provincial Parks | Recommended New parks | 7 | 59,998 | 2 38,330 | 28.6 | 63.9 | |
| Provincial Parks | Recommended additions to existing |
5 | 132,139 | 5 | 65,134 | 100.0 | 49.3 |
| Provincial Parks Total | All Provincial Parks | 337 | 8,089,471 | 251 | 6,290,463 | 74.5 | 77.8 |
| Wilderness Areas | All Wilderness Areas | 11 | 838 | 8 | 703 | 72.7 | 83.9 |
| Total | All | 653 | 9,729,613 | 532 | 7,799,525 | 81.5 | 80.2 |
| Protected area type or class | Put-grow-and-take | Put-and-take | Re-introduction/ rehabilitation | Introduction | Supplemental |
|---|---|---|---|---|---|
| Cultural Heritage | No | No | Yes | No | No |
| Natural Environment | Yes | No | Yes | No | No |
| Nature Reserve | stocking not permitted | ||||
| Recreation | Yes | Yes | Yes | No | No |
| Waterway | Yes | No | Yes | No | No |
| Wilderness | No | No | Yes | No | No |
| Conservation Reserve | Yes | Yes | Yes | No | No |
- Put-grow-and-take:
- Stocking yearlings and fingerlings to provide future angling opportunities.
- Put-and-take:
- Stocking larger adult fish in heavily fished waters to provide immediate, but short term fishery.
- Re-introduction:
- Re-establish a population of a species where it has been extripated.
- Rehabilitation:
- Restoring a degraded population to provide for optimum sustained yield.
- Introduction:
- Establishing a population of a species where it does not occur naturally to provide additional benefits.
- Supplemental:
- Planting hatchery-reared or wild stock into water bodies with viable populations of the same species.
Outdoor recreation
Outdoor recreational use can have a lasting impact on the natural environment. It is critical for protected area managers to understand “how much use is acceptable”. To help answer this question, MNR undertakes recreational inventories for all regulated protected areas; conducts routine user surveys of operating parks and pursues research into the human dimensions of outdoor recreation. The knowledge gained informs decisions that support and maintain ecological integrity, while providing ecologically sustainable outdoor recreation.
In the absence of quantitative studies that measure the impacts of recreational use, managers and staff of 214 provincial parks were systematically questioned about the impacts of ecological pressures, including recreational uses. They rated ecological pressures in terms of their intensity, trend, geographic extent (localized or widespread), potential for ecosystem recovery and other factors. Overall, their perceptions were that car camping, hiking, all terrain vehicles, interior camping and boating are the recreational activities most commonly associated with ecological impacts (Figure 3.7). This information contributes to planning and management, and can help to balance recreational uses with ecological integrity.
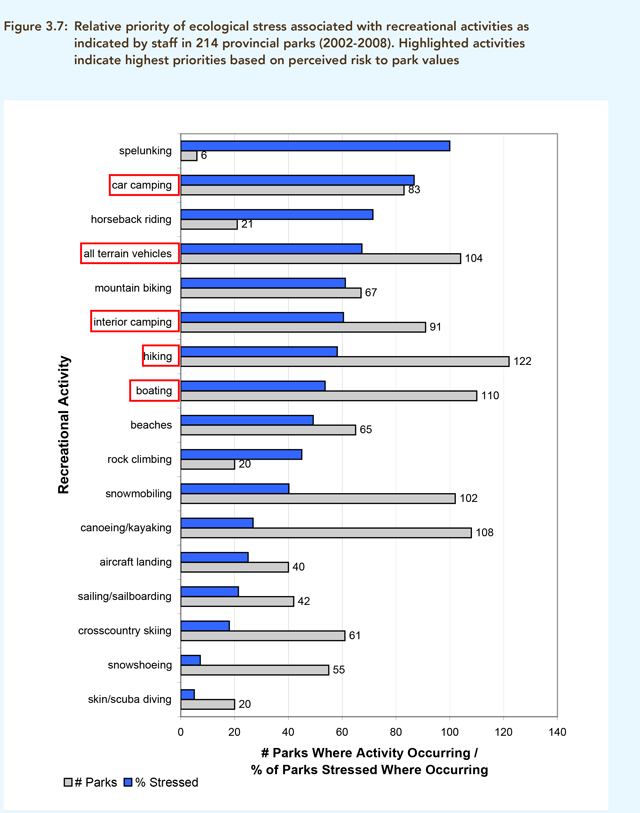
If you need alternate formats or communication supports, please contact us
Chapter 4: Benefits and opportunities
4.1 Sustainable living
Ontario’s large system of protected areas provides significant social and economic benefits to society. As of 2009, the protected area system included about nine per cent of the provincial land base and had capital assets that exceeded $1 billion, not including the value of the land. Each year, camping and day use visitation to Ontario’s 112 operating parks amount to about 10 million visitor days. These visitors spend significant sums of money on their trips to provincial parks that help support local business and provide employment across the province.
Many Ontario residents, Canadians and people around the world who do not visit our protected areas still value Ontario’s protected area system for a variety of reasons. For example, they may appreciate that protected areas help conserve biodiversity, maintain healthy ecosystems and are part of sustainable living. Examples of this “non-visitor” support is evidenced through people’s contributions to Ontario’s protected areas including their charitable donations and volunteer activities in support of Ontario’s protected areas.
4.2 Socio-economic Benefits
Two complementary approaches have been used by MNR to assess the socio-economic benefits of protected areas: Economic Impact Analysis and Total Economic Value. While both approaches use dollar values as a measuring stick, they do not measure the same thing.
Economic Impact Analysis measures the “ripple effect” visitor and Ontario Parks spending creates within the regional economy. The size of the economic activity “ripple” is commonly measured through such aspects as “person years of employment” and “value added”.
By contrast, Total Economic Value (TEV) is an estimate of the monetary worth of the full range of market and non-market benefits arising from a protected area.
The economic impact approach is useful to identify how visitor spending related to protected areas circulates through the economy. However, unlike the TEV approach, it does not measure the value of the benefits generated by these expenditures.
A study completed in 2004
A 1995
Between 2002 and 2005, about 73 per cent of provincial park visitors reported receiving health benefits from their visits. Improved mental well-being was cited as the health dimension with the greatest improvement.
Economic impact benefits
Money spent by Ontario Parks and its visitors over the last decade have had a significant impact on the provincial economy (Table 4.1). Visitor expenditures were the single greatest expenditure category and accounted for about 60 per cent of the combined initial expenditures.
In 2008-09, money spent by Ontario Parks and visitors generated about $495 million in terms of “value added”
| Year | Initial expenditures by Ontario parks visitors (millions) | Value added (millions) | Employment (person years) |
|---|---|---|---|
| 2000-01 | $290 | $377 | 7,320 |
| 2005-06 | $276 | $345 | 6,262 |
| 2008-09 | $397 | $495 | 8,246 |
Across the 2000-01 to 2008-09 time period, the initial “expenditure:value added” ratio remained at about 1:1.3. This ratio suggests that every dollar spent by Ontario Parks operations and visitors generates about $1.30 of economic activity.
Total economic value (tev)
Complex natural resource systems, such as protected areas, provide multiple sources of benefits and related monetary values. In analyzing such systems, economists use a concept called total economic value (TEV).
The TEV is composed of use and non-use values (Figure 4.1). Use values include both direct and indirect values. Direct use values are acquired through visiting a protected area and may be consumptive (e.g. fishing) or non-consumptive (e.g. bird watching). Indirect use values are derived from the non-market, ecosystem regulating services provided by a protected area (e.g. water purification by headwater areas, flood control, and climate regulation).
Non-use values (also referred to as “passive use” or “preservation use” values), represent a person’s “willingness-to-pay” for protected areas even though no “use” value is present. Unlike use values, non-use values accrue to both visitors and non-visitors of protected areas.
Individual types of non-use values include “option value,” (which is the value of maintaining the option of future use of the protected area); “bequest value” (the value of being able to pass along protected areas to future generations; and “existence value”, (which is the value derived from the satisfaction of knowing that protected areas exist).
While non-use values are difficult to measure because they are not observable, they are important to measure because they are often the largest component of the TEV. Failure to recognize and include non-use values in decision-making could bias decisions in favour of development, recreation or other use values and place unnecessary pressures on the ecological values of protected areas.
MNR has undertaken a number of studies on the direct use values provided by protected areas. These studies range from valuing recreational use, to better understanding of the health and well-being benefits derived from park visitation (Figure 4.2).
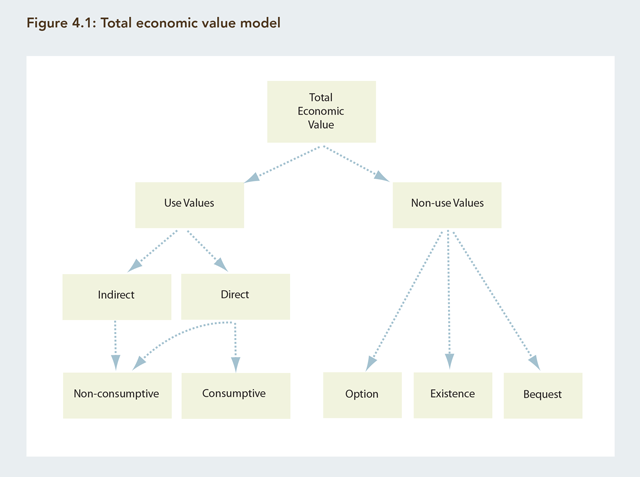
If you need alternate formats or communication supports, please contact us
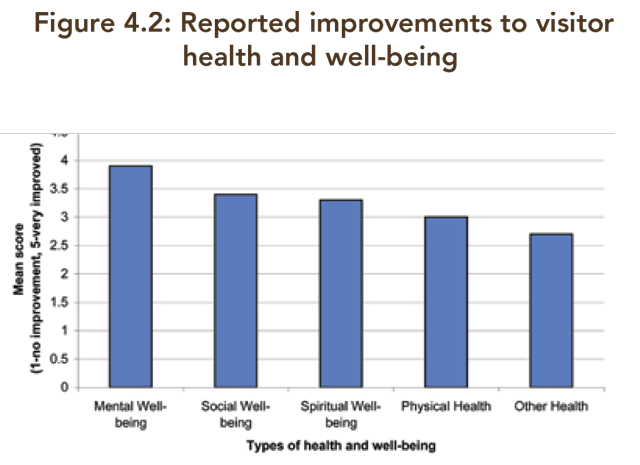
If you need alternate formats or communication supports, please contact us
In 2005, Ontario Parks commissioned the University of Alberta to conduct a study
Potential threats
The economic benefits of Ontario’s protected areas can be threatened by a variety of factors. These include: changing public preferences and related values due to rapidly changing demographics; lack of information on the recreation activities in non-operating parks and conservation reserves; and failure to sufficiently estimate and include indirect and non-use values in the decision- making process.
MNR makes significant efforts to track and understand these potential threats. These efforts help ensure ecologically and economically sound decisions are made regarding allocating provincial protected area resources.
4.3 Opportunities for access
Accessibility
Visiting Ontario’s provincial protected areas is influenced by many factors including: how far away they are, when they are open, barrier-free access and affordability. Awareness and information about protected area locations, services and recreation opportunities may also affect accessibility. For this reason, Ontario Parks makes significant efforts through its marketing programs, website, publications such as the Ontario Parks Guide and various education programs, to promote use of provincial parks.
Accessibility to a provincial protected area is also greatly influenced by travel time. According to the 2006 Ontario Parks Consumer Survey, most respondents from Ontario would drive less than four hours for a weekend or camping trip and less than two hours for a day trip to a provincial park. With that in mind, an analysis of Ontario’s 20 most populated municipalities showed that at least 60 per cent of the population is within 400 kilometres of more than one million hectares of protected area.
Accessibility is also limited by the days a given park is open and available to the public. Most operating provincial parks are open from mid-May to October. Parks with long operating seasons and close to large urban centres help maximize accessibility. Eighteen provincial parks were open 365 days in 2008, up from 11 parks in 2004. Another five provincial parks were open for at least 200 days.
Ontario Parks remains committed to providing barrier- free access. As of 2008, 85 per cent of all operating parks had at least one form of barrier free access, up from 80 per cent in 2005. About three per cent of park camping permit holders in 2008 were disabled persons and about 65 per cent of visitor centres provided barrier-free access. Additionally, Ontario Parks offers over 120 barrier-free campsites across the province.
The total cost of a visit to a protected area may restrict some visitors. However, Ontario Parks is committed to providing world-class recreational opportunities at reasonable and competitive prices. For this reason, Ontario Parks tries to balance the demand for affordable outdoor recreation experiences while still meeting financial constraints and revenue targets.
Ontario Parks fees are reviewed annually. Considerations include comparing what other agencies and operators charge, fair recovery of costs and affordability. Ontario Park fees compare favourably with those charged by other agencies and private campgrounds that offer high quality camping and recreation. This is consistent with the principle that park users should contribute fairly to the operation and maintenance of provincial parks.
Recent surveys suggest that Ontario Parks is largely achieving the difficult balance between revenue generation to cover the costs associated with its legislated mandate and affordability for the people of Ontario. Currently, about 80 per cent of the overall costs associated with managing all provincial parks are paid through user fees for camping and day use activities.
Although the fees for regular and interior camping increased by about 25 per cent between 2000 and 2008, annual park visitation has remained relatively stable at about 9.5 million visits per year. As well, according to the 2009 Ontario Parks Consumer Survey, about 50 per cent of campers and day-visitors would still visit a park if fees were raised by 30 per cent. The Consumer Survey also found that only about two per cent of Ontario’s residents who have not gone for a day hike and seven per cent who have not camped in an Ontario provincial park in the past three years, cited “cost too expensive” as a reason for not visiting.
To meet its operating expenses, user fees are the primary revenue generating mechanism available to Ontario Parks. However, they are only a portion of the many costs incurred when visiting one of Ontario’s protected area. Other related trip costs include transportation, time off work, camping equipment and food. Even if park fees were zero, visiting a provincial park may still be unaffordable for some people.
4.4 Opportunities for sustainable outdoor recreation
Operating parks
As of 2009, there were 112 operating provincial parks in Ontario. These parks include 3.4 million hectares of land and water and represent about one-sixth of Ontario’s regulated protected areas.
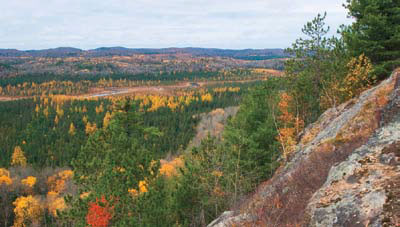
Photo: Sam Brinker
Operating parks include more than 19,400 car and 7,500 interior campsites. Another 500 persons per night can be accommodated in roofed lodgings such as cabins, cottages, lodges and yurts.
Surveys suggest that the demand for roofed accommodation may be increasing. About 69 per cent of surveyed Ontario residents expressed some interest in the idea of offering roofed accommodation in provincial parks.
While all operating parks have hiking trails, there are about 1,500 km of authorized hiking trails in the provincial park system. The longest backcountry trail networks are found in Killarney and Algonquin Provincial Parks.
Operating parks also incorporate visitor centres, museums, park stores, comfort stations, campsite electricity hook-ups and other services and facilities to enhance the visitor experience.
Capital assets
As of 2009, the capital assets of Ontario’s provincial parks were valued at over $1.2 billion.
Between 2000 and 2009, MNR spent about $16.3 million per year on capital projects. Over this time period, an additional $19 million was spent on three new visitor centres and $104 million on upgrading park drinking water systems.
This average annual expenditure of about 1.8 per cent of the total value of provincial park capital infrastructure is slightly less than the industry standard of two per cent for maintenance of total capital worth.
Human resources
Ontario’s protected areas are planned and managed by several programs within MNR.
The Parks and Protected Areas Policy Section in MNR’s Policy Division provides policy, planning, science and information management functions for provincial parks, conservation reserves, wilderness areas and areas of natural and scientific interest.
Ontario Parks, a branch in the MNR’s Provincial Services Division, employs about 220 full time staff members. These positions include park superintendents and assistant superintendents charged with the day-to-day operation of provincial parks.
The operation of provincial parks during peak seasons relies heavily on seasonal and student employment. In July 2008, Ontario Parks employed 2,594 staff, including 2,006 seasonal and summer positions.
Expertise in provincial parks, marketing, operations and development is also available in the Ontario Parks main office, six Zone Offices and Parks and Protected Areas Policy Section.
MNR’s Regional Operations Division provides planning and management for conservation reserves, wilderness areas and areas of natural and scientific interest, with support and guidance from Policy Division.
Other MNR program areas work in partnership with the protected areas program on natural resource management aspects such as forest fire, fisheries, wildlife and invasive species management.
Operating expenditures
Salaries and benefits comprise about 60 per cent of the Ontario Parks annual operational budget. The balance is spent on transportation, communication, services, supplies and equipment.
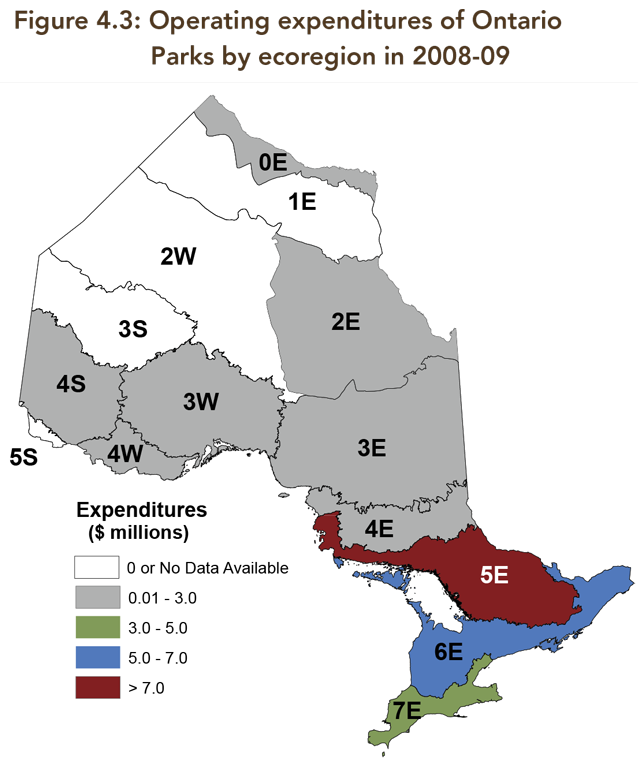
In general, operating budgets are directly related to visitation. Operational expenditures were highest in the southern ecoregions which have the highest visitation levels – Ecoregions 5E, 6E and 7E (Figure 4.3). However, the amount spent per visitor is higher in near northern ecoregions such as 2E, 3E and 3W (Figure 4.4). This is largely because fixed park operating costs are distributed over fewer visitors.
Operating expenditures associated with conservation reserves cannot be directly tracked, since these areas are managed as part of the broader responsibilities of MNR’s Regional Operations Division.
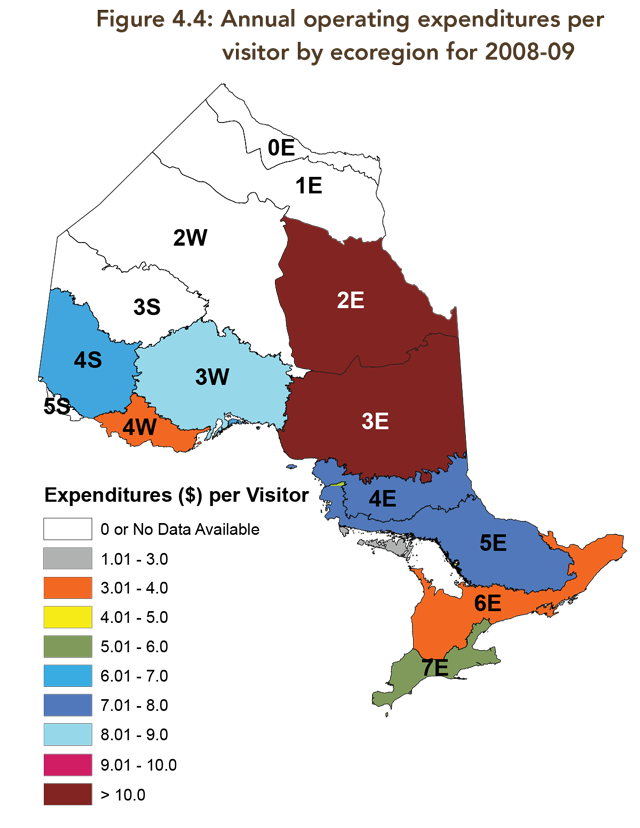
Revenues
In 2008-09, the Ontario Parks operating budget was $76.5 million of which $60.3 million was revenue generated by the provincial park system – largely from user fees for camping and day use activities. The remaining $16.2 million of the operating budget was obtained directly from the Ontario government. These figures indicate that the current Ontario Parks operating cost recovery ratio is about 79 per cent – slightly better than the average of about 77 per cent for the period between 2000 and 2009.
Between 2000 and 2009, Ontario Parks revenues increased by about 53 per cent, from $39.3 million to $60.3 million while operating expenditures increased by about 48 per cent, from $51.6 million to $76.5 million (Figure 4.5). Excluding capital expenditures, over the same time period, the Ontario government contribution to operational costs rose by about 32 per cent from $12.3 million to $16.2 million.
This increase in expenditures and government funding was largely used to fund the creation and operation of new protected areas. Between 2000 and 2009, the number of protected areas in the system nearly doubled.
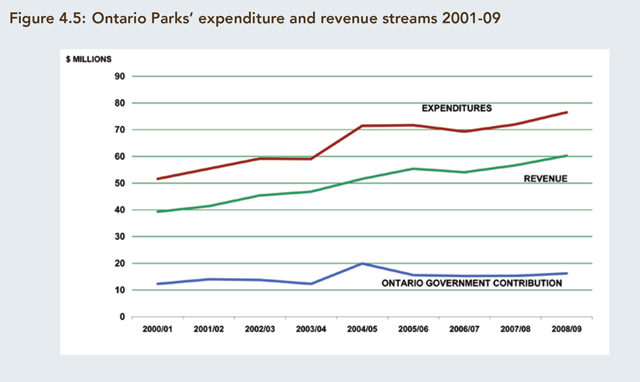
If you need alternate formats or communication supports, please contact us
4.5 Demand for sustainable outdoor recreation
Visitation
Given that the same person can make multiple trips for several days to a protected area, counting individual persons would underestimate the true impact of human use of a protected area. For this reason, Ontario Parks tracks “visits” or “visitation” (Figure 4.6). A “visit” is defined as one person visiting for a single day (i.e. day use or bus visitor) or a single night (i.e. regular, group or interior camper). This recorded visitation is an underestimate because it does not include visitation to conservation reserves, non-operating parks or operating parks during their “closed” season.
Visitation to Ontario’s protected areas is highly dependent on weather conditions. This is evidenced by the lower visitation in 2008 and 2009 which were particularly cool and wet summers in Ontario. Annual visitation can also vary for many other reasons including economic conditions, gasoline prices, currency exchange rates, travel documentation requirements and the perception of associated risks such as West Nile virus, Lyme disease, bear activity and forest fire.
While visitation at northern provincial parks has been decreasing over the past decade, total provincial parks visitation has remained relatively stable (Figure 4.6). This is largely because camping visitation in provincial parks in southern and central Ontario has been steady or increasing and keeping pace with Ontario’s population growth.
The highest recorded visitation to Ontario’s provincial parks was about 10.5 million visits in 2002 and 2005. This represents a 36 per cent increase from the 7.7 million visits recorded in 1990 and a 19 per cent increase from the 8.8 million visitors recorded in 2000.
According to the 2009 Ontario Parks Consumer Survey, about 58 per cent of Ontario residents visited an Ontario provincial park in the past three years. Compared to the 1997, 2000 and 2006 Consumer Surveys, visitation has fluctuated from 64 per cent, 68 per cent and 58 per cent of Ontario residents, respectively. This variability in visitation per capita (market share) is also illustrated in the yearly trend line in Figure 4.6.
The linear trend line in Figure 4.6 does suggest a slight decrease in per capita visitation. Given Ontario Parks reliance on user fees for revenue, this could be a concern if it becomes a long-term trend. The findings of the 2006 and 2009 Ontario Parks Consumer Surveys suggest that this trend may continue since the proportion of respondents who intended to use the provincial parks less frequently in the next five years increased from six per cent to 10 per cent over the same time period.
Based on projections by the Ontario Ministry of Finance and Ministry of Tourism, Ontario Parks anticipates that future visitation will be affected by an increasingly older and culturally diverse provincial population as well as changing visitor and non-visitor preferences of what provincial protected areas are to provide to the people of Ontario. Ontario Park’s visitor statistics indicate that about 80 per cent of provincial park visitors are from Ontario. Visitors from out-of-province vary significantly by park and ecoregion. For example, protected areas found in northwest Ontario have a high percentage of visitors from urban centres in Manitoba and the United States.
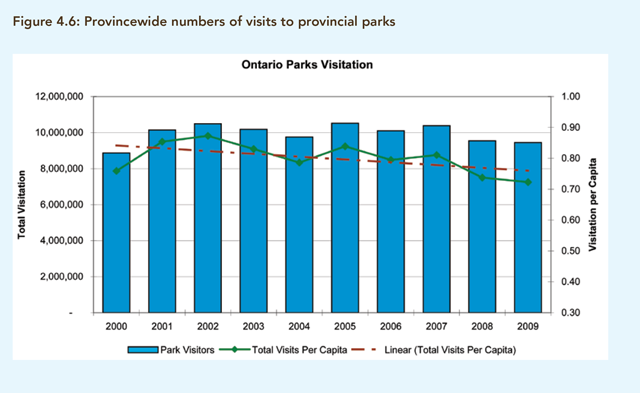
If you need alternate formats or communication supports, please contact us
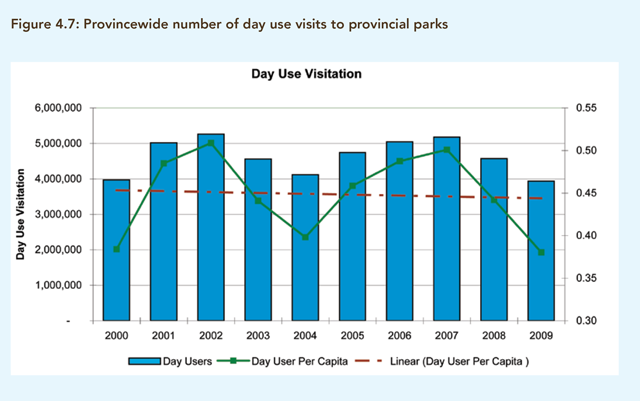
If you need alternate formats or communication supports, please contact us
Day Use
Day users are the largest recreational user group of provincial parks. Day use offers a good way to introduce new visitors to parks, especially in southern Ontario, where there is little potential to add new campers to existing protected areas.
According to the 2009 Ontario Parks Consumer Survey, the proportion of Ontario residents who visited a provincial park in the last three years for day use purposes has remained constant since 1997 at about 55 per cent of the population.
Day use visitation was highest in the southern ecoregions because of their proximity to the large urban centres of southern Ontario. Wasaga Beach Provincial Park hosted the largest number of day users. The Pinery, Rondeau and Bronte Creek Provincial Parks had the most winter day use.
Day use visitation has experienced highs and lows due to weather, but appears to be relatively steady to slightly declining in the long-term (Figure 4.7). Unlike camping visitation, it has not kept pace with the growth of the Ontario population over the past decade.
Camper nights
The proportion of Ontario residents who reported camping in the past three years in Ontario’s provincial parks fell from 32 per cent in 1997 to 25 per cent in 2009. However, during over the same time period, the number of camper nights increased by about 14 per cent. This suggests that although there are fewer campers, they are taking longer and/or more frequent trips.
In the 2009 season, about five million camper nights were recorded in 92 operating provincial parks. Ontario Parks visitor statistics suggest that, in most years, backcountry camper nights represents about five per cent of total visitation (Figure 4.8) and about 10 per cent of all camper nights.
Similar to day use, camper nights were highest in southern Ontario, due to the proximity to the large urban centres in southern Ontario. In 2009, Algonquin, The Pinery, Killbear and Sandbanks supplied the most summer camper nights. By comparison, MacGregor Point, Algonquin, The Pinery and Silent Lake supplied the most winter camper nights.
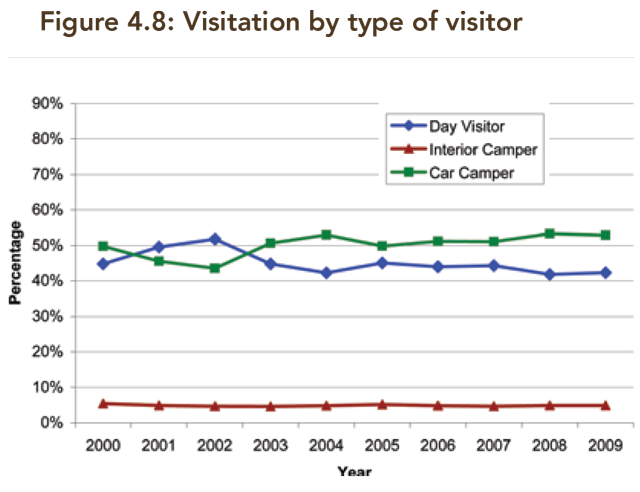
If you need alternate formats or communication supports, please contact us
Park occupancy rates mirror park visitation and were highest in Algonquin and parks in the southwest and central zones.
Other recreational activities
Ontario Parks supplies a variety of other ecologically sustainable recreational activities in natural settings.
Based on 2005 and 2008 surveys (see Figure 4.9), the most popular recreation activities for day users and campers were rest/relaxation, campfire activities, swimming/wading, casual play and unguided hiking.
Picnicking was the only activity for which day users had a higher participation rate than campers.
Between 2005 and 2008, the largest recorded increase in camper participation was for viewing/photographing nature, picnicking and visiting viewpoints. The largest decrease in camper participation was for swimming/ wading.
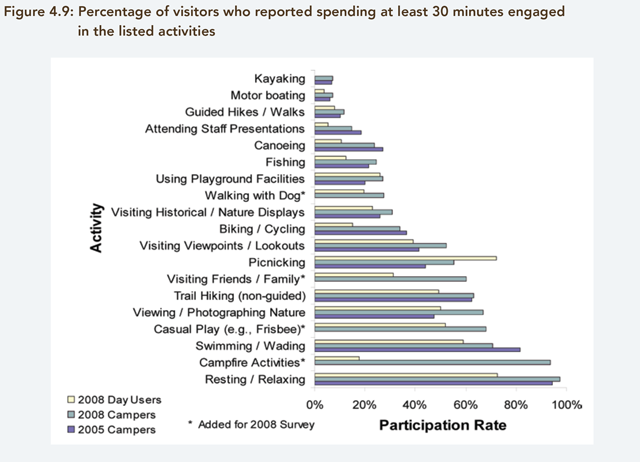
If you need alternate formats or communication supports, please contact us.
4.6 Opportunities to increase knowledge and for heritage appreciation
The Internet has rapidly become the primary information source for selecting camping or day use destinations. According to the 2009 Ontario Parks Consumer Survey, the proportion of the people of Ontario using the Internet to get information about camping has grown from eight per cent in 1997 to 71 per cent in 2009. The proportion using the Internet to select a day trip location has also grown from six per cent in 1997 to 57 per cent in 2009. About 44 per cent of Ontario residents surveyed in 2000 and 2006 reported having accessed the Ontario Parks website.
The increasing popularity of the Internet has been accompanied by a decline in the use of other sources of park information, including recommendations from friends/family and printed material such as newspapers, brochures and pamphlets.
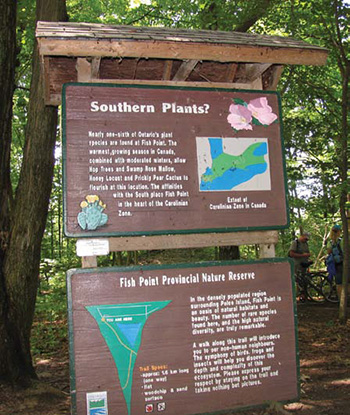
The Ontario Parks Natural Heritage Education program helps visitors appreciate the natural and cultural heritage of provincial parks. It delivered approximately 8,300 interpretive programs, distributed one million interpretive publications and recorded about 2.8 million participants in 2008. Interpretive programming was matched to provincial parks with high visitation and included guided walks, evening programs and children’s programs.
The 2006 Ontario Parks Consumer Survey shows demand for these programs is growing. When asked about their interest in a number of services that could be offered by provincial parks, 58 per cent expressed interest for educational workshops and 55 per cent for packaged learning vacations with a particular theme.
Ontario Parks uses several methods to share information and gather public commentary for planning and management purposes. These include direct mailings, open houses/public meetings, visitor comment cards, visitor surveys, internet postings and park and community bulletin boards.
Opportunities for scientific research
Provincial parks and conservation reserves are important to scientific research in Ontario for many reasons. For example, they incorporate Ontario’s largest and finest natural areas; they provide a wide range of research opportunities in natural settings; and they offer security for long-term studies of species and ecosystem trends.
Protected areas also offer a forum to communicate scientific information and to educate through structured and unstructured interpretive programs.
Research activities in provincial parks are guided by the Ontario Parks Research and Information Strategy and related regional and zone strategies. Ontario Parks sponsored research activities are funded on an annual or multi-year basis to address legislative, policy and program needs.
Protected areas provide opportunities to discuss and transfer scientific information to others.
Projects include basic resource inventories, evaluations of invasive species and research into species and ecosystems at risk. Projects also include more complex analysis of environmental, social and economic issues to assess human activity impacts and monitor ecological integrity.
All proposed research activities within provincial parks and conservation reserves must be authorized by MNR. Applications to conduct research are available at Ontario Parks.
A historical analysis of research in provincial parks showed that 1,059 research projects were approved between 1930 and 1997. Since 1997, another 670 research projects have been approved. Most of this research has focused on the life sciences (zoology, botany and ecology) followed by earth and social sciences.
In 2008, there were at least 160 approved research projects underway in provincial parks and conservation reserves. About 88 per cent of these were life science studies, seven per cent were earth science studies and five per cent were social science projects. These projects cover a wide range of topics, from provincial level forest resource inventories, to site specific investigations of salamanders. Other studies focused on human use impacts on species and the cultural use of protected areas through time.
During fiscal 2008-09, MNR invested more than $1.4 million, exclusive of permanent staff salaries, in protected area research, inventory and monitoring activities. This represents an increase in research, inventory and monitoring spending from $1.1 million in 2004-05.
In closing
The Provincial Parks and Conservation Reserves Act, 2006 requires that the Minister of Natural Resources report publicly on the state of the protected area system at least once every five years. This first State of Ontario’s Protected Areas Report fulfills that requirement. The creation of this report required the development of a comprehensive monitoring framework that addresses ecological, social and economic aspects of protected areas. MNR assembled information from a variety of sources, and completed extensive analysis to support the creation of this report and related technical documents. The process has been a great learning experience for MNR.
As of December 31, 2009, there were 330 regulated provincial parks, 294 regulated conservation reserves, 19 recommended new provincial parks and conservation reserves, and 11 wilderness areas. These cover approximately 9.7 million hectares of lands and waters, or about nine per cent of Ontario’s total area. Over 40 additional natural heritage designations provide varying degrees of protection to additional lands and waters. These areas protect elements of the rich natural and cultural diversity that exists across the province. They are of tremendous ecological, social and economic value to the people of Ontario.
Ontario has policy targets to establish specific classes and sizes of protected areas within various ecological regions. Wilderness class parks have been established in over half of Ontario’s ecoregions. Natural Environment class parks have been established in nearly half of Ontario’s ecodistricts. Waterway class parks have been established in over half of Ontario’s ecodistricts. Some of MNR’s targets for establishing protected areas are unlikely to be achieved in southern Ontario, where private land ownership and competing land uses make protection difficult. Achievement in the Far North may improve as a result of Far North land use planning decisions.
Representation of terrestrial ecosystems in protected areas is based on natural features within ecological districts. Achievement levels are quite variable across the province. Ontario’s geological representation requirements are based on time, landform evolution, and geological process, and are close to completion. Protected areas contain nearly one third of Ontario’s cultural heritage themes, which are based on activities and ways of life connected with the natural environment. While a representation framework for aquatic ecosystems is not yet developed for Ontario, scientific work to develop such a framework is underway.
MNR leads and participates in activities to systematically identify the most effective areas to conserve biodiversity. During 1996 to 2006, MNR and the Nature Conservancy of Canada protected over 17,000 hectares of ecologically significant lands and waters.
The Provincial Parks and Conservation Reserves Act, 2006 introduced the concept of ‘ecological integrity’ as a first principle in protected area management. While the term may be relatively recent, the concept has been in place as an underlying theme in protected area management for some time. Ecological integrity cannot be measured directly and only some aspects of ecosystems can be monitored. A well designed system of protected areas can enhance ecological integrity. MNR will continue to work to maintain the ecological integrity of protected areas throughout Ontario, now and for future generations.
Protected areas face numerous pressures, such as climate change, pollution, disruption of natural processes, and invasive and hyper-abundant species. Some of the responses to address the various pressures include participation in climate change strategies, the development of fire response and management plans, the ecological use of fire and species-specific management.
Invasive species are a concern in at least 50 provincial parks. Active education and control programs have been implemented in some. Management activities to control the impacts of hyper-abundant species including deer and cormorants are showing positive results. Regulated protected areas occupy less than one per cent of the Mixedwood Plains Ecozone of southern Ontario, but account for 15 per cent of all species at risk occurrences in the province.
Regulated hunting and trapping are permitted in the majority of Ontario’s protected areas. Sport fishing is permitted in all provincial parks and conservation reserves, except in designated fish sanctuaries. Over seven million fish were stocked in protected areas between 2001 and 2009.
Protected areas are many things to many people. Many people who do not visit protected areas still value Ontario’s protected area system for a variety reasons. They help conserve biodiversity and provide opportunities for people of Ontario and visitors from around the world to explore and participate in a variety of outdoor recreation activities. Sixty per cent of Ontario’s population live within 400 kilometres of one million hectares of protected area and 85 per cent of all operating provincial parks have at least one form of barrier free access.
Protected areas also play a role in learning and research. Protected areas serve as sites where students and researchers can conduct studies that expand our knowledge on a wide variety of topics. In 2008, there were at least 160 approved research projects underway in provincial parks and conservation reserves. In addition, the Ontario Parks Natural Heritage Education program delivers thousands of interpretive programs annually.
Fifty eight percent of Ontario residents have visited an Ontario provincial park in the past three years. With nearly than 10 million visits annually, protected areas provide economic benefits to local communities and the province through employment and the expenditures by those who make use of these natural areas. The capital assets of provincial parks are valued at over $1.2 billion. Money spent by Ontario Parks and visitors generates nearly $0.5 billion in value-added and thousands of person years of employment.
This first State of Ontario’s Protected Areas Report explains the foundations of Ontario’s diverse system of protected areas, and establishes baseline information that collectively describes its current state. This information provides a basis for comparison for future reporting on the state of Ontario’s world-class system of protected areas.
Selected references
Abraham, K.F. and C.E. Keddy. 2005. The Hudson Bay Lowland: A Unique Wetland Legacy. In: The World’s Largest Wetlands: Their Ecology and Conservation. L.H. Fraser and P.A. Keddy, Eds. Cambridge University Press, Cambridge. Chapter 4. pp. 118-148.
Beechey, T. 1980. A Framework for the Conservation of Ontario’s Biological Heritage. Ontario Ministry of Natural Resources, Parks and Recreational Areas Branch, Queen’s Park, Toronto, Ontario. 286 pp.
Bellhouse, T., M. Blake, C. Brdar, T. Marchand, J. Murphy, M. Proulx, J. Rosenthal, M. Shoreman and J. Sullivan. 2003. Ecological stress identification process for Ontario’s provincial parks. Pp. 143-149 In C.J. Lemieux, J.G. Nelson, T.J. Beechey and M.J. Troughton (eds.) Proceedings of the Parks Research Forum for Ontario. Ontario Parks, Peterborough, Ontario.
Beverage, M., J.G. Nelson and S. Janetos. Editors. 2004. Climate Change and Ontario’s Parks. Parks Research Forum of Ontario. State of the Art Workshop Series, Number 1. Dorset, Ontario. 88p. ISBN 0-9737544-2-7.
Colombo, S.J., D.W. McKenney, K.M. Lawrence, and P.A. Gray. 2007. Climate Change Projections for Ontario: Practical Information for Policymakers and Planners. Climate Change Research Report CCRR-05. Applied Research and Development Branch, Ontario Ministry of Natural Resources, Sault Ste. Marie, Ontario.
Crins, W.J., P.A. Gray, P.W.C. Uhlig, and M.C. Wester. 2009. The Ecosystems of Ontario, Part 1: Ecozones and Ecoregions. Ontario Ministry of Natural Resources; Science and Information Branch Technical Report SIB TER IMA TR-01.
Crins, W.J. and P.S.G. Kor. 2000. Natural Heritage Gap Analysis Methodologies Used by the Ontario Ministry of Natural Resources. Version 2.0. Open File Natural Heritage Technical Report 2000-1. Ontario Ministry of Natural Resources, Peterborough, Ontario.
Davidson, R.J. 1981. A Framework for the Conservation of Ontario’s Earth Science Features. Ontario Ministry of Natural Resources, Parks and Recreational Areas Branch, Open File Earth Science Report 8101.
Davis, R., L. Chora, and W.J. Crins. 2006. GapTool: An Analytical Tool for Ecological Monitoring and Conservation Planning. Proceedings of the Park Research Forum of Ontario. Pp. 139-150.
Deguise, I.E. and J. Kerr. 2006. Protected areas and prospects for endangered species conservation in Canada. Conservation Biology 20(1):48-55.
Environment Canada 2004. 2002 Annual Progress Report on the Canada-wide Acid Rain Strategy for Post-2000. Environment Canada.
Environics Research Group. 2006. Ontario Parks Consumer Survey: Final Report. Consultant Report prepared for Ontario Parks. Toronto, Ontario.
Environment Canada. 2004. An Invasive Alien Species Strategy for Canada. Environment Canada. 40pp.
Garrott, R.A., P.J. White and C.A. Vanderbilt White. 1993. Overabundance: an issue for conservation biologists? Conservation Biology 7:946-949.
Gray, P.A., D. Paleczny, T.J. Beechey, B. King, M. Wester, R.J. Davidson, S. Janetos, S.B. Feilders, and R.G. Davis. 2009. Ontario’s Natural Heritage Areas: Their Description and Relationship to the IUCN Protected Areas Classification System (A Provisional Assessment). Queen’s Printer for Ontario, Peterborough, Ontario, Canada. 356 pp.
Gregg, Kelly, Sullivan and Woolstencroft: The Strategic Counsel. 2009. Findings from the Ontario Parks Consumer Survey: Final Report. December. Consultant Report prepared for Ontario Parks. Toronto, Ontario.
Harmon, D., and Putney, A.D. 2003. The Full Value of Parks: From Economics to the Intangible. Lanham, Maryland: Rowman & Littlefield Publishers.
IUCN. 2000. IUCN Guidelines for the Prevention of Biodiversity Loss Caused by Alien Invasive Species. Fifth meeting of the Conference of the Parties to the Convention on Biological Diversity.
Kerr, J and J. Cihlar. 2004. Patterns and causes of species endangerment in Canada. Ecological Applications 14:743-753.
Killen, G. 1993. Protected Places: A History of Ontario’s Provincial Park System. Dundurn Press and the Queen’s Printer for Ontario. 426 pp.
Kordell, K., Bowker, M., Bergstrom, J., and G. Green. 2004. The Multiple Values of Wilderness. Forest Service Research and Development Department. University of Georgia. Athens. Georgia.
Lemieux, C.J., P.A. Zorn, T.J. Bellhouse and J.G. Nelson, Editors. 2007. Monitoring in Ontario’s Parks and Protected Areas. Parks Research Forum of Ontario. State of the Art Workshop Series, Number 2. Peterborough, January 2005. 83 pp. ISBN 0-9737544-3-5.
Lemieux, C.J. D.J. Scott, P.A. Gray and R.G. Davis. 2007. Climate Change and Ontario Parks: Towards an Adaptation Strategy. Ontario Ministry of Natural Resources, Applied Research and Development Branch, Sault Ste Marie, Ontario. Climate Change Research Report, Number 6. 81 pp. ISBN 978-1-429-3394-5.
Loomis, J.B. 2000. Economic Values of Protecting Roadless Areas in the United States. Consultant Report. Prepared for The Wilderness Society and Heritage Forests Campaign. Washington, D.C.
Lui, K., M. Butler, M. Allen, J. da Silva and B. Brownson. 2008. Field Guide to Aquatic Invasive Species- Identification, collection and reporting of aquatic invasive species in Ontario waters. Ontario Ministry of Natural Resources.
Morton, P. 2000. Wildland Eonomics: Theory and Practice. Technical Report. USDA Forest Service Proceedings. RMRS-P-15-Vol-2. 2000.
Noss, R. 1995. Maintaining Ecological Integrity in Representative Reserve Networks. WWF Discussion Paper.
Ontario Ministry of the Environment. 2004. Ontario’s Clean Air Action Plan: Protecting Environmental and Human Health in Ontario. Ontario Ministry of the Environment. Queen’s Printer for Ontario.
Ontario Ministry of Natural Resources. 1975. A Topical Organisation of Ontario History. Historical Sites Branch, Division of Parks. 208 pp.
Ontario Ministry of Natural Resources. 1992. Ontario Provincial Parks: Planning and Management Policies. Provincial Parks Branch. 90 pp.
Ontario Ministry of Natural Resources. 1994. Keep it Wild: Our Natural Heritage Areas. Tabloid. ISBN 0-7778-2187-7. Queen’s Printer for Ontario. Toronto March 9, 1994. 6 pp
Ontario Ministry of Natural Resources. 1997. Nature’s Best – Ontario’s Parks and Protected Areas: A Framework and Action Plan. Queen’s Printer for Ontario, Toronto. 37 pp.
Ontario Ministry of Natural Resources. 2002. Guidelines for stocking fish in inland waters in Ontario. Fisheries Section, Fish and Wildlife Branch.
Ontario Ministry of Natural Resources. 2003. Old Growth Policy for Ontario’s Crown Forests. Queen’s Printer for Ontario, Toronto. 26 pp.
Ontario Ministry of Natural Resources. 2004. Forest Fire Management Strategy for Ontario. Queen’s Printer for Ontario, Toronto. 64 pp.
Ontario Ministry of Natural Resources. 2005. A Class Environmental Assessment for Provincial Parks and Conservation Reserves. Queen’s Printer for Ontario.
Ontario Ministry of Natural Resources. 2005. Ontario Provincial Park Statistics. Operations and Development Section. Ontario Parks. Peterborough, Ontario.
Ontario Ministry of Natural Resources. 2005. Our Sustainable Future: Ministry of Natural Resources Strategic Directions. 29 pp.
Ontario Ministry of Natural Resources. 2005. Protecting What Sustains Us: Ontario’s Biodiversity Strategy. 44 pp.
Ontario Ministry of Natural Resources. 2009. 2008 Park User Survey. Ministry of Natural Resources. Ontario Parks. Planning and Research Section. Peterborough, Ontario.
Ontario Ministry of Natural Resources. 2009. Ontario’s Protected Areas Planning Manual. Peterborough. Queen’s Printer for Ontario. 50 pp.
Shantz, P., Rollins K., Johnson L., & Wistowsky, W. 2004. Study of the economic and social benefits of the nine Ontario living legacy signature sites: Analysis of Growth and Demand for Recreational Uses Associated with Parks. Final Report. Consultant Report. SENES Consulting. Toronto, Ontario: Ontario Parks.
Sverrisson, D., Boxall, P.,and Adamowicz, V. 2008. Estimation of the Passive Use Values Associated with Future Expansion of Provincial Parks and Protected Areas in Southern Ontario. Consultant Report. Department of Rural Economy. University of Alberta. Edmonton, Alberta.
The World Bank, TNC and IUCN. 2005. How Much is an Ecosystem Worth? Assessing the Economic Value of Conservation. The International Bank for Reconstruction and Development. Washington, DC.
Van Sleeuwen, M. 2006. Natural Fire Regimes in Ontario. Ontario Ministry of Natural Resources, Queen’s Printer for Ontario, Toronto. 143 pp.
Wiersma, Y.F., T.J. Beechey, B.M. Oosenbrug and J.C. Meikle. 2005. Protected Areas in Northern Canada: Designing for Ecological Integrity – Phase 1 Report. CCEA Occasional Paper No. 16. Canadian Council on Ecological Areas, CCEA Secretariat, Ottawa, Ontario, Canada.
Wistowsky, W.J. 1995. The net benefits of backcountry canoeing in Ontario’s wilderness parks: Results from a 1993 contingent valuation survey. Master’s thesis, Dept. of Agricultural Economics and Business, University of Guelph.
Glossary
- Abiotic:
- The non-living components of the environment.
- Aboriginal Peoples:
- The Constitution Act 1982 states that “Aboriginal Peoples of Canada” include the Indian, Inuit and Métis.
- Alien Species:
- Plants, animals and micro-organisms that have been accidentally or deliberately introduced into habitats outside their normal range.
- Alvar:
- A biological environment based on a limestone plain with thin or no soil and, as a result, sparse vegetation.
- Ancient and Recent:
- This period represents the time since the end of the Quaternary Period at the end of the last glaciation event about 11,000 years ago until the present.
- Areas of Natural Scientific Interest (ANSIs):
- Areas of land and water that represent significant geological (earth science) and biological (life science) features. Earth science ANSI include areas that contain examples of rock, fossil and landform features in Ontario. These features are the result of billions of years of geological processes and landscape evolution. Life science ANSI are areas that contain examples of the many natural landscapes, communities, plants and animals found in the 14 natural regions of the province. MNR identifies ANSI that are ‘provincially significant’ by surveying regions and evaluating sites to decide which have the highest value for conservation, scientific study and education.
- Backcountry:
- Interior or natural spaces of protected areas that are not accessible by car. Typically reached by canoe or hiking.
- Bedrock Geology:
- A general term that refers to the solid rock that lies beneath the soil and other surficial materials like sand and gravel. Bedrock geology is a major influence on the surface features and drainage patterns of the Earth. The bedrock geology of Ontario can be divided into two broad types based on age. The Precambrian Canadian Shield consists of very old, resistant rocks that range in age from 570 million to more than 3 billion years old. Ontario’s bedrock is also composed of younger Paleozoic and Mesozoic sedimentary rocks that range in age from 63 to 570 million years old and contain valuable deposits of salt, gypsum, oil, natural gas, groundwater, shale, lime, building stone and aggregate.
- Biodiversity:
- Biological diversity or biodiversity refers to the variety of life, as expressed through genes, species and ecosystems, that is shaped by ecological and evolutionary processes.
- Biotic:
- Any living aspect of the environment, especially population or community characteristics.
- Camper Nights:
- Is defined as one camper staying in a provincial park for one night. It is comprised of regular (car camping), group and interior (backcountry) campers.
- Car Camping:
- Use of identified campsites in protected areas which can be access by car (e.g. tent, trailer, RVs, yurt, cabin).
- Capital Asset:
- All tangible property which cannot easily be converted into cash and which is usually held for a long period, including real estate, equipment, etc.
- Conifers:
- Trees and shrubs belonging to the order Coniferales, usually evergreen with cones and needle- shaped leaves. Also referred to as softwoods.
- Drumlins:
- An extended, oval hill or ridge of compacted sediment deposited and shaped by a glacier.
- Earth Science:
- The physical elements of the natural landscape created by geological processes and distinguished by their composition, structure and internal layering or stratigraphy and by their relief, contour and spatial distribution or topography.
- Ecological Integrity:
- A condition in which biotic and abiotic (i.e. living and non-living) components of ecosystems and the composition and abundance of native species and biological communities are characteristic for their natural regions and rates of change and ecosystem processes are unimpeded.
- Ecosystem:
- a unit of organisms interacting at multiple scales and the abiotic resources on which they depend as a functional and integrated whole.
- Esker:
- A long, narrow, steep-sided ridge of coarse sand and gravel deposited by a stream flowing in or under a melting sheet of glacial ice.
- Expenditure:
- Actual payment of cash or cash-equivalent for goods or services.
- Far North Ontario:
- The Far North spans the whole width of Northern Ontario, from Manitoba in the west, to James Bay and Quebec in the east. At 452,000 km2, the Far North is 42 per cent of the area of Ontario and includes one of the world’s largest, most intact ecological systems. The Far North is home to more than 24,000 people living in 34 communities, most of which are First Nations.
- Forest Resources Inventory (FRI):
- A composite information product which is assembled from a collection of individual geographic information coverages that contain descriptive information about the timber resource on each management unit (e.g. stand age, stand height, species composition, stocking (level)). The forest resources inventory for a management unit divides the area into a number of components, such as water, non- forested, non-productive forest and productive forest, and further classifies each component by ownership/land use categories.
- Hardwood:
- Trees that have broad leaves, in contrast to the needle-bearing conifers.
- Invasive Species:
- Those alien species whose introduction or spread threatens the environment, the economy and/ or society, including human health.
- Kame:
- A small hill or ridge consisting of layers of sand and gravel deposited by a meltwater stream at the margin of a melting glacier.
- Kettle:
- depression left in a mass of glacial drift, formed by the melting of an isolated block of glacial ice.
- Management Direction:
- Includes a management statement and a management plan for a provincial park or conservation reserve. Management directions provide policy for the management of protected areas.
- Management Plan:
- A document that provides a policy and resource management framework (managment direction) that addresses substantial and complex issues or proposals or both for substantial capital infrastructure or resource management projects for one or more provincial parks or conservation reserves or for a combination of them.
- Management Statement:
- A document that provides policy and resource management framework (management direction) that addresses a limited number of non-complex issues or proposals or both for limited capital infrastructure or resource management projects for one or more provincial parks or conservation reserves or for a combination of them.
- Mesozoic:
- The era of geologic time from about 250 to 70 million years ago. It is characterized by the development of flying reptiles, birds, and flowering plants and by the appearance and extinction of dinosaurs.
- Mixedwoods:
- A forest type in which 26 to 75 per cent of the canopy is conifer.
- Moraine:
- A mass of debris, carried by glaciers and forming ridges and mounds when deposited.
- Natural Heritage:
- All living organisms, natural areas and ecological communities that we inherit and leave to future generations.
- Non-operating Provincial Park:
- Parks that do not have established operating dates or public use facilities.
- Old Growth Forest:
- Old Growth forests are characterized by large, widely spaced trees; many layers of foliage with gaps in the forest canopy; large dead standing trees, masses of downed woody material; up-turned stumps, roots and soil mounds; and more mature trees dying than in younger forest stands.
- Operating Provincial Parks:
- Parks that have established operating dates, park staff and facilities.
- Outwash Fans:
- A fan-shaped body of sediments deposited by streams from a melting glacier.
- Palaeozoic:
- An era of geological time that began 540 million years ago and lasted until about 250 million years ago. It is characterized by the abundance of invertebrates and the emergence of vertebrates, including aquatic and terrestrial amphibians and reptiles.
- Park Classification:
- Organizes provincial parks into broad categories, each of which has particular purposes and characteristics as well as distinctive planning, management and visitor services policies.
- Precambrian:
- The earliest geological period from about 4.6 billion to 540 million years ago. During the Precambrian Eon primitive forms of life first appeared on Earth.
- Prescribed Burn:
- The knowledgeable application of fire to a specific land area to accomplish pre-determined forest management or other land use objectives.
- Pressure:
- Any natural disturbance or human activity or facility that has a negative or positive impact on a protected area value.
- Protected Area:
- Refers to a provincial park or conservation reserve either proposed, recommended or existing in regulation.
- Quaternary:
- The Quaternary Period is the most recent of the three periods of the Cenozoic Era in the geologic time scale occurring from about 2.5 million years ago until the period of the last glaciation. The Quaternary Period represents the time during which recognizable humans have inhabited the Earth and has been characterised by repeated glaciation. Examples in Ontario of the other periods of the Cenozoic Era have been largely eroded by the glaciation of the Quaternary Period.
- Recommended Protected Area:
- An area included as a recommended provincial park or conservation reserve in an approved land use direction, but not yet in regulation. Recommended protected areas are under interim protection from industrial activities and land dispositions.
- Regulated Protected Area:
- Refers to the application of land use designations to specific areas (e.g. regulated conservation reserve or provincial park) through the approval by the Lieutenant Governor-in-Council of a regulation under a piece of legislation (e.g. Provincial Parks and Conservation Reserves Act, 2006).
- Softwood:
- Cone-bearing trees with needles or scale-like leaves belonging to the botanical group Gymnospermae.
- Species at Risk:
- The categories of species listed by MNR on its Index List of Special Concern, Threatened, Endangered, Extirpated or Extinct Species of Ontario, as amended from time to time.
- Spillway:
- A channel that carries excess water over or around a dam or other obstruction.
- Surficial Geology:
- Refers to those materials lying on top of the bedrock. Although the Quaternary era covers the last 1.81 million years of earth history, in Ontario almost all surficial sediments are much younger (<45,000 years old). The sediments were deposited either during or after the last glacial period. Common surficial materials include sand and gravel, glacial tills and clay and silts.
- Terms of Reference:
- A guide for the planning process, which a planning team follows during the preparation of management direction. It identifies the task(s); describes who will perform the task and in what capacity; explains how and when the work will be done; and gains approval to proceed.
- Till Soils:
- An unstratified glacial deposit consisting of rock fragments of various sizes.
- Treaty Rights:
- The specific rights of Aboriginal peoples embodied in the treaties they entered into with a Crown government, initially Britain and after confederation, Canada. They may address matters such as the creation of reserves and the rights of Aboriginal communities to hunt and fish. Existing treaty rights are recognized and affirmed by Section 35 (1) of the Constitution Act, 1982.
- Value:
- A specific attribute or feature (Aboriginal, cultural, ecological or recreational) or ecological process within a protected area that may require additional/ special consideration during the planning process and subsequent management.
- Value Added:
- The value added concept is an often used indicator of economic activity. It is a measure of net output and avoids double-counting by including only sale of final goods. Value added may be calculated by adding wages, interest, rent and profits or by calculating revenues minus the total cost of purchased inputs (materials and services). Value added refers to the contribution of the factors of production (i.e. land, labour, and capital goods) to raising the value of a product and corresponds to the incomes received by the owners of these factors.
- Zoning:
- A tool used to delineate areas within a protected area, often containing certain values, where a discrete set of policies may be applied to enable the achievement of site objectives.
Acknowledgements
The Ministry of Natural Resources would like to thank everyone who participated in the development of this report and acknowledge the following individuals for the content they contributed:
- Jennie Aikman
- Tim Bellhouse
- Mandy Bidwell
- Laura Bjorgan
- Matthew Blundell
- George Cordiner
- Kendra Couling
- Bill Crins
- Bob Davidson
- Rob Davis
- Kirsty Dickson
- Harold Doran
- Jake Formsma
- Paul Gray
- Karen Hartley
- Phil Kor
- Ryan Large
- Anna Lawson
- Peter Masson
- Kathy McPherson
- Dan Mulrooney
- Dan Paleczny
- Debrupa Pathak
- Heather Patterson
- Christine Phair
- Richard Phillips
- Sally Renwick
- Kim Taylor
- Bill Thompson
- Mary van Sleeuwen
- Tasha Veer
- Catherine Warren
- Will Wistowsky
- Gregory Young
62698
(0750 P.R. 11 04 11)
ISBN 978-1-4435-6323-9 (print)
Footnotes
- footnote[1] Back to paragraph Includes the Algonquin Provincial Park Recreation/Utilization Zone (594,860 ha).
- footnote[2] Back to paragraph Number not included in total number of protected areas because they are additions to existing protected areas.
- footnote[3] Back to paragraph Only includes wilderness areas that are outside of existing protected areas.
- footnote[4] Back to paragraph International Union for the Conservation of Nature category names do not coincide with provincial or federal protected area categories.
- footnote[5] Back to paragraph Excludes Algonquin Provincial Park Recreation/Utilization Zone (594,860 ha).
- footnote[6] Back to paragraph The Recreation/Utilization Zone in Algonquin Provincial Park is a partially protected area and therefore does not qualify for designation in the IUCN classification.
- footnote[7] Back to paragraph Some protected areas overlap ecozone boundaries
- footnote[8] Back to paragraph Targets for representing geologic themes are provincial in scope and are achieved through provincial parks, conservation reserves and areas of natural and scientific interest (ANSIs).
- footnote[9] Back to paragraph See Lemieux et al. 2007.
- footnote[10] Back to paragraph Provincial parks, conservation reserves, wilderness areas and national parks.
- footnote[11] Back to paragraph Regulated areas plus conservation authority lands, Nature Conservancy of Canada properties, Ontario Nature properties, etc.
- footnote[12] Back to paragraph count of additions are not included in the total number, but addition area is included in total area.
- footnote[13] Back to paragraph See Shantz and others, 2004.
- footnote[14] Back to paragraph See Wistowsky, 1995
- footnote[15] Back to paragraph See Shantz and other, 2004.
- footnote[16] Back to paragraph “Value added” is a measure of net output and includes only the sale of final goods. It can be determined by calculating revenues minus the total cost of purchased inputs.
- footnote[17] Back to paragraph A “person year of employment” is equal to one person working full time for one year.
- footnote[18] Back to paragraph More recently, some economists and natural scientists have reclassified the components of the TEV as ecosystem goods and services (EG&S) or ecosystem services (ES).
- footnote[19] Back to paragraph See Sverrisson and others, 2008.