2015 Survey of recreational fishing in Canada: selected results for Ontario fisheries
Learn about the recreational fishing activities of anglers in Ontario and how we assess the economic and social importance of Ontario’s recreational fisheries.
This technical report should be cited as follows: Ontario Ministry of Natural Resources and Forestry. 2020. 2015 Survey of Recreational Fishing in Canada: Selected Results for Ontario Fisheries. Fish and Wildlife Policy Branch. Ontario Ministry of Natural Resources. Peterborough, Ontario. 47 p. + appendices.
Print: 978-1-4868-4726-6
HTML: 978-1-4868-4727-3
PDF: 978-1-4868-4728-0
This publication was produced by: Fisheries Policy Section
Fish and Wildlife Policy Branch
Ontario Ministry of Natural Resources
300 Water Street, Peterborough, Ontario K9J 8M5
This specialized publication, 2015 Survey of Recreational Fishing in Canada: Selected Results of Ontario Fisheries is available in English only according to Regulation 411/97 which exempts it from translation under the French Language Services Act. To obtain information in French, please contact the ministry at helen.ball@ontario.ca.
Executive summary
The 2015 Survey of Recreational Fishing in Canada collected information from anglers about their recreational fishing activities to assess the economic and social importance of recreational fisheries to Canada’s provinces and territories. As part of this survey, anglers who fished in the province of Ontario were asked additional questions about the locations fished, the number of fish caught and harvested by species as well as other socio-economic information regarding their fishing activities.
Highlights
- Anglers spent 1.75 billion dollars on trip expenses and investments to fish in 2015.
- 1.5 million anglers fished in Ontario in 2015; 1.2 million adult anglers over the age of 18 years and 324,000 children.
- 68% of anglers over the age of 18 years are Ontario residents, 27% originate from the United States and 5% from other provinces.
- Visitors took 607,000 trips to Ontario to fish, resulting in 1.9 million nights of accommodation.
- The average age of adult anglers fishing in Ontario is 51 years and 81% are male.
- Anglers spent 14.4 million days and 74.6 million hours fishing in Ontario.
- Lake Erie, Lake Ontario, Lake Huron & Georgian Bay, Lake Simcoe, Lake of the Woods, Lake Nipissing, Ottawa River, St. Lawrence River, Grand River, Lake St. Clair and Rice Lake were the most frequently fished water bodies.
- Walleye is the most targeted species.
- Anglers caught approximately 72 million and harvested 13 million fish in Ontario.
- Walleye, bass, yellow perch, smallmouth bass and northern pike were the most caught and harvested species.
- 79% of anglers reported their fishing experience as excellent, very good or good in Ontario.
1.0 Introduction
There are 250,000 inland lakes and countless kilometres of rivers and streams in Ontario. These lakes along with the Great Lakes, support large recreational fisheries; each year millions of resident and non-resident anglers participate in sport fishing, spending more than $1.75 billion dollars in Ontario.
The 2015 Survey of Recreational Fishing in Canada is the ninth in a series of federal - provincial surveys carried out every five years since 1975. The survey provides status and trend information on the nature and size of Ontario’s recreational fishery and its economic contribution to the province. The results of past surveys have been used in numerous ways by government and non-government agencies, industries, and the public. In Ontario, they have been used as a source for Fisheries Management Zone planning, State of Biodiversity and Natural Resources reporting, policy and regulation development, general resource management, and tourism promotion programs.
The ministry contacted 42,611 Ontario residents, Canadian residents and U.S. non-resident anglers inviting them to complete the 2015 Recreational Fishing Survey in February 2016. All contacts were made through mail, approximately half of the anglers were invited to complete the survey online and provided a code (20,606) and half were sent a paper survey (22,005) with a return postage paid envelope. The latter group includes 742 anglers who were originally invited to complete the survey online but requested a paper copy. Two follow up contacts were made by mail to both groups prompting them to respond.
Anglers were asked to report on their 2015 fishing activities, and provided information on angler characteristics, fishing locations, fishing effort and harvest, expenditures, and preferences. Terms used throughout this document are defined in Section 3.0.
2.0 Sampling methodology
A total of 1,265,104 anglers held valid fishing licences in 2015. Anglers were selected using stratified random sampling with stratification based on licence category and region of licence sales. Ontario resident anglers (18-65 years old) were stratified by licence type and postal code and then randomly selected from electronic licensing records held in the ministry’s Licensing Database (LAS) (Table 1 and 2). Similarly, Canadian and U.S. non-resident anglers were randomly selected from electronic licensing records but were stratified by licence type only.
Ontario senior residents (65+ years) are deemed to be the holder of a recreational fishing licence in Ontario. They were surveyed by contacting a random selection of anglers born between 1945 and 1950 with an outdoors card, with a fishing license issue date of 2010 or later, stratified by license type and postal code, from LAS. Some anglers over 65 years also purchased a license and if selected to be surveyed as an Ontario resident angler, they were pooled with this group.
Surveys were sent to 42,611 anglers. The sample consisted of 25,561 Ontario resident anglers (18-64 years of age) and 2,784 Ontario resident senior anglers (65+ years) (Table 2), 2,271 Canadian resident anglers, and 11,995 U.S. non-resident anglers (Table 3).
Table 1 – Numbers of individuals with fishing licenses in Ontario by residency and license type in 2015
Three year sport licences include those purchased in 2013, 2014 and 2015, some anglers hold multiple licences.
| Residency | Licence type | Number |
|---|---|---|
| Ontario | 3–year sport | 238,212 |
| Ontario | 3–year conservation | 157,881 |
| Ontario | 1–year sport | 220,603 |
| Ontario | 1–year conservation | 252,822 |
| Ontario | 1–day sport | 19,742 |
| Canadian (outside Ontario) | 3–year sport | 3,521 |
| Canadian (outside Ontario) | 3–year conservation | 2,208 |
| Canadian (outside Ontario) | 1–year sport | 13,171 |
| Canadian (outside Ontario) | 1–year conservation | 16,058 |
| Canadian (outside Ontario) | 1–day sport | 19,621 |
| U.S. non-resident | 3–year sport | 2,894 |
| U.S. non-resident | 3–year conservation | 2,433 |
| U.S. non-resident | 1–year sport | 40,003 |
| U.S. non-resident | 1–year conservation | 28,680 |
| U.S. non-resident | 1–day sport | 23,077 |
| U.S. non-resident | 8–day conservation | 116,922 |
| U.S. non-resident | 8–day sport | 107,256 |
Table 2 – Ontario resident and resident senior sample sizes by postal code region and licence type
| Postal code | 3-year sport | 3-year conservation | 1-year sport | 1-year conservation | 1-day | Seniors 65+ | Total sample size |
|---|---|---|---|---|---|---|---|
| K | 531 | 480 | 1,470 | 2,209 | 116 | 594 | 5,400 |
| L | 820 | 710 | 2,547 | 4,085 | 314 | 778 | 9,254 |
| M | 166 | 157 | 796 | 1,149 | 192 | 196 | 2,656 |
| N | 735 | 515 | 1,810 | 2,371 | 134 | 636 | 6,201 |
| P | 958 | 165 | 2,421 | 629 | 81 | 580 | 4,834 |
| Total | 3,210 | 2,027 | 9,044 | 10,443 | 837 | 2,784 | 28,345 |
Table 3 – Canadian and U.S. non-resident angler sample sizes by licence type
| Licence type | Canadian residents (outside Ontario) | U.S. non-residents |
|---|---|---|
| 3-year sport | 58 | 33 |
| 3-year conservation | 35 | 37 |
| 1-year sport | 529 | 1,473 |
| 1-year conservation | 618 | 1,091 |
| 1-day | 1,031 | 3,813 |
| 8-day sport | Not applicable | 4,599 |
| 8-day conservation | Not applicable | 949 |
| Total | 2,271 | 11,995 |
2.1 Response rate and weighting
Of the 42,611 contacts, 9,182 were returned and contained usable information, giving an overall response rate of 21.5%. When looking at the response rate by angler category, Ontario resident seniors (65+ years) had the highest response rate (33.8%), followed by U.S. non-resident anglers (29.6%), Ontario residents (16.9%), and Canadian residents (16.0%). Response rates may have been lower in 2015 than 2010 because the survey was sent out 1 month later than in previous years, the survey was longer and more complex, incentives were not offered, and the online version was not user friendly.
To ensure that the entire angler population was represented in the analysis, the data for each responding angler was weighted. Each angler who responded to the survey has two weightings; one being the respondent weight, and the other being the household weight. The respondent weight is used to calculate the fishing activity and opinion questions, while the household weight is used for expenditure calculations according to Hogg (2010).
2.2 Statistical reliability of the survey estimates
The quality of data used in this report is affected by sampling and non-sampling errors. To measure sampling errors, information is presented in terms of the Relative Standard Error (RSE). Since the exact estimates of variation cannot be calculated, the RSE is used as a proxy for assessing the variance in the data. The RSE for major variables is shown below (Table 4), and the RSE values for some of the other data are presented with the data estimates throughout the report. The majority of data at a provincial scale has an RSE within acceptable limits for all angler groups, except Canadian residents.
The ranges for the RSE listed below provide some guidelines as to how the data can be used and its limitations.
- Less than 16.5%: data can be used without condition.
- 5% to 33.5%: data should be used with caution.
- Greater than 33.5%: data should be used with extreme caution.
Note that under Statistics Canada’s guidelines, data with an RSE of greater than 33.5% should not be published.
Non-sampling errors can also influence the quality of the data in the survey. Anglers may not understand or may misinterpret a question, they may introduce recall bias when they cannot remember an exact number, or they may make an error when entering data. There is evidence of a recall bias in the species caught and harvested data. For instance, anglers who indicated that they caught a lot of a particular species tended to round the number of fish caught to even 100’s (e.g. 100 or 200 or counts ending in 0 or 5 (e.g. 5, 10, or 15).
Species misidentification is another source of error. Anglers may not be able to correctly distinguish between the various species of bass, trout, or salmon, and although some effort has been made to correct some species data in this report, not all errors have been identified.
Table 4 - Relative standard error (RSE) of selected variables expressed in percent (%)
| Angler group | Sample size | Days fished | Fish caught | Fish kept | Consumables | Investments (wholly and partial) | Investments (wholly) | Package deals |
|---|---|---|---|---|---|---|---|---|
| Ontario residents (65 years old plus) | 942 | 5.6 | 7.6 | 12.3 | 5.5 | 7.5 | 7.2 | 15.9 |
| Ontario residents (18 to 64 years old) | 4,322 | 2.3 | 3.9 | 4.6 | 2.5 | 6.4 | 7.5 | 8.9 |
| Canadian residents | 363 | 8.7 | 14.2 | 15.1 | 8.4 | 18.2 | 17.4 | 15.4 |
| U.S. non-residents | 3,555 | 1.7 | 2.2 | 4.0 | 2.1 | 10.6 | 12.2 | 2.6 |
| Total | 9,182 | 1.6 | 2.0 | 3.0 | 1.5 | 5.2 | 5.3 | 2.5 |
2.3 Data comparison between surveys – post survey adjustments
Generally, the 2015 survey is comparable to previous surveys going back to 1995. Participation, effort, and harvest may have been overestimated in 1995, as the total number of licenced anglers was reported differently to the Department of Fisheries and Oceans. Also, any comparisons to surveys prior to 1995 is not advised as all surveys prior to the 1995 survey used samples which were derived from telephone pre-screening to identify anglers and selecting prospective survey recipients at random.
Non-responsive anglers represent a significant portion of the survey population and not having any information from these anglers affects the results of the survey. For example, anglers with higher rates of fishing are more likely to complete the survey than anglers who fished very little or not at all. An adjustment for these biases, is required to ensure the reported results are not higher than the actual values.
Non-response surveys were carried out in 2000 and 2010, but not in 2005 or 2015. DFO adjusted the weights in the raw data to account for the non-response bias in 2000 and 2010, prior to sharing the data with Ontario. Since a non-response survey was not conducted in 2005 or 2015, the 2005 values were adjusted by an average of the 2000 and 2010 adjustment rates, and the 2015 values were adjusted with the 2010 non-response adjustment rates (Table 5).
Table 5 – Non-response adjustment rates applied to the 2000, 2005, 2010, and 2015 data expressed in percent (%)
| Survey year | Angler category | Adjustment Rate for: active anglers | Adjustment rates for: days and hours fished | Adjustment rate for: economic data | Adjustment rate for: catch and harvest |
|---|---|---|---|---|---|
| 2000 | Resident (18 to 64 years old) | Unknown | -11.50 | -7.80 | -10.70 |
| 2000 | Non-resident | Unknown | 0.0 | 0.0 | 0.0 |
| 2000 | Resident (65 years old plus) | Not surveyed | Not surveyed | Not surveyed | Not surveyed |
| 2005 | Resident (18 to 64 years old) | -1.8 | 14.25 | -6.90 | -13.85 |
| 2005 | Non-resident | -1.8 | -8.50 | -3.00 | -8.50 |
| 2005 | Resident (65 years old plus) | Not surveyed | Not surveyed | Not surveyed | Not surveyed |
| 2010 and 2015 | Resident (18 to 64 years old) | -1.8 | -16.60 | -6.00 | -16.60 |
| 2010 and 2015 | Non-resident | -1.8 | -16.60 | -6.00 | -16.60 |
| 2010 and 2015 | Resident (65 years old plus) | -1.8 | -16.60 | -6.00 | -16.60 |
3.0 Terms used
- Active angler
- An angler who held a licence and fished in 2015.
- Angler category
- One of the four categories of anglers: Ontario resident senior (65+ years), Ontario resident (18-64 years), Canadian Resident (18+ years), and U.S. non-resident (18+ years).
- Bass
- Amalgamation of smallmouth bass and largemouth bass in the analysis and reporting.
- Consumables
- Costs associated with goods and services (i.e. food, accommodation, licence fees, etc.) which were incurred during the process of fishing in Ontario.
- Days fished
- A day, or any part of a day, during which an angler fished in Ontario.
- Deemed licence holder
- Anyone who fishes in Ontario under the age of 18, and Ontario and Canadian residents 65 years or older.
- Fish caught
- The total number of fish an angler caught in 2015.
- Fish kept
- The total number of fish an angler kept in 2015.
- Fishing trip
- Where the border into Ontario is crossed for the purpose of fishing.
- Fisheries Management Zone (FMZ)
- The province is broken down into 20 different zones.
- Household
- The number of adult anglers residing in the same dwelling.
- Package deal
- Any monies paid to an Ontario lodge or outfitter or their agent for a range of services, such as lodging, food, transportation, etc. Types of package deals include fly-in camps, lodges, charter boats/planes, outfitters, etc.
- Recreational fishing
- Refers to any non-commercial fishing activity. Ceremonial and subsistence fishing are not covered by the survey, and no attempt has been made in this report to include these activities in the estimates presented.
4.0 Survey results – province wide
4.1 Angler profile
In 2015, there were a total of 1.66 million anglers in Ontario; 1.25 million of them were licensed and 90% actively participated in fishing (Table 6). There were an additional 58,000 anglers over 65 years of age and 324,253 children with a deemed license that were also actively fishing. Overall the number of anglers has declined since 1995. In 2015, the number of resident anglers declined since 2010 but there was an increase in Canadian resident and U.S. non-resident anglers fishing in Ontario (Table 6).
Table 6 - Number of active and inactive anglers, including percent active, in 2015. Values from 2000, 2005 and 2010 are also included.
Ontario resident seniors were not surveyed in 2010 and children were reported by surveyed anglers as the number of household members under 18 years of age who fished in Ontario in 2015
| Angler group | Number of active anglers in 2000 | Number of active anglers in 2005 | Number of active anglers in 2010 | Number of active anglers in 2015 | Number of inactive anglers in 2015 | Total number of anglers in 2015 | Percent active anglers in 2015 |
|---|---|---|---|---|---|---|---|
| Ontario resident adults (18 to 64 years old) | 814,887 | 750,615 | 877,200 | 756,371 | 111,313 | 867,683 | 87% |
| Ontario resident seniors (65 years old plus) | Not available | Not available | 56,350 | 57,114 | 31,079 | 88,193 | 65% |
| Canadian resident | 41,130 | 28,552 | 29,899 | 59,057 | 3,014 | 62,071 | 95% |
| U.S. non-resident | 565,769 | 464,001 | 308,211 | 315,489 | 6,194 | 321,684 | 98% |
| Children (less than 18 years) | 522,059 | 421,613 | 370,435 | 324,253 | Not available | 324,253 | Not available |
| All angler groups | 1,943,845 | 1,664,781 | 1,642,095 | 1,512,284 | 151,600 | 1,663,884 | 89% |
| All licensed anglers | Not available | Not available | Not available | 1,130,917 | 120,521 | 1,251,438 | 90% |
4.2 Angler origin
4.2.1 Resident anglers
Anglers from all over the province participated in recreational fishing; more than 82% of Ontario anglers resided in southern Ontario, and the largest portion (32%) originated from the postal code L region (Greater Toronto Area) (Figure 1).
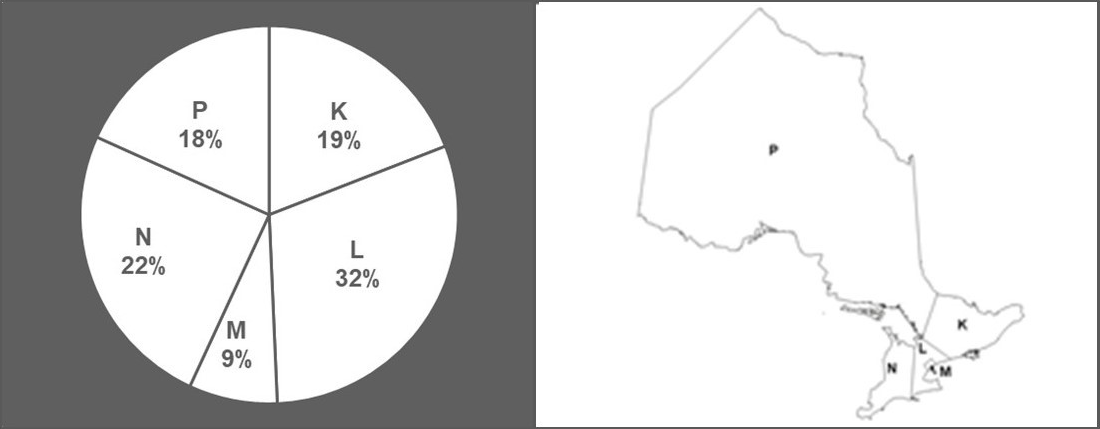
Figure 1 - Ontario resident angler origin by postal code region and map showing postal code regions in Ontario.
4.2.2 Canadian anglers
Anglers came from all provinces and territories, with the exception of Prince Edward Island, Northwest Territories and Yukon. 85% of Canadian anglers who fished in Ontario came from either Quebec (46%) or Manitoba (39%). The number of Canadian anglers increased in 2015, and although the top five provinces of origin remained the same, the number of anglers from Quebec surpassed those from Manitoba (Table 7).
Table 7 - Canadian angler (inactive and active) origins in 2005, 2010 and 2015 expressed in percent (%)
| Province of origin | 2005 | 2010 | 2015 |
|---|---|---|---|
| Manitoba | 56 | 51 | 40 |
| Quebec | 29 | 35 | 46 |
| Alberta | 8 | 6 | 6 |
| British Colombia | 4 | 5 | 3 |
| Other | 3 | 3 | 4 |
| Total number | 31,474 | 31,351 | 62,071 |
4.2.3 U.S. non-resident anglers
U.S. non-resident anglers originated from 47 States in 2015, and the number of anglers increased between 2010 and 2015. Similar to 2010, the majority of non-resident anglers originated from states bordering Ontario: Minnesota, Wisconsin, Michigan, Ohio, Illinois and Pennsylvania (Table 8).
Table 8 - State of origin of U.S. non-resident anglers (2005-2015) expressed in percent (%)
| State of Origin | 2000 | 2005 | 2010 | 2015 |
|---|---|---|---|---|
| Minnesota | 14 | 19 | 20 | 19 |
| Wisconsin | 11 | 12 | 14 | 14 |
| Michigan | 16 | 15 | 8 | 12 |
| Ohio | 15 | 10 | 7 | 9 |
| Illinois | 7 | 9 | 8 | 8 |
| Pennsylvania | 6 | 6 | 10 | 8 |
| Iowa | 4 | 6 | 6 | 5 |
| New York | 5 | 4 | 5 | 4 |
| Indiana | 5 | 5 | 3 | 3 |
| Missouri | 2 | 2 | 2 | 2 |
| Other | 15 | 14 | 17 | 16 |
4.2.4 Angler age and gender
In 2015, 81% of all anglers fishing in Ontario were male, and nearly 90% of U.S. non-resident anglers were male (Table 9). The average age of all active anglers was 51 years old in 2015; male anglers were older than female anglers (Table 10). The average age of anglers fishing in Ontario has increased since 2000 (Table 10). Most anglers were older than 45 years (Table 11).
Table 9 - Male and female anglers from 2005 to 2015 expressed in percent (%)
| Angler group | 2005 Male | 2005 Female | 2010 Male | 2010 Female | 2015 Male | 2015 Female |
|---|---|---|---|---|---|---|
| Ontario resident seniors (65 years old plus) | Not applicable | Not applicable | 90.6 | 9.4 | 84.3 | 15.7 |
| Ontario resident adults (18 to 64 years old) | 73.6 | 26.4 | 74.8 | 25.2 | 77.8 | 22.2 |
| Canadian resident | 84.9 | 15.1 | 85.9 | 14.1 | 80.5 | 19.5 |
| U.S. non-resident | 89.3 | 10.7 | 88.2 | 11.8 | 89.3 | 10.7 |
| All angler groups | 79.7 | 20.3 | 78.9 | 21.1 | 81.3 | 18.7 |
Table 10 - Average age of active anglers by gender in 2015 and combined from 2005 to 2015
| Angler group | Average age combined in 2005 | Average age combined in 2010 | Average age of males in 2015 | Average age of females in 2015 | Average age combined in 2015 |
|---|---|---|---|---|---|
| Ontario resident seniors (65 years old plus) | Not applicable | Not applicable | 68 | 68 | 68 |
| Ontario resident adults (18 to 64 years old) | Not applicable | Not applicable | 48 | 46 | 48 |
| Canadian resident | Not available | Not applicable | 51 | 47 | 50 |
| U.S. non-resident | Not applicable | Not applicable | 60 | 57 | 59 |
| All angler groups | 48 | 49 | 53 | 48 | 51 |
Table 11 - Total number of active anglers and percent (%) by angler group by age category in 2015
| Angler group | 18-24 | 25-34 | 35-44 | 45-54 | 55-64 | 65+ | Total number |
|---|---|---|---|---|---|---|---|
| Ontario resident seniors (65 years old plus) | Not applicable | Not applicable | Not applicable | Not applicable | Not applicable | 100 | 57,114 |
| Ontario resident adults (18 to 64 years old) | 4 | 14 | 18 | 28 | 33 | 3 | 756,371 |
| Canadian resident | 2 | 12 | 19 | 23 | 35 | 9 | 59,057 |
| U.S. non-resident | 1 | 4 | 8 | 18 | 30 | 39 | 315,489 |
| All angler groups | 36,215 | 126,384 | 174,898 | 279,612 | 366,217 | 204,706 | 1,188,032 |
4.3 Fishing activity
1.2 million (98%) active anglers in Ontario fished during the open water season and 230,000 (19%) fished through the ice in 2015 (Table 12). 9% of anglers only fished through the ice and the remaining 91% fished in both seasons. Most anglers who ice fished in 2015 were Ontario residents (94%). The number of anglers participating in ice fishing increased between 2000 and 2010, and then declined in 2015 (Table 12).
Table 12 - Number of anglers participating in open water and ice fishing from 2005 to 2015
Exceeds total number of anglers reported in Table 6 because some anglers fished open water and ice.
| Angler group | 2005 open water | 2010 open water | 2015 open water | 2005 ice fishing | 2010 ice fishing | 2015 ice fishing |
|---|---|---|---|---|---|---|
| Ontario resident seniors (65 years old plus) | Not applicable | 45,832 | 55,939 | Not applicable | 13,965 | 12,584 |
| Ontario resident adults (18 to 64 years old) | 753,172 | 846,947 | 741,931 | 191,988 | 244,805 | 198,753 |
| Canadian resident | 28,107 | 28,888 | 57,302 | 3,427 | 5,396 | 5,523 |
| U.S. non-resident | 462,390 | 304,616 | 312,326 | 19,062 | 10,110 | 9,037 |
| Total | 1,243,669 | 1,226,283 | 1,167,498 | 214,477 | 274,276 | 225,897 |
4.3.1 Canadian and U.S. non-resident fishing trips
The total number of fishing trips taken by Canadian resident and U.S. non-resident anglers in 2015 was 607,533 (Table 13), with 71% of these trips being taken by U.S. non-resident anglers. The average number of fishing trips made by Canadian anglers increased since 2010, however the number of nights spent in Ontario by this group declined. Since 2000, the number of fishing trips taken by U.S. non-residents to Ontario has steadily declined but the average number of fishing trips has remained constant.
Canadian resident and U.S. anglers reported making 919,024 trips to Ontario in 2015. Of these trips, 76% indicated that fishing was the primary reason for making the trip (Table 14). If there had been no fishing opportunities in 2015, 79% of U.S. non-resident and 37% of Canadian anglers would not have visited Ontario (Table 14).
Table 13 - Trip statistics for Canadian and U.S. anglers from 2000 to 2015
| Angler trips | 2000 Canadian | 2000 U.S. | 2000 Total | 2005 Canadian | 2005 U.S. | 2005 Total | 2010 Canadian | 2010 U.S. | 2010 Total | 2015 Canadian | 2015 U.S. | 2015 Total |
|---|---|---|---|---|---|---|---|---|---|---|---|---|
| Total number of fishing trips | 134,515 | 1,044,036 | 1,178,552 | 131,643 | 805,995 | 937,638 | 142,436 | 528,098 | 670,534 | 177,926 | 429,607 | 607,533 |
| Average number of fishing trips per angler | 3.1 | 1.8 | 1.9 | 4.3 | 1.7 | 1.8 | 4.8 | 1.7 | 2 | 4.3 | 1.7 | 2.1 |
| Total number of fishing trips with no accommodations | 42,442 | 322,232 | 364,674 | 26,490 | 247,104 | 273,594 | 50,747 | 135,049 | 185,796 | 63,471 | 126,976 | 190,447 |
| Average number of fishing trips with no accommodations per angler | 1 | 0.6 | 0.6 | 0.9 | 0.5 | 0.2 | 1.7 | 0.4 | 0.5 | 1.5 | 0.5 | 0.7 |
| Total number of nights per fishing trip | 409,082 | 4,216,949 | 4,626,032 | 273,718 | 3,299,618 | 3,573,336 | 305,800 | 2,236,075 | 2,541,875 | 393,193 | 1,548,430 | 1,941,623 |
| Average number of nights per fishing trip | 9.3 | 7.3 | 7.5 | 8.9 | 7.1 | 7.2 | 10.3 | 7.3 | 7.5 | 9.4 | 6.3 | 6.7 |
Table 14 - Reason why Canadian and U.S. resident anglers took a trip to Ontario and implications if they were not able to fish expressed in percent (%)
| Angler group | Fishing was primary reason for trip to Ontario | Fishing was secondary reason for trip to Ontario | Decided to fish after arriving to Ontario | Would have stayed a shorter time if they did not fish | Would have done other activities if they did not fish | Would not have come to Ontario if they did not fish |
|---|---|---|---|---|---|---|
| Canadian residents | 50 | 38 | 12 | 12 | 51 | 37 |
| U.S. non-residents | 89 | 9 | 2 | 5 | 16 | 79 |
| All angler groups combined | 76 | 19 | 5 | 6 | 21 | 73 |
4.3.2 Days and hours fished
In 2015, anglers spent a total of 14.4 million days fishing in Ontario (Table 15). The number of days fished by Ontario resident anglers, U.S. anglers, and Canadian anglers was 12 million, 2 million, and 0.4 million days, respectively (Table 15). The total number of days fished by children under 18 years of age was 1,615,785 (Table 16). 91% of the days were spent fishing on open water; 71% from a boat and 29% from shore (Table 17). Resident anglers were responsible for almost 90% of the days fished through the ice.
The average number of days fished for all angler categories was 12 (Table 15). Ontario Resident seniors fished an average of 16 days, Ontario residents aged 18-64 years old fished for an average of 15 days, Canadian anglers fished for 7 days, and U.S. non-resident anglers fished for an average of 6 days. The average number of days fished is higher for open water fishing than ice fishing in all angler categories.
Ontario resident anglers (licensed and seniors) account for 78% of the hours fished (Table 18), however the average number of hours fished by resident anglers is only 4 hours, compared to 7 hours for U.S. non-resident anglers (Table 18). Comparing hours fished on open water and through the ice, U.S. non-resident anglers represent 20.4% of the hours fished on open water, but only 3.3% of the hours fished during the ice fishing season. The average number of hours fished during the ice fishing season is also higher than the average number of hours fished during the open water season for all angler categories except U.S. non-residents.
Table 15 – Number of days fished by angler category and season from 2000 to 2015
| Effort | 2000 | 2005 | 2010 | 2015 |
|---|---|---|---|---|
| Total days fished for Ontario resident seniors | Not applicable | Not applicable | 868,313 | 889,078 |
| Average days fished for Ontario resident seniors | Not applicable | Not applicable | 19 | 16 |
| Open water days fished for Ontario resident seniors | Not applicable | Not applicable | 750,711 | 806,515 |
| Ice days fished for Ontario resident seniors | Not applicable | Not applicable | 117,602 | 82,563 |
| Total days fished for Ontario residents | 13,360,477 | 11,270,031 | 13,446,005 | 11,156,852 |
| Average days fished for Ontario residents | 16 | 17 | 15 | 15 |
| Open water days fished for Ontario residents | 11,941,741 | 9,933,098 | 11,772,246 | 9,975,730 |
| Ice days fished for Ontario residents | 1,418,736 | 1,336,933 | 1,673,759 | 1,181,122 |
| Total days fished for Canadian residents | 352,129 | 248,107 | 303,446 | 415,837 |
| Average days fished for Canadian residents | 9 | 9 | 10 | 7 |
| Open water days fished for Canadian residents | 333,239 | 237,434 | 275,809 | 394,352 |
| Ice days fished for Canadian residents | 18,890 | 10,673 | 27,637 | 21,485 |
| Total days fished for U.S. non-residents | 4,168,477 | 3,115,905 | 2,251,147 | 1,987,478 |
| Average days fished for U.S. non-residents | 7 | 7 | 7 | 6 |
| Open water days fished for U.S. non-residents | 4,124,076 | 3,041,743 | 2,204,915 | 1,951,503 |
| Ice days fished for U.S. non-residents | 44,401 | 74,162 | 46,232 | 35,975 |
| Total days fished for all anglers | 17,881,082 | 14,634,043 | 16,868,911 | 14,449,246 |
| Average days fished for all anglers | 13 | 13 | 13 | 12 |
| Open water days fished for all anglers | 16,399,056 | 13,212,275 | 15,003,680 | 13,128,101 |
| Ice days fished for all anglers | 1,482,026 | 1,421,768 | 1,865,231 | 1,321,145 |
Table 16 – Number if days fished by children under 18 years old in a survey respondent's household from 2000 to 2015
| Angler group | 2000 | 2005 | 2010 | 2015 |
|---|---|---|---|---|
| Ontario resident seniors | Not applicable | Not applicable | 31,055 | 26,386 |
| Ontario residents | 2,514,763 | 2,086,038 | 2,086,116 | 1,392,227 |
| Canadian residents | 83,624 | 46,863 | 48,565 | 47,653 |
| U.S. non-residents | 423,233 | 413,422 | 221,125 | 149,519 |
| Total | 3,021,620 | 2,546,322 | 2,386,861 | 1,615,785 |
Table 17 - Fishing method during the open water season expressed in percent (%)
| Angler group | 2005 Shore fishing | 2005 Boat fishing | 2015 Shore fishing | 2015 Boat fishing |
|---|---|---|---|---|
| Ontario resident seniors | Not applicable | Not applicable | 27 | 73 |
| Ontario residents | 34 | 66 | 34 | 66 |
| Canadian residents | 18 | 82 | 15 | 85 |
| U.S. non-residents | 6 | 94 | 7 | 93 |
| All anglers | 23 | 77 | 29 | 71 |
Table 18 - Total hours and average number of hours per day fished by angler category and season
| Angler group | Total number of hours fished during open water season | Total number of hours fished during ice season | Total number of hours fished (both seasons combined) | Average number of hours per day fished during open water season | Average number of hours per day fished during ice water season |
|---|---|---|---|---|---|
| Ontario resident seniors | 3,592,478 | 376,511 | 3,968,989 | 4 | 5 |
| Ontario residents | 47,609,879 | 6,874,202 | 54,484,082 | 4 | 5 |
| Canadian residents | 2,101,187 | 120,894 | 2,222,081 | 6 | 6 |
| U.S. non-residents | 13,629,569 | 252,115 | 13,881,684 | 7 | 7 |
| All anglers | 66,933,113 | 7,623,722 | 74,556,836 | 5 | 5 |
4.3.3 Days fished by waterbody
Lake Erie recorded the highest number of days fished in 2015 (Table 19). In 2015, Lake Erie was the most popular fishing lake for resident anglers, while Lake of the Woods for Canadian residents and U.S. anglers. The top 5 lakes by days fished have not changed from 2000 (Table 19).
Table 19 - Most heavily fished waterbodies by number of days fished
| Water body | Total days in 2015 | Total anglers in 2015 | Sample size in 2015 | RSE (%) in 2015 | Total days in 2000 | Total days in 2005 | Total days in 2010 |
|---|---|---|---|---|---|---|---|
| Lake Erie | 713,373 | 80,180 | 458 | 7.8 | 719,029 | 657,234 | 809,223 |
| Lake Ontario | 630,817 | 89,526 | 499 | 8.8 | 963,428 | 493,428 | 802,704 |
| Lake Huron & Georgian Bay | 601,621 | 76,927 | 431 | 6.3 | 2,459,857 | 829,565 | 866,590 |
| Lake Simcoe | 483,184 | 69,094 | 376 | 10.3 | 531,280 | 482,696 | 648,478 |
| Lake of the Woods | 381,396 | 58,834 | 562 | 5.0 | 585,199 | 483,487 | 487,745 |
| Lake Nipissing | 270,923 | 29,680 | 173 | 10.8 | Not applicable | Not applicable | Not applicable |
| Ottawa River | 267,108 | 30,259 | 181 | 10.7 | Not applicable | Not applicable | Not applicable |
| St. Lawrence River | 254,316 | 23,648 | 163 | 10.7 | Not applicable | Not applicable | Not applicable |
| Grand River | 249,633 | 28,676 | 154 | 11.7 | Not applicable | Not applicable | Not applicable |
| Lake St. Clair | 198,076 | 24,585 | 166 | 13.9 | Not applicable | Not applicable | Not applicable |
| Rice Lake (FMZ 17) | 176,817 | 28,940 | 180 | 9.1 | Not applicable | Not applicable | Not applicable |
| Detroit River | 154,807 | 15,923 | 107 | 17.2 | Not applicable | Not applicable | Not applicable |
| Trent River | 121,514 | 11,535 | 70 | 21 | Not applicable | Not applicable | Not applicable |
| French River | 116,041 | 19,141 | 114 | 9.8 | Not applicable | Not applicable | Not applicable |
| Pigeon Lake (FMZ 17) | 105,090 | 15,422 | 88 | 13.5 | Not applicable | Not applicable | Not applicable |
| Lac Seul | 103,767 | 19,977 | 203 | 3.9 | Not applicable | Not applicable | Not applicable |
| Rideau River | 101,980 | 14,721 | 95 | 11.1 | Not applicable | Not applicable | Not applicable |
| Lake Scugog | 97,464 | 13,801 | 75 | 13.5 | Not applicable | Not applicable | Not applicable |
| Rainy Lake | 90,787 | 13,553 | 119 | 8.8 | Not applicable | Not applicable | Not applicable |
| Buckhorn Lake | 89,557 | 9,845 | 54 | 18.2 | Not applicable | Not applicable | Not applicable |
| Balsam Lake | 67,152 | 10,129 | 56 | 11.8 | Not applicable | Not applicable | Not applicable |
| Lake Superior | 66,136 | 10,442 | 63 | 19.1 | Not applicable | Not applicable | Not applicable |
| Sturgeon Lake (FMZ 17) | 63,109 | 7,906 | 17 | 26.6 | Not applicable | Not applicable | Not applicable |
| English River | 61,700 | 6,843 | 70 | 22.4 | Not applicable | Not applicable | Not applicable |
| Thames River | 60,661 | 9,845 | 55 | 15.9 | Not applicable | Not applicable | Not applicable |
| Lake Temagami | 57,460 | 7,527 | 45 | 23.4 | Not applicable | Not applicable | Not applicable |
| Lake Timiskaming | 55,415 | 5,046 | 26 | 14.8 | Not applicable | Not applicable | Not applicable |
| Winnipeg River | 54,765 | 6,969 | 52 | 19.0 | Not applicable | Not applicable | Not applicable |
4.4 Species targeted, catch and harvest
Walleye was the most targeted species in the summer and winter. Walleye (30%) and bass (27%) were most targeted in the summer (Table 23) and walleye (30%), yellow perch (23%), lake trout (15%) and northern pike (11%) were the most targeted when ice fishing (Table 24).
71.8 million fish were caught and 13.3 million (18.6%) harvested (Table 20). Ontario residents caught 61% (43.9 million) and kept 74.5% (10 million) of all fish (Table 20). The rates of harvest relative to catch were highest for splake, whitefish, coho salmon, brook trout, yellow perch and lake trout.
The average number of fish caught per angler was 60.4, and fish kept was 11.2 (Table 21). U.S. anglers caught the most fish per angler on average (81.9) but kept the fewest (9.6). Senior Ontario residents kept the most fish on average (15.9). Fewer fish have been kept relative to the number caught since 2000 (Table 22).
Table 20 - Total fish caught and harvested by species in 2015
| Species | Number caught | Number harvested | % Harvested |
|---|---|---|---|
| Walleye (coolwater) | 20,748,872 | 3,740,232 | 18.0 |
| Yellow perch (coolwater) | 12,571,905 | 4,378,061 | 34.8 |
| Northern pike (coolwater) | 9,096,117 | 777,229 | 8.5 |
| Smallmouth bass (warmwater) | 10,664,539 | 952,898 | 8.9 |
| Largemouth bass (warmwater) | 5,196,506 | 570,048 | 11.0 |
| Bass (unspecified) (warmwater) | 20,943 | 9,633 | Not available |
| Muskellunge (warmwater) | 319,562 | 1,174 | 0.4 |
| Black crappie (warmwater) | 2,223,472 | 647,027 | 29.1 |
| Bluegill (warmwater) | 3,358,612 | 639,024 | 19.0 |
| Pumpkinseed (warmwater) | 2,292,879 | 178,240 | 7.8 |
| Sunfish (unspecified) (warmwater) | 210,618 | 22,190 | Not applicable |
| Bullhead (warmwater) | 417,159 | 95,477 | 22.9 |
| Lake trout (coldwater) | 950,954 | 292,379 | 30.7 |
| Brook trout (coldwater) | 417,094 | 169,503 | 40.6 |
| Splake (coldwater) | 58,996 | 36,471 | 61.8 |
| Brown trout (coldwater) | 208,300 | 19,735 | 9.5 |
| Rainbow trout (coldwater) | 690,392 | 177,149 | 25.7 |
| Trout (unspecified) (coldwater) | 2,396 | 1,868 | Not available |
| Chinook salmon (coldwater) | 323,061 | 85,816 | 26.6 |
| Coho salmon (coldwater) | 82,236 | 39,150 | 47.6 |
| Pink salmon (coldwater) | 9,174 | 1,550 | 16.9 |
| Atlantic salmon (coldwater) | 5,273 | 1,578 | 29.9 |
| Salmon (unspecified) (coldwater) | 3,792 | 687 | Not available |
| Whitefish (coldwater) | 92,656 | 41,985 | 45.3 |
| Other | 1,801,051 | 467,419 | 26.0 |
| Total | 71,766,561 | 13,346,524 | 18.6 |
Table 21 - Average number of fish caught and kept in 2015
| Angler category | 2015 number of active anglers | 2015 number of fish caught | 2015 average fish caught per angler | 2015 number of fish kept | 2015 average fish kept per angler |
|---|---|---|---|---|---|
| Ontario resident seniors | 57,114 | 3,129,225 | 54.8 | 905,856 | 15.9 |
| Ontario residents | 756,371 | 40,759,657 | 53.9 | 9,042,771 | 12.0 |
| Canadian residents | 59,057 | 2,024,172 | 34.3 | 371,351 | 6.3 |
| U.S. non-residents | 315,489 | 25,853,596 | 81.9 | 3,026,543 | 9.6 |
| All angler groups | 1,188,031 | 71,766,560 | 60.4 | 13,346,521 | 11.2 |
Table 22 - Average number of fish caught and kept from 2000 to 2010
| Angler category | 2000 average fish caught per angler | 2000 average fish kept per angler | 2005 average fish caught per angler | 2005 average fish kept per angler | 2010 average fish caught per angler | 2010 average fish kept per angler |
|---|---|---|---|---|---|---|
| Ontario residents | 79.2 | 29.3 | 72.9 | 17.7 | 68.0 | 16.6 |
| Canadian residents | 56.1 | 13.1 | 49.2 | 7.9 | 58.3 | 9.1 |
| U.S. non-residents | 87.9 | 24.1 | 87.2 | 16.5 | 99.4 | 15.2 |
| All angler groups | 82.2 | 26.6 | 77.7 | 17.1 | 74.8 | 16.0 |
Table 23 - Percent of anglers targeting cool, warm and cold water species by angler group in open water season in 2015
| Angler group | Walleye | Yellow perch | Northern pike | Total for cool water species | Muskellunge | Smallmouth bass | Largemouth bass | Bass | Rock bass | Crappie | Bluegill | Pumpkinseed | Sunfish | Panfish | Bullhead | Carp | Total for warm water species | Lake trout | Brook trout | Splake | Brown trout | Rainbow trout | Trout | Chinook salmon | Coho salmon | Salmon | Whitefish | Total for cold water species | Other |
|---|---|---|---|---|---|---|---|---|---|---|---|---|---|---|---|---|---|---|---|---|---|---|---|---|---|---|---|---|---|
| Ontario resident seniors | 34 | 6 | 10 | 50 | 1 | 4 | 2 | 21 | 0 | 1 | 0 | 0 | 0 | 0 | 0 | 0 | 30 | 5 | 2 | 0 | 1 | 4 | 3 | 0 | 0 | 3 | 0 | 20 | 0 |
| Ontario residents | 26 | 5 | 11 | 42 | 2 | 5 | 3 | 26 | 0 | 1 | 0 | 0 | 0 | 1 | 1 | 0 | 39 | 4 | 2 | 0 | 1 | 4 | 4 | 0 | 0 | 3 | 0 | 18 | 0 |
| Canadian residents | 42 | 1 | 10 | 53 | 2 | 5 | 0 | 12 | 0 | 1 | 0 | 0 | 0 | 0 | 0 | 0 | 20 | 2 | 0 | 0 | 0 | 2 | 7 | 3 | 1 | 13 | 0 | 27 | 0 |
| U.S. residents | 53 | 2 | 16 | 71 | 5 | 7 | 1 | 9 | 0 | 1 | 0 | 0 | 0 | 0 | 0 | 0 | 23 | 3 | 1 | 0 | 0 | 1 | 1 | 0 | 0 | 0 | 0 | 6 | 0 |
| Total | 33 | 4 | 12 | 49 | 2 | 5 | 2 | 21 | 0 | 1 | 0 | 0 | 0 | 1 | 1 | 0 | 35 | 4 | 2 | 0 | 0 | 3 | 3 | 0 | 0 | 3 | 0 | 15 | 0 |
Table 24 - Percent of anglers targeting cool, warm and cold water species by angler group in ice fishing season in 2015
| Angler group | Walleye | Yellow perch | Northern pike | Total for cool water species | Muskellunge | Smallmouth bass | Largemouth bass | Bass | Rock bass | Crappie | Bluegill | Pumpkinseed | Sunfish | Panfish | Bullhead | Carp | Total for warm water species | Lake trout | Brook trout | Splake | Brown trout | Rainbow trout | Trout | Chinook salmon | Coho salmon | Salmon | Whitefish | Total for cold water species | Other |
|---|---|---|---|---|---|---|---|---|---|---|---|---|---|---|---|---|---|---|---|---|---|---|---|---|---|---|---|---|---|
| Ontario resident seniors | 29 | 27 | 9 | 66 | 0 | 0 | 0 | 0 | 0 | 2 | 0 | 0 | 0 | 0 | 0 | 0 | 2 | 14 | 4 | 2 | 0 | 1 | 5 | 0 | 0 | 0 | 4 | 31 | 1 |
| Ontario residents | 28 | 22 | 11 | 61 | 0 | 0 | 0 | 1 | 0 | 3 | 0 | 0 | 0 | 0 | 0 | 0 | 6 | 14 | 4 | 3 | 0 | 2 | 5 | 0 | 0 | 0 | 5 | 32 | 1 |
| Canadian residents | 63 | 0 | 8 | 71 | 0 | 0 | 0 | 0 | 0 | 3 | 0 | 0 | 0 | 0 | 0 | 3 | 6 | 12 | 2 | 3 | 0 | 0 | 2 | 0 | 0 | 0 | 5 | 23 | 0 |
| U.S. residents | 26 | 15 | 8 | 49 | 0 | 0 | 0 | 0 | 0 | 9 | 0 | 0 | 0 | 0 | 0 | 0 | 10 | 35 | 2 | 1 | 0 | 0 | 3 | 0 | 0 | 0 | 0 | 41 | 0 |
| Total | 29 | 22 | 11 | 61 | 0 | 0 | 0 | 1 | 0 | 3 | 0 | 0 | 0 | 0 | 0 | 0 | 6 | 15 | 3 | 3 | 0 | 2 | 5 | 0 | 0 | 0 | 4 | 32 | 1 |
4.5 Angler behaviour, preferences and awareness
4.5.1 Bait
Anglers primarily disposed of live bait on land or in the trash, or retained it live for later use (Table 25). In 2015, the most popular bait and tackle types used were lures, followed by worms, then live baitfish. The following list details the number and percent of anglers that used different forms of bait and tackle:
- lures (e.g. spinners, flies, jigs): 1,050,132 or 87%
- soft plastic lures/baits: 405,791 or 34%
- biodegradable soft plastic lures/baits: 824,631 or 68%
- worms: 773,800 or 64%
- live baitfish: 637,224 or 53%
- leeches: 231,616 or 19%
- dead baitfish: 209,043 or 17%
- roe (fish eggs): 74,573 or 6%
- frogs: 27,453 or 2%
- other: 17,585 or 1%
Table 25 - Live baitfish disposal method in 2015 expressed in percent (%)
| Disposal method | Always | Sometimes | Never |
|---|---|---|---|
| Released into a body of water | 3 | 18 | 78 |
| Preserved (frozen/salted) | 1 | 13 | 86 |
| Disposed of on land or in trash | 10 | 46 | 44 |
| Gave to other anglers | 4 | 50 | 46 |
| Retained live for later use | 10 | 51 | 38 |
4.5.2 Angler experience
78.9% of the total active angler population rated their experience fishing in Ontario as good, very good, or excellent, higher than in any previous year (Table 26).
Table 26 - Rating of angler experience from 1995 to 2015 expressed in percent (%)
| Fishing experience | 1995 | 2000 | 2005 | 2010 | 2015 |
|---|---|---|---|---|---|
| Excellent | 10.8 | 14.9 | 18.9 | 15.1 | 21.4 |
| Very good | 21.0 | 25.3 | 26.1 | 26.7 | 28.3 |
| Good | 31.7 | 32.4 | 30.7 | 32.3 | 29.2 |
| Fair | 22.8 | 17.2 | 16.7 | 15.8 | 14.2 |
| Poor | 12.3 | 10.2 | 7.6 | 10.2 | 6.9 |
| Unknown | 1.7 | Not applicable | Not applicable | Not applicable | Not applicable |
4.5.3 Species preference and satisfaction
The first species of preference for all anglers fishing in Ontario is Walleye. Smallmouth Bass and Northern Pike are also often cited as preferred species (Table 27). The majority of anglers were satisfied with the catch rate and size of their first and second species preference, in the area they fished most often (Table 28). Canadian and U.S. anglers had the highest satisfaction rates.
Table 27 - Top 4 species reported as first, second and third preference for the area an angler fished in most in 2015
| Angler group | First preference | Second preference | Third preference |
|---|---|---|---|
| Ontario residents |
|
|
|
| Canadian residents |
|
|
|
| U.S. non-residents |
|
|
|
| All angler groups |
|
|
|
Table 28 - Size and catch satisfaction of first and second most preferred species for an area where an angler fishes most often, by angler group in 2015 expressed in percent (%)
| Size and catch per angler group | Very dissatisfied | Dissatisfied | Neutral | Satisfied | Very satisfied |
|---|---|---|---|---|---|
| Catch rate most preffered species for Ontario resident seniors | 9 | 19 | 30 | 32 | 9 |
| Catch rate most preffered species for Ontario residents | 9 | 20 | 25 | 35 | 11 |
| Catch rate most preffered species for Canadian residents | 6 | 11 | 20 | 49 | 14 |
| Catch rate most preffered species for U.S. residents | 4 | 8 | 11 | 41 | 36 |
| Catch rate most preffered species for all anglers combined | 7 | 17 | 21 | 37 | 18 |
| Catch rate for second most preffered species for Ontario resident seniors | 8 | 22 | 31 | 31 | 8 |
| Catch rate for second most preffered species for Ontario residents | 9 | 21 | 29 | 34 | 7 |
| Catch rate for second most preffered species for Canadian residents | 10 | 12 | 23 | 42 | 13 |
| Catch rate for second most preffered species for U.S. residents | 4 | 12 | 23 | 41 | 19 |
| Catch rate for second most preffered species for all anglers combined | 8 | 18 | 27 | 36 | 10 |
| Average size for most preffered species for Ontario resident seniors | 6 | 20 | 23 | 42 | 8 |
| Average size for most preffered species for Ontario residents | 7 | 17 | 27 | 42 | 8 |
| Average size for most preffered species for Canadian residents | 5 | 9 | 19 | 51 | 15 |
| Average size for most preffered species for U.S. residents | 2 | 8 | 15 | 49 | 27 |
| Average size for most preffered species for all anglers combined | 5 | 14 | 23 | 44 | 13 |
| Average size for second most preffered species for Ontario resident seniors | 6 | 20 | 29 | 38 | 7 |
| Average size for second most preffered species for Ontario residents | 7 | 17 | 31 | 38 | 6 |
| Average size for second most preffered species for Canadian residents | 8 | 10 | 21 | 47 | 14 |
| Average size for second most preffered species for U.S. residents | 3 | 11 | 24 | 43 | 19 |
| Average size for second most preffered species for all anglers combined | 6 | 15 | 29 | 40 | 10 |
4.5.4 Fishing regulations and enforcement satisfaction
Most anglers in all angler groups were satisfied with the ability of fishing regulations to prevent overfishing, the simplicity of the regulations, enforcement of the regulations and angler compliance with the regulations in the area they fished most often in 2015 (Table 29).
Table 29 - Satisfaction with fishing regulations in an area where an angler fished most often, by angler group, in 2015 expressed in percent (%)
| Fishing regulations and enforcement | Very dissatisfied | Dissatisfied | Neutral | Satisfied | Very satisfied |
|---|---|---|---|---|---|
| Fishing regulations and enforcement - Ontario resident seniors | 12 | 13 | 16 | 42 | 17 |
| Fishing regulations and enforcement - Ontario residents | 7 | 11 | 22 | 44 | 16 |
| Fishing regulations and enforcement - Canadian residents | 4 | 3 | 15 | 49 | 29 |
| Fishing regulations and enforcement - U.S. residents | 3 | 5 | 14 | 44 | 35 |
| Fishing regulations and enforcement - all anglers combined | 6 | 9 | 19 | 44 | 21 |
| Simplicity in fishing regulations - Ontario resident seniors | 6 | 11 | 22 | 48 | 12 |
| Simplicity in fishing regulations - Ontario residents | 4 | 11 | 24 | 48 | 13 |
| Simplicity in fishing regulations - Canadian residents | 5 | 4 | 17 | 56 | 19 |
| Simplicity in fishing regulations - U.S. residents | 3 | 9 | 19 | 46 | 24 |
| Simplicity in fishing regulations - all anglers combined | 4 | 10 | 22 | 48 | 16 |
| Enforcement of fishing regulations - Ontario resident seniors | 10 | 12 | 22 | 44 | 12 |
| Enforcement of fishing regulations - Ontario residents | 8 | 11 | 26 | 44 | 12 |
| Enforcement of fishing regulations - Canadian residents | 3 | 6 | 18 | 50 | 24 |
| Enforcement of fishing regulations - U.S. residents | 2 | 2 | 20 | 50 | 26 |
| Enforcement of fishing regulations - all anglers combined | 6 | 9 | 24 | 45 | 16 |
| Angler compliance with fishing regulations - Ontario resident seniors | 7 | 17 | 22 | 43 | 12 |
| Angler compliance with fishing regulations - Ontario residents | 6 | 13 | 25 | 44 | 12 |
| Angler compliance with fishing regulations - Canadian residents | 4 | 5 | 19 | 52 | 20 |
| Angler compliance with fishing regulations - U.S. residents | 2 | 2 | 12 | 47 | 37 |
| Angler compliance with fishing regulations - all anglers combined | 5 | 10 | 21 | 45 | 19 |
4.5.5 Fisheries management satisfaction
Anglers in all angler groups were generally not sure, neither dissatisfied or satisfied, or satisfied with efforts to increase fishing opportunities and rehabilitate populations through stocking and monitoring in the area they fish most often in 2015 (Table 30).
Table 30 - Satisfaction with stocking and monitoring in the area where an angler fishes most often, by angler group, in 2015 expressed in percent (%)
| Fisheries management | Very dissatisfied | Dissatisfied | Neutral | Satisfied | Very satisfied |
|---|---|---|---|---|---|
| Efforts to increase fishing opportunities through stocking - Ontario resident seniors | 17 | 23 | 24 | 29 | 8 |
| Efforts to increase fishing opportunities through stocking - Ontario residents | 12 | 18 | 33 | 29 | 8 |
| Efforts to increase fishing opportunities through stocking - Canadian residents | 3 | 7 | 28 | 40 | 22 |
| Efforts to increase fishing opportunities through stocking - U.S. residents | 3 | 7 | 35 | 37 | 18 |
| Efforts to increase fishing opportunities through stocking - all anglers combined | 10 | 15 | 33 | 32 | 11 |
| Efforts to rehabilitate/restore fish populations through stocking - Ontario resident seniors | 17 | 24 | 25 | 28 | 7 |
| Efforts to rehabilitate/restore fish populations through stocking - Ontario residents | 11 | 19 | 33 | 30 | 8 |
| Efforts to rehabilitate/restore fish populations through stocking - Canadian residents | 3 | 6 | 28 | 40 | 23 |
| Efforts to rehabilitate/restore fish populations through stocking - U.S. residents | 3 | 7 | 35 | 36 | 19 |
| Efforts to rehabilitate/restore fish populations through stocking - all anglers combined | 9 | 16 | 33 | 31 | 11 |
| Efforts to monitor fish populations - Ontario resident seniors | 11 | 18 | 33 | 32 | 5 |
| Efforts to monitor fish populations - Ontario residents | 6 | 16 | 39 | 32 | 8 |
| Efforts to monitor fish populations - Canadian residents | 4 | 2 | 30 | 45 | 19 |
| Efforts to monitor fish populations - U.S. residents | 2 | 3 | 35 | 40 | 20 |
| Efforts to monitor fish populations - all anglers combined | 6 | 12 | 37 | 34 | 11 |
4.5.6 Public involvement and communication satisfaction
Anglers in all angler groups were not sure or neither dissatisfied or satisfied with opportunities to be involved in fisheries management decision making, amount of support for local stewardship activities and efforts to communicate through Fish ON-Line (Table 31).
Table 31 - Satisfaction with public involvement and communication in the area where an angler fishes most often, by angler group, in 2015 expressed in percent (%)
| Public involvement and communication | Very dissatisfied | Dissatisfied | Neutral | Satisfied | Very satisfied |
|---|---|---|---|---|---|
| Opportunities to be involved in fisheries decision making - Ontario resident seniors | 11 | 17 | 41 | 26 | 5 |
| Opportunities to be involved in fisheries decision making - Ontario residents | 8 | 15 | 50 | 24 | 4 |
| Opportunities to be involved in fisheries decision making - Canadian residents | 2 | 7 | 47 | 38 | 6 |
| Opportunities to be involved in fisheries decision making - U.S. residents | 3 | 4 | 55 | 27 | 11 |
| Opportunities to be involved in fisheries decision making - all anglers combined | 7 | 12 | 50 | 25 | 5 |
| Support for group stewardship activities - Ontario resident seniors | 7 | 13 | 40 | 34 | 6 |
| Support for group stewardship activities - Ontario residents | 5 | 8 | 52 | 31 | 4 |
| Support for group stewardship activities - Canadian residents | 1 | 4 | 42 | 40 | 12 |
| Support for group stewardship activities - U.S. residents | 2 | 2 | 50 | 32 | 15 |
| Support for group stewardship activities - all anglers combined | 4 | 7 | 50 | 32 | 7 |
| Efforts to communicate information through Fish ON-Line - Ontario resident seniors | 6 | 8 | 46 | 35 | 5 |
| Efforts to communicate information through Fish ON-Line - Ontario residents | 3 | 7 | 50 | 33 | 7 |
| Efforts to communicate information through Fish ON-Line - Canadian residents | 1 | 3 | 34 | 47 | 15 |
| Efforts to communicate information through Fish ON-Line - U.S. residents | 1 | 2 | 45 | 37 | 15 |
| Efforts to communicate information through Fish ON-Line - all anglers combined | 3 | 5 | 48 | 34 | 9 |
4.5.7 Overall satisfaction
Anglers in all angler groups were primarily satisfied or not sure of their overall satisfaction where they fished most often in 2015 (Table 32).
Table 32 - Overall satisfaction in the area where an angler fishes most often, by angler group, in 2015 expressed in (%)
| Overall satisfaction | Very dissatisfied | Dissatisfied | Neutral | Satisfied | Very satisfied |
|---|---|---|---|---|---|
| Ontario resident seniors | 4 | 13 | 31 | 46 | 6 |
| Ontario residents | 3 | 10 | 27 | 50 | 9 |
| Canadian residents | 2 | 3 | 15 | 62 | 18 |
| U.S. residents | 2 | 3 | 10 | 50 | 35 |
| All angler groups | 3 | 8 | 22 | 51 | 16 |
4.6 Expenditures and investments
Anglers spent 1.75 billion dollars on trip expenses and investments to recreationally fish in 2015 (Table 33). Anglers reported spending $980 million dollars on trip expenditures including package deals ($158 million) and $770 million on investments wholly attributable to recreational fishing (Table 34). This value does not include indirect spending by anglers. 96% of trip expenditures and investments were made to fish in the open water season and 4% for the ice fishing season.
Individual trip expenses include purchases of non-durable goods and services. Anglers spent the most on food, travel, accommodation and household boat costs to participate in recreational fishing in Ontario (Table 35). Angling packages in the amount of $157,654,299 were purchased from an Ontario lodge or outfitter which included a range of services such as lodging, food and transportation are also popular for U.S. non-residents (Table 34). The average package value was $1,362 per angler (Table 36).
Anglers invested $767 million for land and buildings, boats, fishing and camping equipment wholly attributable to fishing in Ontario in 2015 (Table 37). 92% of investments to fish were made by Ontario anglers.
Table 33 - Expenditures related to recreational fishing in Ontario expressed in billions of dollars. Ontario resident seniors were not surveyed in 2000 or 2005 and are excluded from this analysis
| Expenditures & investments | 2000 | 2005 | 2010 | 2015 |
|---|---|---|---|---|
| Trip expenditures (includes package deals) | 0.99 | 0.98 | 0.85 | 0.98 |
| Investments wholly attributable to fishing | 0.70 | 0.76 | 0.77 | 0.77 |
| Total | 1.69 | 1.74 | 1.62 | 1.75 |
Table 34 - Individual trip expenditures, package values and investments made to fish in Ontario by angler group in 2015
| Angler group | Total trip expenditures | Package value | Investment wholly attributable to fishing | Total |
|---|---|---|---|---|
| Ontario senior residents | 43,026,942 | 3,263,496 | 37,286,015 | 83,576,453 |
| Ontario residents | 498,723,888 | 21,875,946 | 669,011,708 | 1,189,611,542 |
| Canadian residents | 40,276,454 | 3,335,385 | 40,560,702 | 84,172,542 |
| U.S. non-residents | 244,811,590 | 129,179,472 | 20,118,091 | 394,109,153 |
| All angler groups | 826,838,876 | 157,654,299 | 766,976,515 | 1,751,469,689 |
Table 35 - Amount spent ($) on trip expenditures by category and angler group in 2015
| Trip expenditure | Ontario residents | Canadian residents | U.S. residents | Total |
|---|---|---|---|---|
| Accommodation | 53,048,421 | 4,678,812 | 85,959,244 | 143,686,477 |
| Campsite fees | 47,851,343 | 4,059,608 | 10,645,355 | 62,556,306 |
| Food | 108,591,099 | 8,929,476 | 43,845,611 | 161,366,186 |
| Travel | 120,830,932 | 7,417,194 | 33,244,951 | 161,493,077 |
| Household boat costs | 115,318,726 | 7,695,051 | 17,202,839 | 140,216,616 |
| Fishing rentals | 14,122,469 | 411,361 | 10,806,738 | 25,340,568 |
| Fishing supplies | 53,324,557 | 2,551,304 | 13,526,959 | 69,402,820 |
| Guide fees | 3,223,424 | 2,157,042 | 9,504,559 | 14,885,025 |
| License fees | 18,821,782 | 1,823,716 | 17,314,123 | 37,959,621 |
| Access fees | 5,994,795 | 173,450 | 1,779,533 | 7,947,778 |
| Other | 623,283 | 379,440 | 981,678 | 1,984,401 |
| Total | 541,750,831 | 40,276,454 | 244,811,590 | 826,838,875 |
Table 36 - Package deal purchases ($) by season in 2015
| Season | Total package value | Average package value | Sample size | RSE (%) |
|---|---|---|---|---|
| Open water | 156,310,399 | 1,496 | 1,370 | 2.5 |
| Ice | 1,343,900 | 311 | 40 | 10.3 |
| Total | 157,654,299 | 1,362 | 1410 | 2.5 |
Table 37 - Investments ($) wholly attributable to recreational fishing in 2015
| Investment category | Ontario residents | Canadian residents | U.S. residents | All anglers |
|---|---|---|---|---|
| Fishing equipment | 74,616,070 | 1,350,707 | 2,250,647 | 78,217,424 |
| Camping equipment | 53,909,222 | 4,467,610 | 261,362 | 58,638,194 |
| Boating equipment new | 144,446,420 | 5,489,159 | 1,768,212 | 151,703,791 |
| Boating equipment used | 87,912,075 | 2,730,107 | 482,587 | 91,124,768 |
| Land-buildings | 224,317,227 | 25,000,922 | 13,680,227 | 262,998,376 |
| Special vehicles new | 54,459,977 | 0 | 264,321 | 54,724,298 |
| Special vehicles used | 42,447,329 | 1,058,141 | 595,984 | 44,101,454 |
| Other investments | 24,189,403 | 464,055 | 814,750 | 25,468,208 |
| Total | 706,297,723 | 40,560,702 | 20,118,091 | 766,976,513 |
5.0 References
Hogg, S.E. 2010. 2005 Survey of Recreational Fishing in Canada: Statistical Procedures for Estimating Fishery Traits in Ontario. Applied Research and Development Branch. Ontario Ministry of Natural Resources and Forestry. Peterborough, ON. March 2010. 10 pp.
Tarrant, M.A., M.J. Manfredo, P.B. Bayley, and R. Hess. 1993. Effects of recall bias and non-response bias on self-report estimates of angling participation. North American Journal of Fisheries Management 13: 217-222.
Footnotes
- footnote[1] Back to paragraph This value was calculated by the ministry based on pre non-response survey data and post non-response data; 2000 data for this category was unknown, so the direct 2010 value of 1.8% was used for 2005.
- footnote[2] Back to paragraph Adjustment rates in 2000 were based on information presented in the 2000 Survey of Recreational Fishing in Ontario: A Descriptive Analysis, there was no significant difference between respondents and non-respondents in the non-resident categories.