Ecosystem service values
Examines 2 different approaches to quantifying and assessing ecosystem services and their values, in and around several provincial parks in Ontario.
Mapping the off-site benefits from protected areas’ ecosystem services: Final report
Written by Spatial Informatics Group, LLC
May 31, 2013
For Ontario Ministry of Natural Resources
Authors: Brian Voigt, Austin Troy, and Gary Johnson
Executive summary
The term “ecosystem services” is commonly used to refer to the goods and services provided to people by nature for free: goods such as food, fuel and fiber; regulating services such as climate stabilization and flood control; and nonmaterial assets such as aesthetic views or recreational opportunities. Researchers have long recognized that the ecosystems that provide benefits to people and the beneficiaries of these services are not always located in the same regions in space. A commonly cited barrier to implementing the ecosystem services framework, though, is the lack of understanding of how services flow across the landscape from ecosystems to beneficiaries.
Parks and protected areas are essential providers of ecosystem services. They may contain headwater forests that assure critical water supplies, wetlands that mitigate downstream floods, or recreational resources that support a regional economy. Ontario is a vast province with nearly incalculable environmental values. The landscapes within its vast system of provincial parks provide a wide range of services including greenhouse gas regulation, water quantity regulation, pollination, sediment regulation, and recreation. Quantifying these services would be of great value to park managers and policy makers. Yet many challenges complicate attempts to do so: Ontario’s protected areas are spatially heterogeneous and large in number; each provides a different suite of services that accrue to beneficiaries differently and to different beneficiaries; each provides services at different spatial and temporal scales; some parks are distant from human communities, complicating attempts to understand relationships between service provision and beneficiaries; and primary valuation studies on services within this context are few. Yet, thanks to new spatial modeling technology, an increasing number of options exist for estimating the strength of flow and quantity of benefits of these services.
The purpose of this project is to examine two different approaches to quantifying and assessing ecosystem services in and around several provincial parks in Ontario. In one approach, we used a platform called ARIES (Artificial Intelligence for Ecosystem Services) to quantify the spatial connection between ecosystems and their beneficiaries, looking not only at the type of service, but also assessing the physical flows of benefits over space. We tested this framework as a proof of concept on two case study areas, for four different ecosystem services. This approach was contrasted with a more traditional “value transfer” analysis for a different region. Value transfer is an imputation method in which the economic value of ecosystem services in a particular location, known as a “policy site,” is estimated using valuations from studies done in sites that are contextually similar to that policy site. In other words, existing valuation information is adapted to new policy contexts where valuation data is absent or limited. Typically this “transfer” is done based on similarity of land cover, so the analysis merely requires mapping of land cover. In this case we used a database of literature from Spatial Informatics Group’s Natural Assets Information System (NAIS) to conduct value transfer.
The models contained within ARIES map both ecosystem service source and use locations, and then use flow algorithms to quantify actual service delivery to beneficiaries. ARIES maps the theoretical and actual provision, use, and flow of services and highlights rival use regions and landscape features that deplete the service as it moves across the landscape (termed “sinks”). This methodology enables ARIES to produce much more spatially and contextually specific ecosystem service assessments than are generated by competing approaches, which rely solely on in-situ (i.e. non-spatial) calculations. Valuation estimates from the literature can still be used as in value transfer, however with ARIES these estimates can be weighted and adjusted to account for biophysical connections to beneficiaries. Put differently, value transfer results in estimates that can be thought of as the theoretical value of services for the ecosystems in question—theoretical in that the approach does not account for the presence of or connectivity with beneficiaries, rather it assumes that there are beneficiaries everywhere. ARIES, on the other hand, maps actual (or “realized”) flows of services because it accounts for actual value by connecting ecosystem service source and use locations.
ARIES is a modeling platform capable of automatically selecting, assembling and running ecological process models to quantify and map the values of ecosystem services. It explicitly tracks the uncertainty related to data and models, and is therefore capable of operating in data-scarce conditions. The choice of the optimal spatial scales for a model is assisted by the artificial intelligence engine in ARIES on a case-by-case basis and transparently applied to data sources of disparate representation. This alleviates the criticality of scale choices on the part of the user, and eases data preparation work to ensure scale harmonization.
For the ARIES analysis, two case study regions were chosen: Algonquin Provincial Park, where recreation and carbon sequestration ecosystem services were modeled; and the Lake of the Woods region, where sediment transport and water provision ecosystem services were modeled. For the value transfer analysis, the North Shore region (including portions of the Thessalon, Sudbury, LaCloche and Mississagi ecoregions) was used.
The value transfer analysis resulted in the development of a detailed and customized land cover typology. A land cover map was developed with this typology. That map served as the basis for spatially assigning value estimates. The typology included 18 classes with valuations and one class for all other land for which no valuation was known or expected. The resulting value estimate for the entire study area was $9.3 billion per year and for the parks in the study area was $1.1 billion per year. These values were mapped by land cover type and ecosystem service.
The first ARIES analysis involved the development of a carbon sequestration model for Algonquin Park that incorporated both sources and sinks of carbon within the park. A per-ton social cost of carbon from the literature was used to convert these carbon flux estimates into an economic value. Next, recreation was modeled for Algonquin Park by mapping access to scenic viewsheds, or aesthetically valuable lines of sight, by backcountry canoe users, backcountry hikers and frontcountry campers, using data on actual locations of recreational activity drawn from 2011 Ontario Parks Visitor Surveys. In addition to running the model for baseline conditions, an alternative scenario was run for the recreation model to simulate the effects of a policy that would eliminate the existing cottages from the park. The economic value of these measures of recreation was estimated by combining the flow model results with the results of the 2011 Visitor Surveys. Next, surface water supply for residential use was modeled for the Lake of the Woods regions by looking at precipitation, snowmelt, infiltration, evapotranspiration, flow, and water use. Finally, sediment regulation for agricultural users was modeled for the same region by looking at runoff characteristics, soil erodibility, land cover, topography, drainage, stream and floodplain characteristics, and impacts on beneficiaries.
The ARIES model runs produced a number of map outputs that can help managers better understand the important sources, sinks, and beneficiaries of ecosystem services in the two study areas. One group of maps shows the quantity of service flows and room for improvement. This includes maps showing: the theoretical amount of service flow that could be produced by an ecosystem; the amount that could reach beneficiaries if there were no sinks; the amount that does reach beneficiaries given existing sinks; and the room there is for improving flows to beneficiaries by reducing sinks. The second set of maps shows problem areas where flows might be blocked or attenuated.
The carbon map outputs for Algonquin Provincial Park did not include flow paths, because carbon sequestration is assumed to accrue global benefits through atmospheric mixing. However, maps do show hot spots for carbon sequestration. Individual locations vary from zero to approximately 1.25 tons of carbon per hectare per year sequestered, with a total estimated sequestration value for the entire park of 1,375,870 tons of CO2 per year. The western and southern sections feature higher sequestration rates. The results of the carbon sequestration model could be used to inform timber management and harvest planning within the Park by eliminating (or minimizing) areas with high sequestration and storage potential from consideration for thinning or harvesting operations. Using a social cost of carbon of $73/ton, based on a pair of meta-analyses by Tol (2008 and 2011), we find that the carbon sequestration value of the park is over $102 million per year. The dollar value of sequestration by pixel is also mapped out.
Among the many outputs for the recreational model for Algonquin Provincial, are maps showing sources of scenic beauty, areas that block or reduce visual amenities through visually undesirable features, the location of beneficiaries, and the amount of visual amenity flowing from the sources to the beneficiaries. This was done for backcountry canoe users, backcountry hikers, and frontcountry campers. These maps show hotspots of visual enjoyment, areas that are potentially visually valuable but not visited, and areas where existing features are deteriorating an otherwise scenic viewshed, among many other things. These results were combined with the outputs of the 2011 Visitor Survey. Economic data from this Survey were used to attach a dollar value to the abstract units of visual amenity coming out of this model, with that number at $0.13 per unit. This then allowed us to map out estimated economic value per pixel.
For water supply in Lake of the Woods, outputs included maps showing surface water supply sources (separately for those that connect to and do not connect to beneficiaries), flow paths, and water use by beneficiaries. This information was combined with value transfer estimates from the literature of the per hectare water supply value of forests to yield an estimated water supply value of $845,000, a value that accounts for which lands have hydrologic connectivity to downstream users. For sediment regulation in this study region, maps were created showing sources of sediment to downstream farmers (the beneficiaries), the flow of sediment, locations where this sediment is deposited, and locations where this deposition is used by beneficiaries. This analysis finds that out of over 8 million tons of sediment generated in the study area per year, 42 thousand tons are utilized by beneficiaries. This information was again combined with value transfer estimates from the literature, this time of the per hectare sediment regulation value, to yield an estimated sediment regulation value of $38,000.
Finally, a scenario was run using ARIES to see how flows of visual recreational services might change in Algonquin Provincial Park if all cottage leases were removed. Backcountry hikers saw the biggest improvement in visual conditions in absolute terms as a result of this, followed by backcountry canoe users and frontcountry campers, but in percentage terms, the greatest increase was for frontcountry campers, followed by backcountry hikers, and then backcountry canoe users. A map was also produced showing where the greatest increases in visual quality occurred as a result of the scenario.
This project found that the ecosystem services framework can be a valuable tool for assessing and measuring the contributions of parks and protected areas and for evaluating the potential impacts of alternative management scenarios. Remote parks characterized by small visitation and long distance to human communities do pose a significant challenge for application of the ecosystem services framework, largely because their weak connectivity to humans makes their contribution to human well-being extremely difficult to quantify, except in the case of globally-realized services like carbon sequestration. While society highly values these parks, it is often in ways that defy quantification. Therefore, these parks may not be ideal candidates for assessment using this framework. Nonetheless, many parks in Ontario do get excellent visitation or have clearly identifiable connectivity to human communities, in which case an ecosystem services framework can greatly enhance our understanding of how these parks contribute to human welfare. Value transfer represents a simplified “back of the envelope” approach for quickly estimating ecosystem service values when budgets and existing context-specific valuation estimates are limited. However, where resources are available, we find that a spatial modeling approach, such as that used with ARIES, offers a much richer understanding of the sources, sinks and flows of ecosystem services to distinct beneficiary groups. While it is time-consuming and requires considerable technical expertise to develop these models, once they are developed, they can be easily adapted to model scenarios or applied to contextually similar parks throughout the provincial park system, making them potentially very valuable management tools.
1. Background
1.1 Ecosystem services framework
Functioning ecosystems are essential to human survival and well-being and yet their value is not adequately accounted for by society (Costanza et al. 1997, Wilson et al. 2004). The phrase “ecosystem services” refers to the wide suite of goods and services provided to humans for free by nature: goods such as food, fuel and fiber; regulating services such as climate stabilization, water supply, and flood control; and nonmaterial assets such as aesthetic views or recreational opportunities (Costanza et al. 1997).
When functioning ecosystems are developed for agriculture, urbanization, or other economically productive activities, this increased economic productivity comes at a tradeoff. Services that the ecosystem once provided for “free” may now be compromised or eliminated. The ecosystem services framework is designed to look at the multiplicity of services provided by a single ecosystem so as to better weigh opportunity costs associated with the conversion of natural environments (Farber, Costanza et al. 2006). It also provides a framework for evaluating the “return on investment” for ecological restoration activities.
For instance, a forested watershed upstream from a community might provide valuable benefits to that downstream population (e.g. see Kaiser and Roumasset, 2002), like regulation of flood peaks (which protects property from destruction), regulation of water for municipal supply (which helps ensure a reliable and regular flow of water), filtration of nutrients and pathogens in the water (which maintains high quality of drinking water supplies), and scenic amenities for recreation and enjoyment (which can be reflected in nearby property values). Urban development of that watershed would result in private market benefits, entailing a number of social costs that are external to the private development decision. For example, the removal of forest cover may mean that new structural flood controls might have to be built, or downstream property would be destroyed; a filtration plant might need to be built to deal with the increasingly turbid water supply; or consumer surplus would be lost along with the amenity value of the local forest. The ecosystem services framework provides an approach for weighing whether those market benefits outweigh those social costs.
The landmark 2003 Millennium Ecosystem Assessment (a major report on global ecosystem change commissioned by the United Nations Secretary General) places ecosystem services into four categories: provisioning (e.g. food, fresh water, fuel, genetic resources), regulating (e.g. climate, disease and flood regulation), cultural (e.g. recreation, aesthetics, and education), and supporting (services necessary for production of other ecosystem services, e.g. soil formation, waste treatment, and nutrient cycling). An example of how services can be hierarchically subdivided under this framework is given in Table 1.
Ecosystem goods and services occur at multiple spatial scales, from climate regulation and carbon sequestration at the global scale, to flood protection, water supply, soil formation, nutrient cycling, waste treatment and pollination at local and regional scales. They also vary with regard to how directly connected they are with human welfare, with services like carbon sequestration being highly indirect in its connection, while food, raw materials, and recreational opportunities are far more direct (Wilson and Carpenter 1999).
Table 1. Millennium ecosystem assessment framework with sample services in each class
| General ecosystem service type | Specific ecosystem service type | Example |
|---|---|---|
| Regulating (Regulation of natural ecosystem processes) | Disturbance moderation | Avoided flood and storm surge damage provided by wetlands and riparian vegetation |
| Regulating (Regulation of natural ecosystem processes) | Air quality and climate regulation | Sequestration of harmful greenhouse gases provided by vegetation, filtering of airborne particulate matter by foliage |
| Regulating (Regulation of natural ecosystem processes) | Freshwater regulation | Improved groundwater recharge capacity provided by streamside forests, allowing for increased supply of clean municipal water |
| Regulating (Regulation of natural ecosystem processes) | Waste treatment | Organic pollution control and detoxification provided by wetlands and riparian buffers |
| Regulating (Regulation of natural ecosystem processes) | Wildlife habitat | Feeding and breeding ground for identified aquatic or terrestrial species |
| Supporting (Necessary for producing other ecosystem services) | Nutrient regulation | Improved nutrient/sediment filtration capacity of off-site wetlands and stream buffers |
| Supporting (Necessary for producing other ecosystem services) | Soil formation | Ability of ecosystems to facilitate the formation of soil needed for other ecosystem services |
| Cultural | Amenity/aesthetics | Improvement of aesthetics and associated re-sale values for nearby residential properties and commercial developments |
| Cultural | Recreation | Improvement of greenspace recreation opportunities through off-site wetland revegetation and stream remediation |
| Provisioning | Food, fiber, fresh water, fuel, genetic resources, etc. | Firewood of fibers from forests, medicinal botanical resources, fresh water supply from springs, etc. |
1.2 Ecosystem services and decision making
In many cases, the internalization of ecosystem services can result in management decisions that simultaneously increase economic productivity while minimizing environmental harm. A classic example of this is pollination for coffee farms in Central America. Rickets et al. (2004) found that preserving large patches of intact forest around coffee plantations rather than converting them to additional agricultural production resulted in significant boosts to coffee productivity and increases to net income. Keeping those forests intact not only helped productivity, but provided a number of ancillary environmental benefits.
A number of attempts have been made to apply ecosystem services frameworks to decision making around natural landscapes, mostly in the tropics. Among the most noteworthy is Costa Rica’s Payments for Ecosystem Services. Based on a 1996 law, this system gives financial incentives for land management that promotes four services: greenhouse gas regulation (sequestration), hydrological services, biodiversity protection, and scenic beauty. Private owners of forested land are given payments over five years but relinquish “ecosystem service rights” over a 20 year period under an easement. This program is funded by a tax on fuel as well as the sale of carbon offsets and hydropower credits. All forests are treated the same for payment purposes regardless of composition. Today nearly 300,000 hectares are registered in this program.
The US federal government has a similar system with its Conservation Reserve Program, which pays farmers on environmentally sensitive land to keep that land out of intensive production but, again, payments are not based on ecosystem service values. A slightly more sophisticated PES program is under development in Lombok, Indonesia, where the World Wildlife Fund is working with the government to develop a system where upland forest owners get paid not to cut down the forest by downstream agriculturalists. There are other examples of policies designed to manage for single ecosystem services — most notably carbon forest offset regulations. In this scheme, landowners get a payment for reforestation, based on the market price of carbon which, in theory, should reflect its social cost. However, despite this peripheral use of ecosystem service-based concepts, there are no good examples of governments using valuations of the whole suite of ecosystem services to help inform policy. Currently, various federal agencies including the Environmental Protection Agency, US Geological Survey and US Department of Agriculture have established offices or task forces to better integrate consideration of ecosystem services into agency procedures and policies (an example is the USDA’s Office of Environmental Markets), but these initiatives are generally under-resourced and have yet to see tangible outcomes in public policy. In Canada, some programs exist that are similar to PES schemes, such as the Phosphorus Trading program in South National River Watershed, Ontario, in which regulations on waste water phosphorus loadings are coupled with a permit trading.
In practice such attempts to integrate ecosystem services into decision making are rare. For instance, ecosystem services are almost never accounted for in standard cost-benefit analysis. This is to a large extent because while market benefits are easy to calculate, non-market costs and benefits are definitively not so—and frequently they are not even recognized until after they are lost, as was the case with wetland destruction from Hurricane Katrina (Chambers, Fisher, et al. 2007). Non-market valuation of ecosystem services is technically difficult and expensive requiring extensive data collection. Many services, particularly those related to culture and health, are nearly impossible to value. Therefore, while some lands managers are increasingly eager to at least try out the integration of ecosystem service values into cost-benefit analysis, many academics are realizing that monetary measures must be integrated with non-monetary indicators to get a complete picture of ecosystem service provision (Daily, Polasky et al. 2009) even if that complicates the process of making tradeoffs.
An important barrier to implementing the ecosystem services framework that has also been highlighted as a critical research priority is the lack of understanding of how services flow across the landscape from ecosystem to beneficiaries (Daily, Polasky, et al. 2009). Without an accurate accounting of ecosystem service flows, only the theoretical potential that an ecosystem has to provide a service is known. Modeling ecosystem service flows allows spatially explicit connections between ecosystems and people to be identified so that actual service delivery can be quantified. This type of modeling makes a much stronger case to land managers and other stakeholders by showing that a specific piece of land delivers a specific suite of benefits to a specific set of beneficiaries. Therefore the impacts of a decision to alter that piece of land become much more tangible. Advances in geographic information technology and data have allowed this type of an approach to become technically feasible. The Artificial Intelligence for Ecosystem Services modeling framework (ARIES) (Villa et al. 2009) used in this project takes just such an approach.
1.3 Ecosystem services as a framework for protected areas
Protected areas are favourable targets for implementing an ecosystem services-based framework. They have been recognized not only as an essential component in the conservation of global biodiversity, but also as a key sustainer of local livelihoods (Naughton-Treves, Holland and Brandon 2005). They are typically in government or non-profit ownership, which removes their management from the typical profit-maximizing or risk-minimizing strategies of private owners. As such, they lend themselves to coordinated land management strategies based on internalization of normally externalized non-market values. The most relevant types of protected areas to ecosystem service based management are those that are spatially connected to beneficiaries via ecosystem service flow networks and are large enough to provide flows of services independent of outside conditions. The type of network connection varies depending on the ecosystem service: downstream hydrologic connectivity for flood, nutrient or water supply regulation services; line of sight or accessibility to communities via transport for recreation services; downwind location for pollination services; or global benefit, in the case of greenhouse gas regulation services.
Protected areas are, obviously, vastly more effective at protecting biodiversity and habitat than emerging PES schemes. Costa Rica’s example is telling. The annual deforestation rate in that country fell from 1.4% to 0.1% in twenty years as a result of a massive investment in protected lands by the government. After the PES scheme was implemented, following this massive drop, incremental decreases in deforestation were nearly imperceptible — dropping by only about .05%.
In other words, purchasing land for protection is still by far the most effective way to protect landscapes. However, the problem is that society typically does not fully recognize or account for the ecosystem service benefits rendered by land conservation. As a consequence, governments under-invest in the purchase of land for this purpose. Therefore, what protected lands agencies require is to prove quantitatively the extent of the benefits yielded by functioning landscapes to justify the further acquisition of lands and, more importantly, to target where the investments would be most effective and valuable to society.
1.4 General approaches to quantifying ecosystem services in this project
A significant number of studies have attempted to spatially characterize ecosystem services (e.g. Eade and Moran 1996, Chan et al. 2006, Raudsepp-Hearne et al. 2010, Troy and Wilson 2006). Approaches can be broken down in a number of ways, including whether or not they account for economic valuations, are based on original or transferred data, and are dynamic or static in space and time. In this study, we adopt two approaches, described below: a spatially static economic valuation using transferred valuation estimates (value transfer) and a dynamic modeling of the flow of ecosystem services from source, through sinks, and eventually to beneficiaries (ARIES), whose end results are cross-referenced against static valuation information.
1.4.1 Background on static approach: Ecosystem service value transfer
Environmental economists have attempted to value nature and nature’s services for decades. A number of valuation methods have been utilized over the years. Below is a sampling of these methods:
- Contingent valuation: this method uses surveys to elicit “stated preferences,” often in the form of “willingness to pay” for a hypothetical or real good, service, or condition.
- Travel cost: based on the assumption that people’s willingness to pay to be in a location is worth at least as much as they paid for a trip to it, this method statistically disaggregates the amount spent on recreational visits to a site to derive a “revealed preference” and estimate the value of that site or some quality associated with it.
- Hedonic pricing: assuming that housing prices reflect many “shadow prices” for attributes that are valuable, but not directly traded in the market (e.g. proximity to a park), this method disaggregates that price to reveal preferences among bidders in the housing market. In the “first stage” of this method, a marginal willingness to pay for a change in some environmental variable can be estimated, while in the second stage aggregate welfare benefits from that change can be estimated.
- Conjoint analysis: this survey-based method presents respondents with scenarios composed of different combinations of characteristics; the revealed tradeoffs can then be used to estimate marginal rates of substitution between those characteristics which can, in some cases, include money.
- Avoided cost: this is an accounting-based method of estimating the potential financial damages avoided by preserving an ecosystem and maintaining its services. For instance, if flood-reducing wetlands were filled, how much damage would result to downstream housing? The assumption is that the service must be worth at least what people pay to repair the damage caused by the force once regulated by the ecosystem.
- Replacement cost: this is similar to avoided cost, but the assumption is that society would not accept the potential damages resulting from an unregulated system and so would pay for some engineered substitute, like levees, in the case of flood. Hence, the cost of the substitute becomes the lower bound estimate of the value of the service. Another example of this would be the cost of a water-filtration plant that would be needed in the wake of massive land clearance in a supply watershed.
The static ecosystem service assessment approach used in this study is known as “value transfer”. Conducting original valuation studies using the methods discussed above can be extremely costly and time consuming. Frequently, managers need rough estimates of ecosystem service values but lack the time or money to fund such research based on the location where it is needed. Therefore, a common practice is to use information generated in other research sites which are contextually similar to the policy site. This approach of appropriating information from another study for use in a policy site is known as “value transfer” or “benefits transfer”.
Value transfer involves the adaptation of existing valuation information to new policy contexts where valuation data is absent or limited, using valuation estimates from the established literature (Loomis 1992). For ecosystem service valuations (ESVs), this involves searching the literature for valuation studies on ecosystem services associated with ecological resource types (e.g. forests, wetlands, etc.) present at the policy site. Value estimates are then transferred from the original study site to the policy site based on the similarity of both the ecological resources themselves and the socioeconomic context of the human beneficiaries of ecosystem services present at the policy site. It is important that the studies from which valuation multipliers are obtained for transfer are from contexts that are as similar to the policy site as possible (Desvousges, Johnson et al. 1998). This means that not only must there be similarities in the ecosystem type being valued (e.g. wetland), but ideally, there is also similarity in contextual factors such as climate (e.g. temperate vs. tropical), local supply/scarcity of the ecosystem type in question, size of beneficiary community (e.g. rural vs. suburban vs. urban), and characteristics of beneficiaries (e.g. developed vs. developing nations).
Many value transfers only result in an aggregate value number for an entire study area. However value transfer can also be performed in a spatially disaggregate manner, allowing for the assessment of geographic variability in ecosystem service provision. In this approach, estimates of ecosystem service flow value (typically measured in dollars per hectare per year) can be summarized by geographic units, such as by watershed or parcel. Such information can be valuable in planning applications.
Value transfer is relatively quick and easy to perform, but it is riddled with a number of limitations. One is that it only looks at the amount of area of ecosystems. This is important because ecosystem processes depend not just on the amount of an ecosystem type, but on its spatial pattern (Alberti 2005). For instance, two landscapes may have the same area of forest, but in one that forest might be in one big patch, allowing for more interior species, while in another, it might be highly fragmented into many small patches.
A second limitation is that the valuation literature is extremely incomplete when it comes to ecosystem services. The paucity of empirical economic valuation studies is one of the most significant constraints to spatially explicit value transfer today. In cases where we know of no valuation estimate, we have no choice but to treat the value as zero, even though this greatly underestimates the value of natural systems. So, in many cases we undervalue resources because of a lack of valuation estimates. But in other cases, we might overvalue them because the only valuation studies available are from “higher value” contexts. Likewise, the small number of usable studies means we need to create “lumped” categories which contain a great deal of internal heterogeneity. For instance, a “forest” land cover category necessarily includes both early successional and old growth forests, yet clearly the two yield very different ecosystem service profiles. Rarely would the valuation literature or GIS data be available to make this distinction. Another important dimension that is generally ignored in value transfer due to lack of data is contextual scarcity. We expect that the scarcer a particular ecosystem type is, the more unsubstitutable it is, and the greater its marginal value is relative to an ecosystem type that is abundant in a region.
The limitation in the coverage of the literature is understandable when one thinks of all the dimensions of variation that go into the transfer function: land cover type, ecosystem service type, geographic location, socio-economic context, biophysical context, scarcity, etc. Finding a study that perfectly matches one’s need in a particular value transfer context is understandably difficult. Related to this limitation is the fact that so many of these attributes are poorly documented within these studies, if they are documented at all. Most published studies on non-market valuation were not intended for meta-analysis or value transfer, so mining them for the needed attributes is often difficult and requires consultation of background material. There has been a discussion of the need for journals and societies to adopt a system metadata and annotation that could be used for this purpose (Villa, Ceroni et al. 2007).
In addition to the relatively limited number of usable studies is the fact that what studies exist are somewhat skewed towards certain services — particularly recreation, aesthetic/amenity, and other cultural services. This has much to do with the fact that economists largely conduct these studies and the methods for addressing these services are well established in their literature. That means that value transfer generally underestimates the value of more biophysical services, such as nutrient regulation, soil regulation, disturbance avoidance, water supply regulation, etc. To a certain extent this lack of studies in these areas is due to the fact that they are often valued through accounting methods such as replacement or avoided cost, but these methods are out of favor with many economists, who consider them too simplistic. Further, journals often will not publish these studies because they are considered to have little academic novelty.
Yet an additional problem is how to categorize ecosystem services so as to be complete while avoiding double counting. There are many ways of categorizing services and there is clearly a great deal of “bleed-over” between services in any such categorization. For instance, should the category “habitat refugium” be its own ecosystem service category or should it instead be counted under end use-services, such as recreational hunting/fishing/birdwatching? Should “water quality” for lakes be included as an ecosystem service category or should it be counted under recreation, since it mainly applies to water-borne recreation? These questions are complicated by the fact that so much of the literature is vague on the question of exactly which service is being studied. Very often the valuations being presented are for a composite set of services that cannot easily be disentangled. In these cases it is critical to be consistent from study to study so that no double counting occurs. These questions are extremely important because what valuation estimates we average together will depend on how we lump or split ecosystem service categories. We must strike a balance between averaging together valuations that are actually complements (e.g. averaging a bird watching recreational study and a canoeing recreational study), and separate out values that are really duplicative.
Finally, there is the problem of quantifying non-use values, including existence or option values. This is a particularly important issue for protected areas in Ontario because so many of them are remote from settled areas. When parks are remote, that means far fewer people directly benefit from them than in the case of lands proximate to urban areas. Obviously parks receive many visitors, but with the exception of the most heavily visited parks, it is reasonable to assume that their intrinsic value is far greater than the sum of expenditures of willingness to pay of the actual visitors. Rather, society recognizes that these remote parks are valuable and important, yet most would hesitate to try to put a dollar value on these abstract wilderness characteristics. We choose not to include studies of non-use option or existence values in our value transfer analysis because these values are highly controversial among academics and have been noted as subject to significant biases (e.g. Boudreaux, Meiners, et al. 1999). In particular, it has been found that respondents to non-use value surveys can be conflicted in assigning dollar values to concepts they hold in a non-quantitative ethical framework, rendering them unable or unwilling to monetize meaningful existence values (e.g. Stevens, Echeverria et al., 1991, in the case of wildlife). This difficulty in monetizing intangibles suggests that alternate forms of input are needed for characterizing the many societal values of remote parks. Such forms of input could include qualitative surveys, multi-criteria decision analyses, non-monetary group valuation processes, or conjoint analysis surveys, which elicit marginal tradeoffs from participants.
1.4.2 Background on the dynamic approach: ARIES approach to modeling ecosystem services
Maps of the values to society associated with ecosystem services have been used for many years to frame the inherent trade-offs between conservation and development. Continued interest in the use of ecosystem services as part of a decision making process has been met with increasingly sophisticated methods and tools to quantify ecosystem service values. The ARIES modeling platform has been developed to systematize the mapping and valuation of ecosystem services with the ultimate goal of facilitating policy decisions and resource management.
Many researchers have noted that the provision and use of ecosystem services take place at different temporal and spatial scales (Ruhl et al. 2007, Fisher et al. 2008, Tallis et al. 2008). ARIES maps the locations and quantity of potential provision of ecosystem services (sources), their human beneficiaries (users), and any biophysical features that can deplete service flows (sinks). Finally, ARIES selects from a family of agent-based algorithms to map the movement of services (flows) among the source, sink and use locations (Johnson et al. 2010). Agent-based modeling techniques simulate the micro-level behavior of individual actors within a larger system. These actors interact with one another as well as the economic and ecological systems that contain them. ARIES flow models move different ecosystem services across the landscape using service-specific routes (e.g. lines of sight for scenic views, hydrologic networks for water supply, or flood, sediment, and nutrient regulation, transportation networks for recreation or ecosystem goods, distance decay for open space proximity). Source, sink, use and flow values are represented in either concrete units (e.g. tons of CO2, cubic meters of water, kg of fish) or abstract units (e.g. aesthetic value, recreation site quality, indexed from 0-100).
An ecosystem service is further categorized as either a provisioning or preventive and rival or non-rival. A provisioning service is one in which the matter, energy, or information generated by an ecosystem source is of direct value to human users, such as drinking water, fish, or scenic views. A preventive service is one in which a benefit is provided to people by an ecosystem reducing the flow of something dangerous to them (e.g. excess sediment, nutrients, or flood water). For provisioning services, the source locations provide the ecosystem service benefit and sinks limit the amount of service received, while for preventive services, sink locations (e.g. areas that absorb flood water, sediment, or nutrients) provide protection from detrimental sources. The effects of some service flows like sediment transport may be either beneficial or detrimental, depending on the human user – in some cases excess sediment or excessively turbid waters damage human well-being, while in other cases naturally delivered sediment provides benefits, such as in maintaining soil fertility or natural coastal processes. Finally, understanding whether the benefit is rival or non-rival indicates whether the use of that service by one beneficiary depletes the quantity available to other beneficiaries elsewhere on the landscape. Rival use implies that beneficiaries compete with one another for access to a service (e.g. the water that irrigates one crop is not available for others located downstream) while non-rival users do not (e.g. aesthetic views can be enjoyed regardless of how many people are there to watch).
Figure 1 depicts the components of a hypothetical service analysis to help clarify the key ecosystem service concepts adopted in the ARIES methodology. The blue and green polygons represent the source and use locations of an ecosystem service, respectively. The service flow follows the arrows between source and use locations, with the line thickness representing the quantity of flow moving across the landscape. Beige polygons represent sink locations where the quantity (or quality) of a service flow may be depleted. The quantity of service delivery and the flow connections between source and use locations may be enough to satisfy the demand of all beneficiaries. Conversely, an inadequate supply or a lack of connectivity will result in unsatisfied demands that may need to be met via other mechanisms (e.g. water purification facility, flood control structures). Finally, if multiple flow paths or the delivery of a large quantity of a service is concentrated in constrained areas, those areas are critical to the delivery of the service and policy decisions need to ensure that these locations are set aside for protection or designated for rehabilitation.
Figure 1: Key concepts of the ARIES modeling framework.

Most existing tools attempt to convert qualitative information, chiefly land use type, into estimates of value. ARIES takes a more realistic view of ecosystem services that accounts for the complex dynamics of ecosystem services and allows a more precise and spatially explicit quantification of the benefits provided by ecosystem services. Because such computations are necessarily complex, ARIES employs artificial intelligence to automatically select, prepare and process the data and models necessary for a useful assessment. The ARIES modeling platform differs in key ways from other approaches to quantifying ecosystem services (Villa et al. 2009):
- ARIES is a modeling platform rather than a single model or collection of models, capable of incorporating existing ecological process models where appropriate or ad hoc models when necessary.
- The ad hoc models are probabilistic, Bayesian models, which offer the advantages of explicitly conveying uncertainty and being capable of operating in data-scarce conditions.
- ARIES explicitly accounts for the spatial dynamics of ES, linking source and use locations with flow algorithms that account for service delivery and interruption.
ARIES computes the flow of beneficial (e.g. potable water) and detrimental services (e.g. flood water), and how human development and landscape interventions (e.g. construction of dams) affect these flows. ARIES model outputs provide a full accounting of winners and losers as well as potential vs. actual provision for each ecosystem service. It allows decision makers to plan interventions and policy in a very precise way to avoid or minimize damage, or develop plans for restoring or enhancing key services if they are impaired. The results contain not only the accrued value to each group of beneficiaries, but also the amount of service production that could not reach beneficiaries due to the spatial mismatch in source and use locations. Additionally, model results can highlight critical pathways (i.e. places where multiple flows converge in high density or where single flows transmit all the service to a group of beneficiaries) as being highly valuable for protecting access to services, regardless of strategies to protect the sources or sinks from which they originate. ARIES model results provide precisely the kind of information that planers need to maximize the value of infrastructure to the economy.
However, these results do not necessarily depend on economic valuation. The indicators that come out of ARIES show that a particular ecosystem is benefiting people without necessarily placing an economic value on those benefits. Nevertheless, ARIES can be integrated with a value transfer approach to estimate economic values attributed to service provision. In this approach, any ecosystem that has a realized flow of services to beneficiaries (i.e. source and use locations are connected via flow paths) would adopt a per-unit-area valuation estimate based on a study from the literature database whose beneficiary group was similar to that in the study in question. This is, of course, easier said than done, as there are limited studies to use in value transfer, and tremendous variability in the real world. Another approach that could potentially be used to integrate valuation into ARIES would be to use the model outputs as the basis of an original avoided or replacement cost study. For instance, using ARIES, it could be determined how changing a wetland could cause flood damage to property. By running probabilistic flood scenarios, a likely damage function could be estimated and the avoided costs of not degrading the wetland could be calculated.
Where the value transfer approach described in section 1.3 assigns the same value to all similar land cover types (e.g. all hectares of forest are worth the same number of dollars per year), ARIES seeks to spatially map out the connections between each ecosystem service providing region and its human beneficiaries, in order to distinguish which areas are more valuable than others based on this connectivity. This level of specificity allows for much finer-grained planning and management decisions and can help to allocate limited resources to those areas which are likely to provide the greatest return on investment.
In this project, which is designed to be a proof of concept study, we make use of many but not all aspects of the functionality of ARIES. We implement only some of the ecosystem service models which have been designed so far: atmospheric regulation, recreation, sediment regulation and fresh water regulation. This was in part due to the scope and budget of project, and in part due to the fact that, for the case study areas examined, only a limited number of services were applicable or beneficiaries for certain types of services were not identifiable. Another aspect of the ARIES framework functionality that we did not employ in this project was the creation of customizable standalone models with user interfaces that would allow for the client to run their own scenarios or permutations. This requires a major investment of programming and web design that was unfortunately beyond the resources of this current project. However, this project was not intended to produce such a standalone product for future consumption, but rather to offer a proof of concept of how the ecosystem service models in ARIES work, what types of information they require as input and what types of indicators they generate. Ideally, this study will allow decision makers to evaluate whether future investments in ARIES to generate such decision support products are warranted.
2. Case study areas
Three case study areas were included in this project: Algonquin Provincial Park, the Lake of the Wood Study Area and the North Shore Study Area region. The first two areas were cases studies for the ARIES methodology. The third was the case study for the static value transfer analysis. These areas were chosen through a lengthy consultative process between the study authors and staff from MNR. A number of criteria were specified in determining case study areas. Both ARIES case study sites were chosen to have protected areas and natural landscapes large enough to contain significant service-providing ecosystems. One of those two was chosen such that park lands had hydrologic connectivity to populated communities. The other was chosen so that park lands had significant recreational visitation and available data on that visitation.
2.3 North Shore study area
The North Shore study area (Figure 2) was chosen to be the site for the static value transfer analysis. It is by far the largest of the study areas, at roughly 39,000 square km. Roughly 6,200 square km of that area is water. This region was chosen for value transfer because this method allows for the relatively easy analysis of very large areas. Additionally, the region was selected because it includes a large number of provincial parks and protected areas (28 parks, 4 park additions and 40 conservation reserves), as well as several urbanized locations that are potential beneficiaries of the ecosystem services generated within the parks and protected areas. Additional uses of land in this area include forestry, mining and agriculture.
Figure 2: North Shore study area.

The study region includes portions of the Thessalon, Sudbury, LaCloche and Mississagi ecoregions. The two largest communities in the study area are Sudbury and Sault Ste. Marie. A number of protected areas are found in this region including Matienda, Little White River, Mississagi Killarney, French River, Spanish River, and Algoma Headwaters. Total area of provincial parks is 3,600 square km. The population of this region is approximately 300,000 people. Much of the land area is in “unorganized” administrative units, including the Sudbury North and Algoma North unorganized units.
2.1 Algonquin Provincial Park
With its large size (nearly 7,630 km2), iconic status, second highest visitation of any park in the province (more than 800,000 visitors annually), and its range of infrastructure from developed campgrounds to backcountry campsites, hiking and portage trails, and scenic vistas, Algonquin Provincial Park (Figure 3) was identified as an ideal location for modeling recreation-based ecosystem services. Given its large spatial extent and forested land cover, it is also believed that the park plays a significant role in sequestering regional carbon emissions.
Figure 3: Algonquin Provincial Park study area

2.2 Lake of the Woods study area
The Lake of the Woods Provincial Park (Figure 4) was selected for modeling sediment transport and freshwater ecosystem services using ARIES. This site was identified as suitable due to its hydrologic connection to surrounding communities, a necessary condition for evaluating hydrologically-based ecosystem services. The modeling effort focused on two sub-watersheds in the region. This area was identified as having the most complete data set available for modeling hydrologically-based services.
Figure 4: Lake of the Woods study area

3. Detailed methods
3.1 Value transfer methods
Spatial Informatics Group, LLC (SIG) conducted a spatially explicit ecosystem service valuation for the North Shore study area region of Ontario using its proprietary Natural Assets Information System™ database and query engine along with the spatial value transfer-based methodology outlined by SIG Principal Dr. Austin Troy and former SIG Principal Matthew Wilson in their 2006 article “Mapping ecosystem services values: Practical challenges and opportunities in bridging GIS and value transfer” (Troy and Wilson 2006).
The value transfer element of this project used the following workflow, based on Troy and Wilson’s article:
- study area definition
- typology development;
- literature search and updating of Natural Assets database;
- mapping; and
- total value calculation.
Step 6, geographic summaries of value, was not requested by the client. Steps 2 and 3 are presented together because of their iterative nature.
3.1.1 Step 1: Study area definition
The study area was determined by MNR. A GIS layer was sent by MNR to SIG containing the boundary files for this study area. It includes portions of Lake Huron to a maximum of 16 km offshore.
3.1.2 Steps 2-3: Typology development and literature search
The next step was the definition of a typology for land cover and ecosystem services to serve as the value transfer linkage. The land cover typology was initially based on land cover data provided by Ontario MNR, but significant alternations to the typology were made in order to increase the contextual specificity of several land cover types. This modification allowed for more precisely defined land cover classes and hence more precise valuation estimates associated with land cover. In addition to developing a land cover typology, we also developed a customized categorization of ecosystem services. This categorization was similar to that contained in the Millennium Ecosystem Assessment (2003), but with some modification. The insufficient number of studies in the literature and the lack of information in many of those studies required us to lump multiple ecosystem service categories together. Our list includes the following services:
- recreation,
- aesthetic/amenity,
- other/general cultural services,
- pollination and seed dispersal,
- habitat refugium and biodiversity,
- atmospheric regulation,
- soil retention and erosion control,
- water quality maintenance and nutrient/waste regulation,
- water supply and regulation, and
- disturbance avoidance.
Valuation estimates are contained in our literature database, The Natural Assets Information System ™ (NAIS). The database consists of a large number of summaries of valuation studies, tagged with extensive information about the study (bibliographic information), the valuation (e.g. value per unit area or household, year of valuation, valuation method used, currency, economic models used, etc.), the ecosystem service and land cover types valued (using our typologies designed specifically for this study), the location(s) in which the study was performed, and notes on how per hectare values were derived, if relevant. These tags allow us to easily write queries to filter and summarize studies. We built on the existing literature database by adding some studies and filtering some out. The database currently includes studies only of non-market values and is not intended to track direct market values (that is, benefits based on actual expenditures). However, a small number of valuation estimates in the database are composites that include elements of market values mixed in with non-market values. For instance, although all of the recreation studies used in the database look at non-market goods, two (Wilson 2008 and Olewiler 2004) include some element of market expenditures blended with non-market values, but separating out the market from non-market expenditures in these studies was not possible given the scope of this project. However, given the relevance of these studies to Canada, we chose to use them, regardless. Some of the valuation estimates are reported in the literature as dollar per acre or hectare figures. However, many are reported as total aggregate values for an entire region, values per household, or values per individual. In these cases, ancillary data are needed to make calculations to convert these to dollar per hectare. Notes on these conversions are kept in the database. Value estimates reported as stocks (one time values) are converted to flows using a discount rate. If the author gives a suggested rate, we use that. Otherwise, we generally use a 3% rate for discounting.
One particularly difficult challenge we faced in our analysis was how to deal with the valuation of atmospheric carbon sequestration, which we classify under “atmospheric regulation” in this study. There are literally hundreds of studies that have attempted to put a social cost value on each ton of atmospheric carbon, with widely diverging results. Rather than include all these studies in the database, we used a meta-analysis by Tol (2008 and 2011) of 211 studies from the literature on the social price of carbon. We used the mean of all the peer reviewed studies from Tol’s meta-analysis, based on a Fisher-Tippet Probability Distribution Function, which accounts for strong right-tailed distributions. This value was $71/ton (the number is $127/ton when non-peer reviewed studies are also included). Thus, rather than relying on any one estimate of the social cost of carbon, Tol’s study allowed us to average across a wide range of studies, limiting the level of bias. To go from a social cost per ton of carbon to a per hectare ecosystem service value for carbon sequestration for forests, we then use a well-established study by Birdsey (1992), which estimates yearly sequestration rates of a hectare of North American forest at 1.4 tons per year. This average sequestration rate plus the social cost per ton then allows for the estimation of a value per hectare for this ecosystem service. We assumed that all forest types in our typology sequester equally. While forest carbon sequestration rate clearly does vary based on factors like forest type, size class, and successional stage, we simply did not have the geographic data to make these distinctions. Overall, we believe this approach represents a very conservative estimate of the value of carbon sequestration.
The Natural Assets database was filtered to search for valuation studies relevant to this project. This included studies for land cover types present in the study area and geographic regions that were contextually similar. We determined that we would include studies from temperate areas of North America, Europe, and New Zealand, as these represent roughly comparable environmental and socio-economic contexts. Many candidate studies had to be individually excluded based on factors that made them incompatible, such as studies that quantified the regulating ecosystem services associated with salt water estuaries. On the other hand, a study looking at the amenity value of a salt water estuary could potentially be considered for inclusion because that amenity value could be construed to be comparable for both salt-and fresh-water contexts. To the best extent that the information in the studies allowed, we attempted to avoid any double counting of services.
The literature database is mostly comprised of peer-reviewed literature, but several non-peer-reviewed, or “gray literature” studies were included because of their very close contextual similarity. Only one secondary study was used in our database; Olewiler (2004) reports valuation estimates that came from a different study but the text of that study could not be obtained, so we cite Olewiler although the information contained is secondary.
We also decided to include Olewiler’s estimates from the Mill River watershed in Prince Edward Island because, although it is somewhat distant from the North Shore, it is much more ecologically similar to the North Shore region than most of the other studies in the literature. We excluded economic values from other value transfer reports (that is, where averages of multiple estimates were used), unless these values were original economic values developed in these reports.
The valuation estimates used from the database are similar to those in the Southern Region Study from 2009 (Troy and Bagstad 2009), but a number of modifications were made. This included fine tuning some derived estimates, adding a few relevant studies, deleting some studies that further analysis found to be inapplicable, correcting some calculation errors, and updating it to 2011 Canadian dollars. Changes were also made in the way that foreign currencies were historically converted to current day Canadian dollars. In the new method, historic exchange rates from the years of the study were found and then those dollar values were converted to 2011 dollars using CPI. (Note that these updates and corrections are being used to create a revised version of 2009 Southern Region report).
Steps 2 and 3 are presented together because there is an iterative nature to the development of the literature database and the land cover typology. If valuation studies are found for a particular ecosystem type not already in the typology, and the GIS data needed to map that type were available, then that class was added to the typology.
3.1.3 Step 4: Mapping
In the mapping step we map out all land in the study area according to the land cover typology developed in the previous step. The final land cover typology is given below in Table 2, along with general definitions and the numeric code for each category. Detailed descriptions of the methods used to create the typology are given in Appendix 1. The land cover layer was based largely on the Provincial Land Cover 2000 data layer (Spectranalysis Inc. 2004), but was updated with other layers including hydrology and Census data, using numerous processing steps.
It should be noted that we chose to subdivide several land cover classes into subclasses based on the surrounding population density. As can be seen in Table 2, we broke up forests into a number of categories including non-urban, urban and suburban classes to account for the fact that forests near human communities yield far greater ecosystem services because of the larger number of beneficiaries. The urban-suburban distinction was made to account for differing levels of population density. Obviously, these simplifications with regard to population stop far short of the far more realistic ARIES modeling, which actually models the spatial relationship between service providing areas and beneficiaries. Non-urban forests were further broken down based on whether they were adjacent to streams. Wetlands are another ecosystem type whose value is also highly dependent on location relative to beneficiaries, so we also broke it down into subclasses. In this case only two classes were used to characterize population density context: urban/suburban and non-urban. This was done because the number and type of studies were insufficient to distinguish between urban and suburban. The coastal wetlands (relative to Lake Huron) category was added as a sub-category of non-urban wetlands. It was used because several studies show that these wetlands yield services — particularly cultural services — that are not quantified for other wetlands. Finally, open water was broken down into a number of subcategories including non-urban rivers, urban/suburban river, non-urban inland lakes, urban/suburban lakes, great lake open water, and great lakes coastal bays. The open water: unclassified class refers to water pixels whose exact type could not be determined from the GIS processing steps, due to slight spatial mismatch between the initial land cover layer and the water body type overlay that was used to characterize water.
The urban class was defined consistent with the 2009 Southern Region study as areas in or within 2 km of a Census dissemination area with a population density greater than 386 people/sq km (1000 people/sq. mile) located within a municipality of 50,000+ people. This is based on the US Census definition of an urban area, which includes areas with population density greater than 1000 people/sq. mile (386/sq km) located within jurisdictions of 50,000+ (StatsCan uses 400/sq km). Suburban areas were designated as areas in or within 5km of a Census dissemination area with a population density greater than 100 people/sq km located within a municipality of 50,000+ people or in a municipality that shares a border with a 50,000+ municipality. The 100 person/sq km criterion was based on an article by Pozzi and Small (2001).
A class included in this value transfer that was not in the Southern Region study was forest: light or partial cut. This was a class taken from the “sparse forest” class of the 2000 Provincial land cover layer provided by Ontario MNR. According to metadata, this is defined as “patchy or sparse forest canopy.” Lacking specific knowledge about actual conditions of forests represented by these pixels, and recognizing the likely large amount of variation in this class, we arbitrarily chose to give it half the value per hectare of the non-urban forest class.
For classes that were subdivided across both socio-economic and biophysical dimensions, like wetlands and forests, a question arose about how to classify combinations of the two. Unfortunately, we did not have enough studies to create categories that would fully cross tabulate these dimensions—for example urban Great Lake wetland vs. non-urban Great Lake wetland. Instead, for any unit of land to which two possible classes applied (e.g. an urban wetland near the Great Lakes), the class with the higher value was used.
The urban herbaceous greenspace class had initially been intended just for grassland/pasture/hayfield in designated urban areas. However, no pixels met these two definitions. This is obviously unrealistic, because both Sudbury and Sault St. Marie both have urban herbaceous park lands. It is likely that, with the relatively coarse grain size of the land cover product, these green spaces were simply classified as “urban.” Wanting to represent this type, we expanded the definition to include grassland/pasture/hayfield in suburban areas.
There were several land cover classes for which we did have valuation information, but not GIS data. This includes beach near structure and beach not near structure. We include these in Table 15 and Table 16 in the results section, in case at some point in the future these data sets become available for mapping. Finally, the urban herbaceous class was modified from its original intent of only being in urban areas to including suburban areas, since nearly no herbaceous pixels were found in designated urban areas.
3.1.4 Step 5: Value estimation
Once the land cover typology was finalized, we generated a matrix cross-tabulating the number of studies by both land cover and ecosystem service types, as shown in Table 15. Because there are often multiple valuation estimates per study, the number of valuation estimates is higher than the number of studies. Further, a single valuation might apply to multiple land cover classes (for instance, gas regulation values for non-urban forest can also apply to urban or suburban forest). We use a conservative “average of averages” approach. For each individual study, we report the highest and lowest valuation estimate for that service and cover type. We then average the high and low estimates, producing a single point estimate for that study. For ecosystem service-cover type combinations with multiple studies, we take an average of all these averaged values as the final value for that cover type.
Table 2. Land cover typology
| Class name | Class description | Code |
|---|---|---|
| Agriculture | Areas suitable for row crops outside of designated urban areas | 11 |
| Forest: non-urban | Areas of tree cover located outside of designated urban, suburban, riparian or hedgerow areas | 21 |
| Forest: urban | Areas of tree cover located in designated urban areas |
22 |
| Forest: suburban | Areas of forest cover located in designated suburban areas |
23 |
| Forest: adjacent to stream | Areas of forest cover located within 30 meters of the banks of 2nd order or greater streams, excluding urban /suburban areas | 24 |
| Forest: light to partial cut or burn | Forest: “sparse forest” category from the 2000 Provincial land cover layer. Defined by metadata as “patchy or sparse forest canopy” | 25 |
| Grassland/pasture/hayfield | Likely areas for pasture or hayfields, or identified native grasslands outside of urban areas, including recent clearcuts | 12 |
| Open water: unclassified, non-urban | Water pixels outside of urban areas that are not precisely identifiable as being river or lake | 40 |
| Open water: river | Areas designated as river polygons in waterbody layer received from MNR | 41 |
| Open water: urban/suburban river | Areas designated as river polygons in waterbody layer that are also in designated urban or suburban areas |
42 |
| Open water: inland lake | Areas designated as perennial inland lakes and reservoirs based on waterbodies layer | 43 |
| Open water: urban/suburban lake | Areas designated as perennial inland lakes and reservoirs based on waterbodies layer that are also within urban/suburban areas |
44 |
| Open water: great lake bay/estuarine | Significant embayments and inlets of Lake Huron, defined through digitizing | 45 |
| Open water: great lake | Lake Huron open water | 46 |
| Urban herbaceous greenspace | Grassland/pasture/hayfield in designated urban and suburban areas |
31 |
| Unvalued | All types of terrestrial surfaces for which no value is known or which are not classified | 99 |
| Wetlands: non-urban, non-coastal | Wetlands, bogs, marshes, swamps, and fens, excluding those in urban/suburban areas and those considered coastal to Lake Huron | 51 |
| Wetlands: urban/suburban | Wetlands, bogs, marshes, swamps, and fens in urban/suburban areas |
52 |
| Wetlands: coastal | Wetlands, bogs, marshes, and fens designated as coastal but not located in urban/suburban areas | 53 |
As can be seen, there are a number of gaps in Table 15. Some are because certain ecosystem services may not be provided by a given land cover type. But in other cases this is due to a lack of research. In particular, there is a paucity of valuation studies on regulating services like disturbance, soil and water regulation, as well as supporting services like pollination, relative to recreation and aesthetic/amenity value. This is because so much of the research comes from the economic literature, which largely uses economic methods to determine stated or revealed human preferences, and so is biased towards services that humans directly experience.
We then cross tabulated per hectare ecosystem service value flow estimates by land cover type and ecosystem service, as shown in Table 16. The values in the cells contain mean per hectare per year flow values in 2011 Canadian dollars. Where only one study exists for a cell, only that value is given. The final column gives the total estimated value, summed across all ecosystem services, for each land cover type.
It should be noted that there was no clear answer as to how to value the category designated Forest: light to partial cut or burn. Lacking information in the metadata, it was assumed that such areas had partial forest cover. As such, we conservatively took the per hectare values from non-urban forest and divided by two to get its value. Unclassified open water (i.e. pixels that were classified as water in the original land cover layer but whose exact water body type could not be determined through automated methods), were conservatively given the value of the lowest valued water type, great lake open water.
3.2 ARIES: ecosystem services modeling methods
A dynamic, spatially explicit ecosystem service valuation was conducted for Algonquin Provincial Park and the Lake of the Woods Region. Two ecosystem services were modeled for each site based on the methodology outlined in the ARIES Modeling Guide (Bagstad et al, 2011) and Villa et al (2011). In the Algonquin Provincial Park study area, carbon sequestration and recreation services were modeled. In the Lake of the Woods study area, surface water supply and sediment regulation services were modeled. The Carbon Sequestration Model estimates major sources and sinks of atmospheric carbon in standing vegetative biomass and soil. The result is a net carbon flux estimate which can be used to calculate the amount of anthropogenic emissions that are being offset by nature within a given region. The Recreation Model quantifies the scenic viewsheds enjoyed by backcountry canoe users, backcountry hikers and front country campers. The landscape features that add value to scenic viewsheds in this model include topographic variability, scenic vegetation and water bodies, among others. The Recreation Model also identifies view obstructions and other landscape elements that compromise the integrity of the viewshed, such as power lines and clearcuts. The viewshed analysis evaluates known visitation locations for these users groups based on the 2011 Ontario Parks Visitor Surveys and related backcountry permit data. The Surface Water Supply Model estimates runoff from rainfall and snowmelt and models its flow across the landscape, as well as the sinks that attenuate its flow, including infiltration, evaporation and transpiration. It also models use of this fresh water resource by downstream communities. The Sediment Regulation Model quantifies sources of sediment that may prove beneficial to maintaining farmland in riparian corridors. Sediment sources are identified as areas in the watershed that are likely to erode, thereby supplying sediment to downstream locations. User benefits are quantified based on gains to agriculture from increased sediment deposition.
The ARIES model development process includes the following 6-step workflow:
- Define study area;
- Identify ecosystem service carriers (e.g. matter, information, energy);
- Identify beneficiaries;
- Collect spatial data;
- Develop models for source, sink, use and flow components; and
- Analysis, interpretation of results and economic valuation.
Steps 4 and 5 are iterative as models refinement occurs throughout the development process, calling for additional data or alternative modeling approaches (for one or more sub-models). Each of these process steps are covered in greater detail in the service – specific sections that follow, as well as in the discussion of the results presented in Section 4 and Section 5.
3.2.1 Step 1: Study area definition
The Algonquin Provincial Park and Lake of the Woods Provincial Park study areas were collaboratively determined by MNR and SIG. Mapped boundaries of the two case study locations were provided by MNR (see Figure 3 and Figure 4).
3.2.2 Step 2. Identify ecosystem service carriers
An ecosystem service carrier is the means by which benefits “flow” from source locations to use locations. The mode of benefit flows may be very different for individual ecosystem services, including physical (e.g. water, CO2), energetic or informational (e.g. culturally mediated services, aesthetic views, proximity to valuable destinations) transport mechanisms. The two Lake of the Woods services, water provision and sediment regulation, are transported along hydrologic pathways. For the Algonquin case study area, recreational views and carbon sequestration are modeled using line of sight (e.g. calculating the viewshed) and atmospheric mixing, respectively.
3.2.3 Step 3. Identify ecosystem service beneficiaries
Ecosystem services are the benefits provided by nature to human beneficiaries. An ARIES model defines one (or more) distinct beneficiary group (e.g. homeowners, hikers, farmers) for each service model depending on the needs of the client. This distinction between classes of beneficiaries affords decision makers the ability to focus on individual constituencies and stakeholder groups. Additionally, the ARIES approach highlights the differential effects a policy decision may have on alternative stakeholder groups that rely on the same resources to sustain household and economic livelihoods. In the Lake of the Woods study area, the benefits of freshwater provision for residential users and the avoidance of sedimentation for farmers were estimated. In the Algonquin Provincial Park study area aesthetic benefits accrued to recreational users (i.e. paddlers, backcountry hikers, front country campers) and the potential for carbon sequestration in relation to the carbon emissions from the regional population were the focus of the investigation.
3.2.4 Step 4: Data collection and processing
A majority of the data used to support the ARIES modeling effort were provided by the Ministry of Natural Resources. Additional data were accessed from on-line data outlets and the ARIES data repository. The ARIES data repository includes a wide-range of regional- to global-extent data sets, many of which are at coarser resolutions than locally available data. Data from the repository are primarily used for models run over large spatial extents, providing the benefit of a uniform data set (in both attributes and data quality) for the entire study area, or to fill gaps or minimize limitations in local data. All non-MNR data is publicly available for download from the Internet (see the data geoprocessing notes in Appendix 5 for more detail).
Each of the ARIES models features its own data requirements, although certain data such as a digital elevation model (DEM) or land use and land cover (LULC) are included in multiple models. The following six general classes of data were used in the models:
- Administrative Boundaries (e.g. Provincial Park boundaries, Census boundaries)
- Ecological Characteristics (e.g. habitat, spawning, wintering areas)
- Anthropogenic Characteristics (e.g. land use, infrastructure, trails)
- Elevation and Slope
- Land Use and Land Cover
- Demographic (e.g. population and housing counts)
A detailed accounting of the data requirements for each model is provided in Appendix 5.2, including data sources and data processing steps. Finally, a description of how the individual data sets are used within the different ecosystem service models is included in the model-specific sections that follow.
3.2.5 Step 5. Model development
Once the information from Steps 1-4 has been obtained, a collection of sub-models are constructed for each service. The source model represents the quantity of service supply. The sink model identifies landscape locations that deplete (or eliminate) the supply of a given service. The use model defines the total demand for a service. Finally, the flow model connects the source, sink and use locations across the modeled space. For example, in the water supply model (described in Section 3.5), the source value is defined as the sum of rainfall and snowmelt and the use value is represented as a factor of the population density at a given location. The quantity of water represented by the sum of the two source inputs is “flowed” across the landscape according to hydrodynamic principles (e.g. water flows downhill). Along the way, this water supply is reduced by sinks, including natural phenomena such as evapotranspiration or human factors such as dams and levees. Water used by other beneficiaries is also eliminated from the supply as it is no longer accessible to downstream beneficiaries. A user who is able to access a sufficient quantity of water to meet their demands can be differentiated from a user who cannot. Both users with satisfied and unsatisfied demand (for water) can be spatially located (i.e. mapped). Further, the flow paths that link source and use locations determine where the supply of water for a given user originates as well as the path it travels between source and use locations. By mapping the flow paths that supply actual services to beneficiaries (as opposed to flow paths that do not link source and use locations) locations on the landscape that are critical to the continued provision of a service to meet the needs of the human beneficiaries can be located. For example, building a new road or filling in a wetland which intersects a flow path may have deleterious effects on downstream beneficiaries, because the altered landscape will affect the ability of water to flow through that location (or may eliminate the possibility altogether). With this level of information, including spatially explicit maps that detail each of the components individually and in an aggregated fashion, a decision maker can better understand the potential implications of policy and infrastructure development decisions. Finally, this approach can facilitate the modeling of alternative scenarios and provide a consistent framework for comparing results of the competing alternatives.
The source, sink, and use models can range in complexity from individual spatial data layers to Bayesian networks (see Appendix 4 for more detail on the use of Bayesian models in ARIES). In the cases presented below, the use models are all derived from spatial data, while most of the source and sink models are represented as Bayesian networks. When a sub-model is developed as a Bayesian network, two additional pieces of descriptive information are included:
- a graphic representation of the Bayesian network (Figure 5) and
- a table of data inputs and modeled outputs that includes a general description of the data, the classification scheme used to describe the data and the numeric breaks that are used to partition the data (Table 3).
Finally, the model inputs and outputs are formatted in the text using bold italics (e.g. Theoretical Natural Beauty), the data classes are listed in italics (e.g. High Natural Beauty), and data sources provided by the Ontario Ministry of Natural Resources (MNR) as underlined bold text with the name of the data as supplied by MNR (e.g. wflow_grid).
Figure 5 represents a sample Bayesian network model of Theoretical Natural Beauty (the source value in the Recreational Views model). Two data inputs Open Space Class and Topography are used in the model. The Open Space Class parameter is categorical data
Figure 5: Sample Bayesian network model.

Boxes on the left (Open Space Class & Topography) represent model inputs, while the box on the right (Theoretical Natural Beauty) represents the model outputs. The bar chart included within the individual model parameter boxes represents the proportion of the landscape with that categorical value (also known as the prior probability).
The Topography parameter is continuous dataalg_dem_fin). Data were divided into three classes (i.e. discretization) based on elevation - Large Hill, Small Hill, and No Hill and specify the prior probabilities for each class. Table 3 lists the two model inputs, the classification for each of the parameters, and the numeric values that define the categorical values (e.g. from the land cover data) or class ranges (e.g. from the digital elevation model) as the Numeric Discretization. For the Open Space Class Agricultural Land category all land cover pixels with the value 25 or 27 (based on the data documentation from the land cover data set) were selected. For the Topography – Large Hill class all pixels with an elevation greater than 540 m were selected. The two input parameters are combined to produce the modeled output. The prior probabilities are used to compute a Conditional Probability Table (CPT; see Appendix 4.2 for more details and an example) when two or more model inputs are combined. The CPT represents the probability of occurrence of one model parameter given the occurrence of another model parameter. For example, given that the topography of a location is Large Hill, the probability that the Open Space Class is Agricultural Land is lower than the probability that it is Forested Land. Once this has been completed for all combinations of model parameters, the CPT is then used to compute the likelihood of the model output values (percentages) for Theoretical Natural Beauty. The graphic indicates that 58% of the landscape offers High Natural Beauty, while 7% does not contribute to the scenic quality of the park. A complete description of the source, sink, use, and flow model components including Bayesian network schematics, data sources and data discretization (following the example presented here) for the four ARIES ecosystem service models are included in the sections 3.3-3.6.
Table 3: A list of data included in the sample Bayesian network model from Figure 5.
Notes describing the data development processing steps for each of the model inputs can be found in Appendix 5.
| Data | Classification | Data discretization | Data description |
|---|---|---|---|
| Open Space Class Data source: 2000-era Land Use Land Cover data |
Agricultural Land | 25, 27 | Land cover data representing classes of open space. |
| Open Space Class Data source: 2000-era Land Use Land Cover data |
Forested Land | 11, 12, 13 | Land cover data representing classes of open space. |
| Open Space Class Data source: 2000-era Land Use Land Cover data |
Other Open Land | 18, 19, 21, 23 | Land cover data representing classes of open space. |
| Open Space Class Data source: 2000-era Land Use Land Cover data |
Water | 1, 2 | Land cover data representing classes of open space. |
| Open Space Class Data source: 2000-era Land Use Land Cover data |
Not Open Land | All other land cover codes | Land cover data representing classes of open space. |
| Topography Data source: Digital Elevation Model Units: m |
Large Hill | > 540 | Terrain model representing the elevation of the landscape. |
| Topography Data source: Digital Elevation Model Units: m |
Small Hill | 500-540 | Terrain model representing the elevation of the landscape. |
| Topography Data source: Digital Elevation Model Units: m |
No Hill | < 500 | Terrain model representing the elevation of the landscape. |
3.2.6 Analysis, interpretation of results and economic valuation
For each ecosystem service, ARIES produces several result maps. Model results derived from a Bayesian network model include uncertainty estimates which account for data or knowledge limitations. The uncertainty maps identify where the model results are more (or less) trustworthy allowing managers to consider model reliability as part of the decision making process.
Extending ARIES results to include economic value estimates has not been previously attempted. To date, ARIES model results have been presented as metrics measured in the modeled unit (e.g. tons of sediment per hectare per year, millimeters of water per year). Therefore, economic value estimates presented here should be considered preliminary, and function more as a proof of concept than an actual management decision aid. It is expected that the simplistic first pass approach taken here is likely to feature shortcomings that can only be overcome through further study (including primary valuation studies), and a more complete consideration of the appropriate mechanism(s) for allocating economic values to source, sink, use, and flow locations. The models presented here have not been calibrated for the region. Further refinement of the models, including working with local experts to ensure appropriate model construction (e.g. variable selection) and weighting of variables to accurately reflect the contextual setting of the study area should be considered. Contextual factors include social norms, ecological function, actual or proposed management activities and best available data. Finally, in order to better facilitate the assessment of trade-offs among alternative management strategies, accounting for the range of stakeholder groups (e.g. backcountry canoe users, backcountry hikers and front country campers) that rely on a given ecosystem service should be also considered. Alternative stakeholder groups may access or value ecosystem service benefits differently, increasing the complexity of management decisions and long range planning efforts.
3.3 Algonquin Provincial Park – Carbon sequestration
Healthy forests can sequester significant amounts of the greenhouse gas CO2. With 90% of its land in forest cover, Algonquin Provincial Park has the potential to offset significant anthropogenic carbon emissions. However, not all forested land yields the same net rate of carbon sequestration. Forest harvesting and reforestation practices, natural and anthropogenic disturbances, soil types, and site characteristics all impact the rate of carbon sequestration.
Approaches to modeling the benefits of carbon sequestration have considered a wide range of drivers, including: land use-land cover change (Tallis et al. 2011); timber harvest or deforestation probabilities (Tallis et al. 2011, Wundscher et al. 2008); carbon pools and decay rates (Eade and Moran 1996, Chan et al. 2006, Egoh et al. 2008, Tallis et al. 2011, Wendland et al. 2010); biotic life zones (Wundscher et al. 2008), tree height, diameter at breast height (DBH), and stem density by forest type (Naidoo and Ricketts 2006); population density, slope, elevation, mean annual precipitation, soil texture and depth, and climatic indices (Iverson et al. 1994, Gaston et al. 1998), the difference between mean summer high and mean winter low temperatures (Auch 2010), and agricultural practices (Lal 2004, Tilman et al. 2006).
In the ARIES beneficiary-oriented framework, users of carbon sequestration are human emitters of CO2. Vegetated landscapes and their soils act as sources, since they help to offset the effects of human emissions by absorbing CO2 from the atmosphere. Carbon already stored in vegetation and soils is not added to the source value because it does not represent a resource that can offset new anthropogenic emissions. Areas of stored carbon release due to fire, land use change, deforestation, or other vegetation and soil disturbances reduce the absorption capacity of these landscapes and thus act as sinks. Carbon models frequently consider sequestration as a rate or flow (e.g. tons C per hectare per year), while storage is commonly computed as a stock (e.g. tons C/ha).
Table 4 below, computes both vegetation and soil carbon sequestration (sources) and stored carbon release (sinks) as flows. Areas of carbon sequestered by vegetation and soils are carbon service sources, absorbing CO2 from the atmosphere, thereby helping to balance the effects of human emissions. CO2 emissions are split between the sink and use components of the carbon model depending on whether they originate from natural (sink) or human (use) sources. The areas of carbon release due to fire, land use change, deforestation, or other vegetation and soil disturbances, are carbon service sinks because they reduce the absorption capacity of these landscapes. This framework is analogous to proposed forest-based carbon credit programs, where credits could be issued for sequestration plus avoided deforestation (e.g. REDD, Gibbs et al. 2007).
Communities vulnerable to climate change are well-described in the ecosystem service and climate change literatures (MEA 2005, Schröter et al. 2005, Stern 2006, Parry et al. 2007). These groups include coastal populations at risk of sea level rise and intense storms, populations dependent on glaciers and snowpack for water supplies, and populations using infrastructure built on permafrost, among others. Unlike the other ecosystem service models in ARIES, the carbon sequestration model does not require the geographic delineation of specific beneficiaries to establish value. Rather, benefits are assumed to be global in scale. However, anthropogenic emissions (for a buffered region surrounding the study area or from a nearby urban area) can be subtracted from the source value (vegetation and soil carbon sequestration) to calculate a regional carbon balance. Finally, economic value can be assigned to the biophysical model outputs by multiplying the modeled amount of net carbon sequestration by a market price or social cost of carbon per ton (see Nordhaus 2010, Stern 2006, Tol 2008).
Table 4: Summary characteristics of the ARIES Carbon Sequestration Model.
| Characteristic | Description |
|---|---|
| Service carrier type | Provisioning/Beneficial |
| Medium/units | Tons C per hectare per year |
| Scale | Global |
| Movement | Atmospheric mixing |
| Decay | None |
| Rival | Rival |
| Source | Vegetation & soil C sequestration |
| Sink | Stored C release (fire, land use change, other disturbance) |
| Use | CO2 emitters |
3.3.1 Carbon: Source
The Carbon Source Model computes the spatial distribution of annual carbon storage and sequestration by vegetation and soil in Algonquin Provincial Park. This value represents total carbon sequestration net of vegetative respiration. Carbon sequestration is modeled as a function of five factors:
- Successional Stage,
- Vegetation Type,
- Percent Tree Canopy Cover,
- Summer High – Winter Low temperature variability, and
- Soil Carbon to Nitrogen ratio.
These five inputs define two intermediate nodes (Vegetation Carbon Storage and Soil Sequestration) which are combined to estimate total Vegetation and Soil Carbon Sequestration. The paragraphs that follow describe the model inputs, the model structure and the assumptions used to develop the CPTs (the conditional probability tables that define the relationship among the model parameters, described in Section 3.2.5 and further explained in Appendix 4). Table 5 details the model inputs, their data sources and the data classes and value ranges (when appropriate)
Soil Carbon to Nitrogen Ratio (Soil C:N Ratio) and Summer High - Winter Low are combined to model the Soil Carbon Sequestration Rate (measured in tons of carbon per hectare per year). The Soil C:N Ratio represents the ratio of carbon to nitrogen stored in the soil, and was derived from a coarse resolution global data set originally developed by the Food and Agriculture Organization of the United Nations. The Summer High – Winter Low temperature variability represents the average seasonal temperature difference (in C°) measured at climate stations throughout the province.
Hardwood – Softwood Ratio, Percent Tree Canopy Cover, and Successional Stage are combined to estimate Vegetation Carbon Sequestration. The Hardwood – Softwood Ratio estimate was based on the Forest Resources Inventory data. Successional Stage was derived from a combination of the Forest Resources Inventory data and the Old Growth data and characterizes the stage of forest development, from No Succession where no forest cover is present to Old Growth Forest where the forest has achieved it highest successional stage. Percent Tree Canopy Cover was derived from the Forest Resources Inventory data. Vegetation Carbon Sequestration provides an estimate of the carbon storage attributable to the vegetated landscape in tons of carbon per hectare year. Finally, the Vegetation and Soil Carbon Sequestration value (measured in tons of carbon per hectare per year) is derived by combining the Sequestration Rate and Vegetation Carbon Sequestration values described above.
All else being equal, the CPT assumptions dictate that the Sequestration Rate values are highest where there are high C:N ratios and low differences between mean summer high and winter low temperatures. The Vegetation Carbon Storage CPT values are assumed to be highest where Percent Tree Canopy Cover is high, Successional Stage is identified as Early to Mid-Succession, and the ratio of hardwood to softwood species is low. Finally, the highest Vegetation and Soil Carbon Sequestration CPT values occur where Vegetation Carbon Storage and Sequestration Rate values are high and low where the opposite conditions exist. The Carbon Source Model predicts that a majority of the Algonquin Provincial Park landscape offers Moderate Sequestration (36%), nearly 7% of the landscape offers Very High and Very Low Sequestration, and 17% of the landscape offers No Sequestration potential.
Table 5: Model inputs, data classification and data discretization for the Carbon Source Model.
Notes describing the data development processing steps for each of the model inputs can be found in Appendix 5.
| Data | Classification | Data discretization | Data description |
|---|---|---|---|
| Soil C:N ratio Data source: FAO/United Nations |
Very High C:N ratio | > 25 | The carbon to nitrogen ratio of the soil. |
| Soil C:N ratio Data source: FAO/United Nations |
High C:N ratio | 15-25 | The carbon to nitrogen ratio of the soil. |
| Soil C:N ratio Data source: FAO/United Nations |
Low C:N ratio | 8-15 | The carbon to nitrogen ratio of the soil. |
| Soil C:N ratio Data source: FAO/United Nations |
Very Low C:N ratio | < 8 | The carbon to nitrogen ratio of the soil. |
| Summer high – Winter low Source: derived from climate station data Units: C° |
Very Low SH:WL | 4.44 | The difference between the mean summer high and mean winter low temperatures. |
| Summer high – Winter low Source: derived from climate station data Units: C° |
Low SH:WL | 5 | The difference between the mean summer high and mean winter low temperatures. |
| Summer high – Winter low Source: derived from climate station data Units: C° |
Moderate SH:WL | 5.56 | The difference between the mean summer high and mean winter low temperatures. |
| Summer high – Winter low Source: derived from climate station data Units: C° |
High SH:WL | 6.11 | The difference between the mean summer high and mean winter low temperatures. |
| Summer high – Winter low Source: derived from climate station data Units: C° |
Very High SH:WL | 6.67-7.22 | The difference between the mean summer high and mean winter low temperatures. |
| Hardwood: Softwood ratio Data source: derived from FRI data |
Very High Hardness | 80-100 | The percent of hardwood in a pixel. |
| Hardwood: Softwood ratio Data source: derived from FRI data |
High Hardness | 60-80 | The percent of hardwood in a pixel. |
| Hardwood: Softwood ratio Data source: derived from FRI data |
Moderate Hardness | 40-60 | The percent of hardwood in a pixel. |
| Hardwood: Softwood ratio Data source: derived from FRI data |
Low Hardness | 20-40 | The percent of hardwood in a pixel. |
| Hardwood: Softwood ratio Data source: derived from FRI data |
Very Low Hardness | 0-20 | The percent of hardwood in a pixel. |
| Percent tree canopy cover Data source: derived from FRI data |
Very Low Canopy Cover | 0% - 5% | The percent tree canopy cover in a pixel. |
| Percent tree canopy cover Data source: derived from FRI data |
Low Canopy Cover | 5% - 30% | The percent tree canopy cover in a pixel. |
| Percent tree canopy cover Data source: derived from FRI data |
Moderate Canopy Cover | 30% - 60% | The percent tree canopy cover in a pixel. |
| Percent tree canopy cover Data source: derived from FRI data |
High Canopy Cover | 60% - 80% | The percent tree canopy cover in a pixel. |
| Percent tree canopy cover Data source: derived from FRI data |
Very High Canopy Cover | 80% - 100% | The percent tree canopy cover in a pixel. |
| Successional stage Data source: derived from FRI and Old Growth data |
Old Growth | 6 | The successional stage of the forest in a pixel. |
| Successional stage Data source: derived from FRI and Old Growth data |
Late Succession | 5 | The successional stage of the forest in a pixel. |
| Successional stage Data source: derived from FRI and Old Growth data |
Mid Succession | 4 | The successional stage of the forest in a pixel. |
| Successional stage Data source: derived from FRI and Old Growth data |
Pole Succession | 3 | The successional stage of the forest in a pixel. |
| Successional stage Data source: derived from FRI and Old Growth data |
Early Succession | 2 | The successional stage of the forest in a pixel. |
| Successional stage Data source: derived from FRI and Old Growth data |
No Succession | 1 | The successional stage of the forest in a pixel. |
| Vegetation and soil carbon sequestration Data source: modeled output Units: tons C per hectare per year |
No Sequestration | 0 - 0.01 | Modeled result of the vegetation and soil carbon sequestration source model. |
| Vegetation and soil carbon sequestration Data source: modeled output Units: tons C per hectare per year |
Very Low Sequestration | 0.01 - 6.5 | Modeled result of the vegetation and soil carbon sequestration source model. |
| Vegetation and soil carbon sequestration Data source: modeled output Units: tons C per hectare per year |
Low Sequestration | 6.5 - 13 | Modeled result of the vegetation and soil carbon sequestration source model. |
| Vegetation and soil carbon sequestration Data source: modeled output Units: tons C per hectare per year |
Moderate Sequestration | 13 - 19.5 | Modeled result of the vegetation and soil carbon sequestration source model. |
| Vegetation and soil carbon sequestration Data source: modeled output Units: tons C per hectare per year |
High Sequestration | 19.5 - 26 | Modeled result of the vegetation and soil carbon sequestration source model. |
| Vegetation and soil carbon sequestration Data source: modeled output Units: tons C per hectare per year |
Very High Sequestration | 26 - 33 | Modeled result of the vegetation and soil carbon sequestration source model. |
Figure 6: Carbon Sequestration Source Model: Bayesian network representing Vegetation and Soil Carbon Sequestration and the prior probabilities associated with each of the input data layers.

The bar chart included within the individual model parameter boxes represents the proportion of the landscape with that categorical value (also known as the prior probability).
3.3.2 Carbon: sink
The Carbon Sink Model uses a two-stage Bayesian network. The first stage (Figure 7) estimates Soil Carbon Storage and Vegetation Carbon Storage, while the second stage combines the outputs of the first stage with additional parameters to estimate Stored Carbon Release, the amount of carbon released from natural sources. The Stored Carbon Release value represents the amount of carbon release that can be attributed to natural (e.g. fire) or anthropogenic (e.g. forest clearing) disturbances. However, these types of disturbances occur relatively infrequently and are typically realized over small areas (relative to the entire park). Without further specification, the Carbon Sink Model projects emissions for the entire modeled landscape. Because of this, the Stored Carbon Release values are best incorporated into the model as a scenario (e.g. carbon release attributed to 100 hectares of forest thinning/clearing) instead of a direct comparison with the Vegetation and Soil Carbon Sequestration (source) values. The values for the Carbon Sink Model are measured in tons of carbon per hectare per year.
The first stage Bayesian model takes seven model inputs:
- Successional Stage,
- Vegetation Type,
- Percent Tree Canopy Cover,
- Summer High – Winter Low temperature variability,
- Soil Oxygen Conditions,
- Soil pH, and
- Slope Class.
Vegetation Density is estimated as a function of Vegetation Type, Percent Canopy Cover, and Successional Stage data. The Vegetation Type data were derived from the 2000-era Land Use and Land Cover classification dataset, while the Percent Canopy Cover and the Successional Stage values were derived from the Forest Resources Inventory data. Vegetation Density is assumed to be greatest where the Vegetation Type is Forested, the Percent Tree Canopy Cover is Very High, and the Successional Stage is advanced (Late Succession or Old Growth). Next, Soil Carbon Storage (measured in tons of carbon per hectare per year) is estimated using the Soil Oxygen Condition, Soil pH, Slope Class, and Vegetation Density parameters. Soil Oxygen Conditions identifies Anoxic and Oxic Soils. The former is defined as Swamp, Fen, or Bog land cover types from the 2000-era Land Use and Land Cover dataset. All other vegetated lands are classified as Oxic Soils. Soil pH is derived from a low resolution global dataset. The Slope Class values were derived from the digital elevation model of the region. All else being equal, Soil Carbon Storage values are assumed to be highest where the Soil pH is Low, the Vegetation Density is High, the Slope Class is Level, and the Soil Oxygen Conditions are Anoxic. Vegetation Carbon Storage values are assumed highest where there is a small difference between Summer High - Winter Low Temperature and High Vegetation Density.
Table 6: Model inputs, data classification and data discretization for the Carbon Sequestration Sink Model.
Notes describing data development processing steps for each of the model inputs can be found in Appendix 5.
| Data | Classification | Data discretization | Data description |
|---|---|---|---|
| Vegetation type Data source: 2000-era Land Use Land Cover Units: classification values of the LULC data |
Coniferous Forest | 13 | The type of land cover present in a pixel. |
| Vegetation type Data source: 2000-era Land Use Land Cover Units: classification values of the LULC data |
Deciduous Forest | 11 | The type of land cover present in a pixel |
| Vegetation type Data source: 2000-era Land Use Land Cover Units: classification values of the LULC data |
Mixed Forest | 12 | The type of land cover present in a pixel |
| Vegetation type Data source: 2000-era Land Use Land Cover Units: classification values of the LULC data |
Impaired Forest | 7, 8, 9, 10 | The type of land cover present in a pixel |
| Vegetation type Data source: 2000-era Land Use Land Cover Units: classification values of the LULC data |
Swamp – Fen – Bog | 18, 19, 20, 21, 22, 23 | The type of land cover present in a pixel |
| Vegetation type Data source: 2000-era Land Use Land Cover Units: classification values of the LULC data |
Cropland – Pasture | 25, 27 | The type of land cover present in a pixel |
| Percent tree canopy cover Data source: derived from FRI data |
Very Low Canopy Cover | 0% - 5% | The percent tree canopy cover in a pixel. |
| Percent tree canopy cover Data source: derived from FRI data |
Low Canopy Cover | 5% - 30% | The percent tree canopy cover in a pixel. |
| Percent tree canopy cover Data source: derived from FRI data |
Moderate Canopy Cover | 30% - 60% | The percent tree canopy cover in a pixel. |
| Percent tree canopy cover Data source: derived from FRI data |
High Canopy Cover | 60% - 80% | The percent tree canopy cover in a pixel. |
| Percent tree canopy cover Data source: derived from FRI data |
Very High Canopy Cover | 80% - 100% | The percent tree canopy cover in a pixel. |
| Successional stage Data source: derived from FRI and Old Growth data |
Old Growth | 6 | The successional stage of the forest in a pixel. |
| Successional stage Data source: derived from FRI and Old Growth data |
Late Succession | 5 | The successional stage of the forest in a pixel. |
| Successional stage Data source: derived from FRI and Old Growth data |
Mid Succession | 4 | The successional stage of the forest in a pixel. |
| Successional stage Data source: derived from FRI and Old Growth data |
Pole Succession | 3 | The successional stage of the forest in a pixel. |
| Successional stage Data source: derived from FRI and Old Growth data |
Early Succession | 2 | The successional stage of the forest in a pixel. |
| Successional stage Data source: derived from FRI and Old Growth data |
No Succession | 1 | The successional stage of the forest in a pixel. |
| Soil Oxygen condition Data source: 2000-era Land Use Land Cover |
Anoxic Soil | 18, 19, 21, 23 | The oxygen content of the soil. |
| Soil Oxygen condition Data source: 2000-era Land Use Land Cover |
Oxic Soil | 7, 8, 9, 10, 11, 12, 13, 25, 27 | The oxygen content of the soil. |
| Soil pH Data source: FAO soils map of the world |
Low Soil pH | 0-5 | The pH content of the soil. |
| Soil pH Data source: FAO soils map of the world |
Moderate Soil pH | 5-10 | The pH content of the soil. |
| Soil pH Data source: FAO soils map of the world |
High Soil pH | 10-14 | The pH content of the soil. |
| Slope Data source: derived from digital elevation model Units: ° |
Level Slope | 0-1.15 | The incline (or grade) between two points on the landscape |
| Slope Data source: derived from digital elevation model Units: ° |
Gently Undulating Slope | 1.15-4.57 | The incline (or grade) between two points on the landscape |
| Slope Data source: derived from digital elevation model Units: ° |
Rolling To Hilly Slope | 4.57-16.7 | The incline (or grade) between two points on the landscape |
| Slope Data source: derived from digital elevation model Units: ° |
Steeply Dissected To Mountainous | 16.7-90.0 | The incline (or grade) between two points on the landscape |
| Summer High Winter Low Data source: derived from climate station data Units: C° |
Very Low SH:WL | 4.44 | The difference between the mean summer high and mean winter low temperatures. |
| Summer High Winter Low Data source: derived from climate station data Units: C° |
Low SH:WL | 5 | The difference between the mean summer high and mean winter low temperatures. |
| Summer High Winter Low Data source: derived from climate station data Units: C° |
Moderate SH:WL | 5.56 | The difference between the mean summer high and mean winter low temperatures. |
| Summer High Winter Low Data source: derived from climate station data Units: C° |
High SH:WL | 6.11 | The difference between the mean summer high and mean winter low temperatures. |
| Summer High Winter Low Data source: derived from climate station data Units: C° |
Very High SH:WL | 6.67 - 7.22 | The difference between the mean summer high and mean winter low temperatures. |
| Soil Carbon Storage Data source: modeled output Units: tons C per hectare per year |
No Soil Carbon Storage | 0.0-0.01 | Modeled result of the soil carbon storage sink model. |
| Soil Carbon Storage Data source: modeled output Units: tons C per hectare per year |
Very Low Soil Carbon Storage | 0.01-32.0 | Modeled result of the soil carbon storage sink model. |
| Soil Carbon Storage Data source: modeled output Units: tons C per hectare per year |
Low Soil Carbon Storage | 32-64 | Modeled result of the soil carbon storage sink model. |
| Soil Carbon Storage Data source: modeled output Units: tons C per hectare per year |
Moderate Soil Carbon Storage | 64-96 | Modeled result of the soil carbon storage sink model. |
| Soil Carbon Storage Data source: modeled output Units: tons C per hectare per year |
High Soil Carbon Storage | 96-128 | Modeled result of the soil carbon storage sink model. |
| Soil Carbon Storage Data source: modeled output Units: tons C per hectare per year |
Very High Soil Carbon Storage | 128-160 | Modeled result of the soil carbon storage sink model. |
| Vegetation Carbon Storage Data source: modeled output Units: tons C per hectare per year |
No Vegetation Carbon Storage | 0.0-0.01 | Modeled result of the vegetation carbon storage sink model. |
| Vegetation Carbon Storage Data source: modeled output Units: tons C per hectare per year |
Very Low Vegetation Carbon Storage | 0.01-16.0 | Modeled result of the vegetation carbon storage sink model. |
| Vegetation Carbon Storage Data source: modeled output Units: tons C per hectare per year |
Low Vegetation Carbon Storage | 16-32 | Modeled result of the vegetation carbon storage sink model. |
| Vegetation Carbon Storage Data source: modeled output Units: tons C per hectare per year |
Moderate Soil Carbon Storage | 32-48 | Modeled result of the vegetation carbon storage sink model. |
| Vegetation Carbon Storage Data source: modeled output Units: tons C per hectare per year |
High Soil Carbon Storage | 48-64 | Modeled result of the vegetation carbon storage sink model. |
| Vegetation Carbon Storage Data source: modeled output Units: tons C per hectare per year |
Very High Soil Carbon Storage | 64-80 | Modeled result of the vegetation carbon storage sink model. |
| Deforestation Risk Data source: derived from FRI data |
High Deforestation Risk | 4 | The relative risk of deforestation through logging, etc. of a given location. |
| Deforestation Risk Data source: derived from FRI data |
Moderate Deforestation Risk | 3 | The relative risk of deforestation through logging, etc. of a given location. |
| Deforestation Risk Data source: derived from FRI data |
Low Deforestation Risk | 2 | The relative risk of deforestation through logging, etc. of a given location. |
| Deforestation Risk Data source: derived from FRI data |
No Deforestation Risk | 1 | The relative risk of deforestation through logging, etc. of a given location. |
| Fire Threat Class Data source: derived from Fire Risk data |
High Fire Threat Class | 3 | The relative risk of forest fire (natural or human caused) of a given location. |
| Fire Threat Class Data source: derived from Fire Risk data |
Moderate Fire Threat Class | 2 | The relative risk of forest fire (natural or human caused) of a given location. |
| Fire Threat Class Data source: derived from Fire Risk data |
Low Fire Threat Class | 1 | The relative risk of forest fire (natural or human caused) of a given location. |
| Vegetation and Soil Carbon Storage Data source: modeled output Units: tons C per hectare |
Very High Sequestration | 26 – 33 | Modeled result of the vegetation and soil carbon storage sink model. |
| Vegetation and Soil Carbon Storage Data source: modeled output Units: tons C per hectare |
High Sequestration | 19.5 - 26 | Modeled result of the vegetation and soil carbon storage sink model. |
| Vegetation and Soil Carbon Storage Data source: modeled output Units: tons C per hectare |
Moderate Sequestration | 13 - 19.5 | Modeled result of the vegetation and soil carbon storage sink model. |
| Vegetation and Soil Carbon Storage Data source: modeled output Units: tons C per hectare |
Low Sequestration | 6.5 – 13 | Modeled result of the vegetation and soil carbon storage sink model. |
| Vegetation and Soil Carbon Storage Data source: modeled output Units: tons C per hectare |
Very Low Sequestration | 0.01 - 6.5 | Modeled result of the vegetation and soil carbon storage sink model. |
| Vegetation and Soil Carbon Storage Data source: modeled output Units: tons C per hectare |
No Sequestration | 0 – 0.01 | Modeled result of the vegetation and soil carbon storage sink model. |
| Stored Carbon Release Data Source: modeled output Units: tons C per hectare per year |
Very High Stored Carbon Release | 192-240 | Modeled result of the vegetation and soil carbon storage sink model. |
| Stored Carbon Release Data Source: modeled output Units: tons C per hectare per year |
High Stored Carbon Release | 144-192 | Modeled result of the vegetation and soil carbon storage sink model. |
| Stored Carbon Release Data Source: modeled output Units: tons C per hectare per year |
Moderate Stored Carbon Release | 96-144 | Modeled result of the vegetation and soil carbon storage sink model. |
| Stored Carbon Release Data Source: modeled output Units: tons C per hectare per year |
Low Stored Carbon Release | 48-96 | Modeled result of the vegetation and soil carbon storage sink model. |
| Stored Carbon Release Data Source: modeled output Units: tons C per hectare per year |
Very Low Stored Carbon Release | 0.01-48.0 | Modeled result of the vegetation and soil carbon storage sink model. |
| Stored Carbon Release Data Source: modeled output Units: tons C per hectare per year |
No Stored Carbon Release | 0.0-0.01 | Modeled result of the vegetation and soil carbon storage sink model. |
Figure 7: Carbon Sequestration Sink Model: Bayesian network representing Soil Carbon Storage and Vegetation Carbon Storage – Stage 1.

The bar chart included within the individual model parameter boxes represents the proportion of the landscape with that categorical value (also known as the prior probability).
Figure 8: Carbon Sequestration Sink Model: Bayesian network representing Stored Carbon Release-Stage 2.

The bar chart included within the individual model parameter boxes represents the proportion of the landscape with that categorical value (also known as the prior probability).
The second stage Bayesian (Figure 8) network model takes three input data sets:
- Vegetation and Soil Carbon Storage Class,
- Deforestation Risk, and
- Fire Threat.
The Vegetation and Soil Carbon Storage Class variable is the sum of Soil Carbon Storage and Vegetation Carbon Storage from the first stage network. Deforestation Risk Class was derived from the Forest Resource Inventory data, and the Fire Threat Class was estimated from Fire Frequency data, which denotes the recurrence interval for wildfire at a given location. The output of the second stage model is the Stored Carbon Release value (measured in tons of carbon per hectare per year). The Stored Carbon Release CPT assumes the highest values where Vegetation and Soil Carbon Storage, Deforestation Risk and Fire Risk are greatest. Based on this, there is a high probability (~70%) that the Stored Carbon Release within Algonquin Provincial Park is either Very Low or No Release, while the High and Very High values are predicted to occur on approximately 3% of the landscape.
3.3.3 Carbon: use
The Carbon Use Model represents annual anthropogenic carbon dioxide emissions. Canadian per capita emissions of 22.05 tons of CO2 equivalent per year (a measure that describes the amount of CO2 that would be generated from a mixture of greenhouse gases, not just the emission of CO2 itself) ranks the country 15th out of the 17 OECD countries behind only the US and Australia.
3.3.4. Carbon: flow
Since carbon dioxide is emitted both by anthropogenic sources (Use Model) and natural sources (Sink Model), the benefit of greenhouse gas regulation flows from carbon sequestering ecosystems (Source Model) through the atmosphere to the human emitters. Because atmospheric mixing ultimately allows humans everywhere to benefit from carbon sequestration regardless of where it occurs, a map of flow trajectories would not show any specific paths in this case. Therefore, a flow model is not run as part of the ARIES Carbon Sequestration Model.
3.4 Algonquin Provincial Park – Recreational viewsheds
Recreational values are among the most recognized ecosystem services, and human preferences for recreation have been well studied by economists and social scientists. Sources of recreational value where an ecosystem provides the natural setting to support a particular recreational activity, sinks of recreational value where landscape features reduce or eliminate potential source values, and the user demand for a given recreational activity were mapped. Users may simultaneously value a bundle of recreational attributes (e.g. the quality of an area for canoeing or fishing plus the quality of scenic views), built infrastructure (e.g. trails, campgrounds), uncongested natural areas, and the management policies that facilitate a particular recreational experience (Lawson and Manning 2002, Arnberger and Haider 2007, Boyd and Banzhaf 2007, Bullock and Lawson 2008).
The Recreation Model maps an ecosystem’s capacity to support specific recreational activities, with the understanding that only the ecosystem attributes supporting recreation are a true recreation services (Boyd and Banzhaf 2007). Recreational service flows are based on human preferences for a particular activity, perceptions of places capable of providing a suitable setting for that activity, and transport pathways (e.g. roads, portages, trails, waterways) that link the points of origin and destination. This adds a great deal of complexity to understanding recreational flows, as preferences are shaped by past experiences and place attachment (Hunt et al. 2005, Hunt 2008), as well as distance, travel network and possible means of travel. By mapping the ecosystem’s contribution of different recreational attributes, tradeoffs among different types of recreational uses, between recreation uses and other ecosystem services, and relative preferences for specific recreational attributes can be evaluated.
The approach presented here details a methodology for mapping scenic viewsheds valued by backcountry canoe users, backcountry hikers and front country campers. A viewshed is the portion of the landscape that is visible from a given location. Some landscape features act as sources of high quality views, including large mountains, water bodies, protected areas, culturally significant landscape features and heterogeneous land cover that supports a diversity of fauna, while others, such as air pollution, clearcuts, and many types of anthropogenic development (e.g. commercial, industrial, transportation and energy corridor uses), detract from the overall quality of a view. Recreational users within the Park access views along terrestrial and aquatic trails or at scenic roadside viewpoints and campgrounds. Their enjoyment may depend on the relative elevation of the vista (Zube et al. 1975) as it relates to the surrounding topography.
Past recreational ecosystem service research has produced maps of potential value by overlaying factors including viewsheds or visibility (Eade and Moran 1996, Chen et al. 2009), proximity or access to roads, population centers, or recreation infrastructure (Eade and Moran 1996, Boyd and Wainger 2003, Chan et al. 2006, Beier et al. 2008), and land ownership and land cover characteristics (Boyd and Wainger 2003, Chan et al. 2006). Most of these examples developed a generalized model of recreation site quality as opposed to evaluating site suitability for specific recreational activities. The ARIES recreation model presented here evaluates specific types of recreation, backcountry canoeing, backcountry hiking and front country camping, in the context of the landscapes ability to offer appropriate recreational source opportunities. Table 7 summarizes the ARIES recreation model characteristics. The ecosystem service benefits are measured in abstract units on a scale from 0 – 100, by calculating lines of sight between source and use locations. Further, although the benefits are not considered rival (i.e. the use of a service by one beneficiary does not limit the amount of service available to other beneficiaries), they are congestible, meaning that crowding may reduce the overall enjoyment of the provided services.
Table 7: Summary characteristics of the ARIES Recreational Viewshed Model.
| Characteristic | Description |
|---|---|
| Service carrier type | Provisioning/Beneficial |
| Medium (units) | Recreational enjoyment (abstract units, 0-100) |
| Scale | Algonquin Provincial Park |
| Movement | Line of sight (ray casting) |
| Decay | Inverse square |
| Rival | Non-rival but congestible |
| Source | Recreational areas + Mountains, water bodies, etc. |
| Sink | Visual blight |
| Use | Canoeists/Kayakers, Hikers, Frontcountry Campers |
3.4.1 Recreational viewsheds: Source
Mountains, open water, forested and open space lands are commonly valued objects in viewsheds (USFS 1974, Zube et. al. 1975, USFS 1995, Chhetri and Arrowsmith 2003, Manning et. al. 2006, Goonan et al. 2007). The Recreational Viewsheds Source Model estimates the Theoretical Natural Beauty produced by the landscape. A Bayesian network with four inputs was developed to represent the Recreational Viewshed Source Model:
- Open Space Class,
- Rivers and Streams,
- Lakes, and
- Topography.
Open Space was classified into five categories based on the LULC data, including Agricultural Land, Forested Land, Other Open Land, Water and Not Open Land. Agricultural Lands include pasture land, crop land, and orchards. Other Open Land includes barren lands, brush and transitional lands, and wetlands. Forested Lands include broadleaf, coniferous, and mixed forests. The presence of rivers and streams was derived from the Virtual Flow Data, the lake observations were based on the OHN_Waterbody, and the Topography was derived from the DEM data (alg_dem_fin).
People value highly scenic landscapes (those with high natural beauty as defined in the source model) as well as landscapes with a diversity of landforms, water characteristics, and vegetation patterns (USFS 1995, Chhetri and Arrowsmith 2003). Although there is a lack of empirical data to quantify this relationship, data from Switzerland revealed that in a reforesting landscape people prefer heterogeneous patches ranging from slightly to mostly reforested (Hunziker and Kienast 1999). The highest Theoretical Natural Beauty values were assumed to occur where Large Hills, lakes, and Forested or Open Land is present, while the lowest values are assumed for Developed Lands without Large Hills and no water views. Finally, intermediate values are assigned where Other Open Space and Agriculture Open Space Classes exist.
Table 8 details the model inputs and describes the data classes and value ranges, while Figure 9 illustrates the Bayesian network source model and the prior probabilities assigned to each of the input data sets.
Table 8: Model inputs, data classification and data discretization for the Recreation Viewshed Source Model.
Notes describing the data development processing steps for each of the model inputs can be found in Appendix 5.
| Data | Classification | Data discretization | Data description |
|---|---|---|---|
| Open Space Class Data source: 2000-era Land Use Land Cover |
Agricultural Land | 25, 27 | A range of open space classes derived from the LULC data. |
| Open Space Class Data source: 2000-era Land Use Land Cover |
Forested Land | 11, 12, 13 | A range of open space classes derived from the LULC data. |
| Open Space Class Data source: 2000-era Land Use Land Cover |
Other Open Land | 18, 19, 21, 23 | A range of open space classes derived from the LULC data. |
| Open Space Class Data source: 2000-era Land Use Land Cover |
Water | 1, 2 | A range of open space classes derived from the LULC data. |
| Open Space Class Data source: 2000-era Land Use Land Cover |
Not Open Land | All other values | A range of open space classes derived from the LULC data. |
| River – Stream Data source: wflow_grid |
River or Stream Present | Denotes the presence of a river or stream in a pixel. | |
| River – Stream Data source: wflow_grid |
River or Stream Absent | Denotes the presence of a river or stream in a pixel. | |
| Lake Data source: OHN_Waterbody |
Lake Present | Denotes the presence of a lake in a pixel. | |
| Lake Data source: OHN_Waterbody |
Lake Absent | Denotes the presence of a lake in a pixel. | |
| Hill Data source: derived from DEM |
No Hill | < 500m | A reclassification of the DEM. |
| Hill Data source: derived from DEM |
Small Hill | 500m – 540m | A reclassification of the DEM. |
| Hill Data source: derived from DEM |
Large Hill | > 540m | A reclassification of the DEM. |
| Theoretical Natural Beauty Data source: modeled output Units: Abstract units on scale of 1 – 100. |
No Natural Beauty | 0 – 25 | Modeled result of the recreational viewshed source model. |
| Theoretical Natural Beauty Data source: modeled output Units: Abstract units on scale of 1 – 100. |
Low Natural Beauty | 25 – 50 | Modeled result of the recreational viewshed source model. |
| Theoretical Natural Beauty Data source: modeled output Units: Abstract units on scale of 1 – 100. |
Moderate Natural Beauty | 50 – 75 | Modeled result of the recreational viewshed source model. |
| Theoretical Natural Beauty Data source: modeled output Units: Abstract units on scale of 1 – 100. |
High Natural Beauty | 75 - 100 | Modeled result of the recreational viewshed source model. |
3.4.2 Recreational viewsheds: Sink
The Recreational Viewsheds Sink Model estimates the value of Visual Blight on the landscape. A Bayesian network model was developed to include three data inputs:
- Park Infrastructure,
- Clearcuts, and
- Transportation and Energy Infrastructure.
All three of the model inputs observations are considered as presence – absence data, where the presence of one or more of these data indicates a higher Visual Blight. The Park Infrastructure observations represent cottages, other buildings, waste disposal, fueling stations and communication towers (among others). Park Infrastructure data were derived from a combination of the Commercial and Residential Lease Points, Towers and Ontario Parks Infrastructure Point datasets. Visual obstructions or undesirable features (blight associated with development, energy infrastructure, or roads) were assumed to reduce view quality (Benson et al. 1998, Bourassa et al. 2004, Gret-Regamey et al. 2008). Views of lost forest cover, including clearcuts, could also reduce view quality (Palmer 2008, Wundscher et al. 2008). The highest Visual Blight values are assumed to occur where one or more of the sink model features are present, while the lowest values are assumed when none of the model inputs are present. Table 9 details the model inputs and describes the data classes and value ranges, while Figure 10 illustrates the Bayesian network source model and the prior probabilities assigned to each of the input data sets.
Figure 9: Recreation Viewshed Source Model: Bayesian network representing Theoretical Natural Beauty and the prior probabilities associated with each of the input data layers.

The bar chart included within the individual model parameter boxes represents the proportion of the landscape with that categorical value (also known as the prior probability).
Figure 10: Recreation Viewshed Sink Model: Bayesian network representing Visual Blight and the prior probabilities associated with each of the input data layers.

The bar chart included within the individual model parameter boxes represents the proportion of the landscape with that categorical value (also known as the prior probability).
Table 9: Model inputs, data classification and data discretization for the Recreation Viewshed Sink Model.
Notes describing the data development processing steps for each of the model inputs can be found in Appendix 5.
| Data | Classification | Data discretization | Data description |
|---|---|---|---|
| Park Infrastructure Data source: Ontario_Parks_Infrastructure_Point, AlgonquinParkLeaseResidential_point, Commercial_Lease_point |
Park Infrastructure Present | 1 | Denotes the presence park infrastructure in a pixel. |
| Park Infrastructure Data source: Ontario_Parks_Infrastructure_Point, AlgonquinParkLeaseResidential_point, Commercial_Lease_point |
Park Infrastructure Absent | 0 | Denotes the presence park infrastructure in a pixel. |
| Clearcuts Data source: derived from 2000-era Land Use Land Cover |
Clearcuts Present | 7, 8 | Denotes the presence of a clearcut in a pixel. |
| Clearcuts Data source: derived from 2000-era Land Use Land Cover |
Clearcuts Absent | All other values | Denotes the presence of a clearcut in a pixel. |
| Transportation – Energy Infrastructure Data source: Transport_line, Utility_line, Railway |
Transportation – Energy Infrastructure Present | 1 | Denotes the presence of transportation or energy infrastructure in a pixel. |
| Transportation – Energy Infrastructure Data source: Transport_line, Utility_line, Railway |
Transportation – Energy Infrastructure Absent | 0 | Denotes the presence of transportation or energy infrastructure in a pixel. |
| Visual Blight Data source: modeled output Units: Abstract units on scale of 1 – 100. |
High Visual Blight | 50 – 100 | Modeled result of the recreational viewshed sink model. |
| Visual Blight Data source: modeled output Units: Abstract units on scale of 1 – 100. |
Moderate Visual Blight | 25 – 50 | Modeled result of the recreational viewshed sink model. |
| Visual Blight Data source: modeled output Units: Abstract units on scale of 1 – 100. |
Low Visual Blight | 5 – 25 | Modeled result of the recreational viewshed sink model. |
| Visual Blight Data source: modeled output Units: Abstract units on scale of 1 – 100. |
No Visual Blight | 0 – 5 | Modeled result of the recreational viewshed sink model. |
3.4.3 Recreational viewsheds: Use
The Recreational Viewshed Use Models are based on the 2011 Ontario Parks Backcountry Visitor Survey (canoe use and hiking use) and the 2011 Ontario Parks Campground Visitor Survey (campground use) responses identifying where recreational activities occurred during the survey period. For the Algonquin Provincial Park context three classes of beneficiaries were defined, including:
- backcountry canoe users
- backcountry hikers, and
- front country campers (i.e. campgrounds).
Distinct use models, created for each class of beneficiary, were combined with the source, sink and flow models to separately quantify recreational service flows for each beneficiary type.
3.4.4 Recreational viewsheds: Flow
The flow of views from source to use locations is accounted for through a line-of sight (ray casting) model (Johnson et al. 2010). The Recreational Viewsheds Flow Model relies on a digital elevation model to identify and map locations that are visible from each of the use points. Views of objects on the landscape (both desirable and undesirable) are projected towards potential view locations (identified by the survey responses). When a viewshed from a given location includes visual blight, the overall view quality is depleted.
3.5 Lake of the Woods Region – Surface water supply
The quantity, quality, and timing of potable water are critical factors which support human well-being. Ecosystem provision of freshwater flows has long been recognized (Sedell et al. 2000), and payments for ecosystem services programs, particularly in the developing world, are rapidly emerging policy instruments to protect sources of water supply for urban water users (Echavarria 2002, Munoz-Pina et al. 2008, Goldman 2009). Although the Millennium Ecosystem Assessment (2005) lists water supply and water regulation as separate ecosystem service, the ARIES modeling approach suggests that the combined modeling of these phenomena is a better way to account for the many inter-dependencies of the various freshwater beneficiary groups (e.g. residential, commercial, industrial users). Water supply is a rival, provisioning service quantified in mm3/yr. The water supply model is run at the watershed scale by applying hydrologic flow algorithms to surface water supplies. Table 10 summarizes the characteristics of the ARIES water supply model.
Table 10: Summary characteristics of the ARIES Water supply model.
| Characteristic | Description |
|---|---|
| Service carrier type | Provisioning/Beneficial |
| Medium (units) | Surface water (mm3/yr) |
| Scale | Watershed |
| Movement | Hydrologic flow, surface & groundwater |
| Decay | None |
| Rival | Rival |
| Source | Precipitation and snowmelt |
| Sink | Infiltration and evapotranspiration |
| Use | Surface water withdrawals |
The water quantity model combines the disparate sources of water and maps their dispersal over the landscape. A variety of spatial data has been used to map water supply services. These have typically included overlays of supply and demand (Boyd and Wainger 2003, Wundscher et al. 2008), estimates of water stored in soils and aquifers using infiltration data (Egoh et al. 2008), precipitation and evapotranspiration data (Chan et al. 2006), the SCS curve number (SCS 1972, Gately 2008) or the Budyko Curve method to account for precipitation and evapotranspiration across the landscape (Tallis et al. 2011). In the absence of hydrologic models, a set of generalized models is used to represent sources of surface water, such as precipitation and snowmelt, surface water sinks such as evapotranspiration and infiltration, surface water users, and the flow of surface water across the landscape.
3.5.1 Surface water supply: Source
The Surface Water Supply Source Model for the Lake of the Woods region consists of two components:
- Annual Precipitation and
- Annual Snowmelt.
Both of the data sets were derived from the long-term meteorological data collection effort led by Environment Canada. Data were downloaded for each of the 4430 stations in the Province from the National Climate Data and Information Archive. Data pre-processing involved cleaning the files to ensure consistency in data format. Tables from the individual climate stations were queried to eliminate stations with insufficient temporal coverage, while the remaining tables were used to interpolate raster surfaces representing the two primary inputs. Annual Precipitation and Annual Snowmelt are summed to represent the Total Annual Runoff.
3.5.2 Surface water supply: Sink
The Surface Water Supply Sink Model sums the output values of two Bayesian network, Soil Infiltration Class and Evapotranspiration Class. The Soil Infiltration Class model is derived from three inputs:
- Soil Drainage Class,
- Slope Class, and
- Percent Impervious Cover Class.
The Soil Drainage Class, derived from the Soils data provided by MNR, is grouped into three categories ranging from Poorly Drained Soils to Well Drained Soils. The Slope Class is represented in four categories, Level Slope, Gently Undulating Slope, Rolling to Hilly Slope, and Steeply Dissected to Mountainous Slopes. Percent Impervious Cover Class, derived from a global scale, coarse resolution data set, is represented as a six class categorization ranging between Very Low and Very High Impervious Cover. The five categories of the Soil Infiltration Class range between Very Low and Very High Soil Infiltration. High Soil Infiltration Class values are assumed where the Soil Drainage is Well Drained, the Slope Class is Level to Gently Undulating, and the Percent Impervious Cover is Low. Low Soil Infiltration Class values exist under the opposite conditions.
Two inputs are used to estimate the Evapotranspiration Class:
- Percent Tree Canopy Cover Class and
- Vegetation Type.
The Percent Tree Canopy Cover Class was derived from the Forest Resources Inventory data and grouped into six classes ranging between Very Low and Very High Percent Canopy Cover. The Vegetation Type is based on the MNR LULC data. Existing land cover data was reclassified to represent the following groups: Not Vegetated, Agriculture, Urban – Infrastructure – Rock, Bog – Fen – Marsh – Swamp, Forest, and Impaired Forest. The combination of these two inputs yields the Evapotranspiration Class which is divided into five classes ranging between Very Low and Very High Evapotranspiration. High Evapotranspiration Class values are assumed where the Percent Tree Canopy Cover Class is High and the Water Supply Vegetation Cover is designated as Forested. Table 11 details the model inputs and describes the data classes and value ranges, while Figure 11 and Figure 12 illustrate the Bayesian network sink models and the prior probabilities assigned to each data set.
3.5.3 Surface water supply: Use
The Surface Water Supply Use Model considers residential water users for a single sub-watershed. Residential population data from the 2006 Canadian Census was used to estimate population density over the model extent. Lakes, streams and steeply sloped areas were eliminated from each Census Subdivision for the purposes of calculating population density. The population count was divided by the remaining land area to calculate the population density data layer. Lakes, rivers and steep slopes are all assigned a population density of 0, while all non-excluded land is assigned the population density value. Finally, the population density of a pixel is multiplied by an average annual water consumption value of 1,600 m3 of water per person per year
Figure 11: Water Supply Sink Model: Bayesian network representing the Soil Infiltration Class and the prior probabilities associated with each of the input data layers.

The bar chart included within the individual model parameter boxes represents the proportion of the landscape with that categorical value (also known as the prior probability).
Figure 12: Water Supply Sink Model: Bayesian network representing the Evapotranspiration Class and the prior probabilities associated with each of the input data layers.

The bar chart included within the individual model parameter boxes represents the proportion of the landscape with that categorical value (also known as the prior probability).
Table 11: Model inputs, data classification and data discretization for the Water Supply Sink Model.
Notes describing the data development processing steps for each of the model inputs can be found in Appendix 5.
| Data | Classification | Data discretization | Data description |
|---|---|---|---|
| Soil drainage class Data source: Soils data |
Poorly drained soils | 2 | The ability of the soil to drain water. |
| Soil drainage class Data source: Soils data |
No data | 0 | The ability of the soil to drain water. |
| Soil drainage class Data source: Soils data |
Well drained soils | 1 | The ability of the soil to drain water. |
| Slope Data source: derived from digital elevation model Units: ° |
Level slope | 0 - 1.15 | The incline (or grade) between two points on the landscape. |
| Slope Data source: derived from digital elevation model Units: ° |
Gently undulating slope | 1.15 - 4.57 | The incline (or grade) between two points on the landscape. |
| Slope Data source: derived from digital elevation model Units: ° |
Rolling to hilly slope | 4.57 - 16.70 | The incline (or grade) between two points on the landscape. |
| Slope Data source: derived from digital elevation model Units: ° |
Steeply Dissected to Mountainous | 16.70 - 90.00 | The incline (or grade) between two points on the landscape. |
| Percent impervious surface cover class Data source: NOAA-NGDC |
Very Low Impervious cover | 0% - 5% | The percent of a pixel covered by an impervious surface. |
| Percent impervious surface cover class Data source: NOAA-NGDC |
Low Impervious Cover | 5% - 10% | The percent of a pixel covered by an impervious surface. |
| Percent impervious surface cover class Data source: NOAA-NGDC |
Moderately Low Impervious Cover | 10% - 20% | The percent of a pixel covered by an impervious surface. |
| Percent impervious surface cover class Data source: NOAA-NGDC |
Moderate High Impervious Cover | 20% - 50% | The percent of a pixel covered by an impervious surface. |
| Percent impervious surface cover class Data source: NOAA-NGDC |
High Impervious Cover | 50% - 80% | The percent of a pixel covered by an impervious surface. |
| Percent impervious surface cover class data source: NOAA-NGDC | Very High Impervious Cover | 80% - 100% | The percent of a pixel covered by an impervious surface. |
| Soil Infiltration Class Data source: modeled output Units: mm |
Very Low Soil Infiltration | 0 mm | Modeled result of the Water Supply Sink Model. |
| Soil Infiltration Class Data source: modeled output Units: mm |
Low Soil Infiltration | 0 – 50 mm | Modeled result of the Water Supply Sink Model. |
| Soil Infiltration Class Data source: modeled output Units: mm |
Moderate Soil Infiltration | 50 – 100 mm | Modeled result of the Water Supply Sink Model. |
| Soil Infiltration Class Data source: modeled output Units: mm |
High Soil Infiltration | 100 – 180 mm | Modeled result of the Water Supply Sink Model. |
| Soil Infiltration Class Data source: modeled output Units: mm |
Very High Soil Infiltration | 180 – 260 mm | Modeled result of the Water Supply Sink Model. |
| Percent Tree Canopy Cover Class Data source: derived from FRI data |
Very Low Canopy Cover | 0% - 5% | The percent of a pixel covered by tree canopy cover. |
| Percent Tree Canopy Cover Class Data source: derived from FRI data |
Low Canopy Cover | 5% - 30% | The percent of a pixel covered by tree canopy cover. |
| Percent Tree Canopy Cover Class Data source: derived from FRI data |
Moderate Canopy Cover | 30% - 60% | The percent of a pixel covered by tree canopy cover. |
| Percent Tree Canopy Cover Class Data source: derived from FRI data |
High Canopy Cover | 60% - 80% | The percent of a pixel covered by tree canopy cover. |
| Percent Tree Canopy Cover Class Data source: derived from FRI data |
Very High Canopy Cover | 80% - 100% | The percent of a pixel covered by tree canopy cover. |
| Water Supply Vegetation Type Data source: 2000-era Land Use Land Cover Units: classification values of the LULC data |
Not Vegetated | 1, 2 | The type of land cover present in a pixel. |
| Water Supply Vegetation Type Data source: 2000-era Land Use Land Cover Units: classification values of the LULC data |
Agriculture | 25, 27 | The type of land cover present in a pixel. |
| Water Supply Vegetation Type Data source: 2000-era Land Use Land Cover Units: classification values of the LULC data |
Urban/Infrastructure/Rock | 3, 5 | The type of land cover present in a pixel. |
| Water Supply Vegetation Type Data source: 2000-era Land Use Land Cover Units: classification values of the LULC data |
Bog – Fen – Marsh – Swamp | 15,16,17,18,19,20,21,22,23 | The type of land cover present in a pixel. |
| Water Supply Vegetation Type Data source: 2000-era Land Use Land Cover Units: classification values of the LULC data |
Forest | 9, 10, 11, 12, 13 | The type of land cover present in a pixel. |
| Water Supply Vegetation Type Data source: 2000-era Land Use Land Cover Units: classification values of the LULC data |
Impaired Forest | 7, 8 | The type of land cover present in a pixel. |
| Evapotranspiration Class Data source: modeled output Units: mm |
Very Low Evapotranspiration | 0 mm | Modeled output of the Surface Water Sink Model |
| Evapotranspiration Class Data source: modeled output Units: mm |
Low Evapotranspiration | 0 – 50 mm | Modeled output of the Surface Water Sink Model |
| Evapotranspiration Class Data source: modeled output Units: mm |
Moderate Evapotranspiration | 50 – 100 mm | Modeled output of the Surface Water Sink Model |
| Evapotranspiration Class Data source: modeled output Units: mm |
High Evapotranspiration | 100 – 180 mm | Modeled output of the Surface Water Sink Model |
| Evapotranspiration Class Data source: modeled output Units: mm |
Very High Evapotranspiration | 180 – 260 mm | Modeled output of the Surface Water Sink Model |
3.5.4 Surface water supply: Flow
Surface water supply flow paths are defined by the movement of runoff across the landscape and along river networks in the region. MNR provided both digital elevation model and hydrography datasets to facilitate this calculation. The ARIES Surface Water Supply Flow Model identifies the specific water courses (i.e. flow path) that deliver surface water to the human beneficiaries defined in the Use model.
3.6 Lake of the Woods Region – Sediment regulation
Erosion and sedimentation impose constraints on the functioning of ecosystems and ecosystem service delivery (Yang et al. 2003) with the potential for serious negative repercussions on multiple economic sectors, including residential and commercial water supply, agricultural production, and electric power generation. Sedimentation can be especially problematic for agricultural lands, fish spawning grounds, drinking water intakes and recreational opportunities where high rates of deforestation (Harper et al. 2007) and low rates of succession have led to high levels of erosion (Wendland et al. 2010). Sediment loss from intensive agricultural practices can impact hydroelectric production and reduce human well-being (Alwang and Siegel 2004, IDIAF 2006). Conversely, natural sediment delivery can also be beneficial. For example, reduced sediment delivery to deltas can lead to loss of coastal wetlands and the critical services they provide (Costanza et al. 2006, Day et al. 2007). Sediment regulation can thus be classified as either a provisioning or preventive service whose benefits are rival (i.e. the services used by one beneficiary are not available to other, downstream beneficiaries) and are measured (in tons of sediment) at the watershed scale.
Sources of waterborne sediment, sink regions where sediment deposition occurs, and users who are impacted by the delivery of sediment (Table 12) were modeled for the Lake of the Woods region. Running the sediment flow model allows the user to map spatial connections between sources of sediment, areas that promote sediment deposition, and the users that benefit from (or are harmed by) sediment delivery.
Table 12: Summary characteristics of the ARIES Sediment Regulation Model.
| Characteristic | Description |
|---|---|
| Service carrier type | Provisioning/Beneficial or Preventive/Detrimental |
| Medium (units) | Sediment (tons of sediment per hectare per year) |
| Scale | Watershed |
| Movement | Hydrologic flow |
| Decay | None |
| Rival | Rival |
| Source | Landscapes along waterways |
| Sink | Riparian zones where deposition occurs |
| Use | Areas where sedimentation is desirable, areas where sedimentation is undesirable, areas where excessively turbid water is undesirable |
3.6.1 Sediment: Source
The Sediment Regulation Source Model for the Lake of the Woods region estimates Annual Sediment Loss as a result of Soil Erodibility, Annual Runoff, and Vegetative Maturity. A Bayesian model that includes five data inputs was developed:
- Slope Class,
- Soil Drainage Class,
- Percent Tree Canopy Cover Class,
- Succession Stage, and
- Sediment Vegetation Type.
Soil Erodibility is a function of Slope Class and Soil Drainage Class. The Slope Class, derived from slope data (lws_slope_fin), is represented in four categories, Level Slope, Gently Undulating Slope, Rolling to Hilly Slope, and Steeply Dissected to Mountainous Slopes. The Soil Drainage Class, derived from the Soils data, is grouped into three categories ranging from Poorly Drained Soils to Well Drained Soils. Unfortunately there was only a single polygon with attribution defining its potential drainage within the Lake of the Woods Region (Poorly Drained Soils). Soil Erodibility values are assumed to be highest on Steep Slopes with coarse soils that include high infiltration and erosion potential and lowest on Level Slopes with fine soils and low infiltration.
Annual Runoff is the sum of the Annual Rainfall and Annual Snowmelt data described in the Water Supply Source model (Section 3.5.1).
Vegetative Maturity is a function of Percent Tree Canopy Cover Class, Successional Stage, and Vegetation Type. The Percent Tree Canopy Cover Class was derived from the Forest Resources Inventory data and grouped into six classes ranging between Very Low and Very High Percent Canopy Cover. Successional Stage was computed from a combination of the Forest Resources Inventory and Old_Growth data sets and ranges between No Succession and Old Growth. The Vegetation Type is based on the year 2000 LULC data. The land cover data was reclassified as: Not Vegetated, Agriculture, Urban – Infrastructure – Rock, Bog – Fen – Marsh – Swamp, Forest, and Impaired Forest. Locations under water are not considered as primary sediment sources. The highest Vegetative Maturity values are assumed under conditions of Very High Tree Canopy Cover and Forest – Wetland Vegetation Type, while the lowest values are assumed to occur where Very Low Tree Canopy Cover, Early Succession, and Crops – Barren – Developed Land exist.
Finally, the Annual Sediment Source Class values are assumed lowest where the Soil Erodibility Class, Annual Runoff Class, and Vegetative Maturity values are low, and highest under the opposite conditions.
Table 13 details the model inputs and describes the data classes and value ranges, while Figure 13 illustrates the Bayesian network source model and the prior probabilities assigned to each of the input data sets.
Table 13: Model inputs, data classification and data discretization for the Sediment Regulation Source model.
Notes describing the data development processing steps for each of the model inputs can be found in Appendix 5.
| Data | Classification | Data discretization | Data definition |
|---|---|---|---|
| Slope Class Data source: derived from digital elevation model Units: ° |
Level | 0 – 1.15° | The incline (or grade) between two points on the landscape. |
| Slope Class Data source: derived from digital elevation model Units: ° |
Gently Undulating | 1.15 – 4.57° | The incline (or grade) between two points on the landscape. |
| Slope Class Data source: derived from digital elevation model Units: ° |
Rolling to Hilly | 4.57 – 16.7° | The incline (or grade) between two points on the landscape. |
| Slope Class Data source: derived from digital elevation model Units: ° |
Steeply Dissected to Mountainous | 16.7 – 90.0° | The incline (or grade) between two points on the landscape. |
| Soil Drainage Class Data source: Soils data |
Poorly Drained Soils | 2 | The ability of the soil to drain water. |
| Soil Drainage Class Data source: Soils data |
No Data | 0 | The ability of the soil to drain water. |
| Soil Drainage Class Data source: Soils data |
Well Drained Soils | 1 | The ability of the soil to drain water. |
| Annual Runoff Data source: derived value National Climate Data and Information Archive Units: mm |
Very Low | 0 – 600 mm | The combined total of annual rainfall and annual snowmelt. |
| Annual Runoff Data source: derived value National Climate Data and Information Archive Units: mm |
Low | 600 – 1200 mm | The combined total of annual rainfall and annual snowmelt. |
| Annual Runoff Data source: derived value National Climate Data and Information Archive Units: mm |
Moderate | 1200 – 1800 mm | The combined total of annual rainfall and annual snowmelt. |
| Annual Runoff Data source: derived value National Climate Data and Information Archive Units: mm |
High | 1800 – 2400 mm | The combined total of annual rainfall and annual snowmelt. |
| Annual Runoff Data source: derived value National Climate Data and Information Archive Units: mm |
Very High | 2400 + mm | The combined total of annual rainfall and annual snowmelt. |
| Percent Tree Canopy Cover Class Data source: derived from FRI data |
Very Low | < 5% | The percent tree canopy cover in a pixel. |
| Percent Tree Canopy Cover Class Data source: derived from FRI data |
Low | 5% - 30% | The percent tree canopy cover in a pixel. |
| Percent Tree Canopy Cover Class Data source: derived from FRI data |
Moderate | 30% - 60% | The percent tree canopy cover in a pixel. |
| Percent Tree Canopy Cover Class Data source: derived from FRI data |
High | 60% - 80% | The percent tree canopy cover in a pixel. |
| Percent Tree Canopy Cover Class Data source: derived from FRI data |
Very High | > 80% | The percent tree canopy cover in a pixel. |
| Successional Stage Data source: derived from FRI and Old Growth data |
Old Growth | 6 | The successional stage of the forest in a pixel. |
| Successional Stage Data source: derived from FRI and Old Growth data |
Late Succession | 5 | The successional stage of the forest in a pixel. |
| Successional Stage Data source: derived from FRI and Old Growth data |
Mid Succession | 4 | The successional stage of the forest in a pixel. |
| Successional Stage Data source: derived from FRI and Old Growth data |
Pole Succession | 3 | The successional stage of the forest in a pixel. |
| Successional Stage Data source: derived from FRI and Old Growth data |
Early Succession | 2 | The successional stage of the forest in a pixel. |
| Successional Stage Data source: derived from FRI and Old Growth data |
No Succession | 1 | The successional stage of the forest in a pixel. |
| Sediment Vegetation Type Data source: 2000-era Land Use Land Cover Units: class values of the LULC data |
Forest – Wetland | 11, 12, 13, 15 - 23 | The type of land cover present in a pixel. |
| Sediment Vegetation Type Data source: 2000-era Land Use Land Cover Units: class values of the LULC data |
Shrubland – Grassland–Pasture | 24, 25 | The type of land cover present in a pixel. |
| Sediment Vegetation Type Data source: 2000-era Land Use Land Cover Units: class values of the LULC data |
Impaired Forest | 7-10 | The type of land cover present in a pixel. |
| Sediment Vegetation Type Data source: 2000-era Land Use Land Cover Units: class values of the LULC data |
Crops – Barren –Developed Land | 3 – 6, 27 | The type of land cover present in a pixel. |
| Annual Sediment Source Class Data source: modeled output Units: t/h |
No Sediment Source | < 0.01 t/h | Modeled result of the sediment regulation source model. |
| Annual Sediment Source Class Data source: modeled output Units: t/h |
Low Sediment Source | 0.01 – 30.0 t/h | Modeled result of the sediment regulation source model. |
| Annual Sediment Source Class Data source: modeled output Units: t/h |
Moderate Sediment Source | 30.0 – 100.0 t/h | Modeled result of the sediment regulation source model. |
| Annual Sediment Source Class Data source: modeled output Units: t/h |
High Sediment Source | 100.0 – 300.0 t/h | Modeled result of the sediment regulation source model. |
Figure 13: Soil regulation source model: Bayesian network representing the annual sediment source class.

The bar chart included within the individual model parameter boxes represents the proportion of the landscape with that categorical value (also known as the prior probability).
3.6.2 Sediment: Sink
The Sediment Regulation Sink Model for the Lake of the Woods region estimates Annual Sediment Capture in the Lake of the Woods region as a function of:
- Stream Gradient Class,
- Floodplain Tree Canopy Cover Class, and
- Floodplain Width Class.
The Stream Gradient Class was computed as the product of the Slope and Hydrology layers (lws_slope_fin and z15_wfg, respectively). The Stream Gradient Class was defined using three categories ranging from Low to High. The Floodplain Tree Canopy Cover Class overlays the floodplain extent on the percent tree canopy cover data to create a five category classification ranging from Very Low to Very High Canopy Cover. The presence of Floodplains was estimated by buffering the Stream Gradient data described above. Areas with Steep Slopes were assumed to have Very Narrow Floodplains, while Level areas were assigned Wide Floodplains. The Annual Sediment Sink Class has four categories ranging between No Annual Sediment Sink and High Annual Sediment Sink. High Annual Sediment Sink values occur on Low Stream Gradients with Wide Floodplains and High Canopy Cover, while the low values can be found under the opposite conditions. Table 14 details the model inputs and describes the data classes and value ranges, while Figure 14 illustrates the Bayesian network source model and the prior probabilities assigned to each of the input data sets.
Figure 14: Sediment Regulation Sink Model: Bayesian network representing the Annual Sediment Sink Class.

The bar chart included within the individual model parameter boxes represents the proportion of the landscape with that categorical value (also known as the prior probability).
Table 14: Model inputs, data classification and data discretization for the Sediment Regulation Sink model.
Notes describing the data development processing steps for each of the model inputs can be found in Appendix 5.
| Data | Classification | Data discretization | Data definition |
|---|---|---|---|
| Stream Gradient Class Data source: derived data Units: ° |
Low Stream Gradient | < 1.15° | The slope of a pixel that is located in a stream. |
| Stream Gradient Class Data source: derived data Units: ° |
Moderate Stream Gradient | 1.15° - 2.86° | The slope of a pixel that is located in a stream. |
| Stream Gradient Class Data source: derived data Units: ° |
High Stream Gradient | > 2.86° | The slope of a pixel that is located in a stream. |
| Floodplain Tree Canopy Cover Class Data Source: derived data |
Very Low Canopy Cover | 0% - 20% | The tree canopy cover present in a pixel that is located in a floodplain. |
| Floodplain Tree Canopy Cover Class Data Source: derived data |
Low Canopy Cover | 20% - 40% | The tree canopy cover present in a pixel that is located in a floodplain. |
| Floodplain Tree Canopy Cover Class Data Source: derived data |
Moderate Low Canopy Cover | 40% - 60% | The tree canopy cover present in a pixel that is located in a floodplain. |
| Floodplain Tree Canopy Cover Class Data Source: derived data |
High Canopy Cover | 60% - 80% | The tree canopy cover present in a pixel that is located in a floodplain. |
| Floodplain Tree Canopy Cover Class Data Source: derived data |
Very High Canopy Cover | 80% - 100% | The tree canopy cover present in a pixel that is located in a floodplain. |
| Floodplain Width Class Data Source: derived data Units: m |
Very Narrow Floodplain | 0 – 15 m | The width of the floodplain that contains a pixel. |
| Floodplain Width Class Data Source: derived data Units: m |
Narrow Floodplain | 15 – 30 m | The width of the floodplain that contains a pixel. |
| Floodplain Width Class Data Source: derived data Units: m |
Wide Floodplain | 30 – 45 m | The width of the floodplain that contains a pixel. |
| Floodplain Width Class Data Source: derived data Units: m |
Very Wide Floodplain | 45 – 60 m | The width of the floodplain that contains a pixel. |
| Annual Sediment Sink Class Source: modeled output Units: t/ha/yr |
No Annual Sediment Sink | 0.0 – 0.01 t/ha/yr | Modeled result of the Sediment Regulation Sink Model. |
| Annual Sediment Sink Class Source: modeled output Units: t/ha/yr |
Low Annual Sediment Sink | 0.01 – 30.0 t/ha/yr | Modeled result of the Sediment Regulation Sink Model. |
| Annual Sediment Sink Class Source: modeled output Units: t/ha/yr |
Moderate Annual Sediment Sink | 30.0 – 100.0 t/ha/yr | Modeled result of the Sediment Regulation Sink Model. |
| Annual Sediment Sink Class Source: modeled output Units: t/ha/yr |
High Annual Sediment Sink | 100.0 – 300.0 t/ha/yr | Modeled result of the Sediment Regulation Sink Model. |
3.6.3 Sediment: Use
While not explicitly describing an ecosystem service flow model framework, both Tallis et al. (2010) and Wendland et al. (2010) incorporate beneficiaries in their models of sediment retention. Tallis et al. (2010) map the locations of reservoirs where avoided sedimentation is a benefit, while Wendland et al. (2010) map human population density (for drinking water). The Sediment Regulation Use Model explores the benefits to farmers with land in the floodplain where sedimentation may be beneficial. These locations were identified by intersecting data for floodplains (described above) and farmland derived from land cover data (LULC).
3.6.4 Sediment: Flow
The Sediment Regulation Source and Sink Models estimate the annual quantity (in tons of sediment per hectare per year) of sediment eroded from the landscape and deposited elsewhere, respectively. The Sediment Regulation Use Model maps the location of the beneficiaries of avoided sedimentation, erosion, and regions of beneficial sediment deposition. Flow models are not necessary to calculate the benefit of avoided erosion. Instead the difference between the erosion source values with and without vegetation was estimated. For the other beneficiary classes, the flow models describe the amount of beneficial or detrimental sediment delivered. The Sediment Flow models are hydrologically based and incorporate the digital elevation model to derive flow direction for routing water and sediment across the landscape. Sediment travels through waterways represented by hydrography data. Flood events deposit sediment in floodplains, while dams block sediment flow as it is trapped in reservoirs.
4. Results, maps and tables
4.1 Value transfer results
Results for the products described in the Methods section above are given in the following tables and figures. Figure 15 provides the land cover map.
Table 15 is a matrix cross-tabulating the number of valuation estimates by land use type and ecosystem service. There were a total of 85 individual studies used. In this table, two numbers are given. The number outside the parentheses refers to how many individual studies yielded a valuation estimate for an ecosystem service for a particular land cover type. The number in the parentheses refers to the number of valuation estimates. Because many studies contain multiple valuation estimates (for instance if an author gave different valuation estimates for recreation at three different lakes), the number of valuation estimates is often higher than the number of studies. Further, some valuation estimates or studies apply to multiple land cover classes (e.g. some types of recreation at a Great Lake nearshore zone would also be applicable to an inland lake). Therefore the numbers of studies and valuation estimates given in this table do not add up to the actual totals. With this in mind, there were 215 valuation records used in the database, but 56 of these were duplicates where the same valuation was applied to multiple land cover types, leaving a total of 159 unique valuation records. Table 16 gives the mean ecosystem service value per hectare per year cross tabulated by ecosystem service type and land/aquatic type.
Table 17 gives the area of each land cover class plus the total service value estimate per hectare per year of that class. Appendix 2 gives a detailed list of valuation estimates broken down by service type, land cover type, and study. Appendix 3 has the complete list of references used in the value transfer study. All dollar figures are in 2011 CAD. Both tables and the appendix mentioned here include the two beach classes, even though they were not mapped. This is done because it is clear that beaches exist in the study area and that they are of extremely high value; we simply don’t have the data to map them at this time, although they could be digitized from aerial photography relatively easily.
The total ecosystem service value estimate for the entire North Shore Study Region was $9,341,248,260 per year (Table 17). If Lake Huron open water values are subtracted (including both main lake and bays), that number drops by a small amount to $8,733,718,400. The ecosystem service value estimate for all Provincial Parks and Conservation Reserves within the study area is $1,054,593,910.
Table 15. Cross tabulation of number of valuation estimates by ecosystem service and land cover
| Category | Aesthetic/amenity | Disturbance avoidance | Gas regulation | Habitat refugium/ biodiversity | nutrient & waste regulation | Other cultural | Pollination & dispersal | Recreation | Soil retention, erosion control | Water supply/regulation | Total |
|---|---|---|---|---|---|---|---|---|---|---|---|
| Agriculture | 1 (1) | 5 (5) | 2 (2) | 1 (1) | 9 (9) | ||||||
| Forest: Adjacent to stream | 1 (1) | 1 (1) | 3 (4) | 1 (1) | 1 (1) | 1 (2) | 2 (2) | 10 (12) | |||
| Forest: Non-urban | 1 (1) | 1 (2) | 1 (1) | 3 (5) | 8 (12) | 14 (21) | |||||
| Forest: Suburban | 1(1) | 1 (1) | 1 (1) | 1 (1) | 2 (3) | 1 (1) | 7 (8) | ||||
| Forest: Urban | 1(1) | 1 (1) | 1 (1) | 1 (1) | 1 (1) | 2 (7) | 1 (1) | 8 (13) | |||
| Grassland/Pasture/Hayfield | 1 (1) | 2 (3) | 1 (1) | 1 (1) | 3 (3) | 1 (1) | 1 (2) | 1 (2) | 11 (14) | ||
| Open water: Estuary/tidal bay | 3 (5) | 2 (2) | 1 (1) | 9 (15) | 1 (1) | 16 (24) | |||||
| Open water: Great Lake nearshore | 3 (5) | 9 (15) | 12 (20) | ||||||||
| Open water: Inland lake | 1 (3) | 1 (1) | 1 (1) | 5 (10) | 8 (15) | ||||||
| Open water: River | 1 (1) | 5 (10) | 1 (1) | 8 (12) | |||||||
| Open water: Urban/suburban river | 1 (1) | 2 (2) | 3 (3) | 1 (1) | 7 (7) | ||||||
| Urban herbaceous greenspace | 2 (2) | 1 (1) | 3 (3) | ||||||||
| Wetlands: Great Lakes coastal | 2 (4) | 1 (1) | 6 (6) | 1 (1) | 1 (2) | 11 (14) | |||||
| Wetlands: Non-urban, non-coastal | 3 (4) | 1 (1) | 2 (3) | 6 (7) | 1 (1) | 4 (4) | 17 (20) | ||||
| Wetlands: Urban/suburban | 2 (2) | 2 (4) | 1 (1) | 5 (5) | 1 (1) | 2 (2) | 13 (15) | ||||
| Beach: Near structures |
3 (4) | 2 (2) | 6 (6) | 11 (12) | |||||||
| Beach: Not near structures |
5 (5) | 5 (5) |
The first number indicates total the number of studies; the second number (in parentheses) indicates number of valuation point estimates for each ecosystem service and cover type, which accounts for studies with multiple valuation estimates.
Figure 15: Land cover typology map for the North Shore region.

Table 16. Cross tabulation of estimated value per hectare per year (2011 CAD) by ecosystem service and land cover
| Category | Aesthetic/amenity | Disturbance avoidance | Gas regulation | Habitat refugium/ biodiversity | Nutrient & waste regulation | Other cultural | Pollination & dispersal | Recreation | Soil retention, erosion control | Water supply/regulation | Total |
|---|---|---|---|---|---|---|---|---|---|---|---|
| Agriculture | $32 | $96 | $28 | $181 | $337 | ||||||
| Forest: Adjacent to stream | $184 | $162 | $594 | $529 | $693 | $967 | $1,465 | $4,594 | |||
| Forest: Non-urban | $162 | $164 | $529 | $242 | $195 | $1,292 | |||||
| Forest: Suburban | $3,738 | $162 | $529 | $252 | $1,827 | $1,699 | $8,207 | ||||
| Forest: Urban | $3,738 | $162 | $529 | $252 | $7,770 | $16,917 | $1,699 | $31,067 | |||
| Grassland/Pasture/Hayfield | $5 | $20 | $112 | $27 | $139 | $21 | $70 | $5 | $399 | ||
| Open water: Estuary/tidal bay | $508 | $14 | $60 | $2,354 | $2,936 | ||||||
| Open water: Great Lake nearshore | $508 | $2,354 | $2,862 | ||||||||
| Open water: Inland lake | $584 | $625 | $31 | $3,853 | $5,093 | ||||||
| Open water: River | $31 | $3,512 | $1,742 | $5,285 | |||||||
| Open water: Urban/suburban river | $245 | $25,620 | $50,082 | $1,742 | $77,689 | ||||||
| Urban herbaceous greenspace | $43,444 | $252 | $43,696 | ||||||||
| Wetlands: Great Lakes coastal | $10,585 | $15 | $2,111 | $9,986 | $559 | $23,256 | |||||
| Wetlands: Non-urban, non-coastal | $6,327 | $15 | $77 | $2,279 | $51 | $3,658 | $12,407 | ||||
| Wetlands: Urban/suburban | $130 | $12,448 | $15 | $3,097 | $9,327 | $32,571 | $57,588 | ||||
| Beach: general |
$126,730 | $18,311 | $0 | $0 | $0 | $0 | $0 | $64,528 | $209,569 | ||
| Beach: Near structures |
$253,460 | $36,622 | $73,790 | $363,872 | |||||||
| Beach: Not near structures |
$55,265 | $55,265 |
Table 17. Areas, values per hectare per year (2011 CAD), and total values per year by land cover for entire study area including provincial protected areas.
| Class name | Value/ha | Entire study area Area (sq km) |
Entire study area Total value |
Provincial parks and conservation reserves Area (sq km) |
Provincial parks and conservation reserves Total value |
|---|---|---|---|---|---|
| Agriculture | $337 | 108 | $3,639,600 | $0 | |
| Forest: adjacent to stream | $4,594 | 1714.2 | $787,503,480 | 167.5 | $76,949,500 |
| Forest: light to partial cut or burn | $646 | 2315.6 | $149,587,760 | 19.9 | $1,285,540 |
| Forest: non-urban | $1,292 | 25162.1 | $3,250,943,320 | 2814.2 | $363,594,640 |
| Forest: suburban | $8,207 | 478.2 | $392,458,740 | 1.2 | $984,840 |
| Forest: urban | $31,067 | 75.5 | $234,555,850 | 0.0 | $0 |
| Grassland/pasture/hayfield | $399 | 267.2 | $10,661,280 | 0.1 | $3,990 |
| Open water: great lake bay/ estuarine | $2,937 | 195.4 | $57,388,980 | 2.1 | $616,770 |
| Open water: great lake nearshore | $2,862 | 1922.4 | $550,190,880 | 39.5 | $11,304,900 |
| Open water: inland lake | $ 5,093 | 3512.8 | $1,789,069,040 | 899.6 | $458,166,280 |
| Open water: river | $5,285 | 242 | $127,897,000 | 52.0 | $27,482,000 |
| Open water: unclassified, non-urban | $850 | 761.8 | $64,753,000 | 146.1 | $12,418,500 |
| Open water: urban/suburban lake | $25,919 | 10.3 | $26,696,570 | 0.5 | $1,295,950 |
| Open water: urban/suburban river | $77,689 | 100.7 | $782,328,230 | $0 | |
| Unvalued | 1995.8 | $0 | 158.2 | $0 | |
| Urban herbaceous greenspace | $43,696 | 15.8 | $69,039,680 | $0 | |
| Wetlands: coastal | $23,256 | 49.3 | $114,652,080 | 8.0 | $18,604,800 |
| Wetlands: non-urban, non-coastal | $12,407 | 659.9 | $818,737,930 | 66.0 | $81,886,200 |
| Wetlands: urban/suburban | $57,588 | 19.3 | $111,144,840 | 0.0 | $0 |
| Total | $9,341,248,260 | $9,341,248,260 | $1,054,593,910 | $1,054,593,910 |
4.2 ARIES results
ARIES synthesizes information into different groups of mapped results for each modeled ecosystem service. The first group of maps helps understand how much service value is available and how much room there is for improvement. Theoretical supply maps show the amount of value that could be produced in ideal situations, assuming that all services produced are able to reach people. The theoretical values do not account for service flows and assume that the total quantity of a service that is generated supplies a benefit. This value is similar to what is computed from a value transfer analysis. Possible supply maps show the amount of a service that can reach beneficiaries assuming there are no sinks present on the landscape. Actual supply maps depict the amount of a service that actually reaches the users in a useful form after accounting for supply (source locations), rival use and natural deposition (sink locations), and connectivity (flow paths). A comparison of these maps helps understand the efficiency of the delivery of the service in the area: if the Possible values are higher than the Actual values, there is usually room for some type of policy intervention to improve or restore service delivery.
Other maps link supply and demand in ways that may be used to spot problem areas in need of intervention. For example, Blocked Supply maps show the value that is produced by the ecosystem but cannot get to humans, because of policy-controlled issues such as pollution or flow diversions resulting from infrastructure or natural landscape features. Inaccessible Supply maps show the value that is produced by the ecosystem but cannot be accessed by humans due to a lack of connectivity between source and use locations. The Blocked Supply values can be used to prioritize areas where human intervention may restore service delivery, while Inaccessible supply values highlight those areas where service production may be under-utilized.
Result maps are always produced in pairs, describing both the natural sources and the human beneficiaries of the service. Depending on the policy, research, or decision-making priorities, one or the other may be more relevant. For example, the Blocked Demand map for surface water will show the location and amounts of unmet water demand (e.g. residential location without access to water). Conversely, the Blocked Supply map shows the areas that produce water that is ultimately “wasted” by natural phenomena such as evaporation, caught by infrastructure such as dams, or polluted beyond the point of usability. The Inaccessible Demand map identifies water sources that cannot meet the needs of beneficiaries without major structural intervention on the landscape (altering the flow dynamics to produce hydrologic connectivity). With minimal training, a decision maker can learn to design custom scenarios and use a combination of the modeled outputs to gain a deep understanding of the service values provided, the extent of policy opportunities and limitations, and the location and quantity of demand (met and unmet) for all of the relevant stakeholder groups under a range of social, policy, and environmental conditions.
4.2.1 Algonquin Provincial Park carbon model results
ARIES models are typically described in a source, sink, use and flow paradigm. However, the Carbon Sequestration Model is not particularly amenable to that approach. In this model, it is assumed that all source locations are connected to all use locations via the mixing of greenhouse gases in the upper levels of the Earth’s lower atmosphere. Consequently, flow paths are not estimated for the Carbon Sequestration model as they are in the other ARIES models presented below. Instead, net carbon sequestration rates at each location are independent of their spatial relationship with beneficiaries.
The Vegetation and Soil Carbon Sequestration value (i.e. the source value, total carbon storage and sequestration rate net of natural emissions), shown in Figure 16, represents the expected amount of net carbon sequestration measured in tons of carbon per hectare per year. Lakes and water bodies have no sequestration value. This estimate indicates that per pixel carbon sequestration ranges between 0 tons of carbon per hectare per year (yellow to green) and approximately 1.25 tons of carbon per hectare per year (purple to red) with a total estimated sequestration value for the entire park of 1,375,870 tons of CO2 per hectare per year.
Figure 16: Carbon Sequestration in Algonquin Provincial Park measured in tons of carbon per hectare per year.

4.2.2 Algonquin Provincial Park Recreational viewshed model results
Analysis of recreational viewsheds within Algonquin Provincial Park was conducted for three beneficiary groups: backcountry canoe users, backcountry hikers, and front country campers. The detailed results presented below document the findings for the backcountry canoe users. A summary of findings for all user groups can be found in the Discussion section, and a subset of the mapped outputs for the backcountry hikers and front country campers can be found in Appendix 6.
- Theoretical source, sink, and use: Calculated by running the source, sink and use models, without accounting for flow values (see section 4.2 for additional discussion of the term “theoretical”)
- Theoretical recreational viewshed source: Areas capable of supplying natural views ranked on a relative scale from 0-100, where higher numbers indicate greater aesthetic beauty. Virtually every location within Algonquin Provincial Park provided a positive scenic beauty value. The model filtered locations with values below 25 to highlight the locations of greatest potential view value within the Park. Because each source point could potentially provide a view to each use point, and these views could be considered additive for the purposes of estimating ecosystem service value to users, the Theoretical Source that could be provided by each location is equal to the View Source Bayesian network value at that location times the number of users. For this reason, the values in this result may appear quite large (i.e. outside the 0 – 100 range). The maximum Theoretical Source value for canoe use is approximately 35,000 (where units are the source value of each pixel multiplied by the number of pixels, or use locations).
- Theoretical recreational viewshed sink: Areas of visual blight that degrade viewshed quality expressed as a relative ranking, where higher numbers indicate greater visual blight. Visual blight (negative beauty) was estimated from the presence of clearcuts, railways, and transportation or energy infrastructure. The maximum theoretical visual blight was primarily clustered in the northeastern edge of the park, due to the presence of clearcuts in that region. The flow analysis excluded any visual blight values below 6, considering this to represent background noise within the model. Because each sink point could potentially impact every sight line, the Theoretical Sink value at each location is equal to the View Sink Bayesian network value at that location times the number of sight lines in the study area. This is equal to the number of source points times the number of use points, since each sight line is defined by a source – use pair. As a result, the values in this result map may appear quite large. The maximum Theoretical Sink value for canoe use is approximately 50,000,000.
- Theoretical recreational viewshed use: Recreation sites visited by backcountry canoe users based on the 2011 Ontario Parks Backcountry Visitor Survey. Theoretical use sites represent locations survey respondents visited within Algonquin Provincial Park and, therefore, where they might experience scenic views. Because each use point could potentially have an unobstructed view of every source point, the Theoretical Use value at each location is equal to the sum of the View Source Bayesian network values at all source locations. For this reason, the values in this result map may appear quite large and do not show any variability. The maximum Theoretical Use value for canoe users is approximately 166,000.
- Possible source, use, and flow: Calculated by running the source, use, and flow models without accounting for sinks (see section 4.2 for additional discussion of the term “possible”)
- Possible recreational viewshed source: The amount of scenic beauty flowing between a scenic landscape location and a backcountry canoe recreation site, without considering the negative impact of sinks. This data represents a measure of visibility of each source location to any of the recreation sites identified in the Theoretical Use data (1c), and is expressed as a relative ranking where higher numbers indicate greater viewshed source values. Possible Source values for backountry canoe users range between 0 – 1,074.
- Possible recreational viewshed use: The amount of scenic beauty that flows to a given canoe recreation site, without considering the negative impact of sinks. The data is expressed as a relative ranking where higher values indicate greater access to scenic beauty. Use locations were identified based on responses to the 2011 Ontario Parks Backcountry Visitor Survey. Possible Use values for canoe users range between 0 –10,630.
- Possible recreational viewshed flow: The amount of aesthetic beauty flowing along lines of sight between source and use locations. The data is expressed as a relative value where higher values indicate a greater flow of scenic beauty in that location. The data can be used to identify both the location and magnitude of the flow of possible scenic beauty. A flow value greater than zero indicates that the amount of scenic beauty that passes through this location exceeds the amount of visible scenic blight. Possible Flow values for canoe users range between 0 – 10,630.
- Actual source, sink, use and flow: Actual recreational viewshed benefits provided, degraded, received, and transported with a full accounting of sources, sinks, uses and flows.
- Actual recreational viewshed source: The amount of scenic beauty supplied to canoe recreation sites. The identified locations represent the points of origin of the service value enjoyed by canoe users in the Park. The data are presented as a relative ranking, where higher values indicate a greater amount of supplied service. Actual Source values are calculated by subtracting Actual Sink (3b) values from the Possible Source (2a) values. Figure 17 displays the locations and magnitudes of actual recreational viewshed source values provided to canoe users. Actual Use values for canoe recreation range between 0 – 770. A clustering of high-valued pixels can be found around Opeongo and Big Trout Lakes and to the west of Cedar Lake, while low value regions can be found in the southern and eastern sections of the park.
- Actual recreational viewshed sink: The amount of visual blight resulting from degraded landscapes within the Park that reach canoe use locations. The data are presented as a relative ranking, where higher values indicate a greater amount of visual blight. Figure 18 displays the amount of actual visual blight which impacts the views from backcountry lakes visited by canoeists. Actual Sink values for canoe users range between 0 – 1380. A concentration of high value pixels can be found along the Highway 60 corridor, with low to intermediate values scattered throughout the remainder of the Park.
- Actual recreational viewshed use: The location and level of service for canoe recreation sites that benefit from the scenic beauty in Algonquin Provincial Park. The data is expressed as a relative value where larger values indicate higher recreational viewshed use value. The Actual Use value, presented in Figure 19, is derived by subtracting the visual blight values from the Actual Sink data (3c) from the Possible Use data (2b). The data show that the lakes used by canoeists are both large in number and scattered throughout the Park. Actual Use values for paddlers range between 0 – 6,114.
- Actual recreational viewsheds flow: The amount of aesthetic beauty actually flowing between scenic landscapes and recreational canoe use sites. The data is expressed as a relative value where larger values indicate higher recreational viewshed use value. Figure 20 displays the level of scenic resources projected along the lines of sight that connect the sources of scenic beauty in the Theoretical Source data (1a) to the locations of canoe use identified in the Theoretical Use data (1c). Actual Flow values for canoe users range between 0 – 6,114. The highest flow values are found along a north – south oriented axis that runs through the western portion of the Park. A relatively few isolated areas within the Park and around the southern extent of the Park do not serve as flow corridors for transmitting aesthetic beauty (rendered in gray on the map). The Actual Flow data for all three use types were combined to produce a map of Total Actual Flow (see Figure 21) within the Park. The Total Actual Flow results are largely dominated by the canoe and hiking results because the use sites for these two activities are more widely distributed throughout the Park. The highest concentration of total flow values are arranged in a north – south orientation stretching from the southwest corner of the Park to Cedar Lake. From a management perspective, high flow locations are critical to providing aesthetic ecosystem services. Introducing visual blight along a high value flow path (e.g. permitting a clearcut visible from a popular recreation site) would result in a negative impact on the scenic views from that location, while eliminating blight may serve to restore or enhance the delivery of aesthetic services (i.e. increase the Actual Flow values at a given location).
Figure 17: Actual aesthetic source value map for canoe users in Algonquin Provincial Park.

Figure 18: Actual aesthetic sink value map for backcountry canoe users in Algonquin Provincial Park.

Figure 19: Actual aesthetic use value map for backcountry canoe users in Algonquin Provincial Park.

Figure 20: Actual aesthetic flow value map for backcountry canoe users in Algonquin Provincial Park.

Figure 21: Total actual aesthetic flow value map for backcountry canoe, hiking and front country camping recreation users in Algonquin Provincial Park.

- Inaccessible source, sink, and use: Possible Values (see Output 2) subtracted from Theoretical Values (see Output 1). Inaccessible values account for sources that do not provide, sinks that do not degrade, and beneficiaries that cannot enjoy the recreational viewshed amenity values due to a lack of flow connection between source and use locations.
- Inaccessible recreational viewshed source: Theoretical sources of aesthetic viewsheds that are not revealed to recreational sites due to blocked flow paths or a lack of recreational activity in a site that otherwise could provide a benefit. The data are presented as a relative ranking where high numbers represent a greater amount of inaccessible aesthetic ecosystem service values. Numerically, this result is obtained by subtracting the Possible Source values (2a) from the Theoretical Source values (1a). Inaccessible Source values for canoe users range between 0 – 34,800. These values are expected to be large because only a small fraction of all scenic beauty sources are visible to the recreation sites used in this analysis. If Park crowding were a problem, an analysis of the Inaccessible Source value could be used to identify areas in the Park that would feature aesthetic ecosystem service delivery if flow connections to use locations were possible. The result of an analysis of Inaccessible Sources could highlight priority locations for access or infrastructure development to support an expansion of recreational activities within the Park.
- Inaccessible recreational viewshed sink: Theoretical sinks of viewshed quality that do not degrade the overall service delivery because they do not intersect the recreational viewshed source locations. The data are presented as a relative ranking where high numbers represent a larger amount of Inaccessible Sinks. This data illustrates the amount of the Theoretical Sink (1b) value that does not negatively impact scenic views to recreation sites because it is not visible from any of the identified use locations (3c). Numerically, it is the result of subtracting the Actual Sink values (2b) from the Theoretical Sink values (1b). Inaccessible Sink values for canoe users range between 0 – 50,000,000. Inevitably, these values will be quite large since only a small subset of the theoretical sight lines are actually possible given the local topography of the study region and the small subset of those which pass through blighted locations.
- Inaccessible recreational viewshed use: Recreational sites whose captured value is limited by flow reductions (i.e. sinks) or without viewshed source flow connections (i.e. locations with no aesthetic viewshed source values). The data are presented as a relative ranking where higher values reflect a greater level of Inaccessible Use. This data indicates the amount of the Theoretical Use value (1c) that is not captured at a recreation sites due to a lack of unimpeded sight lines to any of the Possible Source (1a) locations. Numerically, it is the result of subtracting the Possible Use values (2b) from the Theoretical Use values (1c). Inaccessible Use values for canoe users range between 0 – 166,000.
- Blocked source, use, and flow: Source, use, or flow values degraded by sinks.
- Blocked recreational viewshed source: Sources of aesthetic beauty blocked by sinks. This data shows the degree to which the scenic beauty from any source location is made less valuable due to the impacts of visual blight between it and one or more canoe recreation sites. The data are presented as a relative ranking where higher numbers indicate a greater degree of Blocked Source values (i.e. scenic amenity value lost due to visual blight). Blocked Source values for canoe users range between 0 –330.
- Blocked recreational viewshed use: Canoe recreation sites that would otherwise receive benefits from the scenic qualities of recreational viewsheds but have their access to aesthetic beauty blocked by sinks. The data are presented as relative rankings where larger values indicate a greater degree of Blocked Use. Blocked Use values for canoe users range between 0 – 5,800. This data identifies recreation sites which are negatively impacted by visual blight based on the landscape condition within their viewsheds. Visitor locations with high Blocked Use values may indicate that factors other than landscape aesthetics are drawing them to the Park.
- Blocked recreational viewshed flow: Recreational viewshed flows blocked by visual blight. The data represent a relative ranking where larger values indicate a greater degree of Blocked Flow. Blocked Flow values for canoe users range between 0 –5,800. This data depicts the location of view paths (between sources of scenic beauty and canoe recreation sites) which are negatively impacted by visual blight and the amount of flow reduction resulting from this impact. From a management perspective, locations with high Blocked Flow values could be prioritized for management intervention aimed at restoring or enhancing aesthetic service flows through that location.
4.2.3 Lake of the Woods Region surface water supply model results (Sub-watershed ID 1384501185)
The following section presents an analysis of residential surface water demand within the Lake of the Woods region. A summary of findings can be found in the Discussion section, and a subset of the mapped outputs can be found in Appendix 6.
- Theoretical source, sink, and use: Calculated by running the source, sink and use models, without accounting for flow values.
- Theoretical surface water supply source: Locations capable of supplying surface water supplies measured in millimeters per year. The sources of surface water in this model include precipitation and snowmelt. These two factors are summed to estimate the amount of total runoff (mm/yr). The data was interpolated from weather station data, and its variability is minimal, ranging from 2302-2386 mm/year over the study region.
- Theoretical surface water supply sink: The expected water absorption capacity in millimeters per year as a result of soil infiltration and/or evapotranspiration.
- Theoretical surface water supply use: Total demand for potable water by residential users in millimeters per year. The total demand for surface water was estimated by uniformly distributing population across individual Census Dissemination Areas and multiplying the population density of a pixel by 1600 m3 of water per person per year. (See http://www.environmentalindicators.com/htdocs/indicators/6wate.htm [link inactive] for more information about average annual Canadian water use.)
- Possible source, use, and flow: Calculated by running the source, use, and flow models without accounting for sinks.
- Possible surface water supply source: This data shows the amount of water in millimeters per year that originates in each cell that would flow to the beneficiaries identified in the Theoretical Use data (1c) if there were no sinks on the landscape. Locations with a value of zero value cannot provide surface water to residential beneficiaries, while those with values greater than zero might. Since surface water is plentiful within the region, most source and use locations are close together. Because the population density is highest in the northwestern part of the sub-watershed and in a smaller enclave along the southern edge, the source locations generally match the areas with high population density.
- Possible surface water supply use: The amount of surface water supply that would reach beneficiaries if there were no sinks. This value is measured in millimeters per year. As expected, due to the population concentrations noted in the previous section, water use is highest in the northwestern and southern portions of the sub-watershed.
- Possible surface water supply flow: The maximum expected surface water flow measured in millimeters per year between source and use locations if there were no sinks on the landscape.
- Actual source, sink, use, and flow: Actual surface water supply benefits provided, degraded, received, and transported with a full accounting of source, sink, use and flows.
- Actual surface water supply source: Water supply source locations that are hydrologically connected to human beneficiaries (i.e. actually provide water to human beneficiaries). The values are expressed in millimeters per year. Actual Source values are calculated by subtracting Actual Sink (3b) values from the Possible Source (2a) values (see Figure 22). This is the amount of surface water that originates in each location that supplies benefits to downstream water users.
- Actual surface water supply sink: The amount of surface water that is blocked from use by human beneficiaries. The data is measured in millimeters per year. Due to the large amount of water in close proximity to beneficiaries, none of the Theoretical Sink locations (1c) had any noticeable impact.
- Actual surface water supply use: Amount of surface water demand by residential beneficiaries that is satisfied, expressed in millimeters per year. This is the amount of water actually received by each beneficiary. The Actual Use value, shown in Figure 23, was derived by subtracting the Actual Sink data (3c) from the Possible Use data (2b). As with Possible Use (2b), the population density concentrations in the northwestern and southern parts of the sub-watershed directly coincide with the Actual Use values, indicating that every beneficiary that expressed demand in the model has access to adequate surface water to meet their needs.
- Actual surface water supply flow: Volume of water flowing between the Theoretical Source data (1a) and use locations identified in the Theoretical Use model (1c). Data are expressed in millimeters per year. Figure 24 depicts the amount of surface water that travels from source locations to eventual water users. Because the Actual Source (3a) and Actual Use (3b) locations are relatively close together, the Actual Flow paths are short.
- Inaccessible source and use: Possible Values (Output 2) subtracted from Theoretical Values (Output 1); accounts for sources that do not provide, sinks that do not degrade, and beneficiaries that cannot use the service due to a lack of flow connections.
- Inaccessible surface water source: Theoretical Sources (1a) of surface water not available to beneficiaries either because they are not hydrologically connected to Actual Use (3c) locations or because there are sufficient surface water sources to meet downstream demand. This data shows the amount of potential runoff in millimeters per year, which is not captured for use by humans in this sub-watershed. The large amount of Inaccessible Source in the sub-watershed can be attributed to two factors: 1) A lack of hydrologic connectivity between the source points of origin and downstream human users; and 2) The fact that there is a great deal more water in this system than the estimated need of a relatively small population distributed throughout the region. If water supply was scarce in the region, locations with Inaccessible Source values greater than zero could be considered priority locations for water extraction or transfer to locations with unmet demand.
- Inaccessible surface water use: Unmet demand for water supply attributable to a lack of hydrologic connectivity between source and use locations expressed in millimeters per year. Because there is not any unmet demand in this region, the data are all equal to zero in this map. However, some positive values do occur along the western border of the mapped region. This is likely due to a data projection artifact, which has left a thin band of zeroes along the western edge of the Theoretical Source (1a) map. Thus these non-zero values should be ignored when considering this modeled output.
- Blocked source, use, and flow: Source, use, or flow values degraded by sinks.
- Blocked surface water source: Sources of surface water blocked by sinks. This data shows the amount of reduced surface water availability from a source location due to the presence of sinks between it and any hydrologically connected, downstream site where demand exists. The data are expressed in millimeters of water per year. Because this is a water rich location, the demand for surface water supplies has been completely satisfied. As a result, the Blocked Source data are all equal to zero. If water scarcity were an issue here, the Blocked Source data could assist with locating potential sites for infrastructure investments that could supply water to drought prone locations.
- Blocked surface water use: The quantity of unmet surface water demand that does not reach a given location because it is blocked by sinks expressed in millimeters of water per year. Because this is a water rich location, the demand for surface water supplies has been completely satisfied. As a result, the Blocked Use data are all equal to zero.
- Blocked surface water flow: Surface water flows blocked by sinks expressed in millimeters of water per year. This data depicts the specific flow paths between source and use locations for surface water demand which are negatively impacted by the presence of sinks. Because this is a water rich location, the demand for surface water supplies has been completely satisfied. As a result, the Blocked Use data are all equal to zero. If the Blocked Use values were greater than zero, then the Blocked Flow locations could be targeted for restoration, to (re)connect Blocked Source and Blocked Use locations.
Figure 22: Water provision source value map for residential users in Watershed 2, Lake of the Woods Region.

Figure 23: Water provision use value map for residential users in Watershed 2, Lake of the Woods Region.

Figure 24: Water provision flow value map for residential users in Watershed 2, Lake of the Woods Region.

4.2.4 Lake of the Woods Region Sediment Regulation Model Results (Sub-watershed ID 1384501180)
The following section presents an analysis of sediment regulation services for agricultural users within the Lake of the Woods region. A summary of findings can be found in the Discussion section, and a subset of the mapped outputs can be found in Appendix 6.
- Theoretical source, sink, and use: Calculated by running the source, sink and use models, without accounting for flow values.
- Theoretical sediment regulation source: The amount of sediment that could be supplied to downstream locations from a source region (i.e. areas of erosion) measured in tons of sediment per hectare per year.
- Theoretical sediment regulation sink: The amount of sediment that accretes along sediment transport pathways (i.e. floodplains and reservoirs) expressed in tons of sediment per hectare per year. These data values are an estimate of the maximum amount of sediment that could be captured within floodplains in the sub-watershed.
- Theoretical sediment regulation use: Locations that could benefit from sediment deposition. This data identifies the presence of floodplain farmland, beneficiaries that relies on sediment deposition to maintain their land area or improve soil fertility.
-
Possible source, use, and flow: Values calculated by running flow models without accounting for sinks.
In the ARIES Sediment Regulation Model, sediment deposition only occurs in floodplains, which are sinks. If we remove the sinks from the model, there can be no Possible Use (because there can be no service delivery in the absence of sinks). This in turn means that there will also not be any Possible Source or Flow values (since there are no beneficiaries, there are no source – use pairs to flow between). Therefore, the Possible Source, Possible Use, and Possible Flow maps are all uniformly zero in value and are not meaningful for interpretation.
- Actual source, sink, use, and flow: Actual sediment regulation benefits provided, degraded and received, with a full accounting of source, sink, use and flows.
- Actual sediment regulation source: Locations which provide sediment to downstream users who benefit from its delivery. Figure 25 shows the amount of sediment in tons of sediment per hectare per year which is expected to erode from each source location and be deposited on downstream farmland.
- Actual sediment regulation sink: The amount of sediment that accrues in areas of deposition expressed in tons of sediment per hectare per year. Figure 26 shows the amount of sediment which is captured upstream of a floodplain farmer that would otherwise benefit from its delivery. Sediment delivery in this context is a rival use, meaning that individual farmland locations are vying for their share of a potentially scarce resource. Sediment deposited in one location is not available to other users. Sink locations may therefore occur on farmland (whereby a service is delivered, albeit to a single farm) or in locations where no benefit is delivered and the sediment is not available to any users.
- Actual sediment regulation use: The amount of sediment delivered to actual farmland locations measured in tons of sediment per hectare per year. Actual Use occurs when farmland and floodplains intersect. The data (Figure 27) show the amount of sediment captured by the floodplain sinks on each farmland location. This is the amount of benefit in tons per hectare per year, which is expected to accrue to each use location.
- Actual sediment regulation flow: The actual flow of sediment regulation between Actual Source (3a) and Actual Use (3b) locations. Figure 28 shows the total amount of sediment which passes through any location on its way from erosion sources to floodplain farmland expressed in tons of sediment per hectare per year. Blocking the flow of sediment delivery would have negative consequences for downstream beneficiaries that rely on the delivered sediment to maintain agricultural land area (in the face of erosion).
- Inaccessible source, sink, and use: Possible Values (see Output 2) subtracted from Theoretical Values (see Output 1); accounts for sources that do not provide, sinks that do not degrade, and beneficiaries that cannot use due to a lack of flow connections. The Possible Values are all equal to zero for this service. As a result, the Inaccessible Values for the Sediment Regulation Service Model will be the same as the Theoretical Values and are therefore not meaningful for interpretation.
- Blocked source, use, and flow: Source, use, or flow values degraded by sinks. The Blocked Values are computed by subtracting the Actual Values (see Output 3) from the Possible Values (see Output 2). The Possible Values are all equal to zero for this service. As a result, the Blocked Values for the Sediment Regulation Service Model are also equal to zero and should be ignored when evaluating the model outputs.
Figure 25: Sediment regulation source value map for Watershed 7, Lake of the Woods Region.

Figure 26: Sediment regulation sink value map for Watershed 7, Lake of the Woods Region.

Figure 27: Sediment regulation use value map for Watershed 7, Lake of the Woods Region.

Figure 28: Sediment regulation flow value map for Watershed 7, Lake of the Woods Region.

4.2.5 Summary values and valuation estimates derived from ARIES model outputs
Results for the products described in the Methods section above are given in the following tables and figures. Table 18 provides a summary of the Potential Source, Blocked Flow and Actual Flow values for the Carbon Sequestration and Recreational Viewsheds models. Table 19 provides a summary of the Potential Source, Blocked Flow and Actual Flow values for the Water Supply and Sediment Regulation models. Because there is no Carbon Sequestration Flow Model, there are no Blocked or Actual Flow values listed. Additionally, because all residential water use was satisfied, the Blocked Flow value is 0. Two scenarios were run for each of the three Recreational Viewshed Models, a Baseline Scenario and a No Cottages Scenario. In each case, the Potential Source values remain the same, the Blocked Flow values in the Baseline Scenario are greater than those in the No Cottages Scenario, and the Actual Flow values in the Baseline Scenario are less than those in the No Cottages Scenario. Finally, mapped estimates of economic flow values are presented in Figure 29, Figure 30, Figure 31 and Figure 32 and described in the sections that follow.
Table 18: Potential source, blocked flow and actual flow values for the carbon sequestration and recreational viewshed models.
Carbon sequestration (tons C/ha/yr)
| Potential source | Blocked flow | Actual flow |
|---|---|---|
| 1,375,870 | N/A | N/A |
Baseline scenario
| Recreational viewsheds (abstract units/yr) | Potential source | Blocked flow | Actual flow |
|---|---|---|---|
| Backcountry canoe use | 859,891,600 | 13,128,650 | 17,860,710 |
| Backcountry hiking use | 663,764,100 | 21,141,240 | 32,928,680 |
| Frontcountry campground use | 375,272,600 | 817,683 | 63,351 |
No cottages scenario
| Recreational viewsheds (abstract units/yr) | Potential source | Blocked flow | Actual flow |
|---|---|---|---|
| Backcountry canoe use | 859,891,600 | 12,863,620 | 18,125,740 |
| Backcountry hiking use | 663,764,100 | 21,083,340 | 33,590,780 |
| Frontcountry campground use | 375,272,600 | 772,565 | 108,470 |
Table 19: Potential source, blocked flow and actual flow values for the carbon sequestration, water supply, sediment regulation and recreational viewshed models.
| Potential source | Blocked flow | Actual flow | |
|---|---|---|---|
| Water supply (mm/yr) | 80,096,250 | 0 | 11,320 |
| Sediment regulation (tons/yr) | 8,225,504 | N/A | 42,035 |
Carbon:
To estimate the economic value of carbon sequestration and storage in Algonquin Provincial Park, the social cost of carbon as estimated by Tol (2008 and 2011)
Recreation:
The economic values of the Recreational Viewshed Model Actual Flows were estimated using the 2011 Ontario Parks Backcountry Visitor Survey (canoe use and hiking use) and the 2011 Ontario Parks Campground Visitor Survey (campground use). Both surveys included questions regarding trip cost and destination(s) within the Park boundaries. The Park destinations noted by survey respondents were designated as the use locations.
Total expenditures in 2011 related to Algonquin Provincial Park front country campground use, canoe use and backcountry hiking use is approximately $2.5 million, $3.7 million and $190,000, respectively. The following bullet points detail the process steps for spatially allocating the total canoe expenditure data within the Park. The same process steps were followed to derive the backcountry hiking and front country camping results. These maps are included in Appendix 6.
- The Actual Flow values (see Figure 20) were summed over the entire study area to determine the aggregate value of enjoyed aesthetic beauty.
- The total backcountry canoe user expenditure was divided by the sum of the Actual Flow values (step 1) to estimate a price per unit of aesthetic beauty totaling ~$0.13 (~$0.0058 for backcountry hiking and ~$58.21 for front country camping users).
- The Actual Flow values (see Figure 20) were multiplied by the price per unit of aesthetic beauty to estimate the total value of Aesthetic Flow in each pixel. Figure 30 displays the per pixel values for canoe users, ranging between $0 and $800 ($0-$90 for backcountry hiking and $0 to $14,250 for front country camping users).
Figure 29: Economic value of carbon sequestration potential in Algonquin Provincial Park.

Figure 30: Estimated economic value of recreational viewsheds in Algonquin Provincial Park for canoe users.

Surface water supply:
The Surface Water Supply Model identified locations that provide water for residential beneficiaries. To economically value these locations, forested source and flow locations were identified, and, based on the static Value Transfer approach, assigned a value of $1,699 per hectare (the economic value of urban forest cover), unless they were impaired forest lands, in which case they were assigned a value of $850 per hectare (see Figure 31). Summing the total number of forested and impaired forest lands within the region multiplied by their per hectare values yields a total value estimate of approximately $845,000. The reader will notice that virtually no value is assigned to pixels within either the Provincial Park or Conservation Reserve areas. This is an artifact of the way the population was distributed across the landscape during model development. Increasing the specificity of beneficiary locations will allow for improved flow mapping, and is more likely to yield measurable benefits flowing from within these boundaries.
Sediment regulation:
The process steps for valuing sediment regulation services are similar to those used in the valuation of surface water supply. Actual Sink locations (see Figure 26) that intersect forested land were identified. These pixels were assigned a value of $748 per hectare (the average of the forested sediment regulation and nutrient regulation values taken from the literature), unless they were impaired forest land which were assigned a value of $374 per hectare. The two value estimates were combined in this case due to the small number of literature references available to value this type of land cover in this location. Based on these computations, the total value of sediment regulation service in this watershed was estimated to be approximately $37,500. The data are mapped in Figure 32. Obviously this estimate is quite low. This can again be explained by the way the beneficiaries are defined in this model, the specifics of the landscape and the lack of floodplain data. Given more information, alternative methods of specifying beneficiaries and their locations on the landscape or more accurately depicting the location of actual floodplains could be considered. Further, if the focus was on an a larger urban area that is hydrologically connected to lands in the Provincial Park system, an analysis of the avoided cost of sedimentation to water filtration plants, power producers, and other entities that view sediment deposition as a disservice might prove more meaningful for economic valuation.
Figure 31: Economic value of Water Provision Potential in Watershed 2, Lake of the Woods Region.
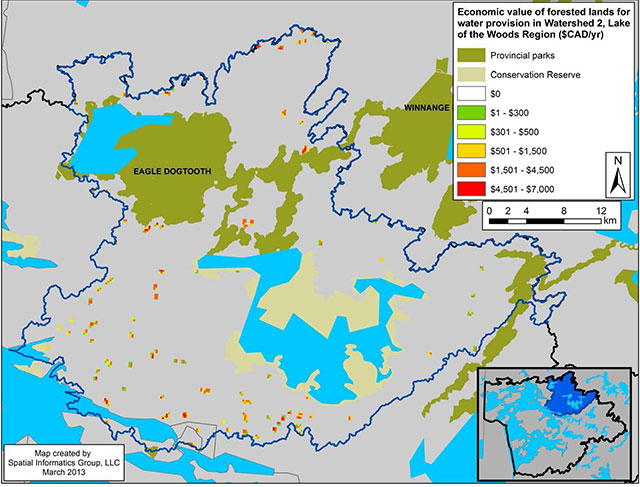
Figure 32: Economic value of Sediment Regulation Potential in Watershed 7, Lake of the Woods Region.

4.3 Scenario analysis using the recreational viewshed model
The Recreational Viewshed Model was used to analyze changes in aesthetic flows as a result of eliminating visual blight in the Park attributed to development. A modified version of the Park Infrastructure Points data was created without including the Residential and Commercial Lease Points within the Park to simulate their removal from Park grounds. The majority of these cottages are located along the Highway 60 corridor, with a small number also located along the northern extent of the Park. It was anticipated that the removal of the cottages would reduce the amount of visual blight on the landscape and provide an overall benefit to the Park’s recreational users. The Recreational Viewshed model was run for each of the three beneficiary groups using the scenario data, and the model results were compared against the baseline condition.
Figure 33 illustrates the difference in Actual Flow values between the scenario and baseline model runs. The Actual Flow values of the baseline model were subtracted from those of the scenario model. The results indicate that per pixel Canoe Actual Flow values increased between 0 – 450 units per pixel within the Park, depending on their location and visual connectivity with locations where cottages were removed. Per pixel Hiking Actual Flow values increased by as much as 1,000 units, while Campground Actual Flow increased by up to 175 units. Because the number of Canoe Use locations was higher than both the Campground and Hiking Use locations, the increase in Canoe Actual Flow was spread out over a larger portion of the Park. However, the increase in total Actual Flows was greatest for the backcountry hiking use (~660,000 units representing a 2% increase), followed by backcountry canoe use (~265,000 representing a 1.5% increase) and campground use (~15,300 units representing a 24% increase).
The implementation of this scenario analysis reveals a strength of the dynamic modeling approach: its utility in generating useful information for planning and management decisions. Spatial data can be altered to test outcomes of alternative management decisions, and multiple scenarios can be linked together. For example, instead of simply removing cottages, landscape restoration activities (e.g. reforestation) on formerly developed sites could be considered. In addition to expected changes in aesthetic values, landscape restoration activities would also change carbon sequestration potential within the Park. The dynamic modeling approach enables the analysis of co-benefits and the quantification of changes in service delivery resulting from a proposed management action.
Figure 33: Difference in actual flow values between the no cottages scenario and the baseline scenario.

5. Discussion and interpretation
5.1 Value transfer
A value transfer approach was used to generate static estimates of the yearly flow of ecosystem service values for the North Shore study region (see Figure 2) based on a literature database. The $9.3 billion/year figure we derived appears reasonable in magnitude, but validating it would be impossible without costly primary valuation studies. One fact worth noting is that beach dunes were not included in this valuation, even though our database gives by far the highest value per hectare for this land cover type. They were not included because we had no GIS data on the location of beach dunes. Whether this would make a significant impact on the final value would depend on the amount of beach dune land.
As was found in the southern region study (Troy and Bagstad, 2009), value transfer is very sensitive to the “urban” and “suburban” designations for land cover and these categories not surprisingly received the highest per-hectare valuations. This is because value transfer essentially replaces the source-beneficiary linkage function from ARIES with a far more simplistic linkage based on land cover typology. The urban and suburban designations are meant to differentiate valuation estimates derived in populous areas from those derived in more remote areas. Because of the limited number of studies available that provide valuation estimates for the many combinations of land cover types and ecosystem services across different population contexts, the best that can be done with the existing literature was to divide studies into that simplistic three-tier designation: urban, suburban and non-urban. Clearly this is a simplification because it treats all cities above the minimum threshold size as equals, regardless of how much bigger they actually are. Hence, a smaller city like Sudbury would be considered equivalent to one like Toronto, even though the number of beneficiaries in the latter is far greater than the former. This would probably serve to somewhat overvalue services from ecosystems around small cities while undervaluing them in areas around large cities. It is also a simplification because being considered an urban or suburban ecosystem is based on simple straight line distance, when in fact individual services flow variable distances via alternative transport mechanisms based on factors like topography. ARIES’ more realistic flow modeling is far better able to characterize what lands are actually benefiting an urban area based on the spatial relationships among source, sink and use (beneficiary) locations. Another issue is that only the forest category has been studied enough in the literature to be subdivided in those three settlement categories. Rivers, lakes and wetlands are only subdivided into two categories: urban/suburban and non-urban. Other categories are not subdivided at all due to an insufficient numbers of studies. This, and the many other limitations to value transfer that are discussed in the Background section of this document, underscore that this method, while useful, is a simplification of a very complex reality.
It is, however, a simplification that is often necessary because the cost of primary valuation is so high. Value transfer still provides a fairly straightforward and feasible approach to conducting rapid ecosystem service assessments and evaluating environmental and economic tradeoffs when funds are limited. While value transfer is far from perfect, we believe that it is better than the status quo approach of assigning a value of zero to the benefits derived from ecosystem services.
If budgets allow, primary valuation research should always be the preferred strategy over value transfer for quantifying the value of ecosystem goods and services. In Ontario, for instance, this would allow for studying land values or stated preferences to better account for its unique fresh water resources. However, given how expensive and time-consuming primary studies can be (particularly for a suite of ecosystem services or ecosystem types), the value transfer method represents a cost-effective “second-best” strategy and a launching pad for more detailed studies.
In summary, value transfer suffers a number of limitations. But if applied carefully, it can provide a useful “first-pass” evaluation of the type and magnitude of tradeoffs that result from major changes to the natural landscape. And, as discussed below, it is a low-cost approach to doing simple analyses of alternative scenarios. Until public budgets for ecosystem service assessment, modeling, and data collection increase, it is likely that value transfer will continue to be one of the predominant approaches in the ecosystem services realm.
5.2 ARIES
The ARIES modeling platform was used to provide a dynamic modeling approach to contrast with the static approach of the value transfer methodology. Using ARIES, ecosystem service flows were quantified for four ecosystem services in two distinct park settings. In Algonquin Provincial Park (see Figure 3) carbon sequestration and recreational viewsheds were modeled, while in the Lake of the Woods region (see Figure 4), surface water provision and sediment regulation services were modeled. Preliminary economic value estimates of these ecosystem service flows were also provided by incorporating the values from the static approach (NAIS) with the modeled outputs of ARIES, except for the recreational viewsheds analysis which drew upon expenditure data collected as part of the 2011 Ontario Parks Backcountry and Campground Surveys. While admittedly simplistic, and theoretically incomplete, these results represent a first attempt at combining the two methodologies to produce more accurate value estimates.
The four ARIES ecosystem service models quantified the spatial distribution of source, sink, use and flow parameters. These outputs tell many stories at a great level of detail. It is not possible to interpret all these stories in this report. Rather, these model outputs should be considered a tool that park managers can use in conjunction with other data (e.g. as GIS overlays) to help them make spatially targeted decisions, such as prioritizing land for higher levels of conservation, or opening land to further recreational development or forestry activities. While the true value of the ARIES output will take time to be realized as these GIS outputs are increasingly exploited, a number of noteworthy, broad scale findings have emerged.
The four ecosystem service models developed in ARIES for this project serve as an important first step in the introduction of a new suite of tools and information for managing resources throughout the Provincial Park system. Recognizing the heterogeneous socio-economic, biophysical and recreational aspects of the different lands under park management, the models developed for this project could easily be transferred to similar contextual settings or serve as a template for models adapted to meet the needs of those that are different. Revised models could address additional use types (e.g. hunting, ATVing, cross country skiing, etc.), management priorities and objectives (e.g. maximizing timber production, developing new recreation areas) and/or a broad range of management, use and funding scenarios.
Finally, even though it is understood that multiple services typically occur in conjunction (and sometimes in competition) with one another, the analysis presented here quantifies and analyses ecosystem services individually. Ideally, multiple services would be simultaneously modeled for each site. Instead of identifying high value flow paths for single services, outputs could be combined (e.g. Figure 21) to maximize total delivery of benefits from a “bundle” of ecosystem services. This type of approach would allow for an improved assessment of competing uses and management alternatives. Scenario outputs might then be analyzed to better identify the “winners” and “losers” of alternative management approaches, mitigate losses to particular user groups by adjusting plans or developing additional infrastructure to offset specific losses, and otherwise inform management alternatives and long-range planning efforts.
6. Bibliography (excluding value transfer literature)
Ackerman, F. and E.A. Stanton. 2010. The social cost of carbon. Economics for Equity and the Environment: Portland, OR.
Alberti, M. (2005). “The effects of urban patterns on ecosystem function.” International Regional Science Review 28: 168-192.
Alwang, J. and P.B. Siegel. 2004. Export commodity production and broad-based rural development: Coffee and cocoa in the Dominican Republic. Prepared for Agriculture and Rural Development Department (ARD) and Latin American and the Caribbean Regional Office The World Bank. World Bank Policy Research Working Paper 3306.
Arnberger, A. and W. Haider. 2007. Would you displace? It depends! A multivariate visual approach to intended displacement from an urban forest trail. Journal of Leisure Research 39 (2): 345-365.
Auch, W.A. 2010. Modeling the interaction between climate, chemistry, and ecosystem fluxes at the global scale. PhD Dissertation, The University of Vermont, Burlington, VT.
Beier, C.M., T.M. Patterson, and F.S. Chapin, III. 2008. Ecosystem services and emergent vulnerability in managed ecosystems: A geospatial decision-support tool. Ecosystems 11: 923-938.
Benson E.D., J.L. Hansen, A.L. Schwartz, and G.T. Smersh. 1998. Pricing residential amenities: the value of a view. Journal of Real Estate Finance and Economics 16: 55-73.
Birdsey, R. 1992. Carbon storage and accumulation in United States forest ecosystems in U.F. Service, editor. General Technical Report-WO-59. USDA Forest Service, Washington, DC.
Bohensky, L., Reyers, B., Van Jaarsveld, A. 2006. Future ecosystem services in a Southern African river basin: a scenario planning approach to uncertainty. Conservation Biology 20(4): 1051-1061.
Boudreaux, D. Meiners, R. and Zywicki, T. 1999. Talk is cheap: The existence value fallacy. Environmental Law 29: 765-810
Bourassa, S.C., M. Hoesli, and J. Sun. 2004. What’s in a view? Environment and Planning A 36: 1427-1450.
Bowman, M. E. and P. F. G. Eagles. 2004. Tourism spending in Algonquin Provincial Park. In N.W. P. Munro, P. Deardon, T. B. Herman, K. Beazley, and S. Bondrup-Nielsen, editors. Making ecosystem based management work: connecting managers and researchers. Proceedings of the Fifth International Conference on Science and Management of Protected Areas, Science and Management of Protected Areas Association, Wolfville, Nova Scotia. http://www.sampaa.org/publications/conference-proceedings-1991-2000/2003-proceedings/economic-analysis-protectedareas/Bowman%20and%20Eagles%202004.pdf/view [link inactive]
Boyd, J., and S. Banzhaf. 2007. What are ecosystem services? The need for standardized environmental accounting units. Ecological Economics 63: 616-626.
Boyd, J. and L. Wainger. 2003. Measuring ecosystem service benefits: The use of landscape analysis to evaluate environmental trades and compensation. Discussion Paper 02-63, Resources for the Future: Washington, DC.
Brunsdon, C. and Willis, K., (2002), Meta-Analysis: A Bayesian Perspective Comparative Environmental Economic Assessment, Editors: Florax, R., Nijkamp, P. and Willis, K., Edward Elgar Publishing.
Bullock, S.D. and S.R. Lawson. 2008. Managing the “commons” on Cadillac Mountain: A stated choice analysis of Acadia National Park visitors’ preferences. Leisure Sciences 30 (1): 71-86
Chambers, J. Q., J. I. Fisher, H. C. Zeng, E. L. Chapman, D. B. Baker, and G. C. Hurtt. 2007. Hurricane Katrina’s carbon footprint on U. S. Gulf Coast forests. Science 318:1107-1107.
Chan, K.M.A., M.R. Shaw, D.R. Cameron, E.C. Underwood, and G.C. Daily. 2006. Conservation planning for ecosystem services. PLOS Biology 4 (11): 2138-2152.
Chen, N., H. Li, and L. Wang. 2009. A GIS-based approach for mapping direct use of ecosystem services at the county scale: Management implications. Ecological Economics 68 (11): 2768-2776.
Chhetri, P. and C. Arrowsmith. 2003. Mapping the potential of scenic views for the Grapmians National Park. In: Proceedings of the 21st International Cartographic Conference, Durban, South Africa, 10-16 August 2003.
Costanza, R., R. d“Arge, R. deGroot, S. Farber, M. Grasso, b. Hannon, K. Limburg, S. Naeem, R. V. O”Neill, J. Paruelo, R. G. Raskin, P. Sutton, and M. van den Belt. 1997. The Value of the World’s Ecosystem Services and Natural Capital. Nature 387:253-260.
Costanza, R., W.J. Mitsch, and J.W. Day, Jr. 2006. A new vision for New Orleans and the Mississippi delta: Applying ecological economics and ecological engineering. Frontiers in Ecology and the Environment 4 (9): 465-472.
Day, J.W., Jr., D.F. Boesch, E.J. Clairain, G.P. Kemp, S.B. Laska, W.J. Mitsch, K. Orth, H. Mashriqui, D.J. Reed, L. Shabman, C.A. Simenstad, B.J. Streever, R.R. Twilley, C.C. Watson, J.T. Wells, and D.F. Whigham. 2007. Restoration of the Mississippi Delta: Lessons from Hurricanes Katrina and Rita. Science 315: 1679-1684.
Daily, G. C., S. Polasky, J. Goldstein, P. M. Kareiva, H. A. Mooney, L. Pejchar, T. H. Ricketts, J. Salzman, and R. Shallenberger. 2009. Ecosystem services in decision making: time to deliver. Frontiers in Ecology and the Environment 7:21-28.
Desvousges, W. H., F. R. Johnson, et al. 1998. Environmental policy analysis with limited information: principles and application of the transfer method., Edward Elgar
Eade, J.D.O. and D. Moran. 1996. Spatial economic valuation: Benefits transfer using geographical information systems. Journal of Environmental Management 48: 97-110.
Echavarria, M. 2002. Financing watershed conservation: The FONAG water fund in Quito, Ecuador. Pp. 91-101 in: Pagiola, S., J. Bishop, and N. Landell-Mills, eds. Selling forest environmental services: Market-based mechanisms for conservation and development. Earthscan: London.
Egoh, B, B. Reyers, M. Rouget, D.M. Richardson, D.C. Le Maitre, and A.S. van Jaarsveld. 2008. Mapping ecosystem services for planning and management. Agriculture, Ecosystems and Environment 127: 135-140.
Farber, S., R. Costanza, D. Childers, J. Erickson, K. Gross, M. Grove, C. Hopkinson, J. Kahn, S. Pincetl, A. Troy, P. Warren, and M. Wilson. 2006. Linking ecology and economics for ecosystem management. Bioscience 56:121-133.
Fisher, B., K. Turner, M. Zylstra, R. Brouwer, R. de Groot, S. Farber, P. Ferraro, R. Green, D. Hadley, J. Harlow, P. Jefferiss, C. Kirkby, P. Morling, S. Mowatt, R. Naidoo, J. Paavola, B. Strassburg, D. Yu, and A. Balmford. 2008. Ecosystem services and economic theory: Integration for policy-relevant research. Ecological Applications 18 (8): 2050-2067.
Fraser, R.H., 1999, SEDMOD: a GIS-based delivery model for diffuse source pollutants: New Haven, Conn., Yale University, Ph.D. dissertation, p. 76-99.
Gaston, G., S. Brown, M. Lorenzini, and K.D. Singh. 1998. State and change in carbon pools in the forests of tropical Africa. Global Change Biology 4: 97-114.
Gately, M. 2008. Dynamic modeling to inform environmental management: Applications in energy resources and ecosystem services. MS Thesis, University of Vermont, Burlington, VT.
Grêt-Regamey, A., P. Bebi, I.D. Bishop, and W.A. Schmid. 2008. Linking GIS-based models to value ecosystem services in an Alpine region. Journal of Environmental Management 89: 197-208.
Goldman, R.L. 2009. Ecosystem services and water funds: Conservation approaches that benefit people and biodiversity. Journal of the American Water Works Association 101 (12): 20-22.
Harper, G.J., M.K. Steininger, C.J. Tucker, D. Juhn, and F. Hawkins. 2007. Fifty years of deforestation and forest fragmentation in Madagascar. Environmental Conservation 34 (4): 325-333.
Hunt, L.M., W. Haider, and B. Bottan. 2005. Accounting for varying setting preference among moose hunters. Leisure Sciences 27 (4): 297-314.
Hunt, L.M. 2008. Examining state dependence and place attachment within a recreational fishing site choice model. Journal of Leisure Research 40 (1): 110-127.
Hunziker, M. and F. Kienast. 1999. Potential impacts of changing agricultural activities on scenic beauty – a prototypical technique for automated rapid assessment. Landscape Ecology 14: 161-176.
IDIAF. 2006. Diagnóstico y Plan de la Caficultura Dominicana. Instituto Dominicano de Investigaciones Agropecuarias y Forestales. CODOCAFE. Consejo Dominicano del Café, Dominican Republic.
Iverson, L.R., S. Brown, A. Prasad, H. Mitasova, A.J.R. Gillespie, and A.E. Lugo. 1994. Use of GIS for estimating potential and actual biomass for continental South and Southeast Asia. Pp. 67-116 in: Dale, V, ed. Effects of land use change on atmospheric CO2 concentrations: Southeast Asia as a case study. Springer Verlag: New York.
Johnson, G., K.J. Bagstad, R.R. Snapp, and F. Villa. 2010. Service Path Attribute Networks (SPANs): Spatially quantifying the flow of ecosystem services from landscapes to people. Lecture Notes in Computer Science 6016: 238-253.
Kaiser, B., and J. Roumasset. 2002. Valuing indirect ecosystem services: the case of tropical watersheds. Environment and Development Economics 7:701-714.
Lal, R. 2004. Soil carbon sequestration impacts on global climate change and food security. Science 304 (5677): 1623-1627.
Lawson, S.R. and R.E. Manning. 2002. Tradeoffs among social, resource, and management attributes of the Denali Wilderness Experience: A contextual approach to normative research. Leisure Sciences 24 (3): 297-312.
Leon-Gonzalez, R., and R. Scarpa. 2008. Improving multi-site benefit functions via Bayesian model averaging: A new approach to benefit transfer. Journal of Environmental Economics and Management 56:50-68.
Loomis, J. B. (1992). “The Evolution of a More Rigorous Approach to Benefit Transfer – Benefit Function Transfer.” Water Resources Research 28(3): 701-705
Marcot, B. G., J. D. Steventon, G. D. Sutherland, and R. K. McCann. 2006. Guidelines for developing and updating Bayesian belief networks applied to ecological modeling and conservation. Canadian Journal of Forest Research-Revue Canadienne De Recherche Forestiere 36:3063-3074.
McCann, R. K., B. G. Marcot, and R. Ellis. 2006. Bayesian belief networks: applications in ecology and natural resource management. Canadian Journal of Forest Research-Revue Canadienne De Recherche Forestiere 36:3053-3062.
Millennium Ecosystem Assessment (MA). 2005. Millennium Ecosystem Assessment: Living beyond our means – Natural assets and human well-being. Washington, D.C.: World Resources Institute.
Millennium Ecosystem Assessment. 2003. Ecosystems and Human Well-Being: A Framework for Assessment. Island Press, Washington DC.
Moeltner, K., K. J. Boyle, and R. W. Paterson. 2007. Meta-analysis and benefit transfer for resource valuation-addressing classical challenges with Bayesian modeling. Journal of Environmental Economics and Management 53:250-269.
Moeltner, K., and R. S. Rosenberger. 2008. Predicting resource policy outcomes via meta-regression: Data space, model space, and the quest for “optimal scope”. B E Journal of Economic Analysis & Policy 8.
Moeltner, K., and R. Woodward. 2009. Meta-Functional Benefit Transfer for Wetland Valuation: Making the Most of Small Samples. Environmental & Resource Economics 42:89-108.
Munoz-Pina, C., A. Guevara, J.M. Torres, and J. Brana. 2008. Paying for the hydrolocial services of Mexico’s forests: Analysis, negotiations, and results. Ecological Economics 65: 725-736.
Naidoo, R. and T.H. Ricketts. 2006. Mapping the economic costs and benefits of conservation. PLOS Biology 4 (11): 2153-2164.
Naughton-Treves, L., M. B. Holland, and K. Brandon. 2005. The role of protected areas in conserving biodiversity and sustaining local livelihoods. Annual Review of Environment and Resources 30:219-252.
Nordhaus, W.D. 2010. Economic aspects of global warming in a post-Copenhagen environment. Proceedings of the National Academy of Sciences 107 (26): 11721-11726.
Olewiler, N. 2004. The Value of Natural Capital in Settled Areas of Canada. A Report for Ducks Unlimited and the Nature Conservancy of Canada.
Palmer, J.F. 2008. Perceived effects of clearcutting in the White Mountains of New Hampshire, USA. Journal of Environmental Management 89 (3): 167-183.
Parry, M.L., O. Canziani, and J. Palutikof. 2007. Technical Summary. Climate Change 2007: Impacts, Adaptation and Vulnerability. Contribution of Working Group II to the Fourth Assessment Report of the Intergovernmental Panel on Climate Change, Parry, M.L., et al., Eds. Cambridge University Press: Cambridge, UK.
Pearl, J. 1988. Probabilistic reasoning in intelligent systems: Networks of plausible inference. Morgan-Kaufmann: San Francisco.
Pires, M. 2004. Watershed protection for a world city: the case of New York. Land Use Policy 21(2): 161-175.
Portela, R., K.J. Wendland, and L.L. Pennypacker. 2008. The idea of market-based mechanisms for forest conservation and climate change. Pp. 11-29 in: Streck, C., et al., eds. Climate change and forests: Emerging policy and market opportunities. Brookings Institution Press: Washington, DC.
Pozzi, F. and C. Small (2001). Exploratory Analysis of Suburban Land Cover and Population Density in the U.S.A. In Proceedings of the IEEE/ISPRS Joint Workshop on Remote Sensing and Data Fusion over Urban Areas, 8-9 November 2001, Rome, Italy, pp. 250-254.
Raudsepp-Hearne, C., G.D. Peterson, and E.M. Bennett. 2010. Ecosystem service bundles for analyzing tradeoffs in diverse landscapes. Proceedings of the National Academy of Sciences 107 (11): 5242-5247.
Renard K.G., G.R. Foster, G.A. Weesies, D.K. McCool, and D.C. Yoder. 1996. Predicting Soil Erosion by Water: A Guide to Conservation Planning with the Revised Universal Soil Loss Equation (RUSLE). Handbook 703, US Department of Agriculture, 404 pp.
Ricketts, T. H., G. C. Daily, P. R. Ehrlich, and C. D. Michener. 2004. Economic value of tropical forest to coffee production. Proceedings of the National Academy of Sciences of the United States of America 101:12579-12582.
Ruhl, J.B., S.E. Kraft, and C.L. Lant. 2007. The law and policy of ecosystem services. Island Press: Washington, DC.
Schröter, D., W. Cramer, R. Leemans, I.C. Prentice, M.B. Araújo, N.W. Arnell, A. Bondeau, H. Bugmann, T.R. Carter, C.A. Gracia, A.C. de la Vega-Leinert, M. Erhard, F. Ewert, M. Glendining, J.I. House, J, S. Kankaanpää, R.J.T. Klein, S. Lavorel, M. Lindner, M.J. Metzger, J. Meyer, T.D. Mitchell, I. Reginster, M. Rounsevell, S. Sabaté, S. Sitch, B. Smith, J. Smith, P. Smith, M.T. Sykes, K. Thonicke, W. Thuiller, G. Tuck, S. Zaehle, and B. Zierl. 2005. Ecosystem service supply and vulnerability to global change in Europe. Science 310: 1333-1337
Sedell, J., M. Sharpe, D. Dravnieks, M. Copenhagen, and M. Furniss. 2000. Water and the Forest Service. USDA Forest Service, Policy Analysis, FS-660. http://www.fs.fed.us/publications/policy-analysis/water.pdf.
Soil Conservation Service (SCS). 1972. National Engineering Handbook, Section 4, Hydrology. SCS: Washington, DC.
“Spectranalysis Inc. 2004. Introduction to the Ontario Land Cover Data Base, Second Edition (2000): Outline of Production Methodology and Description of 27 Land Cover Classes. Report to Ontario Ministry of Natural Resources. Unpublished”
Stern, N. 2006. Part II: Impacts of climate change on growth and development. In: Stern, N. Stern Review: The economics of climate change. Cambridge University Press: Cambridge, UK.
Stevens, T. H., Echeverria, J., Glass, J., Hager, T and More, T. 1991. Measuring the existence value of wildlife: What do CVM estimates really show? Land Economics 67: 390-400.
Tallis, H.T., T. Ricketts, A.D. Guerry, E. Nelson, D. Ennaanay, S. Wolny, N. Olwero, K. Vigerstol, D. Pennington, G. Mendoza, J. Aukema, J. Foster, J. Forrest, D. Cameron, E. Lonsdorf, C. Kennedy, G. Verutes, C.K. Kim, G. Guannel, M. Papenfus, J. Toft, M. Marsik, and J. Bernhardt. 2011. Invest 2.0 beta User’s Guide. The Natural Capital Project: Stanford.
Tallis, H., P. Kareiva, M. Marvier, and A. Chang. 2008. An ecosystem services framework to support both practical conservation and economic development. Proceedings of the National Academy of Sciences 105 (28): 9457-9464.
Tilman, D., J. Hill, and C. Lehman. 2006. Carbon-negative biofuels from low-input high diversity grassland biomass. Science 314 (5805): 1598-1600.
Tol, R. S. J. 2008. The Social Cost of Carbon: Trends, Outliers and Catastrophes. Economics: the Open-Access, Open-Assessment E Journal 2:1-24.
Tol, R. S. J. 2011. The Social Cost of Carbon. Annual Review of Resource Economics, Vol 3 3:419-443.
Troy, A. and K. Bagstad (2009). Estimating Ecosystem Service in Southern Ontario. Peterborough, ON, Ministry of Natural Resources.
Troy, A. and M. A. Wilson (2006). “Mapping ecosystem services: Practical challenges and opportunities in linking GIS and value transfer.” Ecological Economics 60(2): 435-449
U.S. Forest Service (USFS). 1995. Landscape aesthetics: A handbook for scenery management. USDA-Forest Service Agriculture Handbook Number 701.
Villa, F., M. Ceroni, and S. Krivov. 2007. Intelligent databases assist transparent and sound economic valuation of ecosystem services. Environmental management 39:887-899.
Villa, F., M. Ceroni, K. Bagstad, G. Johnson, and S. Krivov. 2009. ARIES (Artificial Intelligence for Ecosystem Services): A new tool for ecosystem services assessment, planning, and valuation. Proceedings of the 11th Annual BIOECON Conference on Economic Instruments to Enhance the Conservation and Sustainable Use of Biodiversity, Venice, Italy, September, 2009. http://www.ucl.ac.UK/bioecon/11th_2009/Villa.pdf.
Wendland, K.J., M. Honzak, R. Portela, B. Vitale, S. Rubinoff, and J. Randrianarisoa. 2010. Targeting and implementing payments for ecosystem services: Opportunities for bundling biodiversity conservation with carbon and water services in Madagascar. Ecological Economics 69: 2093-2107.
Wilson, M. A., and S. R. Carpenter. 1999. Economic Valuation of Freshwater Ecosystem Services in the United States 1971-1997. Ecological Applications 9:772-783.
Wilson, M., A. Troy, and R. Costanza. 2004. The Economic Geography of Ecosystem Goods and Services: Revealing the monetary value of landscapes through transfer methods and Geographic Information Systems. Pages 69–94 in M. Dietrich, and V. D. Straaten, editors. Cultural Landscapes and Land Use. Kluwer Academic.
Wilson, S.J. 2008. Ontario’s Wealth, Canada’s Future: Appreciating the Value of the Greenbelt’s Ecosystem Services. A report to the David Suzuki Foundation.
Wischmeier, W.H. and D. Smith. 1978. Predicting rainfall erosion losses: a guide to conservation planning. USDA-ARS Agriculture Handbook. Washington DC.
Wundscher, T., S. Engel, and S. Wunder. 2008. Spatial targeting of payments for environmental services: A tool for boosting conservation benefits. Ecological Economics 65: 822-833.
Yang, D., S. Kanae, T. Oki, T. Koike, and K. Musiake. 2003. Global potential soil erosion with reference to land use and climate changes. Hydrological Processes 17: 2913-2928.
Zube, E.H., R.O. Brush, and J.G. Fabos (eds.). 1975. Landscape Assessment. Community Development Series 11: Halsted Press, United States.
7. Appendices
Appendix 1. GIS methods for Value Transfer data development
Appendix 2. Value Transfer detailed list of valuations by ecosystem service, land cover, and study
Appendix 3. Bibliography for Value Transfer
Appendix 4. ARIES technical overview
Appendix 5. GIS methods for ARIES data development
Appendix 6. Additional map outputs for the ARIES Recreational Viewshed Models
Appendix 2. Value transfer detailed list of valuations by ecosystem service, land cover, and study
All figures in 2011 CAD
Wednesday, June 5, 2013
11:04:24 a.m.
| Land cover class name |
Ecoservice | Year | Author | Min est | Max est | Single est | Average | Units |
|---|---|---|---|---|---|---|---|---|
| Agriculture | Gas regulation | 2008 | Wilson, S.J. | 32.36 | 32.36 | |||
| Agriculture | Gas regulation - total | 32.36 | per hectare per year |
|||||
| Agriculture | Recreation | 2007 | Knoche, S. and Lupi, F. | 180.66 | 180.66 | |||
| Agriculture | Recreation - total | 180.66 | per hectare per year |
|||||
| Agriculture | Other cultural | 2004 | Olewiler, N. | 9.13 | 36.54 | 22.84 | ||
| Agriculture | Other cultural | 1999 | Alvarez-Farizo, B., Hanley, N., Wright, R. E. and MacMillan, D. | 17.80 | 17.80 | |||
| Agriculture | Other cultural | 1994 | Bowker, J.M. and Didychuk, D.D. | 34.07 | 110.71 | 72.39 | ||
| Agriculture | Other cultural | 1988 | Turner, M. G., Odum, E. P., Costanza, R. and Springer, T. M. | 279.11 | 279.11 | |||
| Agriculture | Other cultural | 1985 | Bergstrom, J., Dillman, B. L. and Stoll, J. R. | 86.07 | 86.07 | |||
| Agriculture | Other cultural -total | 9.13 | 110.71 | 95.64 | per hectare per year |
|||
| Agriculture | Pollinations and seeding | 1992 | Southwick, E. E. and Southwick, L. | 8.28 | 29.51 | 18.90 | ||
| Agriculture | Pollinations and seeding | 1989 | Robinson, W. S., Nowogrodzki, R. and Morse, R. A. | 36.29 | 36.29 | |||
| Agriculture | Pollinations and seeding - total | 8.28 | 29.51 | 27.59 | per hectare per year |
|||
| Agriculture | Grand total | 8.28 | 110.71 | 336.25 | per hectare per year |
|||
| Beach near structure note: beach categories not used in spatial analysis in this study | Disturbance regulation | 2001 | Parsons, G. R. and Powell, M. | 33,670.27 | 33,670.27 | |||
| Beach near structure note: beach categories not used in spatial analysis in this study | Disturbance regulation | 1995 | Pompe, J. J. and Rinehart, J. R. | 11,128.70 | 68,019.50 | 39,574.10 | ||
| Beach near structure note: beach categories not used in spatial analysis in this study | Disturbance regulation-total | 11,128.70 | 68,019.50 | 36,622.19 | per hectare per year |
|||
| Beach near structure note: beach categories not used in spatial analysis in this study | Recreation | 2008 | Wilson, S.J. | 139.49 | 139.49 | |||
| Beach near structure note: beach categories not used in spatial analysis in this study | Recreation | 2004 | Nunes, P. and Van den Bergh, J. | 2,783.22 | 4,033.65 | 3,408.44 | ||
| Beach near structure note: beach categories not used in spatial analysis in this study | Recreation | 2003 | Hanley, N., Bell, D. and Alvarez-Farizo, B. | 46,312.16 | 46,312.16 | |||
| Beach near structure note: beach categories not used in spatial analysis in this study | Recreation | 1998 | Kline, J. D. and Swallow, S. K. | 124,055.49 | 154,484.80 | 139,270.14 | ||
| Beach near structure note: beach categories not used in spatial analysis in this study | Recreation | 1992 | Silberman, J., Gerlowski, D. A. and Williams, N. A. | 87,193.99 | 87,193.99 | |||
| Beach near structure note: beach categories not used in spatial analysis in this study | Recreation | 1990 | Ecologistics | 166,413.75 | 166,413.75 | |||
| Beach near structure note: beach categories not used in spatial analysis in this study | Recreation-total | 2,783.22 | 154,484.80 | 73,789.66 | per hectare per year |
|||
| Beach near structure note: beach categories not used in spatial analysis in this study | Aesthetic and amenity | 2000 | Taylor, L. O. and Smith, V. K. | 78.51 | 201.21 | 139.86 | ||
| Beach near structure note: beach categories not used in spatial analysis in this study | Aesthetic and amenity | 2000 | Taylor, L. O. and Smith, V. K. | 1,308.42 | 3,353.47 | 2,330.94 | ||
| Beach near structure note: beach categories not used in spatial analysis in this study | Aesthetic and amenity | 1995 | Pompe, J. J. and Rinehart, J. R. | 5,801.66 | 11,692.33 | 8,746.99 | ||
| Beach near structure note: beach categories not used in spatial analysis in this study | Aesthetic and amenity | 1991 | Edwards, S. F. and Gable, F. J. | 405,748.22 | 405,748.22 | |||
| Beach near structure note: beach categories not used in spatial analysis in this study | Aesthetic and amenity-total | 78.51 | 11,692.33 | 104,241.50 | per hectare per year |
|||
| Beach near structure note: beach categories not used in spatial analysis in this study | Grand total | 78.51 | 154,484.80 | 214,653.35 | per hectare per year |
|||
| Beach not near structure | Recreation | 2008 | Wilson, S.J. | 139.49 | 139.49 | |||
| Beach not near structure | Recreation | 2004 | Nunes, P. and Van den Bergh, J. | 2,783.22 | 4,033.65 | 3,408.44 | ||
| Beach not near structure | Recreation | 2003 | Hanley, N., Bell, D. and Alvarez-Farizo, B. | 46,312.16 | 46,312.16 | |||
| Beach not near structure | Recreation | 1998 | Kline, J. D. and Swallow, S. K. | 124,055.49 | 154,484.80 | 139,270.14 | ||
| Beach not near structure | Recreation | 1992 | Silberman, J., Gerlowski, D. A. and Williams, N. A. | 87,193.99 | 87,193.99 | |||
| Beach not near structure | Recreation - total | 2,783.22 | 154,484.80 | 55,264.84 | per hectare per year |
|||
| Beach not near structure | Grand total | 2,783.22 | 154,484.80 | 55,264.84 | per hectare per year |
|||
| Forest: adjacent to stream | Gas regulation | 2008 | Tol, Richard | 162.20 | 162.20 | |||
| Forest: adjacent to stream | Gas regulation-total | 162.20 | per hectare per year |
|||||
| Forest: adjacent to stream | Disturbance regulation | 1999 | Rein, F. A. | 66.03 | 301.84 | 183.93 | ||
| Forest: adjacent to stream | Disturbance regulation - total | 66.03 | 301.84 | 183.93 | per hectare per year |
|||
| Forest: adjacent to stream | Soil regulation | 1999 | Rein, F. A. | 358.44 | 1,575.23 | 966.83 | ||
| Forest: adjacent to stream | Soil regulation - total | 358.44 | 1,575.23 | 966.83 | per hectare per year |
|||
| Forest: adjacent to stream | Nutrient regulation | |||||||
| Forest: adjacent to stream | Nutrient regulation | 2008 | Wilson, S.J. | 528.93 | 528.93 | |||
| Forest: adjacent to stream | Nutrient regulation - total | 528.93 | per hectare per year |
|||||
| Forest: adjacent to stream | Water supply | 2008 | Wilson, S.J. | 1,699.50 | 1,699.50 | |||
| Forest: adjacent to stream | Water supply | 1999 | Rein, F. A. | 457.48 | 2,004.41 | 1,230.94 | ||
| Forest: adjacent to stream | Water supply -total | 457.48 | 2,004.41 | 1,465.22 | per hectare per year |
|||
| Forest: adjacent to stream | Recreation | 1999 | Rein, F. A. | 259.39 | 1,127.18 | 693.29 | ||
| Forest: adjacent to stream | Recreation - total | 259.39 | 1,127.18 | 693.29 | per hectare per year |
|||
| Forest: adjacent to stream | Habitat refugium | 2002 | Amigues, J. P., Boulatoff, C., Desaigues, B., Gauthier, C. and Keith, J. E. | 47.53 | 47.53 | |||
| Forest: adjacent to stream | Habitat refugium | 2002 | Amigues, J. P., Boulatoff, C., Desaigues, B., Gauthier, C. and Keith, J. E. | 56.67 | 1,327.12 | 208.39 | 208.39 | |
| Forest: adjacent to stream | Habitat refugium | 2001 | Kenyon, W. and Nevin, C. | 1,913.87 | 1,913.87 | |||
| Forest: adjacent to stream | Habitat refugium | 1989 | Willis, K. G. and Benson, J. F. | 152.21 | 263.38 | 207.79 | ||
| Forest: adjacent to stream | Habitat refugium - total | 56.67 | 1,327.12 | 594.40 | per hectare per year |
|||
| Forest: adjacent to stream | Grand total | 56.67 | 2,004.41 | 4,594.80 | per hectare per year |
|||
| Forest: non-urban | Gas regulation | |||||||
| Forest: non-urban | Gas regulation | 2008 | Tol, Richard | 162.20 | 162.20 | |||
| Forest: non-urban | Gas regulation - total | 162.20 | per hectare per year |
|||||
| Forest: non-urban | Nutrient regulation | |||||||
| Forest: non-urban | Nutrient regulation | 2008 | Wilson, S.J. | 528.93 | 528.93 | |||
| Forest: non-urban | Nutrient regulation –tota; | 528.93 | per hectare per year |
|||||
| Forest: non-urban | Recreation | 2008 | Wilson, S.J. | 373.82 | 373.82 | |||
| Forest: non-urban | Recreation | 2000 | Haener, M. K. and Adamowicz, W. L. | 4.75 | 4.75 | |||
| Forest: non-urban | Recreation | 2000 | Scarpa, R., Chilton, S. M., Hutchinson, W. G. and Buongiorno, J. | 11.71 | 11.71 | |||
| Forest: non-urban | Recreation | 1999 | van Kooten, G.C. and Bulte, E.H. | 137.98 | 137.98 | |||
| Forest: non-urban | Recreation | 1993 | Shafer, E. L., Carline, R., Guldin, R. W. and Cordell, H. K. | 8.10 | 8.10 | |||
| Forest: non-urban | Recreation | 1991 | Willis, K. G. | 209.42 | 359.00 | 284.21 | ||
| Forest: non-urban | Recreation | 1991 | Willis, K. G. | 86.01 | 157.06 | 121.54 | ||
| Forest: non-urban | Recreation | 1991 | Willis, K. G. | 48.62 | 52.35 | 50.49 | ||
| Forest: non-urban | Recreation | 1991 | Willis, K. G. | 916.21 | 1,679.10 | 1,297.65 | ||
| Forest: non-urban | Recreation | 1991 | Willis, K. G. | 3.74 | 14.96 | 9.35 | ||
| Forest: non-urban | Recreation | 1991 | Willis, K. G. and Garrod, G. D. | 34.54 | 34.54 | |||
| Forest: non-urban | Recreation | 1989 | Prince, R. and Ahmed, E. | 3.09 | 3.97 | 3.53 | ||
| Forest: non-urban | Recreation – total | 3.09 | 1,679.10 | 194.81 | per hectare per year |
|||
| Forest: non-urban | Habitat refugium | 2000 | Haener, M. K. and Adamowicz, W. L. | 115.24 | 115.24 | |||
| Forest: non-urban | Habitat refugium | 1998 | Haener, M.K. and Adamowicz, W.L. | 154.80 | 271.36 | 213.08 | ||
| Forest: non-urban | Habitat refugium-total | 154.80 | 271.36 | 164.16 | per hectare per year |
|||
| Forest: non-urban | Other cultural | 2008 | Sverrisson, D., Boxall, P. and Adamowicz, V. | 44.82 | 97.91 | 71.36 | ||
| Forest: non-urban | Other cultural | 1996 | Loewen, K.G. and Kulshreshtha, S.N. | 6.60 | 6.60 | |||
| Forest: non-urban | Other cultural | 1988 | Turner, M. G., Odum, E. P., Costanza, R. and Springer, T. M. | 59.04 | 59.04 | |||
| Forest: non-urban | Other cultural | 1988 | Turner, M. G., Odum, E. P., Costanza, R. and Springer, T. M. | 450.88 | 450.88 | |||
| Forest: non-urban | Other cultural | 1988 | Turner, M. G., Odum, E. P., Costanza, R. and Springer, T. M. | 622.64 | 622.64 | |||
| Forest: non-urban | Other cultural-total | 44.82 | 97.91 | 242.10 | per hectare per year |
|||
| Forest: non-urban | Grand total | 3.09 | 1,679.10 | 1,292.20 | per hectare per year |
|||
| Forest: suburban | Gas regulation | 2008 | Tol, Richard | 162.20 | 162.20 | |||
| Forest: suburban | Gas regulation -total | 162.20 | per hectare per year |
|||||
| Forest: suburban | Nutrient regulation | 2008 | Wilson, S.J. | 528.93 | 528.93 | |||
| Forest: suburban | Nutrient regulation -total | 528.93 | per hectare per year |
|||||
| Forest: suburban | Water supply | 2008 | Wilson, S.J. | 1,699.50 | 1,699.50 | |||
| Forest: suburban | Water supply-total | 1,699.50 | per hectare per year |
|||||
| Forest: suburban | Recreation | 1996 | Bateman, I. J., Diamand, E., Langford, I. H. and Jones, A. | 3,448.86 | 3,448.86 | |||
| Forest: suburban | Recreation | 1996 | Bateman, I. J., Diamand, E., Langford, I. H. and Jones, A. | 1,937.56 | 1,937.56 | |||
| Forest: suburban | Recreation | 1994 | Maxwell, S. | 62.47 | 124.07 | 93.27 | ||
| Forest: suburban | Recreation-total | 62.47 | 124.07 | 1,826.56 | per hectare per year |
|||
| Forest: suburban | Aesthetic and amenity | 2003 | Kwak, S. J., Yoo, S. H. and Han, S. Y. | 1,626.90 | 5,848.47 | 3,737.69 | ||
| Forest: suburban | Aesthetic and amenity-total | 1,626.90 | 5,848.47 | 3,737.69 | per hectare per year |
|||
| Forest: suburban | Other cultural | 1988 | Turner, M. G., Odum, E. P., Costanza, R. and Springer, T. M. | 252.28 | 252.28 | |||
| Forest: suburban | Other cultural-total | 252.28 | per hectare per year |
|||||
| Forest: suburban | Grand total | 62.47 | 5,848.47 | 8,207.15 | per hectare per year |
|||
| Forest: urban | Gas regulation | 2008 | Tol, Richard | 162.20 | 162.20 | |||
| Forest: urban | Gas regulation-total | 162.20 | per hectare per year |
|||||
| Forest: urban | Nutrient regulation | 2008 | Wilson, S.J. | 528.93 | 528.93 | |||
| Forest: urban | Nutrient regulation-total | 528.93 | per hectare per year |
|||||
| Forest: urban | Water supply | 2008 | Wilson, S.J. | 1,699.50 | 1,699.50 | |||
| Forest: urban | Water supply-total | 1,699.50 | per hectare per year |
|||||
| Forest: urban | Recreation | 2001 | Tyrvainen, L. | 6,766.76 | 6,766.76 | |||
| Forest: urban | Recreation | 2001 | Tyrvainen, L. | 66,735.21 | 66,735.21 | |||
| Forest: urban | Recreation | 2001 | Tyrvainen, L. | 7,612.74 | 7,612.74 | |||
| Forest: urban | Recreation | 2001 | Tyrvainen, L. | 4,581.64 | 4,581.64 | |||
| Forest: urban | Recreation | 2001 | Tyrvainen, L. | 18,070.02 | 18,070.02 | |||
| Forest: urban | Recreation | 2001 | Tyrvainen, L. | 13,431.67 | 13,431.67 | |||
| Forest: urban | Recreation | 1995 | Bennett, R., Tranter, R., Beard, | 1,221.01 | 1,221.01 | |||
| Forest: urban | Recreation | N. and Jones, P. | ||||||
| Forest: urban | Recreation | 16,917.01 | per hectare per year |
|||||
| Forest: urban | Aesthetic and amenity | 2003 | Kwak, S. J., Yoo, S. H. and Han, S. Y. | 1,626.90 | 5,848.47 | 3,737.69 | ||
| Forest: urban | Aesthetic and amenity-total | 1,626.90 | 5,848.47 | 3,737.69 | per hectare per year |
|||
| Forest: urban | Other cultural | 1988 | Turner, M. G., Odum, E. P., Costanza, R. and Springer, T. M. | 252.28 | 252.28 | |||
| Forest: urban | Other cultural-total | 252.28 | per hectare per year |
|||||
| Forest: urban | Pollinations and seeding | |||||||
| Forest: urban | ||||||||
| Forest: urban | Pollinations and seeding | 2006 | Hougner, C., Colding, J., and Soderqvist, T. | 2,837.81 | 12,702.60 | 7,770.21 | ||
| Forest: urban | Pollinations and seeding-total | 2,837.81 | 12,702.60 | 7,770.21 | per hectare per year |
|||
| Forest: urban | Grand total | 1,626.90 | 12,702.60 | 31,067.81 | per hectare per year |
|||
| Fresh wetland: Great Lakes coast | Gas regulation | 2008 | Wilson, S.J. | 14.51 | 14.51 | |||
| Fresh wetland: Great Lakes coast | Gas regulation-total | 14.51 | per hectare per year |
|||||
| Fresh wetland: Great Lakes coast | Nutrient regulation | 2008 | Wilson, S.J. | 1,662.67 | 5,070.59 | 3,366.63 | ||
| Fresh wetland: Great Lakes coast | Nutrient regulation | 2004 | Brauer, I. | 37.04 | 37.04 | |||
| Fresh wetland: Great Lakes coast | Nutrient regulation | 2000 | Bystrom, O | 5,526.34 | 11,877.06 | 7,187.30 | 7,187.30 | |
| Fresh wetland: Great Lakes coast | Nutrient regulation | 1993 | Gren, I. M. | 52.39 | 52.39 | |||
| Fresh wetland: Great Lakes coast | Nutrient regulation | 1990 | Lant, C. L. and Roberts, R. S. | 71.58 | 89.75 | 80.67 | ||
| Fresh wetland: Great Lakes coast | Nutrient regulation | 1989 | Lant, C. L. and Tobin, G. | 1,939.84 | 1,939.84 | |||
| Fresh wetland: Great Lakes coast | Nutrient regulation-total | 71.58 | 11,877.06 | 2,110.64 | per hectare per year |
|||
| Fresh wetland: Great Lakes coast | Recreation | 1981 | Kreutzwiser, R. | 543.23 | 543.23 | |||
| Fresh wetland: Great Lakes coast | Recreation | 1981 | Kreutzwiser, R. | 573.86 | 573.86 | |||
| Fresh wetland: Great Lakes coast | Recreation-total | 558.55 | per hectare per year |
|||||
| Fresh wetland: Great Lakes coast | Aesthetic and amenity | 2000 | Bishop, R.C., Breffle,W.S., Lazo, J.K., Rowe, R.D., and Wytinck, S.M. | 736.23 | 6,994.19 | 3,808.58 | 3,808.58 | |
| Fresh wetland: Great Lakes coast | Aesthetic and amenity | 2000 | Bishop, R.C., Breffle,W.S., Lazo, J.K., Rowe, R.D., and Wytinck, S.M. | 1,519.66 | 5,408.47 | 3,478.22 | 3,478.22 | |
| Fresh wetland: Great Lakes coast | Aesthetic and amenity | 2000 | Bishop, R.C., Breffle,W.S., Lazo, J.K., Rowe, R.D., and Wytinck, S.M. | 1,312.00 | 3,029.87 | 2,128.46 | 2,128.46 | |
| Fresh wetland: Great Lakes coast | Aesthetic and amenity | 1991 | Rivas, V. and Cendrero, A. | 32,922.96 | 32,922.96 | |||
| Fresh wetland: Great Lakes coast | Aesthetic and amenity-total | 736.23 | 6,994.19 | 10,584.56 | per hectare per year |
|||
| Fresh wetland: Great Lakes coast | ||||||||
| Fresh wetland: Great Lakes coast | Other cultural | 1996 | Randall, A. and de Zoysa, D. | 249.53 | 19,722.45 | 9,985.99 | ||
| Fresh wetland: Great Lakes coast | Other cultural-total | 249.53 | 19,722.45 | 9,985.99 | per hectare per year |
|||
| Fresh wetland: Great Lakes coast | Grand total | 71.58 | 19,722.45 | 23,254.24 | per hectare per year |
|||
| Fresh wetland: urban/suburban | Gas regulation | 2008 | Wilson, S.J. | 14.51 | 14.51 | |||
| Fresh wetland: urban/suburban | Gas regulation-total | 14.51 | per hectare per year |
|||||
| Fresh wetland: urban/suburban | Disturbance regulation | 1997 | Leschine, T.M., Wellman, K.F., and Green, T.H. | 2,856.46 | 4,286.96 | 3,571.71 | ||
| Fresh wetland: urban/suburban | Disturbance regulation | 1997 | Leschine, T.M., Wellman, K.F., and Green, T.H. | 15,074.51 | 15,074.51 | |||
| Fresh wetland: urban/suburban | Disturbance regulation | 1997 | Leschine, T.M., Wellman, K.F., and Green, T.H. | 12,992.15 | 18,641.69 | 15,816.92 | ||
| Fresh wetland: urban/suburban | Disturbance regulation | 1981 | Thibodeau, F. R. and Ostro, B. D. | 15,328.73 | 15,328.73 | |||
| Fresh wetland: urban/suburban | Disturbance regulation-total | 2,856.46 | 18,641.69 | 12,447.97 | per hectare per year |
|||
| Fresh wetland: urban/suburban | Nutrient regulation | 2000 | Bystrom, O | 4,322.28 | 9,289.32 | 5,621.35 | 5,621.35 | |
| Fresh wetland: urban/suburban | Nutrient regulation | 1993 | Gren, I. M. | 52.39 | 52.39 | |||
| Fresh wetland: urban/suburban | Nutrient regulation | 1990 | Lant, C. L. and Roberts, R. S. | 71.58 | 89.75 | 80.67 | ||
| Fresh wetland: urban/suburban | Nutrient regulation | 1989 | Lant, C. L. and Tobin, G. | 1,939.84 | 1,939.84 | |||
| Fresh wetland: urban/suburban | Nutrient regulation | 1981 | Thibodeau, F. R. and Ostro, B. D. | 7,793.02 | 7,793.02 | |||
| Fresh wetland: urban/suburban | Nutrient regulation | 71.58 | 9,289.32 | 3,097.45 | per hectare per year |
|||
| Fresh wetland: urban/suburban | Water supply | 1981 | Thibodeau, F. R. and Ostro, B. D. | 46,280.27 | 46,280.27 | |||
| Fresh wetland: urban/suburban | Water supply | 1975 | Gupta, T and Foster, J.H. | 5,388.93 | 37,722.49 | 18,861.24 | 18,861.24 | |
| Fresh wetland: urban/suburban | Water supply-total | 5,388.93 | 37,722.49 | 32,570.76 | per hectare per year |
|||
| Fresh wetland: urban/suburban | Recreation | 1981 | Thibodeau, F. R. and Ostro, B. D. | 983.32 | 17,672.15 | 9,327.73 | ||
| Fresh wetland: urban/suburban | Recreation-total | 983.32 | 17,672.15 | 9,327.73 | per hectare per year |
|||
| Fresh wetland: urban/suburban | Aesthetic and amenity | 2000 | Mahan, B. L., Polasky, S. and Adams, R. M. | 114.70 | 114.70 | |||
| Fresh wetland: urban/suburban | Aesthetic and amenity | 1981 | Thibodeau, F. R. and Ostro, B. D. | 68.92 | 220.56 | 144.74 | ||
| Fresh wetland: urban/suburban | Aesthetic and amenity-total | 68.92 | 220.56 | 129.72 | per hectare per year |
|||
| Fresh wetland: urban/suburban | Grand total | 68.92 | 37,722.49 | 57,588.14 | per hectare per year |
|||
| Fresh wetlands | Gas regulation | 2008 | Wilson, S.J. | 14.51 | 14.51 | |||
| Fresh wetlands | Gas regulation-total | 14.51 | per hectare per year |
|||||
| Fresh wetlands | Nutrient regulation | 2008 | Wilson, S.J. | 1,662.67 | 5,070.59 | 3,366.63 | ||
| Fresh wetlands | Nutrient regulation | 2004 | Brauer, I. | 37.04 | 37.04 | |||
| Fresh wetlands | Nutrient regulation | 2000 | Bystrom, O | 5,526.34 | 11,877.06 | 7,187.30 | 7,187.30 | |
| Fresh wetlands | Nutrient regulation | 1993 | Gren, I. M. | 52.39 | 52.39 | |||
| Fresh wetlands | Nutrient regulation | 1990 | Lant, C. L. and Roberts, R. S. | 71.58 | 89.75 | 80.67 | ||
| Fresh wetlands | Nutrient regulation | 1989 | Lant, C. L. and Tobin, G. | 4,793.46 | 4,793.46 | |||
| Fresh wetlands | Nutrient regulation | 1989 | Lant, C. L. and Tobin, G. | 435.38 | 435.38 | |||
| Fresh wetlands | Nutrient regulation-total | 71.58 | 11,877.06 | 2,278.98 | per hectare per year |
|||
| Fresh wetlands | Recreation | 2008 | Wilson, S.J. | 373.82 | 373.82 | |||
| Fresh wetlands | Recreation | 1993 | Shafer, E. L., Carline, R., Guldin, R. W. and Cordell, H. K | 265.55 | 265.55 | |||
| Fresh wetlands | Recreation | 1990 | Whitehead, J. C. | 2,746.08 | 5,520.19 | 4,133.14 | ||
| Fresh wetlands | Recreation | 1986 | Anderson, G. D. and Edwards, S. F. | 6,706.81 | 13,013.21 | 9,860.01 | ||
| Fresh wetlands | Recreation-total | 2,746.08 | 13,013.21 | 3,658.13 | per hectare per year |
|||
| Fresh wetlands | Aesthetic and amenity | 1996 | Doss, C. R. and Taff, S. J. | 1,378.51 | 1,378.51 | |||
| Fresh wetlands | Aesthetic and amenity | 1996 | Doss, C. R. and Taff, S. J. | 2,019.04 | 2,019.04 | |||
| Fresh wetlands | Aesthetic and amenity | 1990 | Lant, C. L. and Roberts, R. S. | 54.21 | 73.78 | 63.99 | ||
| Fresh wetlands | Aesthetic and amenity | 1986 | Anderson, G. D. and Edwards, S. F. | 21,847.17 | 21,847.17 | |||
| Fresh wetlands | Aesthetic and amenity-total | 54.21 | 73.78 | 6,327.18 | per hectare per year |
|||
| Fresh wetlands | Habitat refugium | 1992 | van Kooten, G. C. and Schmitz, A. | 136.60 | 136.60 | |||
| Fresh wetlands | Habitat refugium | 1992 | van Kooten, G. C. and Schmitz, A. | 19.88 | 19.88 | |||
| Fresh wetlands | Habitat refugium | 1989 | Willis, K. G. and Benson, J. F. | 51.43 | 94.90 | 73.16 | ||
| Fresh wetlands | Habitat refugium-total | 51.43 | 94.90 | 76.55 | per hectare per year |
|||
| Fresh wetlands | Other cultural | 1991 | Whitehead, J. C. and Blomquist, G. C. | 23.77 | 77.57 | 50.67 | ||
| Fresh wetlands | Other cultural | |||||||
| Fresh wetlands | Other cultural-total | 23.77 | 77.57 | 50.67 | per hectare per year |
|||
| Fresh wetlands | Grand total | 23.77 | 13,013.21 | 12,406.01 | per hectare per year |
|||
| Grassland/ pasture | Gas regulation | 2008 | Wilson, S.J. | 31.76 | 31.76 | |||
| Grassland/ pasture | Gas regulation | 2004 | Olewiler, N. | 10.21 | 30.62 | 20.41 | ||
| Grassland/ pasture | Gas regulation | 2004 | Olewiler, N. | 4.11 | 12.30 | 8.21 | ||
| Grassland/ pasture | Gas regulation | 4.11 | 30.62 | 20.13 | per hectare per year |
|||
| Grassland/ pasture | Disturbance regulation | 2004 | Olewiler, N. | 2.39 | 8.55 | 5.47 | ||
| Grassland/ pasture | Disturbance regulation-total | 2.39 | 8.55 | 5.47 | per hectare per year |
|||
| Grassland/ pasture | Soil regulation | 2004 | Olewiler, N. | 2.39 | 13.16 | 7.78 | ||
| Grassland/ pasture | Soil regulation | 2004 | Olewiler, N. | 0.65 | 2.68 | 1.66 | ||
| Grassland/ pasture | Soil regulation-total | 0.65 | 13.16 | 4.72 | per hectare per year |
|||
| Grassland/ pasture | Nutrient regulation | 2004 | Olewiler, N. | 2.85 | 50.75 | 26.80 | ||
| Grassland/ pasture | Nutrient regulation-total | 2.85 | 50.75 | 26.80 | per hectare per year |
|||
| Grassland/ pasture | Recreation | 2004 | Olewiler, N. | 40.50 | 177.05 | 108.77 | ||
| Grassland/ pasture | Recreation | 2004 | Olewiler, N. | 12.13 | 49.90 | 31.02 | ||
| Grassland/ pasture | Recreation-total | 12.13 | 177.05 | 69.90 | per hectare per year |
|||
| Grassland/ pasture | Habitat refugium | 1989 | Willis, K. G. and Benson, J. F. | 94.90 | 129.64 | 112.27 | ||
| Grassland/ pasture | Habitat refugium-total | 94.90 | 129.64 | 112.27 | per hectare per year |
|||
| Grassland/ pasture | Other cultural | 2008 | Sverrisson, D., Boxall, P. and Adamowicz, V. | 44.82 | 97.91 | 71.36 | ||
| Grassland/ pasture | Other cultural | 1999 | Alvarez-Farizo, B., Hanley, N., Wright, R. E. and MacMillan, D. | 66.36 | 66.36 | |||
| Grassland/ pasture | Other cultural | 1988 | Turner, M. G., Odum, E. P., Costanza, R. and Springer, T. M. | 279.11 | 279.11 | |||
| Grassland/ pasture | Other cultural-total | 44.82 | 97.91 | 138.95 | per hectare per year |
|||
| Grassland/ pasture | Pollinations and seeding | 2006 | Morandin, L.A. and Winston, M.L. | 20.63 | 20.63 | |||
| Grassland/ pasture | Pollinations and seeding | |||||||
| Grassland/ pasture | Pollinations and seeding-total | 20.63 | per hectare per year |
|||||
| Grassland/ pasture | Grand total | 0.65 | 177.05 | 398.86 | per hectare per year |
|||
| Open water: Great lake bay | Nutrient regulation | 1995 | Goffe, L. | 60.41 | 60.41 | |||
| Open water: Great lake bay | Nutrient regulation-total | 60.41 | per hectare per year |
|||||
| Open water: Great lake bay | Recreation | 2002 | Johnston, R. J., Grigalunas, T. A., Opaluch, J. J., Mazzotta, M. and Diamantedes, J. | 60.03 | 60.03 | |||
| Open water: Great lake bay | Recreation | 2002 | Johnston, R. J., Grigalunas, T. A., Opaluch, J. J., Mazzotta, M. and Diamantedes, J. | 1,260.24 | 1,260.24 | |||
| Open water: Great lake bay | Recreation | 2002 | Johnston, R. J., Grigalunas, T. A., Opaluch, J. J., Mazzotta, M. and Diamantedes, J. | 832.94 | 832.94 | |||
| Open water: Great lake bay | Recreation | 2002 | Johnston, R. J., Grigalunas, T. A., Opaluch, J. J., Mazzotta, M. and Diamantedes, J. | 1,094.48 | 1,094.48 | |||
| Open water: Great lake bay | Recreation | 1993 | Cordell, H. K. and Bergstrom, J. C. | 2,721.55 | 2,721.55 | |||
| Open water: Great lake bay | Recreation | 1993 | Cordell, H. K. and Bergstrom, J. C. | 4,443.31 | 4,443.31 | |||
| Open water: Great lake bay | Recreation | 1993 | Cordell, H. K. and Bergstrom, J. C. | 7,763.99 | 7,763.99 | |||
| Open water: Great lake bay | Recreation | 1993 | Cordell, H. K. and Bergstrom, J. C. | 4,363.94 | 4,363.94 | |||
| Open water: Great lake bay | Recreation | 1989 | Bockstael, N. E., McConnell, K. E. and Strand, I. E. | 325.32 | 325.32 | |||
| Open water: Great lake bay | Recreation | 1989 | Young, C. E. and Shortle, J. S. | 1,074.52 | 1,074.52 | |||
| Open water: Great lake bay | Recreation | 1986 | Kealy, M. J. and Bishop, R. C. | 70.31 | 265.43 | 167.87 | ||
| Open water: Great lake bay | Recreation | 1984 | Ribaudo, M. and Epp, D. J. | 611.58 | 775.51 | 693.55 | ||
| Open water: Great lake bay | Recreation | 1979 | Bouwes, N. W. and Scheider, R. | 1,641.63 | 1,641.63 | |||
| Open water: Great lake bay | Recreation | 1971 | Burt, O. R. and Brewer, D. | 6,518.53 | 6,518.53 | |||
| Open water: Great lake bay | Recreation | 70.31 | 775.51 | 2,354.42 | per hectare per year |
|||
| Open water: Great lake bay | Aesthetic and amenity | 1989 | d’Arge, R. and Shogren, J.F. | 911.47 | 911.47 | |||
| Open water: Great lake bay | Aesthetic and amenity | 1989 | d’Arge, R. and Shogren, J.F. | 291.16 | 291.16 | |||
| Open water: Great lake bay | Aesthetic and amenity | 1989 | d’Arge, R. and Shogren, J.F. | 550.68 | 550.68 | |||
| Open water: Great lake bay | Aesthetic and amenity | 1989 | Young, C. E. and Shortle, J. S. | 281.12 | 281.12 | |||
| Open water: Great lake bay | Aesthetic and amenity-total | 508.61 | per hectare per year |
|||||
| Open water: Great lake bay | Habitat refugium | 1994 | Kahn, J. R. and Buerger, R. B. | 15.16 | 33.46 | 24.31 | ||
| Open water: Great lake bay | Habitat refugium | 1989 | Buerger, R. and Kahn, J. R. | 3.85 | 3.85 | |||
| Open water: Great lake bay | Habitat refugium-total | 15.16 | 33.46 | 14.08 | per hectare per year |
|||
| Open water: Great lake bay | Grand total | 15.16 | 775.51 | 2,937.52 | per hectare per year |
|||
| Open water: great lake nearshore | Recreation | 2002 | Johnston, R. J., Grigalunas, T. A., Opaluch, J. J., Mazzotta, M. and Diamantedes, J. | 60.03 | 60.03 | |||
| Open water: great lake nearshore | Recreation | 2002 | Johnston, R. J., Grigalunas, T. A., Opaluch, J. J., Mazzotta, M. and Diamantedes, J. | 832.94 | 832.94 | |||
| Open water: great lake nearshore | Recreation | 2002 | Johnston, R. J., Grigalunas, T. A., Opaluch, J. J., Mazzotta, M. and Diamantedes, J. | 1,094.48 | 1,094.48 | |||
| Open water: great lake nearshore | Recreation | 2002 | Johnston, R. J., Grigalunas, T. A., Opaluch, J. J., Mazzotta, M. and Diamantedes, J. | 1,260.24 | 1,260.24 | |||
| Open water: great lake nearshore | Recreation | 1993 | Cordell, H. K. and Bergstrom, J. C. | 2,721.55 | 2,721.55 | |||
| Open water: great lake nearshore | Recreation | 1993 | Cordell, H. K. and Bergstrom, J. C. | 4,443.31 | 4,443.31 | |||
| Open water: great lake nearshore | Recreation | 1993 | Cordell, H. K. and Bergstrom, J. C. | 7,763.99 | 7,763.99 | |||
| Open water: great lake nearshore | Recreation | 1993 | Cordell, H. K. and Bergstrom, J. C. | 4,363.94 | 4,363.94 | |||
| Open water: great lake nearshore | Recreation | 1989 | Bockstael, N. E., McConnell, K. E. and Strand, I. E. | 325.32 | 325.32 | |||
| Open water: great lake nearshore | Recreation | 1989 | Young, C. E. and Shortle, J. S. | 1,074.52 | 1,074.52 | |||
| Open water: great lake nearshore | Recreation | 1986 | Kealy, M. J. and Bishop, R. C. | 70.31 | 265.43 | 167.87 | ||
| Open water: great lake nearshore | Recreation | 1984 | Ribaudo, M. and Epp, D. J. | 611.58 | 775.51 | 693.55 | ||
| Open water: great lake nearshore | Recreation | 1979 | Bouwes, N. W. and Scheider, R. | 1,641.63 | 1,641.63 | |||
| Open water: great lake nearshore | Recreation | 1971 | Burt, O. R. and Brewer, D. | 6,518.53 | 6,518.53 | |||
| Open water: great lake nearshore | Recreation-total | 70.31 | 775.51 | 2,354.42 | per hectare per year |
|||
| Open water: great lake nearshore | Aesthetic and amenity | 1989 | d’Arge, R. and Shogren, J.F. | 911.47 | 911.47 | |||
| Open water: great lake nearshore | Aesthetic and amenity | 1989 | d’Arge, R. and Shogren, J.F. | 291.16 | 291.16 | |||
| Open water: great lake nearshore | Aesthetic and amenity | 1989 | d’Arge, R. and Shogren, J.F. | 550.68 | 550.68 | |||
| Open water: great lake nearshore | Aesthetic and amenity | 1989 | Young, C. E. and Shortle, J. S. | 281.12 | 281.12 | |||
| Open water: great lake nearshore | Aesthetic and amenity-total | 508.61 | per hectare per year |
|||||
| Open water: great lake nearshore | Grand total | 70.31 | 775.51 | 2,863.03 | per hectare per year |
|||
| Open water: inland lake | Nutrient regulation | 1985 | Sutherland, R. and Walsh, R. G. | 624.93 | 624.93 | |||
| Open water: inland lake | Nutrient regulation-total | 624.93 | per hectare per year |
|||||
| Open water: inland lake | Recreation | 1997 | Rollins, K., Wistowsky, W., and Jay, M. | 164.59 | 164.59 | |||
| Open water: inland lake | Recreation | 1997 | Rollins, K., Wistowsky, W., and Jay, M. | 355.69 | 355.69 | |||
| Open water: inland lake | 1997 | Rollins, K., Wistowsky, W., and Jay, M. | 188.31 | 188.31 | ||||
| Open water: inland lake | Recreation | 1993 | Cordell, H. K. and Bergstrom, J. C. | 2,721.55 | 2,721.55 | |||
| Open water: inland lake | Recreation | 1993 | Cordell, H. K. and Bergstrom, J. C. | 4,443.31 | 4,443.31 | |||
| Open water: inland lake | Recreation | 1993 | Cordell, H. K. and Bergstrom, J. C. | 7,763.99 | 7,763.99 | |||
| Open water: inland lake | Recreation | 1993 | Cordell, H. K. and Bergstrom, J. C. | 4,363.94 | 4,363.94 | |||
| Open water: inland lake | Recreation | 1985 | Mullen, J. K. and Menz, F. C. | 10,373.72 | 10,373.72 | |||
| Open water: inland lake | Recreation | 1979 | Bouwes, N. W. and Scheider, R. | 1,641.63 | 1,641.63 | |||
| Open water: inland lake | Recreation | 1971 | Burt, O. R. and Brewer, D. | 6,518.53 | 6,518.53 | |||
| Open water: inland lake | Recreation-total | 3,853.53 | per hectare per year |
|||||
| Open water: inland lake | Aesthetic and amenity | 1989 | d’Arge, R. and Shogren, J.F. | 911.47 | 911.47 | |||
| Open water: inland lake | Aesthetic and amenity | 1989 | d’Arge, R. and Shogren, J.F. | 291.16 | 291.16 | |||
| Open water: inland lake | Aesthetic and amenity | 1989 | d’Arge, R. and Shogren, J.F. | 550.68 | 550.68 | |||
| Open water: inland lake | Aesthetic and amenity-total | 584.44 | per hectare per year |
|||||
| Open water: inland lake | Other cultural | 2000 | Forsyth, M. | 14.33 | 47.93 | 31.13 | ||
| Open water: inland lake | Other cultural | 14.33 | 47.93 | 31.13 | per hectare per year |
|||
| Open water: inland lake | Other cultural-total | 14.33 | 47.93 | 5,094.02 | per hectare per year |
|||
| Open water: river | Water supply | 2003 | Brox, J.A., Kumar, R.C., and Stollery, K.R. | 1,741.54 | 1,741.54 | |||
| Open water: river | Water supply-total | 1,741.54 | per hectare per year |
|||||
| Open water: river | Recreation | 2000 | Ahn, S., De Steiguer, J. E., Palmquist, R. B. and Holmes, T. P. | 46.75 | 426.37 | 236.56 | ||
| Open water: river | Recreation | 1997 | Rollins, K., Wistowsky, W., and Jay, M. | 164.59 | 164.59 | |||
| Open water: river | Recreation | 1997 | Rollins, K., Wistowsky, W., and Jay, M. | 355.69 | 355.69 | |||
| Open water: river | Recreation | 1997 | Rollins, K., Wistowsky, W., and Jay, M. | 188.31 | 188.31 | |||
| Open water: river | Recreation | 1987 | Desvousges, W. H., Smith, V. K. and Fisher, A. | 16,615.31 | 16,615.31 | |||
| Open water: river | Recreation-total | 46.75 | 426.37 | 3,512.09 | per hectare per year |
|||
| Open water: river | Other cultural | 2000 | Forsyth, M. | 14.33 | 47.93 | 31.13 | ||
| Open water: river | Other cultural | 14.33 | 47.93 | 31.13 | per hectare per year |
|||
| Open water: river | Grand total | 14.33 | 426.37 | 5,284.76 | per hectare per year |
|||
| Open water: urban/ suburban river | Nutrient regulation | 2002 | Mathews, L. G., Homans, F. R. and Easter, K. W. | 21,089.03 | 21,089.03 | |||
| Open water: urban/ suburban river | Nutrient regulation | 1977 | Oster, S. | 30,149.97 | 30,149.97 | |||
| Open water: urban/ suburban river | Nutrient regulation-total | 25,619.50 | per hectare per year |
|||||
| Open water: urban/ suburban river | Water supply | 2003 | Brox, J.A., Kumar, R.C., and Stollery, K.R. | 1,741.54 | 1,741.54 | |||
| Open water: urban/ suburban river | Water supply-total | 1,741.54 | per hectare per year |
|||||
| Open water: urban/ suburban river | Recreation | 1996 | Garrod, G. D. and Willis, K. G. | 46,658.40 | 46,658.40 | |||
| Open water: urban/ suburban river | Recreation | 1993 | Shafer, E. L., Carline, R., Guldin, R. W. and Cordell, H. K. | 5,932.87 | 5,932.87 | |||
| Open water: urban/ suburban river | Recreation | 1977 | Gramlich, F. W. | 67,455.94 | 127,854.13 | 97,655.03 | ||
| Open water: urban/ suburban river | Recreation-total | 67,455.94 | 127,854.13 | 50,082.10 | per hectare per year |
|||
| Open water: urban/ suburban river | Aesthetic and amenity | 1982 | Rich, P. R. and Moffitt, L. J. | 245.38 | 245.38 | |||
| Open water: urban/ suburban river | Aesthetic and amenity -total | 245.38 | per hectare per year |
|||||
| Open water: urban/ suburban river | Grand total | 67,455.94 | 127,854.13 | 77,688.51 | per hectare per year |
|||
| Open water: urban/suburban lake | Nutrient regulation | 2002 | Mathews, L. G., Homans, F. R. and Easter, K. W. | 21,089.03 | 21,089.03 | |||
| Open water: urban/suburban lake | Nutrient regulation | 1985 | Sutherland, R. and Walsh, R. G. | 624.93 | 624.93 | |||
| Open water: urban/suburban lake | Nutrient regulation-total | 10,856.98 | per hectare per year |
|||||
| Open water: urban/suburban lake | Water supply | 2003 | Brox, J.A., Kumar, R.C., and Stollery, K.R. | 1,741.54 | 1,741.54 | |||
| Open water: urban/suburban lake | Water supply-total | 1,741.54 | per hectare per year |
|||||
| Open water: urban/suburban lake | Recreation | 1993 | Shafer, E. L., Carline, R., Guldin, R. W. and Cordell, H. K. | 5,932.87 | 5,932.87 | |||
| Open water: urban/suburban lake | Recreation | 1993 | Shafer, E. L., Carline, R., Guldin, R. W. and Cordell, H. K. | 31,147.54 | 31,147.54 | |||
| Open water: urban/suburban lake | Recreation | 1993 | Shafer, E. L., Carline, R., Guldin, R. W. and Cordell, H. K. | 25,323.21 | 25,323.21 | |||
| Open water: urban/suburban lake | Recreation | 1989 | Young, C. E. and Shortle, J. S. | 1,074.52 | 1,074.52 | |||
| Open water: urban/suburban lake | Recreation | 1984 | Ribaudo, M. and Epp, D. J. | 611.58 | 775.51 | 693.55 | ||
| Open water: urban/suburban lake | Recreation-total | 611.58 | 775.51 | 12,834.34 | per hectare per year |
|||
| Open water: urban/suburban lake | Aesthetic and amenity | 1989 | d’Arge, R. and Shogren, J.F. | 550.68 | 550.68 | |||
| Open water: urban/suburban lake | Aesthetic and amenity | 1989 | d’Arge, R. and Shogren, J.F. | 911.47 | 911.47 | |||
| Open water: urban/suburban lake | Aesthetic and amenity | 1989 | d’Arge, R. and Shogren, J.F. | 291.16 | 291.16 | |||
| Open water: urban/suburban lake | Aesthetic and amenity | 1989 | Young, C. E. and Shortle, J. S. | 281.12 | 281.12 | |||
| Open water: urban/suburban lake | Aesthetic and amenity | 1982 | Rich, P. R. and Moffitt, L. J. | 245.38 | 245.38 | |||
| Open water: urban/suburban lake | Aesthetic and amenity-total | 455.96 | per hectare per year |
|||||
| Open water: urban/suburban lake | Other cultural | 2000 | Forsyth, M. | 14.33 | 47.93 | 31.13 | ||
| Open water: urban/suburban lake | Other cultural-total | 14.33 | 47.93 | 31.13 | per hectare per year |
|||
| Open water: urban/suburban lake | Grand total | 14.33 | 775.51 | 25,919.94 | per hectare per year |
|||
| Urban herbaceous greenspace | Aesthetic and amenity | 2006 | Costanza, R., Wilson, M., Troy, A., Voinov, A., Liu, S., and D’Agostino, J. | 36,745.29 | 67,671.50 | 52,208.39 | ||
| Urban herbaceous greenspace | Aesthetic and amenity | 1974 | Hammer, T.R., Coughlin, R.E., and Horn, E.T. | 34,679.16 | 34,679.16 | |||
| Urban herbaceous greenspace | Aesthetic and amenity-total | 36,745.29 | 67,671.50 | 43,443.78 | per hectare per year |
|||
| Urban herbaceous greenspace | Other cultural | 1988 | Turner, M. G., Odum, E. P., Costanza, R. and Springer, T. M. | 252.28 | 252.28 | |||
| Urban herbaceous greenspace | Other cultural-total | 252.28 | per hectare per year |
|||||
| Urban herbaceous greenspace | Grand total | 36,745.29 | 67,671.50 | 43,696.05 | per hectare per year |
All figures are in 2011 CAD
Appendix 3. Bibliography for value transfer
Alphabetical by author
Ahn, S., De Steiguer, J. E., Palmquist, R. B. and Holmes, T. P. Economic analysis of the potential impact of climate change on recreational trout fishing in the Southern Appalachian Mountains: An application of a nested multino. Climatic Change 45. 493-509. 2000. Method: Travel cost
Alvarez-Farizo, B., Hanley, N., Wright, R. E. and MacMillan, D. Estimating the benefits of agri-environmental policy: econometric issues in open-ended contingent valuation studies Journal of Environmental Planning And Management. 42. 23-43. 1999. Method: Contingent valuation
Amigues, J. P., Boulatoff, C., Desaigues, B., Gauthier, C. and Keith, J. E. The benefits and costs of riparian analysis habitat preservation: a willingness to accept/willingness to pay contingent valuation approach. Ecological Economics.43. 17-31.2002. Method: Contingent valuation
Anderson, G. D. and Edwards, S. F. Protecting Rhode-Island Coastal Salt Ponds - an Economic-Assessment of Downzoning. Coastal Zone Management Journal. 14. 67-91. 1986. Method: Contingent valuation.
Bateman, I. J., Diamand, E., Langford, I. H. and Jones, A. Household Willingness to Pay and Farmers’ Willingness to Accept Compensation for Establishing a Recreational Woodland. Journal of Environmental Planning and Management. 39. 21-43. 1996. Method: Contingent valuation
Bennett, R., Tranter, R., Beard, N. and Jones, P. The Value of Footpath Provision in the Countryside: A Case-Study of Public Access to Urban-fringe Woodland. Journal of Environmental Planning and Management. 38. 409-417. 1995. Method: Contingent valuation.
Bergstrom, J., Dillman, B. L. and Stoll, J. R. Public environmental amenity benefits of private land: the case of prime agricultural land. South Journal of Agricultural Economics. 7: 139-149. 1985. Method: Contingent valuation.
Bishop, R.C., Breffle,W.S., Lazo, J.K., Rowe, R.D., and Wytinck, S.M. Restoration Scaling Based on Total Value Equivalency: Green Bay Natural Resource Damage Assessment. US Fish and Wildlife Service Report. 2000. Method: Multi-attribute decision analysis.
Bockstael, N. E., McConnell, K. E. and Strand, I. E. Measuring the Benefits of Improvements in Water Quality: The Chesapeake Bay. Marine Resource Economics. 6: 1-18. 1989. Method: Travel cost
Bouwes, N. W. and Scheider, R. Procedures in estimating benefits of water quality change. American Journal of Agricultural Economics. 61: 534-539. 1979. Method: Travel cost
Bowker, J.M. and Didychuk, D.D. Estimation of the nonmarket benefits of agricultural land retention in Eastern Canada. Agricultural and Resource Economics Review. 23: 218-225. 1994. Method: Contingent valuation
Brauer, I. Valuation of ecosystem services: provided by biodiversity conservation: an integrated hydrological and economic model to value the enhanced nitrogen retention in r. Chapter: Valuation and Conservation of Biodiversity. 193-204. 2004. Method: Replacement cost.
Brox, J.A., Kumar, R.C., and Stollery, K.R. Estimating willingness to pay for improved water quality in the presence of item nonresponse bias. American Journal of Agricultural Economics. 85: 414-428. 2003. Method: Contingent valuation.
Buerger, R. and Kahn, J. R. New York Value of Chesapeake Striped Bass. Marine Resource Economics. 6: 19-25. 1989. Method: Direct market valuation.
Burt, O. R. and Brewer, D. Estimation of net social benefits from outdoor recreation. Econometrica. 39: 813-827. 1971. Method: Travel cost.
Bystrom, O. The replacement value of wetlands in Sweden. Environmental and Resource Economics. 16: 347-362. 2000. Method: Replacement cost.
Cordell, H. K. and Bergstrom, J. C. Comparison of Recreation Use Values among Alternative Reservoir Water Level Management Scenarios. Water Resources Research. 29: 247-258. 1993. Method: Contingent valuation.
Costanza, R., Wilson, M., Troy, A., Voinov, A., Liu, S., and D“Agostino, J. The value of New Jersey’s ecosystem services and natural capital. 2006. Method: Hedonic pricing.
d’Arge, R. and Shogren, J.F. Okoboji experiment: comparing non-market valuation techniques in an unusually well-defined market for water quality. Ecological Economics.1: 251-259. 1989. Method: Marginal product estimation.
Desvousges, W. H., Smith, V. K. and Fisher, A. Option price estimates for water quality improvements: a contingent valuation study for the Monongahele River. Journal of Environmental Economics and Management. 14. 248-267. 1987. Method: Contingent valuation
Doss, C. R. and Taff, S. J. The influence of wetland type and wetland proximity on residential property values. Journal of Agricultural and Resource Economics. 21: 120-129. 1996. Method: Hedonic pricing.
Ecologistics. Benefits to beach users from water quality improvements. Environment Ontario Report: RAC Project 374C. 1990. Method: Contingent valuation.
Edwards, S. F. and Gable, F. J. Estimating the value of beach recreation from property values: an exploration with comparisons to nourishment costs. Ocean & Shoreline Management. 15: 37-55. 1991. Method: Hedonic pricing.
Forsyth, M. On estimating the option value of preserving a wilderness area. Canadian Journal of Economics. 33: 413-434. 2000. Method: Contingent valuation.
Garrod, G. D. and Willis, K. G. Estimating the Benefits of Environmental Enhancement: A Case Study of the River Darent. Journal of Environmental Planning and Management. 39: 189-203. 1996. Method: Contingent valuation.
Goffe, L. The benefits of improvements in coastal water quality: a contingent approach. Journal of Environmental Management. 45: 305-317. 1995. Method: Contingent valuation.
Gramlich, F. W. The demand for clean water: the case of the Charles River. National Tax Journal. 30. 1977. Method: Contingent valuation.
Gren, I. M. Alternative nitrogen reduction policies in the Malar region, Sweden. Ecological Economics. 7: 159-172. 1993. Method: Avoided cost.
Gupta, T and Foster, J.H. Economic criteria for freshwater wetland policy in Massachusetts. American Journal of Agricultural Economics. 57: 40-45. 1975. Method: Avoided cost
Haener, M. K. and Adamowicz, W. L. Regional forest resource accounting: a northern Alberta case study. Canadian Journal of Forest Research-Revue Canadien. 30: 264-273. 2000. Method: Direct market valuation.
Haener, M.K. and Adamowicz, W.L. Analysis of “Don’t know” responses to referendum contingent valuation questions. Agricultural and Resource Economics Review. 218-230. 1998. Method: Contingent valuation.
Hammer, T.R., Coughlin, R.E., and Horn, E.T. The effect of a large urban park on real estate value. Journal of the American Institute of Planners. 40: 274-277. 1974. Method: Hedonic pricing.
Hanley, N., Bell, D. and Alvarez-Farizo, B. Valuing the benefits of coastal water quality improvements using contingent and real behaviour. Environmental & Resource Economics. 24: 273-285. 2003. Method: Travel cost.
Hougner, C., Colding, J., and Soderqvist, T. Economic valuation of a seed dispersal service in the Stockholm National Urban Park, Sweden. Ecological Economics. 59: 364-374. 2006. Method: Replacement cost.
Johnston, R. J., Grigalunas, T. A., Opaluch, J. J., Mazzotta, M. and Diamantedes, J. Valuing estuarine resource services using economic and ecological models: the Peconic Estuary System study. Coastal Management. 30: 47-65. 2002. Method: Travel cost.
Kahn, J. R. and Buerger, R. B. Valuation and the Consequences of Multiple Sources of Environmental Deterioration - the Case of the New-York Striped Bass Fishery. Journal of Environmental Management. 40 257-273. 1994. Method: Avoided cost.
Kealy, M. J. and Bishop, R. C. Theoretical and Empirical Specifications Issues in Travel Cost Demand Studies. American Journal of Agricultural Economics. 68: 660-667. 1986. Method: Travel cost.
Kenyon, W. and Nevin, C. The use of economic and participatory approaches to assess forest development: a case study in the Ettrick Valley. Forest Policy and Economics. 3: 69-80. 2001. Method: Contingent valuation.
Kline, J. D. and Swallow, S. K. The demand for local access to coastal recreation in southern New England. Coastal Management. 26: 177-190. 1998. Method: Contingent valuation.
Knoche, S. and Lupi, F. Valuing deer hunting ecosystem services from farm landscapes. Ecological Economics. 64: 313-320. 2007. Method: Travel cost.
Kreutzwiser, R. The economic significance of the long point marsh, Lake Erie, as a recreational resource. Journal of Great Lakes Resources. 7: 105-110. 1981. Method: Contingent valuation.
Kwak, S. J., Yoo, S. H. and Han, S. Y. Estimating the public’s value for urban forest in the Seoul metropolitan area of Korea: A contingent valuation study. Urban Studies 40 2207-2221. 2003. Method: Contingent valuation.
Lant, C. L. and Roberts, R. S. Greenbelts in the Corn-Belt - Riparian Wetlands, Intrinsic Values, and Market Failure. Environment and Planning A. 22: 1375-1388. 1990. Method: Contingent valuation.
Lant, C. L. and Tobin, G. The economic value of reparian corridors in cornbelt floodplains: a research framework. Professional Geographer. 41: 337-349. 1989. Method: Contingent valuation.
Leschine, T.M., Wellman, K.F., and Green, T.H. The economic value of wetlands: Wetlands’ role in flood protection in Western Washington. Washington State Department of Ecology, Publication No. 97-100. 1997. Method: Replacement cost.
Loewen, K.G. and Kulshreshtha, S.N. Recreation and wilderness: Participation and economic significance in Saskatchewan. Report submitted to The Prince Albert Model Forest Association. 1996. Method: Contingent valuation.
Mahan, B. L., Polasky, S. and Adams, R. M. Valuing urban wetlands: A property price approach. Land Economics.76: 100-113. 2000. Method: Hedonic pricing.
Mathews, L. G., Homans, F. R. and Easter, K. W. Estimating the benefits of phosphorus pollution reductions: An application in the Minnesota River. Journal of the American Water Resources Association. 38: 1217-1223. 2002. Method: Combined revealed and stated preference.
Maxwell, S. Valuation of Rural Environmental Improvements using Contingent Valuation Methodology: A Case Study of the Martson Vale Community Forest Project. Journal of Environmental Management. 41: 385-399. 1994. Method: Contingent valuation.
Morandin, L.A. and Winston, M.L. Pollinators provide economic incentive to preserve natural land in agroecosystems. Agriculture, Ecosystems, and Environment. 11: 289-292. 2006. Method: Factor income.
Mullen, J. K. and Menz, F. C. The Effect of Acidification Damages on the Economic Value of the Adirondack Fishery to New-York Anglers. American Journal of Agricultural Economics. 67: 112-119. 1985. Method: Travel cost.
Nunes, P. and Van den Bergh, J. Can people value protection against invasive marine species? Evidence from a joint TC-CV survey in the Netherlands. Environmental & Resource Economics. 28: 517-532. 2004. Method: Combined revealed and stated preference.
Olewiler, N. The value of natural capital in settled areas of Canada. Report for Ducks Unlimited and The Nature Conservancy of Canada. 2004. Method: Meta-analysis.
Oster, S. Survey results on the benefits of water pollution abatement in the Merrimack River Basin. Water Resources Research. 13: 882-884. 1977. Method: Contingent valuation.
Parsons, G. R. and Powell, M. Measuring the Cost of Beach Retreat. Coastal Management. 29: 91-103. 2001. Method: Hedonic pricing.
Pompe, J. J. and Rinehart, J. R. Beach Quality and the Enhancement of Recreational Property-Values. Journal of Leisure Research. 27: 143-154. 1995. Method: Hedonic pricing.
Prince, R. and Ahmed, E. Estimating Individual Recreation Benefits under Congestion and Uncertainty. Journal of Leisure Research. 21: 61-76. 1989. Method: Contingent valuation.
Randall, A. and de Zoysa, D. Groundwater, surface water, and wetlands valuation for benefits transfer: A progress report. Chapter: Benefits and costs transfer in natural resource planning. 1996. Method: Contingent valuation.
Rein, F. A. An economic analysis of vegetative buffer strip implementation - Case study: Elkhorn Slough, Monterey Bay, California. Coastal Management. 27: 377-390. 1999. Method: Avoided cost.
Ribaudo, M. and Epp, D. J. The importance of sample discrimination in using the travel cost method to estimate the benefits of improved water quality. Land Economics. 60: 397-403. 1984. Method: Travel cost.
Rich, P. R. and Moffitt, L. J. Benefits of Pollution-Control on Massachusetts Housatonic River - a Hedonic Pricing Approach. Water Resources Bulletin. 18: 1033-1037. 1982. Method: Hedonic pricing.
Rivas, V. and Cendrero, A. Use of Natural and Artificial Accretion on the North Coast of Spain - Historical Trends and Assessment of Some Environmental and Economic Consequences. Journal of Coastal Research. 7: 491-507. 1991. Method: Avoided cost.
Robinson, W. S., Nowogrodzki, R. and Morse, R. A. The value of honey bees as pollinators of US crops. American Bee Journal. 177-487. 1989. Method: Avoided cost. Alphabetical by Author
Rollins, K., Wistowsky, W., and Jay, M. Wilderness canoeing in Ontario: Using cumulative results to update dichotomous choice contingent valuation offer amounts. Canadian Journal of Agricultural Economics-Revue C. 45: 1-16. 1997. Method: Contingent valuation.
Scarpa, R., Chilton, S. M., Hutchinson, W. G. and Buongiorno, J. Valuing the recreational benefits from the creation of nature reserves in Irish forests. Ecological Economics. 33: 237-250. 2000. Method: Contingent valuation.
Shafer, E. L., Carline, R., Guldin, R. W. and Cordell, H. K. Economic Amenity Values of Wildlife - 6 Case-Studies in Pennsylvania. Environmental Management. 17: 669-682. 1993. Method: Travel cost.
Silberman, J., Gerlowski, D. A. and Williams, N. A. Estimating Existence Value for Users and Nonusers of New-Jersey Beaches. Land Economics. 68: 225-236. 1992. Method: Contingent valuation.
Southwick, E. E. and Southwick, L. Estimating the Economic Value of Honey-Bees (Hymenoptera, Apidae) as Agricultural Pollinators in the United-States. Journal of Economic Entomology. 85: 621-633. 1992. Method: Avoided cost.
Sutherland, R. and Walsh, R. G. Effect of Distance on the preservation value of water quality. Land Economics. 61: 281-291. 1985. Method: Contingent valuation.
Sverrisson, D., Boxall, P. and Adamowicz, V. Estimation of the Passive Use Value Associated with Future Expansion of Provincial Parks and Protected Areas in Southern Ontario. Report to Ontario Ministry of Natural Resources. 2008. Method: Contingent valuation.
Taylor, L. O. and Smith, V. K. Environmental amenities as a source of market power. Land Economics. 76: 550-568. 2000. Method: Hedonic pricing.
Thibodeau, F. R. and Ostro, B. D. An economic analysis of wetland protection. Journal of Environmental Management. 12: 19-30. 1981. Method: Avoided cost.
Tol, Richard. The Social Cost of Carbon: Trends, Outliers and Catastrophes. Economics:2: 2008. Method: Meta-analysis.
Turner, M. G., Odum, E. P., Costanza, R. and Springer, T. M. Market and nonmarket values of the Georgia landscape. Environmental Management: 12: 209-217. 1988. Method: Combined revealed and stated preference.
Tyrvainen, L. Economic valuation of urban forest benefits in Finland. Journal of Environmental Management: 62: 75-92. 2001. Method: Contingent valuation.
van Kooten, G. C. and Schmitz, A. Preserving Waterfowl Habitat on the Canadian Prairies - Economic Incentives Versus Moral Suasion. American Journal of Agricultural Economics. 74: 79-89. 1992. Method: Contingent valuation.
van Kooten, G.C. and Bulte, E.H. How much primary coastal temperate rain forest should society retain? Carbon uptake, recreation, and other values. Canadian Journal of Forest Resources. 29: 1879-1890. 1999. Method: Direct market valuation.
Whitehead, J. C. Measuring Willingness-to-Pay for Wetlands Preservation with the Contingent Valuation Method. Wetlands. 10: 187-201. 1990. Method: Contingent valuation.
Whitehead, J. C. and Blomquist, G. C. Measuring Contingent Values for Wetlands - Effects of Information About Related Environmental Goods. Water Resources Research. 27: 2523-2531. 1991. Method: Contingent valuation.
Willis, K. G. The Recreational Value of the Forestry Commission Estate in Great-Britain - a Clawson-Knetsch Travel Cost-Analysis. Scottish Journal of Political Economy. 38: 58-75. 1991. Method: Travel cost.
Willis, K. G. and Benson, J. F. A Comparison of User Benefits and Costs of Nature Conservation at Three Nature Reserves. Regional Studies. 22: 417-428. 1989. Method: Travel cost
Willis, K. G. and Garrod, G. D. An Individual Travel-Cost Method of Evaluating Forest Recreation. Journal of Agricultural Economics. 42: 33-42. 1991. Method: Travel cost.
Wilson, S.J. Ontario’s Wealth, Canada’s Future: Appreciating the Value of the Greenbelt’s Eco-Services. Report to David Suzuki Foundation. 2008. Method: Replacement cost.
Young, C. E. and Shortle, J. S. Benefits and costs of agricultural nonpoint-source pollution controls: the case of St. Albans Bay. Journal of Soil and Water Conservation. 64-67. 1989. Method: Hedonic pricing.
Appendix 4. ARIES technical overview
Appendix 4.1: Artificial intelligence and Bayesian Networks
Bayesian statistical approaches have been used to address a variety of issues in environmental valuation and value transfer (Brundson and Willis 2002), including determination of which independent variables to include in regression models (Moeltner and Rosenberger 2007, Leon-Gonzalez and Scarpa 2008) and handling the effects of methodological independent variables when using a transfer function (Moeltner et al. 2007, Moeltner and Woodward 2009). McCann et al. (2006) provide a general overview of Bayesian models in ecology as part of a special issue of the Canadian Journal of Forest Research. Marcot et al. (2006), in the same special issue, outline basic principles for Bayesian modeling that we have followed in our work regarding model construction, development of prior and conditional probabilities, and model testing and review. Per Marcot et al.’s (2006) recommendations on building tractable and transparent conditional probability tables (CPTs), we:
- Use no more than 3-5 discrete states for each variable (often classified as “high-moderate-low” or “very high-high-moderate-low-very low”);
- Make each variable a function of no more than 3-5 other variables; and
- Use intermediate variables where appropriate.
Figure 1 shows a sample conditional probability table (CPT) taken from the Recreational View Sink Model where we combine Park Infrastructure, Clearcuts and Transportation/Energy Infrastructure to derive Visual Blight. For each combination of attributes, we derive a probability of occurrence. For example where Park Infrastructure, Clearcuts, and Transportation/Energy Infrastructure are present, there exists a 50% likelihood of High Visual Blight. Figure 1 only provides the half of the CPT that represents the presence of Park Infrastructure (due to page size constraints). The other half of the table represents the same set of attributes where there is no Park Infrastructure present.
Figure 1: Sample conditional probability table.

Enlarge Figure 1: Sample conditional probability table
We direct readers with further interest in Bayesian networks and stronger backgrounds in probability theory to Pearl (1988). Some readers who are unfamiliar with Bayesian approaches may feel uncomfortable with the perceived subjectivity of assigning prior and conditional probabilities in our models. We feel that the assignment of such probabilities, which are only used in the absence of data, is a better way to incorporate expert opinion than asserting the rigid and non-transparent structure and parameterization of deterministic equations (Brundson and Willis, 2002).
Finally, users should note that Bayesian models are not always appropriate or necessary in the ARIES system. Where well-accepted, peer-reviewed ecological process models can provide input data or values for the source, sink, use or flow components of an ecosystem service assessment, these models can be incorporated in the model chain instead. The ARIES system is then instructed as to which cases it should use probabilistic versus deterministic models (e.g. in a particular part of the world, at a particular spatial scale, or where the results of another “context model” match a specified output). In some cases (particularly for the use models), one or more spatial data layers may suffice to map beneficiaries.
Appendix 4.2: Data integration tools
All models in ARIES are designed as transformations on “observations,” where an observation is defined as an assignment of state to an observable concept within a particular context (e.g. spatial extent or time period). For example, let us imagine that an ARIES model is needed to reclassify land use types in one typology into another that is better suited for soil erosion analysis in the Lake of the Woods provincial park. First, we would construct a model which observes the concept “land use type” in this park (our context) by looking up land use values in a map of the region. Next we would construct a second model which transforms the land use values from the first model into their new soil erosion classes using a lookup table.
What enables transferability of models to multiple sites is the fact that the first model, which observes land use type by looking in a map, actually looks for the particular context-specific map it needs in a semantic database managed by the ARIES system, which connects observable concepts to their data sources. Thus, by adding additional land use maps, which use the same type classes as the Lake of the Woods region, to this database and linking them to the same observable concept, the same soil retention analysis model can be run in every region where such a link exists.
Finally, in order to facilitate the growth of a distributed network of available data sources, ARIES accesses all of its spatial data through the W3C-standardized web mapping services: WMS, WFS, and WCS. We host our in-house datasets on our own Geoserver instance and invite partners to set up their own web mapping servers to make their local datasets available to our modeling system. All of the data used in the models presented here can now be found on the ARIES Geoserver instance. Additional data can be added, but will require coordination with the ARIES development team.
Appendix 5. Detailed GIS methods for ARIES data development
Appendix 5.1: Algonquin Provincial Park
- Study Area Boundary
- Project Study_Area_Alg to NAD83, UTM zone 18N to create
AlgonquinStudyAreaUTM.shp
- Project Study_Area_Alg to NAD83, UTM zone 18N to create
- Canopy Cover
- Environment Settings: Processing Extent = AlgonquinStudyArea UTM, Snap Raster =
wflow_grdand Cell Size = 10m - Conversion Tools > To Raster > Polygon to Raster where input = ALGS_FRI, value field = STKG, cell assignment = Maximum_Area, cell size = 10 to produce
cancov_step1 - Spatial Analyst Tools > Conditional > Con where input conditional raster = _step1, expression = “Value” > 1, input true constant = 1, input false raster = _step1 to produce
cancov_step2 - Export
cancov_step2to produceAlgonquinPerCanopyCover.tif
- Environment Settings: Processing Extent = AlgonquinStudyArea UTM, Snap Raster =
- Climate
- Download climate station data from the National Climate Data and Information Archive (http://www.climate.weatheroffice.gc.ca/climateData/canada_e.html [link inactive])
- Process data to ensure consistency and assemble records from the different stations into two files: precipitation and temperature
- Geocode climate stations based on their coordinate positions to produce Ontario Climate Stations
- Select by Location from Ontario Climate Stations all records within 200 km of
AlgonquinStudyAreaUTM.shp - Export selected records to produce
ALGClimateStations_step1 - Project
ALGClimateStations_step1to NAD83, UTM zone 18N to createALGClimateStations_step2 - Environment Settings: Processing Extent =
AlgonquinStudyAreaUTM, Snap Raster =wflow_grdand Cell Size = 1000m - Use Spatial Analyst Tools > Interpolation > IDW 12 point variable search radius to interpolate raster surface for rain, snow and temperature
- Export raster datasets to produce
AlgonquinMeanMaxTemp.tif,AlgonquinMeanMinTemp.tif,AlgonquinMeanTemp.tif,AlgonquinAnnualRain.tif,AlgonquinAnnualSnow.tif
- Deforestation Risk
- Environment Settings: Processing Extent =
AlgonquinStudyAreaUTM, Snap Raster =wflow_grdand Cell Size = 10m - Export
AlgonquinSuccessionalStage_step2to produceAlgonquinDeforestationRisk_step1.shp - Add field bvdeforest to _step1 as integer
- Select by Attributes from
AlgonquinDeforestationRisk_step1where “devstage” In (“lowmgmt”, “lownat”, “depharv”, “depnat”, “newplant”, “newseed”, “newnat”, “seedtree”, “prepcut”,“seedcut”,“lastcut”) (3789 records selected) - Calculate bvdeforest = 2 (3789 records updated)
- Select by Attributes from _step1 where “
devstage” In (“ftgplant”, “ftgseed”, “ftgnat”, “thinpre”, “thincom”,“stripcut”,“firstcut”,“improve”) (25486 records selected) - Calculate
bvdeforest= 3 (25486 records updated) - Select by Attributes from
_step1where “devstage” In (“frstpass”, “prepcut”, “select”)(6915 records selected) - Calculate
bvdeforest= 3 (6915 records updated) - Select by attributes from
_step1where “polytype” <> “for” (24770 records selected) - Calculate bvdeforest = 1 (24770 records updated)
- Select by attributes from _step1 where “
formod” = “pf” (686 records selected) - Calculate
bvdeforest= 1 (686 records updated) - Conversion Tools > To Raster > Polygon to Raster where input =
AlgonquinDeforestationRisk _step1, value field =bvdeforest, cell assignment = maximum combined area to producedefor_step2 - Spatial Analyst Tools > Math > Logical > is null where input =
defor_step2to producedefor_step3 - Spatial Analyst Tools > Conditional > Con where input =
defor_step3, expression: value = 1, true = -9999, false =defor_step2to producedefor_step4 - Export
defor_step4to produceAlgonquinDeforestationRisk.tif
Value Description 1 No deforestation risk 2 Early deforestation risk 3 Pole deforestation risk 4 Mid deforestation risk
- Environment Settings: Processing Extent =
- Digital Elevation Model
- Environment Settings: Processing Extent =
AlgonquinStudyAreaUTM, Snap Raster =wflow_grdand Cell Size = 10m - Convert
alg_dem_finto TIFF file format with no compression to produce AlgonquinDEM.tif
- Environment Settings: Processing Extent =
- Evapotranspiration
- Environment Settings: Processing Extent =
AlgonquinStudyAreaUTM, Snap Raster =wflow_grdand Cell Size = 100m - Data Management > Raster > Raster Dataset > Create Raster Dataset where cell size = 100, pixel tye = 8 bit unsigned, spatial reference = NAD83 UTM Zone 18N & number of bands = 1 to produce
etr_step1 - Spatial Analyst Tools > Math > Logical > is null where input =
etr_step1to produceetr_step2 - Spatial Analyst Tools > Conditional > Con where input =
etr_step2, expression = “value” = 1, input true = 45.7, input false = -9999 to produceetr_step3(See http://atlas.nrcan.gc.ca/site/english/maps/archives/4thedition/environment/climate/049_50/?maxwidth=1600&maxheight=1400&mode=navigator&upperleftx=40&upperlefty=0&low [link inactive] for more details on the evapotranspiration value.) - Export
etr_step3to produce AlgonquinEvapotranspiration.tif
- Environment Settings: Processing Extent =
- Fire Frequency
- Export Forest_Fires to produce
AlgonquinForestFires_step1.shp - Project
AlgonquinForestFires_step1NAD83 zone 18N to produceAlgonquinForestFires_step2.shp - Add field tmp to
AlgonquinForestFires_step2.shpas integer - Calculate tmp = 1
- Conversion Tools > To Raster > Point to Raster where input = _step2, value = tmp, cell assignment = count, cellsize = 100m to produce
fires_step3 - Spatial Analyst > Math > Logical > is null where input =
fires_step3to producefires_step4 - Spatial Analyst > Conditional > Con where input =
fires_step4, expression: value = 1, true = 0, false =fires_step3to producefires_step5 - Spatial Analyst Tools > Reclass > Reclassify where input = _step5, reclass field = value (old value: new value >>> 0:1, 1:2, 2:2,3:3) and the change missing values to no data option selected to produce
fires_step6 - Export
fires_step6to produce AlgonquinFires.tif
Value Description 1 Low Risk 2 Moderate Risk 3 High Risk
- Export Forest_Fires to produce
- Hardwood: Softwood Ratio
- Environment Settings: Processing Extent =
AlgonquinStudyAreaUTM, Snap Raster =wflow_grdand Cell Size = 100m - Export ALG_FRI (using the coordinate system of the data frame set to NAD83 zone 18N) to produce AlgonquinFRI_step1.shp
- Add field bvHW as integer to AlgonquinFRI _step1 d. Calculate bvHW = Int([HW]) (60613 records updated)
- Conversion Tools > To Raster > Polygon to Raster where input =AlgonquinFRI _step1, value field = bvHW, cell assignment = maximum combined area to produce
HWSW_step2 - Data Management Tools > Projections and Transformations > Raster > Project Raster where input =
HWSW_step2, output coordinate system = NAD83 UTM zone 18N, resampling technique = nearest to produceHWSW_step3 - Export HWSW_step3 to produce
AlgonquinHardwoodSoftwood.tif
- Environment Settings: Processing Extent =
- Hydrography
- Environment Settings: Processing Extent =
AlgonquinStudyAreaUTM, Snap Raster =wflow_grdand Cell Size = 10m - Clip
wflow_grdto the Study Area Boundary using Raster Calculator to producehydrog_step1 - Export
hydrog_step1to produceAlgonquinHydrography.tif
- Environment Settings: Processing Extent =
- Lakes
- Environment Settings: Processing Extent =
AlgonquinStudyAreaUTM, Snap Raster =wflow_grdand Cell Size = 10m - Export OHN_Waterbody to produce
AlgonquinLakes_step1.shp - Project
AlgonquinLakes_step1to NAD83 zone 18N to produceAlgonquinLakes_step2.shp - Add field lake to
AlgonquinLakes_step2as integer - Calculate lake = 1 (10965 records updated)
- Conversion Tools > To Raster > Polygon to Raster where input =
AlgonquinLakes_step2, cell assignment = maximum combined area to producelakes_step3 - Spatial Analyst Tools > Math > Logical > is null where input =
lakes_step3to producelakes_step4 - Spatial Analyst Tools > Conditional > Con where input =
lakes_step4, expression: value = 1, true = 0, false =lakes_step3to producelakes_step5 - Export
lakes_step5to produceAlgonqiuinLakes.tif
Value Description 0 Lake absent 1 Lake present
- Environment Settings: Processing Extent =
- Land Cover
- Environment Settings: Processing Extent =
AlgonquinStudyAreaUTM, Snap Raster =wflow_grdand Cell Size = 25m - Clip
LULC2000to the boundary ofAlgonquinStudyAreaUTM.shpto createLULC2K_step1 - Project
LULC2K_step1to NAD83, UTM zone 18N to createLULC2K_step2 - Export
LULC2K_step2to create AlgonquinLandCover2000.tif
- Environment Settings: Processing Extent =
- Moose Area
- Export Calving_Fawning_Site to produce
AlgonquinMooseArea_step1.shp - Project AlgonquinMooseArea _step1 to NAD83 zone 18N to produce AlgonquinMooseArea _step2.shp
- Add field tmp to AlgonquinMooseArea _step2 as integer
- Calculate tmp = 1 (104 records updated)
- Environment Settings: Processing Extent =
AlgonquinStudyAreaUTM, Snap Raster =wflow_grdand Cell Size = 10m - Conversion Tools > To Raster > Polygon to Raster where input =
_step2, value field = tmp, cell assignment = maximum_combined_area, cell size = 10 to producemoose_step3 - Spatial Analyst > Math > Logical > is null where input =
moose_step3to producemoose_step4 - Spatial Analyst > Conditional > Con where input =
moose_step4, expression: value = 1, true = 0, false =moose_step3to producemoose_step5
Value Description 1 Not moose area 2 Moose area - Export Aquatic_Feeding_Area to produce
AlgonquinMooseArea_step6.shp- Project
AlgonquinMooseArea_step6to NAD83 zone 18N to produceAlgonquinMooseArea_step7.shp - Add field tmp to AlgonquinMooseArea _step7 as integer
- Calculate tmp = 1 (3184 records updated)
- Conversion Tools > To Raster > Polygon to Raster where input = AlgonquinMooseArea _step7, value field = tmp, cell assignment = maximum_combined_area, cell size = 10 to produce
moose_step8 - Spatial Analyst > Math > Logical > is null where input =
moose_step8to producemoose_step9 - Spatial Analyst > Conditional > Con where input =
moose_step9, expression: value = 1, true = 0, false =moose_step8to producemoose_step10
Value Description 1 Not moose area 2 Moose area - Spatial Analyst > Math > Plus where input 1 =moose _step5, input 2 =
moose_step10to producemoose_step11
Value Description 1 Not moose area 2 Moose area 3 Multiple use moose area - Spatial Analyst > Reclass > Reclassify where input =
moose_step11, reclass field = value (old value : new value >>> 0:1, 1:2, 2:2; 1) to producemoose_step12 - Export
moose_step12to produce AlgonquinMooseHabitat.tif
Value Description 1 Not moose habitat area 2 Moose habitat area
- Export Calving_Fawning_Site to produce
- Nest sites
- Export Nesting_Site to produce
AlgonquinNestSites_step1.shp - Project
AlgonquinNestSites_step1to NAD83 zone 18N to produce,AlgonquinNestSites_step2.shp - Add field tmp to
AlgonquinNestSites_step2as integer - Calculate tmp =1
- Conversion Tools > To Raster > Point to Raster where input =
AlgonquinNestSites_step2, value = tmp, cell assignment = count to producenest_step3 - Spatial Analyst > Math > Logical > is null where input =
nest_step3to producenest_step4 - Spatial Analyst > Conditional > Con where input =
nest_step4, expression: value = 1, true = 0, false =nest_step3to producenest_step5 - Export
nest_step5to produceAlgonquinNestingHabitat.tif
- Export Nesting_Site to produce
- Park Infrastructure Points (with cottages)
- Environment Settings: Processing Extent =
AlgonquinStudyAreaUTM, Snap Raster =wflow_grdand Cell Size = 150m - Export Ontario_Parks_Infrastructure_Point to produce
AlgonquinParkInfrastructurePoint_step1.shp - Project
AlgonquinParkInfrastructurePoint_step1to NAD83 zone 18N to produceAlgonquinParkInfrastructurePoint_step2.shp - Add field tmp to
AlgonquinParkInfrastructurePoint_step2as integer - Calculate tmp = 1
- Export
AlgonquinParkLeaseResidential_pointto produceAlgonquinParkInfrastructurePoint_step3.shp - Project
AlgonquinParkInfrastructurePoint_step3to NAD83 zone 18N to produceAlgonquinParkInfrastructurePoint_step4.shp - Add field tmp to AlgonquinParkInfrastructurePoint _step4 as integer
- Calculate tmp = 1
- Export Commercial_Lease_point to produce
AlgonquinParkInfrastructurePoint_step5.shp - Project
AlgonquinParkInfrastructurePoint_step5to NAD83 zone 18N to produceAlgonquinParkInfrastructurePoint_step6.shp - Add field tmp to AlgonquinParkInfrastructurePoint _step6 as integer
- Calculate tmp = 1
- Data Management Tools > General > Merge where input =
AlgonquinParkInfrastructurePoint _step2,AlgonquinParkInfrastructurePoint _step4, AlgonquinParkInfrastructurePoint _step6 to produceAlgonquinParkInfrastructurePoint_step7.shp - Conversion Tools > To Raster > Point to Raster where input =
AlgonquinParkInfrastructurePoint_step7, value = tmp, cell assignment = sum to produceinfra_step8 - Spatial Analyst > Math > Logical > is null where input =
infra_step8to produceinfra_step9 - Spatial Analyst > Conditional > Con where input =
infra_step9, expression: value = 1, true = 0, false =infra_step8to produceinfra_step10 - Spatial Analyst > Conditional > Con where input =
infra_step10, expression: value >= 1, true = 1, false = 0 to produceinfra_step11 - Export
infra_step11to produce AlgonquinParkInfrastructurePoints.tif
- Environment Settings: Processing Extent =
- Park Infrastructure Points (with no cottages)
- Export
AlgonquinParkInfrastructurePoint_step2.shpto produceAlgonquinParkInfrastructurePointNoCottages_step1.shp - Conversion Tools > To Raster > Point to Raster where input =
_step1, value =tmp, cell assignment = sum to produceinfranc_step2 - Spatial Analyst > Math > Logical > is null where input =
infranc_step2to produceinfranc_step3 - Spatial Analyst > Conditional > Con where input =
infranc_step3, expression: value = 1, true = 0, false = infranc _step2 - Spatial Analyst > Conditional > Con where input =
infranc_step4, expression: value >= 1, true = 1, false = 0 - Spatial Analyst Tools > Generalization > Aggregate where input =
infranc_step5, cell factor = 10, aggregation technique = maximum, expand extent, ignore no data - Export
infranc_step6to produceAlgonquinParkInfrastructurePointsNoCottages.tif
- Export
- Railways
- Export Railway to produce
AlgonquinRailway_step1.shp - Project
AlgonquinRailway_step1to NAD83 UTM zone 18N to produceAlgonquinRailway_step2.shp - Export
AlgonquinRailway_step2to produceAlgonquinRailway.shp
- Export Railway to produce
- Recreational Use – canoeing and kayaking
- Geoprocessing > Environments > Processing Extent = AlgonquinStudyArea, Geoprocessing > Environments > Snap Raster =
wflow_grd, Geoprocessing > Environments > Raster Analysis > Cell Size = 150m - Export OHN_waterbody to produce
AlgonquinCanoeUse_step1.shp - Data Management Tools > Projections and Transformations > Feature > Project where input = _step1, output coordinate system = NAD83 UTM zone 18N to produce
AlgonquinCanoeUse_step2.shp - Add field Canoe Use to Algonquin Canoe Use _step2 as integer
- Select all visitor responses indicating canoe and kayak use in Algonquin Provincial Park from the 2011 Ontario Parks Backcountry Visitor Survey (June 1, 2011)
- Use the list of selected responses to identify lakes that were used for recreation (Note: information extracted from survey responses was supplemented with additional recreational sites identified by MNR staff)
- Select the lakes used for recreation from
AlgonquinCanoeUse_step2h. - Export selected records to produce
AlgonquinCanoeUse_step3.shp - Analysis Tools > Proximity > Buffer where input =
AlgonquinCanoeUse_step3, distance = 125m, side type = full, dissolve type = list: official_N to produceAlgonquinCanoeUse_step4 - Conversion Tools > To Raster > Point to Raster where input =
AlgonquinCanoeUse_step4, value = tmp, cell assignment = maximum to producecanuse_step5 - Spatial Analyst > Math > Logical > is null where input =
canuse_step5to producecanuse_step6 - Spatial Analyst > Conditional > Con where input =
canuse_step6, expression: value = 1, true = 0, false =canuse_step5to producecanuse_step7 - Export
canuse_step7to produce AlgonquinCanoeUse.tif
- Geoprocessing > Environments > Processing Extent = AlgonquinStudyArea, Geoprocessing > Environments > Snap Raster =
- Recreational Use – backcountry hiking
- Geoprocessing > Environments > Processing Extent = AlgonquinStudyArea, Geoprocessing > Environments > Snap Raster =
wflow_grd, Geoprocessing > Environments > Raster Analysis > Cell Size = 150m - Export Hiking_Zones_Lakes_join (layer provided by MNR staff) to produce
AlgonquinHikingUse_step1.shp - Data Management Tools > Projections and Transformations > Feature > Project where input =
AlgonquinHikingUse_step1.shp, output coordinate system = NAD83 UTM zone 18N to produceAlgonquinHikingUse_step2.shp - Add field HikingUse to
AlgonquinHikingUse_step2as integer - Calculate field HikingUse = 1
- Conversion Tools > To Raster > Polygon to Raster where input =
AlgonquinHikingUse_step2, value = HikingUse, cell assignment = maximum_combined_area to producehikeuse_step3 - Spatial Analyst > Math > Logical > is null where input =
hikeuse_step3to producehikeuse_step4 - Spatial Analyst > Conditional > Con where input =
hikeuse_step4, expression: value = 1, true = 0, false =hikeuse_step3to producehikeuse_step5 - Export
hikeuse_step5to produce AlgonquinHikeUse.tif
- Geoprocessing > Environments > Processing Extent = AlgonquinStudyArea, Geoprocessing > Environments > Snap Raster =
- Recreational Use – front country campground
- Geoprocessing > Environments > Processing Extent =
AlgonquinStudyArea, Geoprocessing > Environments > Snap Raster =wflow_grd, Geoprocessing > Environments > Raster Analysis > Cell Size = 150m - Export Camp_Recreation (layer provided by MNR staff) to produce
AlgonquinCampgrounds_step1 - Data Management Tools > Projections and Transformations > Feature > Project where input =
AlgonquinCampgrounds_step1, output coordinate system = NAD83 UTM zone 18N to produceAlgonquinCampgrounds_step2 - Select by Attributes from
AlgonquinCampgrounds_step2where “label” In(“Achray”, “Brent”, “Canisbay”, “Coon”, “Kearney”, “Kiosk”, “Lake of Two Rivers”, “Mew”, “Pog”, “Rock”, “Tea”, “Whitefish”) - Export selected records to produce
AlgonquinCampgrounds_step3 - Analysis Tools > Proximity > Buffer where input =
AlgonquinCampgrounds_step3, distance = 125m, side type = full, dissolve type = list: Label to produceAlgonquinCampgrounds_step4 - Add field IsCamp to
AlgonquinCampgrounds_step4as integer - Calculate IsCamp = 1
- Conversion Tools > To Raster > Polygon to Raster where input =
AlgonquinCampgrounds_step4, value = IsCamp, cell assignment = maximum_combined_area, cell size = 250m to producecampgr_step5 - Spatial Analyst > Math > Logical > is null where input =
campgr_step5to producecampgr_step6 - Spatial Analyst > Conditional > Con where input =
campgr_step6, expression: value = 1, true = 0, false =campgr_step5to producecampgr_step7 - Export
campgr_step7to produceAlgonquinCampgroundUse.tif
- Geoprocessing > Environments > Processing Extent =
- Riparian Areas
- Export Virtual_Water_Flow to produce
AlgonquinRiparian_step1.shp - Project AlgonquinRiparian _step1 to NAD83 zone 18N to produce
AlgonquinRiparian_step2.shp - Environment Settings: Processing Extent =
AlgonquinStudyAreaUTM, Snap Raster =wflow_grdand Cell Size = 25m - Conversion Tools > To Raster > Polyline to Raster where input = _step2, value field = Enabled, cell assignment = maximum_length, cell size = 25m to produce
ripar_step3 - Spatial Analyst Tools > Math > Times where input 1 =
ripar_step3, input 2 =lulc2k_step2to produceripar_step4 - Spatial Analyst Tools > Reclass > Reclassify where input =
ripar_step4, reclass field = value (old value : new value >>> 1:2, 3:1, 5:1, 7:1, 10:1, 11:3, 12:3, 13:3, 20:3, 21:3, 22:3, 23:3, 25:2, 29:1) to produceripar_step5 - Export
ripar_step5to produceAlgonquinRiparianCondition.tifValue Description 1 Low quality riparian area 2 Moderate quality riparian area 3 High quality riparian area
- Export Virtual_Water_Flow to produce
- Roads
- Select the road segments that are inside the park and connected to other roads (371 records selected)
- Export selected records to produce
AlgonquinRoads_step1.shp - Project
AlgonquinRoads_step1.shpto NAD83 UTM zone 18N to produceAlgonquinRoads_step2.shp - Export
AlgonquinRoads_step2.shpto produceAlgonquinRoads.shp
- Slope
- Environment Settings: Processing Extent =
AlgonquinStudyAreaUTM, Snap Raster =wflow_grdand Cell Size = 10m - Convert alg_slope_fin to TIFF file format with no compression to produce AlgonquinSlope.tif
- Environment Settings: Processing Extent =
- Soil Drainage
- Environment Settings: Processing Extent =
AlgonquinStudyAreaUTM, Snap Raster =wflow_grdand Cell Size = 100m - Project Soils to NAD83 UTM zone 18N to produce
AlgonquinSoils_step1.shp - Convert Polygon (_step1) to raster where input = _step1, value field = drainage, cell assignment = maximum combined area, cell size = 100m to produce
soils_step2 - Export
soils_step2to produceAlgonquinSoilDrainage.tifwith the following attribute values:Value Description 1 Well drained soils 2 No Data 3 Poorly drained soils
- Environment Settings: Processing Extent =
- Spawning Areas
- Export Spawning_Area to produce
AlgonquinSpawningArea_step1.shp - Project AlgonquinSpawningArea _step1 to NAD83 zone 18N to produce AlgonquinSpawningArea _step2.shp
- Add field tmp to AlgonquinSpawningArea _step2 as integer
- Calculate tmp = 1 (47 records updated)
- Environment Settings: Processing Extent =
AlgonquinStudyAreaUTM, Snap Raster =wflow_grdand Cell Size = 10m - Conversion Tools > To Raster > Polygon to Raster where input = _step2, value field = tmp, cell assignment = maximum_area, cell size = 10 to produce
spawn_step3 - Spatial Analyst > Math > Logical > is null where input =
spawn_step3to producespawn_step4 - Spatial Analyst > Conditional > Con where input =
spawn_step4, expression: value = 1, true = 0, false =spawn_step3to producespawn_step5 - Export
spawn_step5to produceAlgonquinSpawningHabitat.tif
Value Description 1 Not a spawning area 2 Spawning area
- Export Spawning_Area to produce
- Successional Stage
- Environment Settings: Processing Extent =
AlgonquinStudyAreaUTM, Snap Raster =wflow_grdand Cell Size = 10m - Export ALG_FRI to produce
AlgonquinSuccessionalStage_step1.shp - Project
AlgonquinSuccessionalStage_step1to NAD83 zone 18N to produceAlgonquinSuccessionalStage_step2.shp - Add field
bvAGEtoAlgonquinSuccessionalStage_step2as integer - Calculate
bvAGE=AGE+ 2 (60613 records updated) - Add field
bvSucStagetoAlgonquinSuccessionalStage_step2as integer - Select by Attributes from
AlgonquinSuccessionalStage_step2where “polytype” In (“WAT”, “UCL”, “BFL”, “RCK”) (11619 records selected) - Calculate
bvSucStage= 1 (11619 records updated) - Select by Attributes from
AlgonquinSuccessionalStage_step2where “polytype” In (“DAL”, “GRS”, “BSH”, “TMS”, “OMS”) (13151 records selected) - Calculate
bvSucStage= 2 (13151 records updated) - Select by Attributes from
AlgonquinSuccessionalStage_step2where “polytype” = “FOR” and “bvAGE” < 15 (638 records selected) - Calculate
bvSucStage= 2 (638 records updated) - Select by Attributes from
AlgonquinSuccessionalStage_step2where “polytype” = “FOR” and (“bvAGE” >= 15 and “bvAGE” <30) (724 records selected) - Calculate
bvSucStage= 3 (724 records updated) - Select by Attributes from
AlgonquinSuccessionalStage_step2where “polytype” = “FOR” and (“bvAGE” >= 30 and “bvAGE” < 100) (8174 records selected) - Calculate
bvSucStage= 4 (8174 records updated) - Select by Attributes from
AlgonquinSuccessionalStage_step2where “polytype” = “FOR” and (“bvAGE” >= 100 and “bvAGE” < 150) (15463 records selected) - Calculate
bvSucStage= 5 (15463 records updated) - Select by Attributes from
AlgonquinSuccessionalStage_step2where “polytype” = “FOR” and (“bvAGE” >= 150) (10844 records selected) - Calculate
bvSucStage= 6 (10844 records updated) - Export old_growth_forest to produce
AlgonquinSuccessionalStage_step3.shp - Project
AlgonquinSuccessionalStage_step3to NAD83 zone 18N to produceAlgonquinSuccessionalStage_step4.shp - Add field
OGForesttoAlgonquinSuccessionalStage_step4as integer - Calculate
OGForest= 6 (10599 records updated) - Conversion Tools > To Raster > Polygon to Raster where input =
AlgonquinSuccessionalStage_step2, value field =bvSucStage, cell assignment = maximum combined area to producesucstg_step5 - Conversion Tools > To Raster > Polygon to Raster where input = _step4, value field =
OGForest, cell assignment = maximum combined area to producesucstg_step6 - Spatial Analyst Tools > Math > Logical > is null where input =
sucstg_step6to producesucstg_step7 - Spatial Analyst Tools > Conditional > Con where input =
suvstg_step7, expression = “value” = 1, input true = 0, input false = 1000 to producesucstg_step8 - Spatial Analyst > Math > Plus where input 1 =
sucstg_step5, input 2 =sucstg_step8to producesucstg_step9 - Spatial Analyst > Reclass > Reclassify where input = _step9 reclass field = value (old value : new value >>> 1:1, 2:2, 3:3, 4:4, 5:5, 6:6,> 1000:6) to produce
sucstg_step10 - Export
sucstg_step10to produce AlgonquinSuccessionalStage.tif
Value Description 1 No succession 2 Early succession 3 Pole succession 4 Mid succession 5 Late succession 6 Old growth
- Environment Settings: Processing Extent =
- Towers
- Export Towers to produce
AlgonquinTowers_step1.shp - Project
AlgonquinTowers_step1to NAD83 UTM zone 18N to produceAlgonquinRailway_step2 - Add field tmp to AlgonquinRailway _step2 as integer
- Calculate tmp = 1
- Conversion Tools > To Raster > Point to Raster where input =
_step2, value = tmp, cell assignment = count to producetowers_step3 - Spatial Analyst > Math > Logical > is null where input =
towers_step3toproducetowers_step4 - Spatial Analyst > Conditional > Con where input =
towers_step4, expression: value = 1, true = 0, false = towers _step3 to producetowers_step5 - Export
towers_step5to produce AlgonquinTowers.tif
- Export Towers to produce
- Trails
- Export Trail_Segment to produce
AlgonquinTrails_step1.shp - Project
AlgonquinTrails_step1.shpto NAD83 UTM zone 18N to produceAlgonquinTrails_step2.shp - Export
AlgonquinTrails_step2.shpto produceAlgonquinTrails.shp
- Export Trail_Segment to produce
- Utility Lines
- Export Utility_Line to produce
AlgonquinUtilityLines_step1.shp - Project
AlgonquinUtilityLines_step1to NAD83 UTM zone 18N to produceAlgonquinUtilityLines_step2.shp - Export
AlgonquinUtilityLines_step2to produceAlgonquinUtilityLines.shp
- Export Utility_Line to produce
- Wintering Areas
- Select By Location from Wintering_Area all records that intersect
AlgonquinStudyAreaUTM(52 records selected) - Export selected records to produce
AlgonquinWinteringArea_step1.shp - Project AlgonquinWinteringArea _step1 to NAD83 zone 18N to produce AlgonquinWinteringArea _step2.shp
- Select by Attributes from _step2 where “habitat_ra” = “ ” (26 records selected)
- Calculate habitat_ra = “low”
- Environment Settings: Processing Extent =
AlgonquinStudyAreaUTM, Snap Raster =wflow_grdand Cell Size = 10m - Conversion Tools > To Raster > Polygon to Raster where input = _step2, value field = habitat_ra, cell assignment = maximum_area, cell size = 10 to produce
winter_step3 - Spatial Analyst > Math > Logical > is null where input =
winter_step3to producewinter_step4 - Spatial Analyst > Conditional > Con where input =
winter_step4, expression: value = 1, true = 0, false =winter_step3to producewinter_step5 - Spatial Analyst > Reclass > Reclassify where input =
winter_step5, reclass field = value (old value : new value >>> 0:1, 1:4, 2:2, 3:3, 4:5) to producewinter_step6 - Export
winter_step6to produceAlgonquinWinteringAreas.tif
Value Description 1 Not a wintering area 2 Low quality wintering area 3 Moderate quality wintering area 4 High quality wintering area 5 Very High quality wintering area
- Select By Location from Wintering_Area all records that intersect
Appendix 5.2: Lake of the Woods Region
- Study Area
Export Study_Area_Lake_of_The_Woodsto produceLOWStudyArea_step1.shp b.Project LOWStudyArea_step1to NAD83 zone 15N to produceLOWStudyArea_step2.shp- Export
LOWStudyArea_step2to produceLakeOfTheWoodsStudyArea.shp
- Agricultural Use in Floodplains
- Geoprocessing > Environments > Processing Extent =
LOWStudyArea, Geoprocessing > Environments > Snap Raster =z15_wfg, Geoprocessing > Environments > Raster Analysis > Cell Size =z15_wfg(20m) - Spatial Analyst Tools > Map Algebra > Raster Calculator where expression = “lc2000” == 25 to produce
agflood_step1 - Add field IsFloodPln to
LOWFloodplain_step7as integer - Calculate IsFloodPln = 1
- Conversion Tools > To Raster > Polygon to Raster where input =
LOWFloodplain_step7, value field = IsFloodPln, cell assignment = maximum_area to produceagflood_step2 - Spatial Analyst Tools > Reclass > Reclassify where input =
agflood_step2, reclass field = value to produceagflood_step3 - Spatial Analyst Tools > Math > Times where input 1 =
agflood_step1, input 2 =agflood_step3to produceagflood_step4 - Export
agflood_step4to produceLakeOfTheWoodsFloodplainAgriculture.tif
- Geoprocessing > Environments > Processing Extent =
- Canopy Cover
- Environment Settings: Processing Extent =
LakeOfTheWoodsStudyArea, Snap Raster =z15_wfgand Cell Size = 20m - Conversion Tools > To Raster > Polygon to Raster where input =
LOWSuccessionalStage_step2, value field = STKG, cell assignment= maximum_area to producecancov_step1 - Spatial Analyst Tools > Conditional > Con where input conditional raster =
cancov_step1, expression = “value” > 1, input true constant = 1, input false raster =cancov_step1to producecancov_step2 - Export_step2 to produce LakeOfTheWoodsPerCanopyCover.tif
- Environment Settings: Processing Extent =
- Census
- Download file transfer from Adam Gryck (see email 6 January 2012) to produce Ontario_Dissemination_Population
- Unzip contents of file to produce Ontario_Dissemination_Population.shp
- Select by Location from Ontario_Dissemination_Population all records that intersect Study_Area_Lake_of_the_Woods
- Remove from selection the extremely large division (
CSDUID= 3560090) from the selection - Export selected records to produce
LOWDisseminationArea_step1to produceLOWDisseminationArea_step1 - Data Management Tools > Projections and Transformations > Feature > Project where input = _step1, output coordinate system = NAD83 UTM zone 15N to produce
LOWDisseminationArea_step2 - Conversion Tools > To Raster > Polygon to Raster where input =
LOWStreams_step2, value = Enabled, cell assignment = maximum combined length to produce LOW_step3 - Spatial Analyst Tools > Reclass > Reclassify where input = _step3, reclass field = Value to produce LOW_step4
- Data Management Tools > Projections and Transformations > Feature > Project where input =
OHN_Waterbody, output coordinate system = NAD83 UTM zone 15N to produceLOWDisseminationArea_step5 - Conversion Tools > To Raster > Polygon to Raster where input = _step3, value = tmp, cell assignment = maximum combined area, cell size = 50m to produce LOW_step6
- Spatial Analyst Tools > Reclass > Reclassify where input = _step6, reclass field = Value to produce LOW_step7
- Spatial Analyst Tools > Reclass > Reclassify where input =
lulc2k_step3, reclass field = Value to produce LOW_step8 - Data Management Tools > Projections and Transformations > Feature > Project where input = protected_area_addition, output coordinate system = NAD83 UTM zone 15N to produce
LOWDisseminationArea_step9 - Data Management Tools > Projections and Transformations > Feature > Project where input =
conservation_reserve, output coordinate system = NAD83 UTM zone 15N to produceLOWDisseminationArea_step10 - Data Management Tools > Projections and Transformations > Feature > Project where input =
prov_park_regulatec, output coordinate system = NAD83 UTM zone 15N to produceLOWDisseminationArea_step11 - Add field tmp to _step9, _step10, _step11 as integer
- Calculate tmp = 1
- Conversion Tools > To Raster > Polygon to Raster where input = _step9, value = tmp, cell assignment = maximum combined area, cell size = 50m to produce
LOW_step12 - Spatial Analyst Tools > Reclass > Reclassify where input =
LOW_step12to produceLOW_step13 - Conversion Tools > To Raster > Polygon to Raster where input = _step10, value = tmp, cell assignment = maximum combined area, cell size = 50m to produce
LOW_step14 - Spatial Analyst Tools > Reclass > Reclassify where input = _step14 to produce
LOW_step15 - Conversion Tools > To Raster > Polygon to Raster where input = _step11, value = tmp, cell assignment = maximum combined area, cell size = 50m to produce
LOW_step16 - Spatial Analyst Tools > Reclass > Reclassify where input = _step16 to produce
LOW_step17 - Spatial Analyst Tools > Map Algebra > Raster Calculator: “low_step4” + “low_step7” + “low_step8” + “low_step13” + “low_step15” + “low_step17” to produce
LOW_step18 - Spatial Analyst Tools > Reclass > Reclassify where input = _step18 to produce
LOW_step19 - Analysis Tools > Overlay > Identity where input = _step2, identity =
LOWStudyAreaand join attributes = all to produceLOWDisseminationArea_step20 - Run make table query qry_
LOWDisseminationArea_step21ato createLOWDisseminationArea_step21aby grouping the records of _step20 on DAUID and summing the Shape_Area to produceLOWDisseminationArea_step21a - Run make table query qry_
LOWDisseminationArea_step21bto createLOWDisseminationArea_step21aby grouping the records of _step15 on DAUID and summing the Shape_Area where tmp_1 = 1 to produceLOWDisseminationArea_step21b - Run make table query qry_
LOWDisseminationArea_step21cto createLOWDisseminationArea_step21cby joining _step21a & _step21b on DAUID and DAUID (respectively) and calculating per_in_park = [LOWDisseminationArea_step21b].[SumOfShape_Area]/[LOWDisseminationArea_step21a].[SumOfShape_Area](72 records written to file) to produceLOWDisseminationArea_step21c - Run make table query qry_
LOWDisseminationArea_step21dto createLOWDisseminationArea_step21dby joining _step21c to _step2 and calculating pop_in_park = Round([LOWDisseminationArea_step2].[DApop2006]*[LOWDisseminationArea_step21c].[per_in_park],0) to produceLOWDisseminationArea_step21d - Select by Attributes from _step20 where tmp_1 = 1
- Export selected records to produce
LOWDisseminationArea_step22 - Run make table query qry_
LOWDisseminationArea_step24to createLOWDisseminationArea_step24by joining _step21d and _step23 to _step22 and calculating dev_area = [LOWDisseminationArea_step22].[Shape_Area]*[LOWDisseminationArea_step23].[mean] (72 records written to file) to produceLOWDisseminationArea_step24 - Run make table query qry_
LOWDisseminationArea_step25to createLOWDisseminationArea_step25to calculate pop_dens = ([_step24].[pop_in_park]/[_step24].[da_buildable_area]) to produceLOWDisseminationArea_step25 - Manually calculate the value for DAUID = 35600302 to equal 0
- Conversion Tools > To Raster where input = _step22, value = pop_dens to produce
LOW_step26 - Spatial Analyst Tools > Math > Times where input1 = _step19, input2 =_step26 to produce
LOW_step27 - Spatial Analyst Tools > Math > Logical > is null where input = _step27 to produce
LOW_step28 - Spatial Analyst Tools > Conditional > Con where input = _step28, expression: value = 1, true = 0.5, false = _step27 to produce
LOW_step29 - Export _step29 to produce
LakeOfTheWoodsPopulationDensity.tif
- Climate
- Download climate station data from the National Climate Data and Information Archive (http://www.climate.weatheroffice.gc.ca/climateData/canada_e.html [link inactive])
- Process data to ensure consistency and assemble records from the different stations into two files: precipitation and temperature
- Geocode climate stations based on their coordinate positions to produce
OntarioClimateStations - Select by Location from OntarioClimateStations all records within 200 km of
LakeOfTheWoodsStudyArea.shp - Export selected records to produce
LOWClimateStations_step1 - Project
LOWClimateStations_step1to NAD83, UTM zone 15N to createLOWClimateStations_step2 - Environment Settings: Processing Extent =
LakeOfTheWoodsStudyArea, Snap Raster =z15_wfgand Cell Size = 1000m - Use Spatial Analyst Tools > Interpolation > IDW 12 point variable search radius to interpolate raster surface for rain, snow and temperature
- Export raster datasets to produce
LakeOfTheWoodsMeanMaxTemp.tif, LakeOfTheWoodsMeanMinTemp.tif, LakeOfTheWoodsMeanTemp.tif, LakeOfTheWoodsAnnualRain.tif, LakeOfTheWoodsAnnualSnow.tif
- Dams
- Environment Settings: Processing Extent =
LakeOfTheWoodsStudyArea, Snap Raster =z15_wfgand Cell Size = 25m - Export dam_and_barrier to produce
LOWDams_step1.shp - Project
LOWDams_step1to NAD83 zone 15N to produceLOWDams_step2 - Conversion Tools > To Raster > Point to Raster where input =dam_and_barrier, value field = barrier_he, cell assignment = maximum, cell size = 20 to produce
dams_step3 - Spatial Analyst Tools > Math > Logical > is null where input =
dams_step3to producedams_step4 - Spatial Analyst Tools > Conditional > Con where input conditional raster =
dams_step4, expression = “value” = 1, input true constant = 0, input false raster =dams_step3to producedams_step5 - Export _step5 to produce
LakeOfTheWoodsDams.tif
- Environment Settings: Processing Extent =
- DEM
- Export
lws_dem_finas TIFF file with no compression to produceLakeOfTheWoodsDEM.tif
- Export
- Evapotranspiration
- Environment Settings: Processing Extent =
LakeOfTheWoodsStudyArea, Snap Raster =z15_wfgand Cell Size = 100m - Data Management > Raster > Raster Dataset > Create Raster Dataset where cell size = 100, pixel tye = 8 bit unsigned, spatial reference = NAD83 UTM zone 15N & number of Bands = 1 to produce
etr_step1 - Spatial Analyst Tools > Math > Logical > is null where input = _step1 to produce
etr_step2 - Spatial Analyst Tools > Conditional > Con where input = _step2, expression = “value” = 1, input true = 53.5, input false = -9999 to produce
etr_step3(See http://atlas.nrcan.gc.ca/site/english/maps/archives/4thedition/environment/climate/049_50/?maxwidth=1600&maxheight=1400&mode=navigator&upperleftx=40& upperlefty=0&lowerrightx=1640&lowerrighty=1136&mag=0.25 [link inactive] for more details on the evapotranspiration value.) - Export _step3 to produce
LakeOfTheWoodsEvapotranspiration.tif
- Environment Settings: Processing Extent =
- Floodplains
- Environment Settings: Processing Extent =
LakeOfTheWoodsStudyArea, Snap Raster =z15_wfgand Cell Size = 25m - Spatial Analyst Tools > Reclass > Reclassify where input =
strgrad_step3, reclass field = value, old value : new value (0:0, 0 - 5:4, 5 -10:3, 10 - 25:2, 25 - 60:1) and the change missing values to no data option selected to producefldpln_step1 - Conversion Tools > From Raster > Raster to Polygon where input =
fldpln_step1to produceLOWFloodplain_step2.shp - Add field Buffer to
LOWFloodplain_step1 as integer - Calculate Buffer = [gridcode] * 15
- Select by Attributes from
LOWFloodplain_step2where gridcode = 1 - Export selected records to produce
LOWFloodplain_step3a.shp - Select by Attributes from
LOWFloodplain_step2where gridcode = 2 - Export selected records to produce
LOWFloodplain_step3b.shp - Select by Attributes from
LOWFloodplain_step2where gridcode = 3 - Export selected records to produce
LOWFloodplain_step3c.shp - Select by Attributes from
LOWFloodplain_step2where gridcode = 4 - Export selected records to produce
LOWFloodplain_step3d.shp - Analysis Tools > Proximity > Buffer where input features =
LOWFloodplain_step3a, distance = 15m, side type = outside only, dissolve type = all to produceLOWFloodplain_step4a.shp - Analysis Tools > Proximity > Buffer where input features =
LOWFloodplain_step3b, distance = 15m, side type = outside only, dissolve type = all to produceLOWFloodplain_step4b.shp - Analysis Tools > Proximity > Buffer where input features =
LOWFloodplain_step3c, distance = 15m, side type = outside only, dissolve type = all to produceLOWFloodplain_step4c.shp - Analysis Tools > Proximity > Buffer where input features =
LOWFloodplain_step3d, distance = 15m, side type = outside only, dissolve type = all to produceLOWFloodplain_step4d.shp - Analysis Tools > Overlay > Union where input features =
LOWFloodplain_step4a-LOWFloodplain_step4d - Data Management Tools > Generalization > Dissolve where input = _step5, dissolve field = fid_lofflo to produce
LOWFloodplain_step6.shp - Select by Attributes from _step6 where “FID_
LOWFlo” = 0 - Export selected records to produce
LOWFloodplain_step7.shp - Export
LOWFloodplain_step7.shpto produceLakeOfTheWoodsFloodplains.shp
- Environment Settings: Processing Extent =
- Hydrography
- Environment Settings: Processing Extent =
LakeOfTheWoodsStudyArea, Snap Raster =z15_wfgand Cell Size = 25m - Export
z15_wfgto produce LakeOfTheWoodsHydrography.tif
- Environment Settings: Processing Extent =
- Impervious Surface
- Environment Settings: Processing Extent =
LakeOfTheWoodsStudyArea, Snap Raster =z15_wfgand Cell Size = 20m - Data Management Tools > Raster > Raster Processing > Clip where input =
imperviousGlobal.tif, extent =LakeOfTheWoodsStudyArea,NoData= -9999 to produceimperv_step1 - Spatial Analyst Tools > Reclass > Reclassify where input =
imperv_step1, reclass field = value (old value : new value >>> 0 – 5:1, 5 –10:2, 10 – 20:3, 20 – 50:4, 50 – 80:5, 80 – 100:6) to produceimperv_step2
Value Description 1 Very Low Impervious Cover 2 Low Impervious Cover 3 Moderately Low Impervious Cover 4 Moderately High Impervious Cover 5 High Impervious Cover 6 Very High Impervious Cover
- Environment Settings: Processing Extent =
- Land Cover
- Environment Settings: Processing Extent =
LakeOfTheWoodsStudyArea, Snap Raster =z15_wfgand Cell Size = 25m - Data Management Tools > Raster > Raster Processing > Clip where input =
LULC2000, output extent =LakeOfTheWoodsStudyAreato produceLULC2K_step1 - Project
LULC2K_step1to NAD83 zone 15N to produceLULC2K_step2 - Spatial Analyst > Math > Int where input =
LULC2K_step2to produceLULC2K_step3 - Export
LULC2K_step3to produceLakeOfTheWoodsLandCover.tif
- Environment Settings: Processing Extent =
- Slope
- Export
lws_slope_finas TIFF file with no compression to produceLakeOfTheWoodsSlope.tif
- Export
- Soil Drainage
- Environment Settings: Processing Extent =
LakeOfTheWoodsStudyArea, Snap Raster =z15_wfgand Cell Size = 100m - Project Soils to NAD83 zone 15N to produce
LOWSoils_step1 - Conversion Tools > To Raster > Polygon to Raster where input =
soils_step1, value field = drainage, cell assignment = maximum combined area, cell size = 100m to producesoils_step2 - Export
soils_step2to produceLakeOfTheWoodsSoilDrainage.tif
Value Description 1 No Data 2 Poorly drained soils
- Environment Settings: Processing Extent =
- Streams
- Export virtual_flow_segment to produce
LOWStreams_step1.shp - Project
LOWStreams_step1to NAD83 zone 15N to produceLOWStreams_step2.shp - Export
LOWStreams_step2to produceLOWStreams.shp
- Export virtual_flow_segment to produce
- Stream Gradient
- Environment Settings: Processing Extent =
LakeOfTheWoodsStudyArea, Snap Raster =z15_wfgand Cell Size = 20m - Spatial Analyst > Math > Times where input 1 = lws_slope_fin, input 2 =
z15_wfgto producestrgrad_step1 - Spatial Analyst > Math > Logical > is null where input =
strgrad_step1to producestrgrad_step2 - Spatial Analyst > Conditional > Con where input =
strgrad_step2, condition: Value = 0, true =strgrad_step1, false = 0 to producestrgrad_step3 - Export
strgrad_step3to produceLakeOfTheWoodsStreamGradient.tif
- Environment Settings: Processing Extent =
- Successional Stage
- Environment Settings: Processing Extent =
LakeOfTheWoodsStudyArea, Snap Raster =z15_wfgand Cell Size = 20m - Export lake_woods_FRI to produce
LOWSuccessionalStage_step1.shp - Project
LOWSuccessionalStage_step1to NAD83 zone 15N to produceLOWSuccessionalStage_step2.shp - Add field
bvAGEtoAlgonquinSuccessionalStage_step2as integer - Calculate
bvAGE=AGE+ 8 (8 records updated) - Add field
bvSucStagetoLOWSuccessionalStage_step2as integer - Select by Attributes from
LOWSuccessionalStage_step2where “polytype” In (“WAT”, “UCL”, “BFL”, “RCK”) (24664 records selected) - Calculate
bvSucStage= 1 (24664 records updated) - Select by Attributes from
LOWSuccessionalStage_step2where “polytype” In (“DAL”, “GRS”, “BSH”, “TMS”, “OMS”) (16766 records selected) - Calculate
bvSucStage= 2 (16766 records updated) - Select by Attributes from
LOWSuccessionalStage_step2where “polytype”= “FOR” and “bvAGE” < 15 (2618 records selected) - Calculate
bvSucStage= 2 (2618 records updated) - Select by Attributes from
LOWSuccessionalStage_step2where “polytype”= “FOR” and (“bvAGE” >= 15 and “bvAGE” <30) (5888 records selected) - Calculate
bvSucStage= 3 (5888 records updated) - Select by Attributes from
LOWSuccessionalStage_step2where “polytype”= “FOR” and (“bvAGE” >= 30 and “bvAGE” < 100) (26595 records selected) - Calculate
bvSucStage= 4 (26595 records updated) - Select by Attributes from
LOWSuccessionalStage_step2where “polytype”= “FOR” and (“bvAGE” >= 100 and “bvAGE” < 150) (8891 records selected) - Calculate
bvSucStage= 5 (8891 records updated) - Select by Attributes from
LOWSuccessionalStage_step2where “polytype”= “FOR” and (“bvAGE” >= 150) (1005 records selected) - Calculate
bvSucStage= 6 (1005 records updated) - Export old_growth_forest to produce
LOWSuccessionalStage_step3.shp - Project
LOWSuccessionalStage_step3to NAD83 zone 15N to produceLOWSuccessionalStage_step4.shp - Add field
OGForesttoLOWSuccessionalStage_step4as integer - Calculate
OGForest= 6 (4465 records updated) - Conversion Tools > To Raster > Polygon to Raster where input =
LOWSuccessionalStage_step2, value field =bvSucStage, cell assignment = maximum combined area to producesucstg_step5 - Conversion Tools > To Raster > Polygon to Raster where input =
LOWSuccessionalStage_step4, value field =OGForest, cell assignment = maximum combined area to producesucstg_step6 - Spatial Analyst Tools > Math > Logical > is null where input =
sucstg_step6to producesucstg_step7 - Spatial Analyst Tools > Conditional > Con where input =
suvstg_step7, expression = “value” = 1, input true = 0, input false = 1000 to producesucstg_step8 - Spatial Analyst > Math > Plus where input 1 =
sucstg_step5, input 2 =sucstg_step8to producesucstg_step9 - Spatial Analyst > Reclass > Reclassify where input = _step9 reclass field = value (old value : new value >>> 1:1, 2:2, 3:3, 4:4, 5:5, 6:6,> 1000:6) to produce
sucstg_step10 - Export
sucstg_step10to produceLakeOfTheWoodsSuccessionalStage.tif
Value Description 1 No succession 2 Early succession 3 Pole succession 4 Mid succession 5 Late succession 6 Old growth
- Environment Settings: Processing Extent =
- Water Supply Vegetation Type
- Environment Settings: Processing Extent =
LakeOfTheWoodsStudyArea, Snap Raster =z15_wfgand Cell Size = 25m - Spatial Analyst > Reclass> Reclassify where input =
LULC2K_step3(old value : new value >>> 1:1, 2:1, 25:2, 3:3, 5:3, 15:4, 16:4, 17:4, 18:4, 19:4, 20:4, 21:4, 22:4, 23:4,, 9:5, 10:5, 11:5, 12:5, 13:5, 7:6, 8:6) to produceLULC2K_step4 - Export
LULC2K_step4to produceLakeOfTheWodsWaterSupplyVegetationType.tif
Value Description 1 Water 2 Agriculture 3 Urban – Infrastructure – Rock 4 Bog – Fen – Marsh 5 Forest 6 Impaired Forest
- Environment Settings: Processing Extent =
- Watersheds
- Export
Quaternary_Watershed100707_lamto produceLakeOfTheWoodsQuaternaryWatersheds_step1.shp - Data Management Tools > Projections and Transformations > Feature > Project where input =
LakeOfTheWoodsQuaternaryWatersheds_step1, output coordinate system = NAD83, UTM zone 15N to produceLakeOfTheWoodsQuaternaryWatersheds_step2.shp - Select two watersheds (one on the north side, one on the south side) that contain park land and protected areas (
fmf_object= 1384501185 or 1384501180) - Export selected records to produce
LakeOfTheWoodsQuaternaryWatersheds.shp
- Export
Appendix 6. Additional mapped outputs for the recreational viewshed models
Appendix 6.1: Hiking
Figure 1: Aesthetic source value map for hiking users in Algonquin Provincial Park under the Baseline Scenario

Figure 2: Aesthetic sink value map for hiking users in Algonquin Provincial Park under the Baseline Scenario

Figure 3: Aesthetic use value map for hiking users in Algonquin Provincial Park under the Baseline Scenario
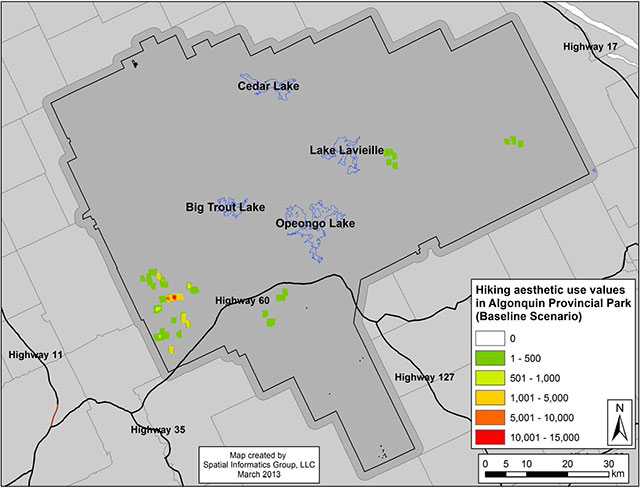
Figure 4: Aesthetic flow value map for hiking users in Algonquin Provincial Park under the Baseline Scenario

Figure 5: Aesthetic source value map for hiking users in Algonquin Provincial Park under the No Cottages Scenario
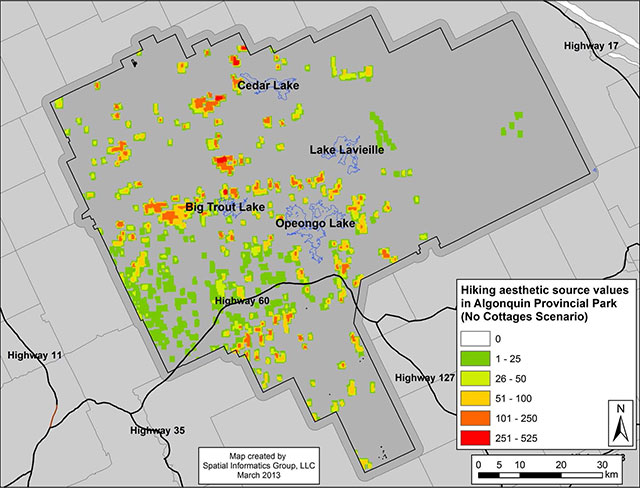
Figure 6: Aesthetic sink value map for hiking users in Algonquin Provincial Park under the No Cottages Scenario

Figure 7: Aesthetic use value map for hiking users in Algonquin Provincial Park under the No Cottages Scenario

Figure 8: Aesthetic flow value map for hiking users in Algonquin Provincial Park under the No Cottages Scenario

Figure 9: Difference in aesthetic flow values for hiking users in Algonquin Provincial Park (No Cottages Scenario - Baseline Scenario)

Figure 10: Economic value of aesthetic flows to hiking users in Algonquin Provincial Park ($CAD/yr) under the Baseline Scenario

Appendix 6.2: Campground users
Figure 1: Aesthetic source value map for campground users in Algonquin Provincial Park under the Baseline Scenario

Figure 2: Aesthetic sink value map for campground users in Algonquin Provincial Park under the Baseline Scenario

Figure 3: Aesthetic use value map for campground users in Algonquin Provincial Park under the Baseline Scenario

Figure 4: Aesthetic flow value map for campground users in Algonquin Provincial Park under the Baseline Scenario

Figure 5: Aesthetic source value map for campground users in Algonquin Provincial Park under the No Cottages Scenario

Figure 6: Aesthetic sink value map for campground users in Algonquin Provincial Park under the No Cottages Scenario

Figure 7: Aesthetic use value map for campground users in Algonquin Provincial Park under the No Cottages Scenario

Figure 8: Aesthetic flow value map for campground users in Algonquin Provincial Park under the No Cottages Scenario

Figure 9: Difference in aesthetic flow values for campground users in Algonquin Provincial Park (No Cottages Scenario - Baseline Scenario)

Figure 10: Economic value of aesthetic flows to campground users in Algonquin Provincial Park ($CAD/yr) under the Baseline Scenario

Footnotes
- footnote[1] Back to paragraph Double counting occurs when some component of the same benefit is measured twice, producing an inaccurately inflated value. For instance, including estimates of the value of pollination and the value of crops produced counts the valuation of pollination twice.
- footnote[*] Back to paragraph The definitions of urban and suburban are given in section 3.1.3 above.
- footnote[2] Back to paragraph Categorical data are data that can be divided into discrete groups and lack a specified order. Land cover data, such as water, wetlands, forest, etc. is one example of a categorical data set.
- footnote[3] Back to paragraph Continuous data can take any value within a range and the data values can be ranked or ordered. The digital elevation model, representing the topography of the Earth’s surface, is one such data set.
- footnote[4] Back to paragraph Data ranges are provided for continuous data only. Categorical data (e.g. land cover) is discretized according to the data classes (original or derived value) for use in the model.
- footnote[5] Back to paragraph http://www.environmentalindicators.com/htdocs/indicators/6wate.htm [link inactive]
- footnote[+] Back to paragraph Cases where we do not expect a given land cover type to provide a particular ecosystem service (e.g., pollination by open water).
- footnote[**] Back to paragraph Classes were relevant to the study area but not actually used in the value transfer due to lack of GIS data.
- footnote[***] Back to paragraph (classes that are valued in the database but for which GIS data currently don’t exist)
- footnote[6] Back to paragraph Annual Canadian per capita CO2 emissions for 2008 (most recent year for which data are available) are estimated to be 22 metric tons. Based on the estimated annual carbon sequestration value for Algonquin Provincial Park, the Park, in its current state, offsets the emissions of approximately 62,500 households.
- footnote[7] Back to paragraph The Tol 2008 study is a meta-analysis of 211 estimates of the social cost of carbon. The justification for using this study is given in section 3.1.2.