Greenhouse Wastewater Monitoring Project (2010 and 2011)
A lengthier technical memorandum report on the findings of two years of sampling data collected from the outfalls of wastewater discharges from greenhouses in the Leamington and Kingsville areas.
Prepared by:
Ontario Ministry of the Environment
Southwestern Regional Office Technical Support Section
January 2012
Cette publication hautement spécialisée n'est disponible qu'en anglais en vertu du reglement 441/97, qui en exempte l'application de la Loi sur les services en français. Pour obtenir de I'aide en français, veuillez communiquer avec Ie ministere de l'Environnement au 416 314-7938 ou sans frais 1 800 565-4923 (Fax: 416 314-7949).
For more information:
Ministry of the Environment
Public Information Centre
Email: picemail.moe@ontario.ca
Website: Ministry of the Environment and Climate Change
© Queen’s Printer for Ontario, 2012
PIBS 8688
Introduction
This document has been prepared by the Ministry of the Environment’s Southwestern Regional Office. The information contained herein reflects findings of 2 years of sampling data collected from the outfalls of wastewater discharges from a number of greenhouses in the Leamington and Kingsville areas. Sample results collected in 2010 and 2011 provide information with respect to the relative impact of nutrient water disposal directly into watercourses. The full scientific report is presented as Appendix 1.
Background
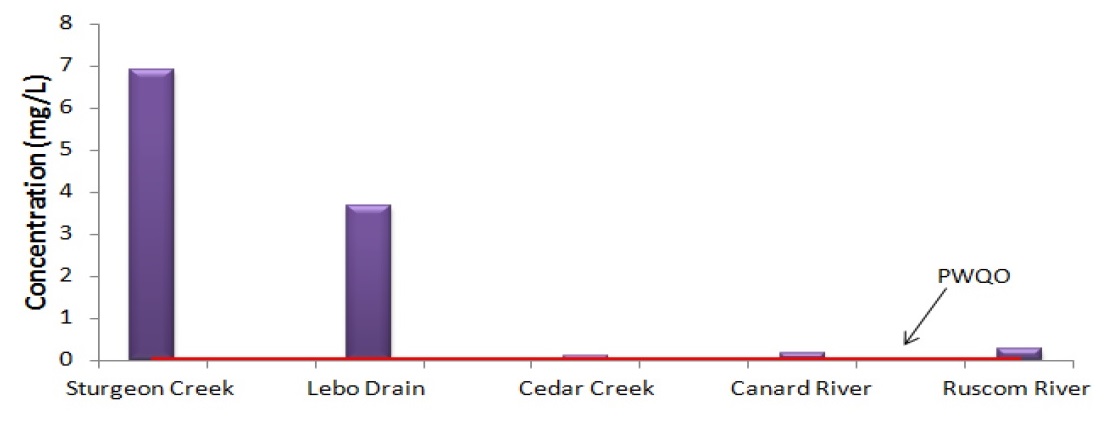
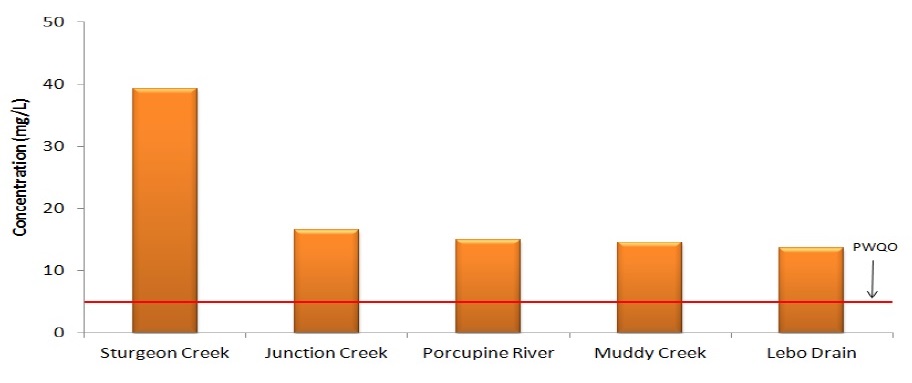
The Ministry of the Environment (MOE), through the Provincial Water Quality Monitoring Network, has been tracking a trend of approximately eight years that has seen an increase in nutrients (nitrogen, phosphorus) and metals present in the Lebo Drain and Sturgeon Creek. Figure 1 compares nutrients in Sturgeon Creek and the Lebo Drain to similar watercourses found in Essex County. The Provincial Water Quality Objective (PWQO) or Canadian Council of the Ministers of the Environment guideline (CCME) for the respective parameter is shown as well, where applicable. Phosphorus, nitrogen (in the form of nitrate) and potassium are markedly higher within these two watercourses than in neighbouring streams (Cedar Creek, Canard River, Ruscom River). Sturgeon Creek and Lebo Drain are the most polluted waterways in the province of Ontario with respect to phosphorus and nitrate.
Figure 1 - Comparison of nutrients in Sturgeon Creek and the Lebo Drain to neighbouring Essex County watercourses.
Total phosphorus is shown in (a), potassium in (b), and nitrate (expressed as N) in (c). Where applicable, the Provincial Water Quality Objective (PWQO) or Canadian Council of the Ministers of the Environment guideline (CCME) for the respective parameter is shown as well.
(a) Average Total Phosphorus (2004-2010)
(b) Average Potassium (2004-2010)
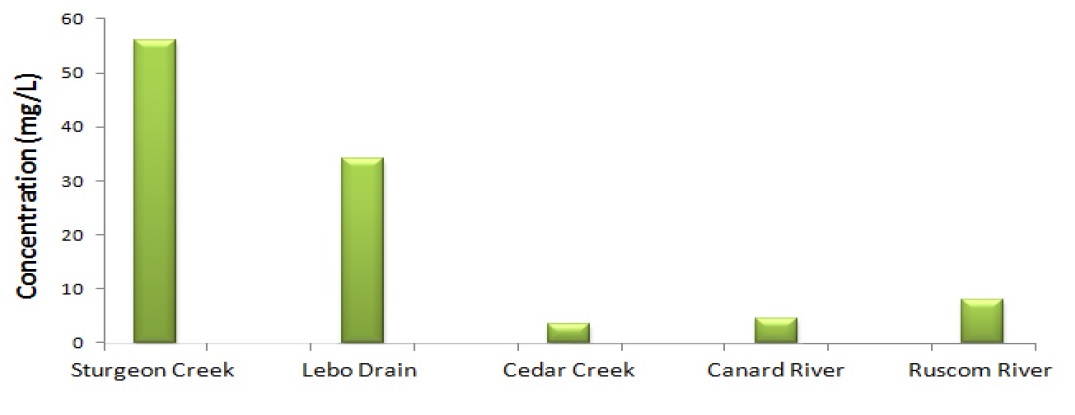
(c) Average Nitrate (2004-2010)
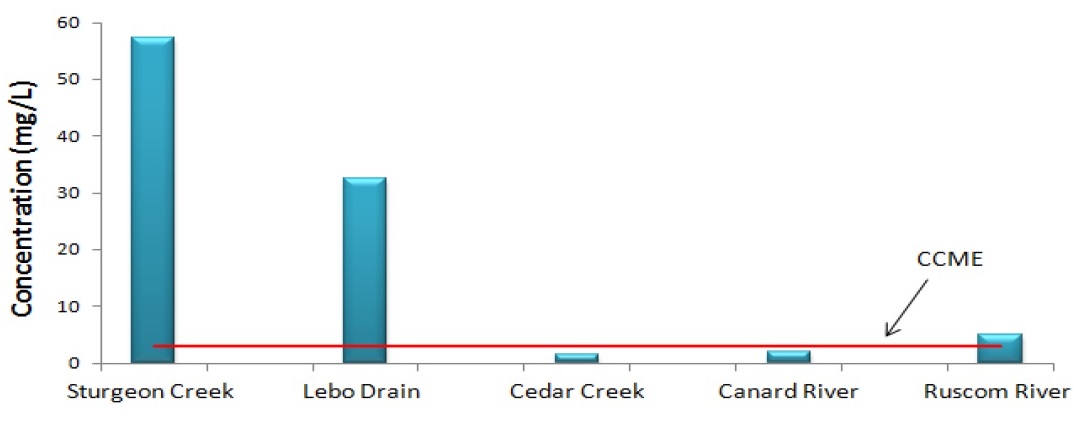
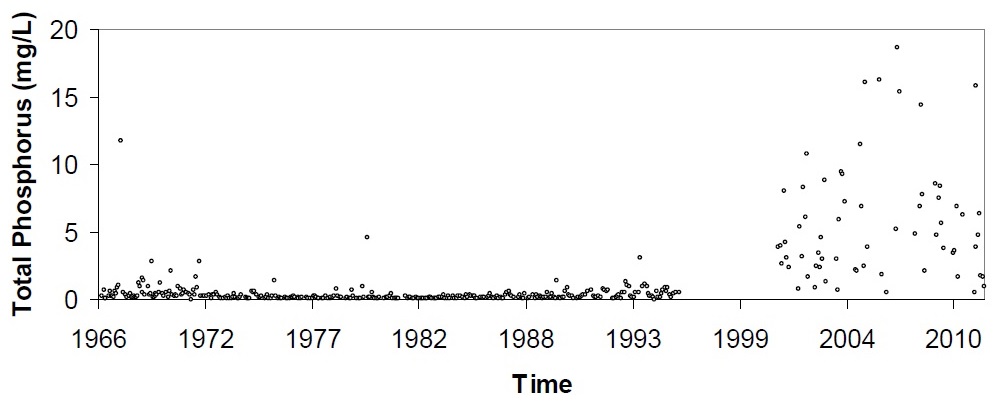
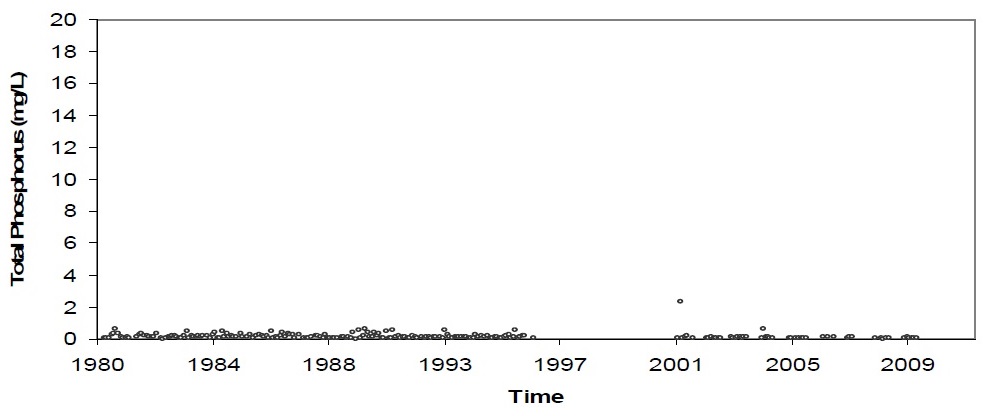
Figure 2(a) depicts increasing concentrations of phosphorus in Sturgeon Creek beginning in the late 1980's, with a dramatic increase occurring between 2004 and 2010.
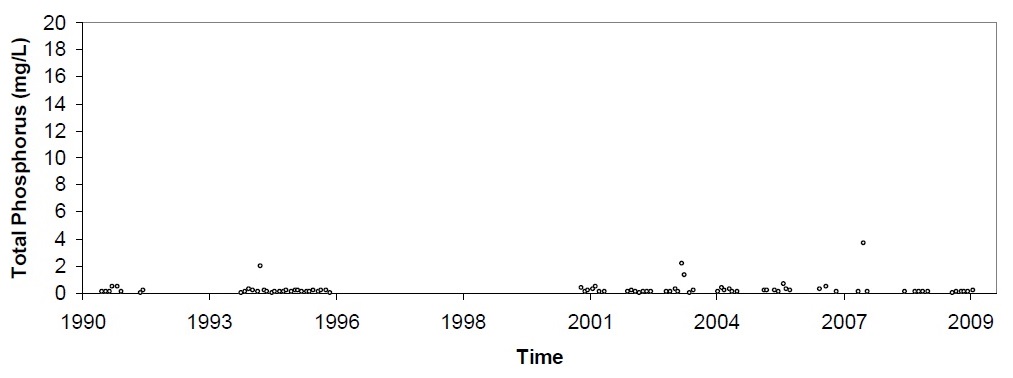
In 2007, a preliminary investigation was undertaken to determine whether the sources of the pollutants were watershed-wide or from select point sources. The results of the 2007 work suggested that the pollution was associated with most tributaries of both Lebo and Sturgeon Creek. Ministry staff hypothesized that there could be a correlation between the increasing trends in nutrients and the expansion of the hydroponic greenhouse sector. This hypothesis was based on an absence of similar trends within neighbouring streams that did not experience greenhouse development. Figures 2(b) and 2(c) show neighbouring streams (Cedar Creek, Ruscom River) with no such upward trends.
Figure 2 - Concentrations of phosphorus in (a) Sturgeon Creek, (b) Cedar Creek, and (c) Ruscom River. Data was obtained through the Provincial Water Quality Monitoring Network.
(a) Sturgeon Creek PWQMN Data
(b) Cedar Creek PWQMN Data
(c) Ruscom River PWQMN Data
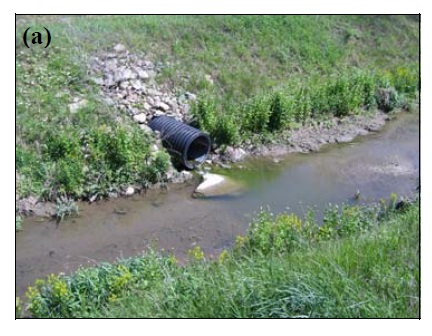
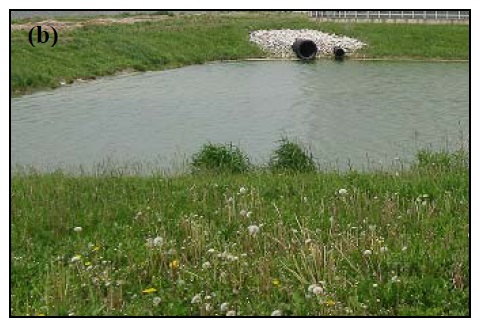
MOE staff collected samples of wastewater from 32 greenhouse outfalls within the Leamington and Kingsville areas in the summers of 2010 and 2011. Water samples were collected from the direct outfalls of greenhouses and sampled for total nutrients, general chemistry and metals. Two types of outfalls were noted in the study (see Figures 3(a) and (b):
- direct outfalls whereby a discharge pipe extended directly from a greenhouse facility to a waterway off site, and
- discharges of flow from greenhouse stormwater/water retention facilities to a waterway.
The majority of the discharges sampled were from type (b) outfalls (associated with stormwater/water retention facilities).
Figure 3 - The two types of outfalls observed in the study: (a) direct outfalls to a waterway, and (b) discharge to a stormwater/retention facility.
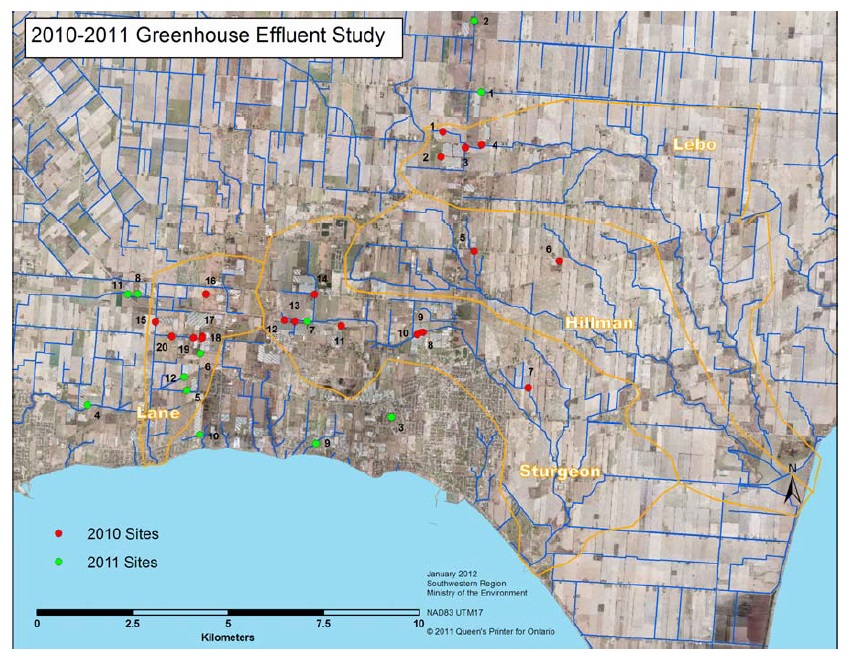
The location of the sample sites are provided in Figure 3(c). Water samples were also collected from a control stormwater pond located in a Leamington subdivision for comparative purposes.
Figure 3 (c) - Location of 2010 and 2011 sample sites.
Key Findings
Water quality results suggest that of the 32 greenhouse outfalls sampled, 21 of them have high levels of nitrate and/or phosphorus indicative of nutrient water and/or process water (e.g. floor drains, washing fluids). This corresponds to 65% of all sites sampled (summarized in Table 1).
| Site # | Trigger exceeded |
|---|---|
| 2010-1 | ✔ |
| 2010-2 | ✔ |
| 2010-3 | ✔ |
| 2010-4 | inconclusive |
| 2010-5 | ✔ |
| 2010-6 | ✘ |
| 2010-7 | ✔ |
| 2010-8 | ✔ |
| 2010-9 | ✔ |
| 2010-10 | ✔ |
| 2010-11 | ✘ |
| 2010-12 | ✘ |
| 2010-13 | inconclusive |
| 2010-14 | ✔ |
| 2010-15 | ✘ |
| 2010-16 | ✔ |
| 2010-17 | ✘ |
| 2010-18 | ✔ |
| 2010-19 | ✔ |
| 2010-20 | ✔ |
| 2011-1 | ✔ |
| 2011-2 | ✔ |
| 2011-2A | ✔ |
| 2011-4 | ✘ |
| 2011-5 | ✔ |
| 2011-6 | ✔ |
| 2011-6A | ✘ |
| 2011-7 | inconclusive |
| 2011-8 | ✔ |
| 2011-10 | ✘ |
| 2011-11 | ✔ |
| 2011-12 | ✔ |
✔ = Confirmed presence of nutrient water/process water in discharge
✘ = Unconfirmed presence of nutrient water/process water in discharge
Inconclusive = Single sample events suggest nutrient input, however, averages remain below the trigger concentrations.
The trigger concentrations are:
- average Total Phosphorus > 1.0 mg/l, and/or
- average Total Nitrate > 30.0 mg/l)
Where possible, water samples were taken immediately upstream and downstream of each sampled outfall to determine how each outfall contributed to overall concentrations in sampled watercourses. The majority of the 21 sample sites had nutrient concentrations well above the Provincial Water Quality Objectives (or CCME guideline). Conclusive degradation of downstream water quality, as a direct result of the outfall discharge, was observed at six of the 21 outfalls determined to contain nutrient/process water (Sites 2010-01, 2010-10, 2010-14, 2010-18, 2011-1, 2011-2).
The MOE could not quantify the extent of impact to downstream water quality at the remaining 15 outfalls due to three reasons:
- there was no upstream site, as the outfall emptied into a dry ditch
- the upstream sample site was already highly impacted, whereby further degradation could not be realized
- there was sufficient streamflow relative to the outfall flow that the impact of the outfall discharge could not be seen in the downstream sample results.
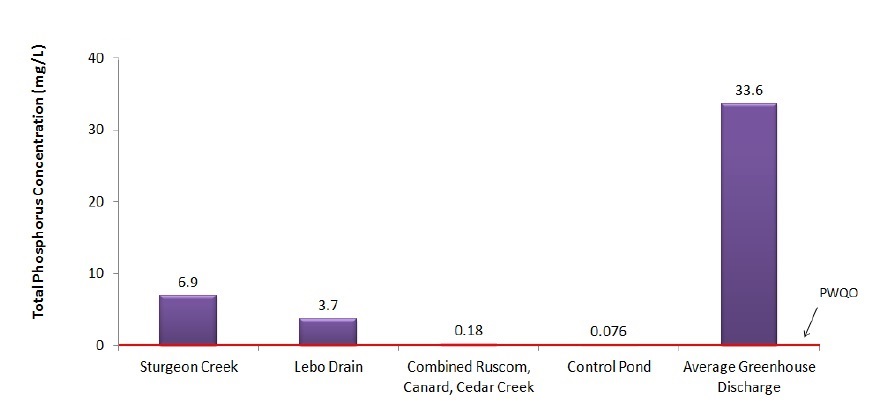
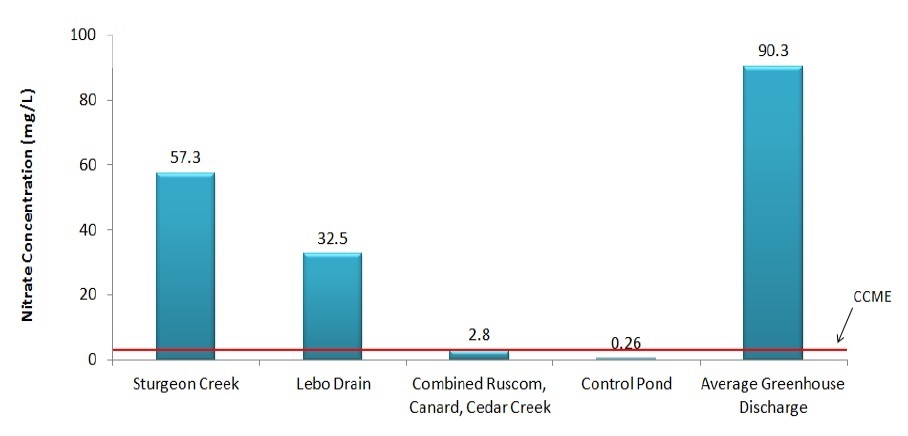
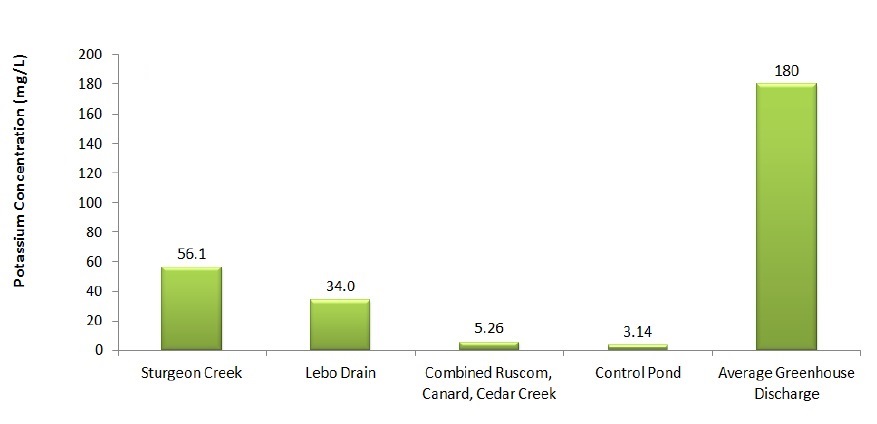
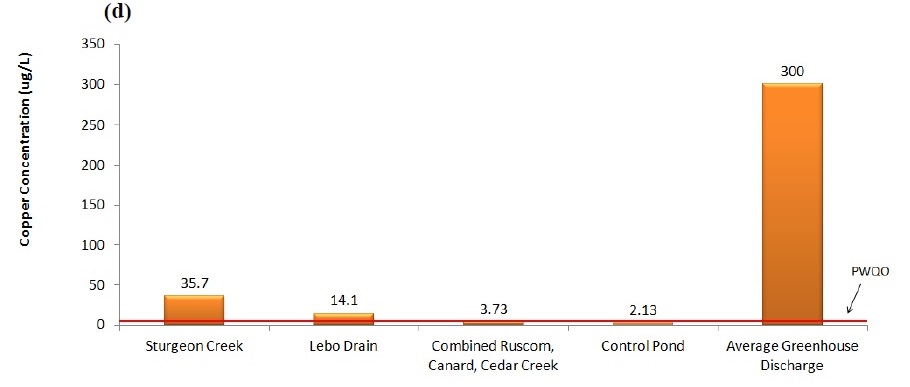
Figures 4(a), (b), and (c) show the average concentrations of phosphorus (P), nitrate nitrogen (N), and potassium (K) respectively from the outfalls sampled. The average P, N, and K concentrations for Sturgeon Creek, Lebo Drain, the Ruscom, Canard and Cedar Rivers, as well as the control pond sampled, have been included for comparative purposes. The site with the highest average concentration of phosphorus from an outfall was Site 2010-9 (180 mg/L), and the site with the highest average concentration of nitrate from an outfall was Site 2010-2 (322 mg/L). Sturgeon Creek has 20 times the level of nitrate, 10 times the level of potassium, and 38 times the level of phosphorus found on average in comparable neighbouring watercourses.
Phosphorus levels are of particular concern, as the Province of Ontario and the Federal Government are committed through the Binational Great Lakes Water Quality Agreement to effectively manage phosphorus levels in an effort to reduce the effects of nutrients on Lake Erie.
Figure 4 - Nutrient concentrations found in greenhouse outfalls in comparison to Sturgeon Creek, Lebo Drain, the Ruscom, Canard, and Cedar Rivers, and the control pond. Shown are (a) phosphorus, (b) nitrate, (c) potassium, and (d) copper.
(a) Total phosphorus concentration (2010)
(b) Total nitrate concentration (2010)
(c) Total potassium concentration (2010)
(d) Total copper concentration (2010)
Metals Analysis
Five key micronutrients common to fertilizer blends were also targeted for analysis; zinc, copper, manganese, iron and molybdenum. Of note, copper levels were significantly elevated and are of particular concern. Copper is relatively more toxic to aquatic fauna than the other micronutrients and was present in several samples at levels that can be considered toxic. Of the 32 sites analyzed, 11 of them had potentially toxic levels of copper in their discharge on more than one sample event.
Water Results
Table 2 summarizes the average concentration of nitrate, phosphorus, potassium, and copper found in the outfall discharges of the sites determined to have nutrient water/process water present in their discharge. These averages were calculated from a total of 94 samples, taken from outfalls at 13 different sites between June and August 2010, and 8 sites between May and August 2011.
| Parameter | Average concentration | Standard |
|---|---|---|
| Nitrate | 90.3 mg/L | 13.0 mg/L (CCME) |
| Phosphorus | 33.6 mg/L | 10.03 mg/L (PWQO) |
| Potassium | 180 mg/L | - |
| Copper | 300 µg/L | 25.0 µg/L (PWQO) |
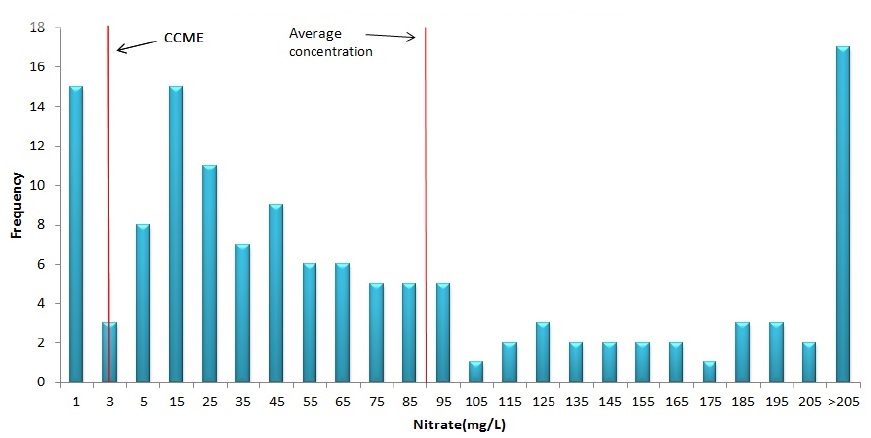
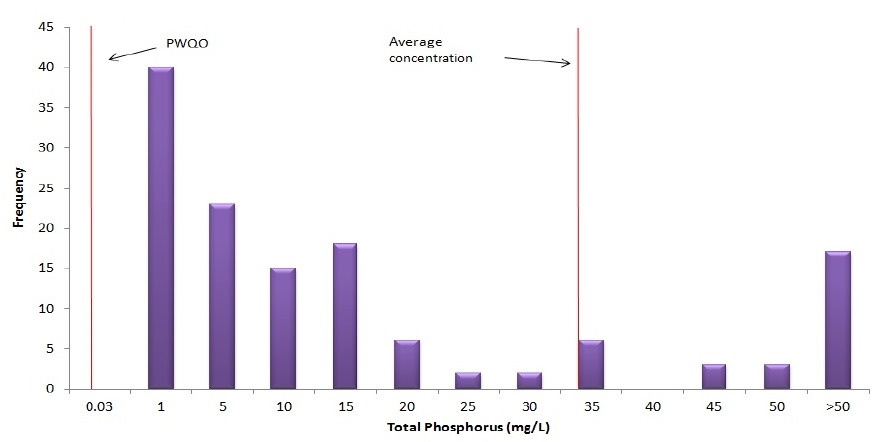
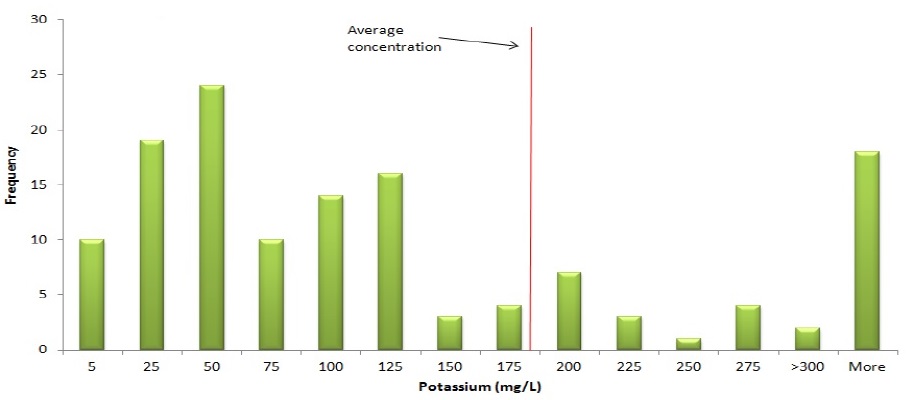
Figure 5 shows the distribution of the sample results for (a) nitrate, (b) phosphorus, (c) potassium and (d) copper. The height of the bar represents the number of samples found to be within the range of concentration (0 to 5 mg/L, 5-15 mg/L, etc.). The average concentration given in Table 2 is shown, as well as the Provincial Water Quality Objective (PWQO) or Canadian Council of the Ministers of the Environment guideline (CCME) for the respective parameter.
It was observed that where nutrient/process water was present, the discharges exceed the PWQO or CCME guideline.
Figure 5 - Distribution of the 2010-2011 sample results for (a) nitrate, (b) phosphorus, (c) potassium, and (d) copper.
(a) Nitrate concentrations of source samples
(b) Total phosphorus concentrations of source samples
(c) Potassium concentrations of source samples
(d) Copper concentrations of source samples
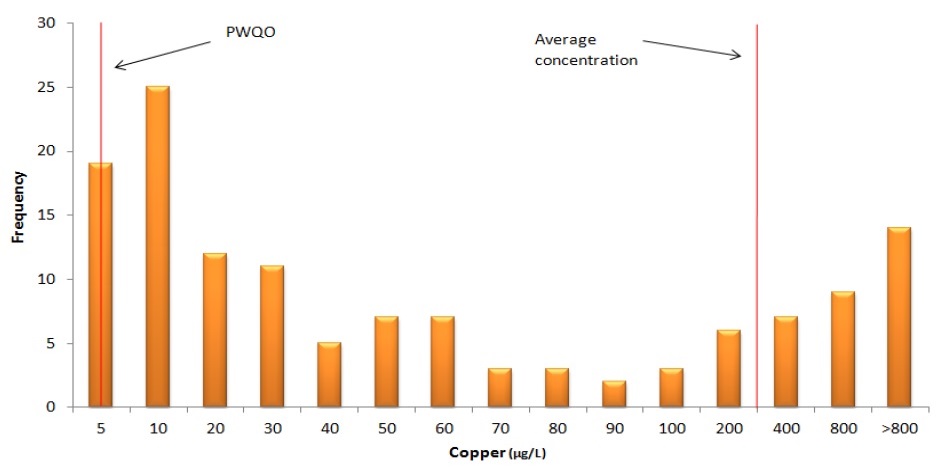
Table 3 demonstrates how water quality within Sturgeon Creek, Lane Drain, and Lebo Drain, deteriorates as one moves downstream; Most likely as a result of additional inputs. The furthest downstream sample points indicate that there is a significant presence of phosphorus, potassium and nitrate in Sturgeon Creek, Lane Drain, and Lebo Drain. The MOE observed a consistent decrease in water quality between upstream and downstream locations in the watersheds.
| Chemicals | Sturgeon Creek Upstream |
Sturgeon Creek Downstream |
Lane Drain Upstream |
Lane Drain Downstream |
Lebo Drain Upstream |
Lebo Drain Downstream |
|---|---|---|---|---|---|---|
| Total Phosphorus (mg/L) | 0.19 | 6.49 | 0.75 | 4.31 | 5.33 | 29.12 |
| Nitrate (mg/L) | 2.04 | 22.34 | 2.59 | 23.52 | 55.05 | 77.52 |
| Copper (μg/L) | 7.20 | 123.74 | 10.85 | 10.05 | 93.74 | 278.67 |
| Molybdenum (μg/L) | 0.43 | 44.70 | 1.31 | 5.97 | 14.10 | 20.30 |
| Potassium (mg/L) | 11.53 | 59.68 | 8.91 | 34.10 | 52.93 | 80.67 |
| Zinc (μg/L) | 7.19 | 168.74 | 47.03 | 40.30 | 93.30 | 177.70 |
Conclusions
Phosphorus, potassium, and nitrate, the three key components of fertilizer, are present in Sturgeon Creek and Lebo Drain at the highest concentrations found in the province. The MOE observed a decrease in water quality between upstream and downstream locations in the Sturgeon Creek, Lane Drain, and Lebo Drain watersheds.
The MOE water quality results suggest that 65% of all greenhouses sampled have discharged high (to extremely high) levels of nitrate, phosphorus, potassium, and copper (indicative of nutrient water and/or process water) directly into watercourses or indirectly into watercourses via control ponds.
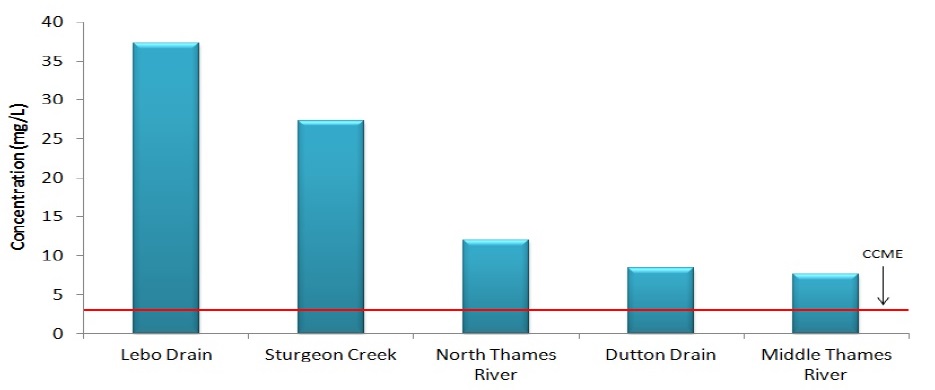
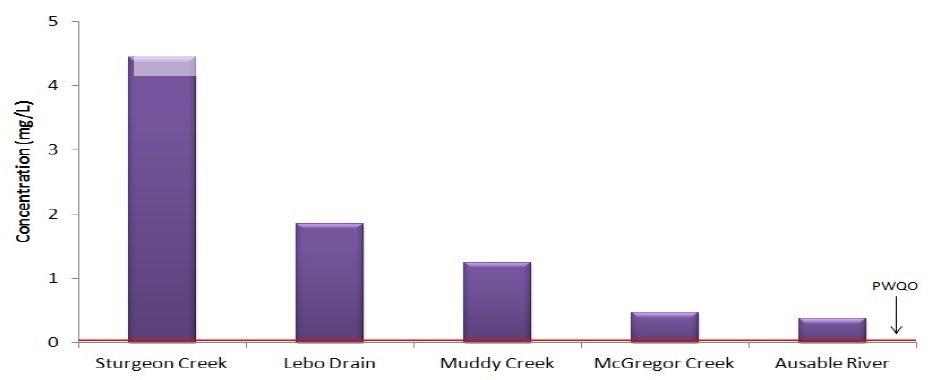
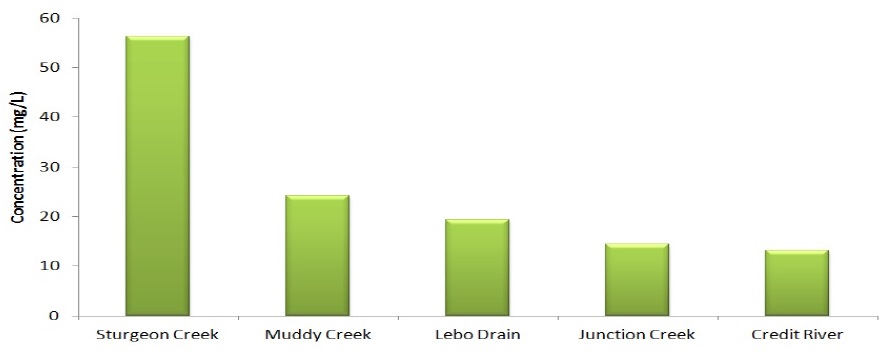
Water quality monitoring of greenhouse outfalls has demonstrated that greenhouse discharge is responsible for direct degradation of water quality in Sturgeon Creek and Lebo Drain. Sturgeon Creek and Lebo Drain are the most polluted waterways in Ontario with respect to phosphorus and nitrate (see Figures 6 (a) and (b)), and in the top five most polluted with respect to potassium and copper (Figures 6(c) and (d)).
Figure 6 - Most polluted streams in Ontario with respect to (a) nitrate, (b) phosphorus, (c) potassium, and (d) copper. Data was obtained through the Provincial Water Quality Monitoring Network (2010-2011 data).
(a) Average 2010-2011 nitrate
(b) Average 2010-2011 phosphorus
(c) Average 2010-2011 potassium
(d) Average 2010-2011 copper
Several other small watersheds within the Kingsville and Leamington areas are also heavily impacted by greenhouse inputs and are contributing to loadings of nutrients into Lake Erie (e.g. Lane Drain, Mill Creek (Kingsville)).
The Province of Ontario shall ensure that any given watercourse retains its fundamental water chemistry so as to protect indigenous aquatic life and maximize as many water uses as possible. Under the authority of Section 53 of the Ontario Water Resources Act, the Province ensures appropriate water treatment is applied to achieve this objective. This strategy is collectively referred to as “assimilative capacity”. Sturgeon Creek and Lebo Drain are sufficiently impacted by nutrient inputs such that no further assimilative capacity is available. The MOE cannot support further greenhouse development within either watercourse without appropriate treatment technology in place.
Phosphorus discharges from greenhouse outfalls are compromising to a significant extent the Province’s commitments to achieve point source reductions of phosphorus through the Binational Great Lakes Water Quality Agreement and the Lake Erie Lakewide Management Plan through the Canada Ontario Agreement Respecting the Great Lakes Basin Ecosystem.
Footnotes
- footnote[1] Back to paragraph Furthest upstream sample point for each watershed (Sites 2010-14, 2010-18, and 2010-1 respectively)
- footnote[2] Back to paragraph Furthest downstream sample point for each watershed (Sites 2010-7, 2010-20, and 2010-4 respectively)