Monitoring for San Jose scale in Ontario apple orchards
Learn how to monitor for San Jose scale in apple orchards.
Degree-day models were calculated throughout the 2017 season in orchards from various apple growing districts with a historically high SJS pressure to determine crawler emergence. Temperature data was collected daily from on-site data loggers or local weather stations. Predicted crawler emergence from 3 degree day (DD) models (Table 1) was determined for District 1, 2, 3 and 5. Pheromone traps (Figure 1) installed at king bloom in orchards in District 1, 2 and 5 were checked weekly to determine adult flight (Figure 2), or biofix for Model B and C. Trapping was not done in District 3 so only Model A was used for predictions.
In orchards from District 1 and 2, predictions were compared to observed crawler emergence. Monitoring began at pink. Throughout the orchards, 10-15 trees with high incidence of overwintering scale were flagged and monitored weekly for crawler activity. Observations of overwintering female scale determined the presence of crawlers under the scale shell. As well, infested branches and developing fruitlets were monitored using a hand lens for the presence of the small, yellow insect. Monitoring continued until harvest. Electrical tape (sticky side out) was also wrapped around limbs of 5 infested trees at petal fall (Figure 3) to detect crawler movement. Each trap was monitored 1-2 times weekly and replaced when the tape was no longer sticky to the touch.
| Model | Biofix | Base T (°C) | Crawler Emergence 1st Generation |
Crawler Emergence 2nd Generation |
|---|---|---|---|---|
|
A
|
March 1st |
10
|
278 DD1
|
806 DD2
|
|
B
|
1st adult catch3 |
10
|
172 DD
|
222 DD
|
|
C
|
1st adult catch4 |
10.5
|
222-249 DD
|
n/a
|
1 First crawler emergence may correspond to 29±12.5 days McIntosh petal fall
2 Second crawler emergence may correspond to mid-July
3 New biofix set for each generation
4 First adult catch may correspond to 1st generation codling moth biofix
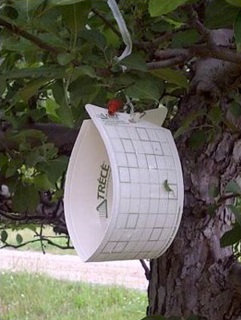
Figure 1. San Jose scale pheromone trap.
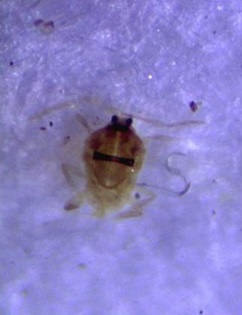
Figure 2. Adult male San Jose scale caught on pheromone trap. Note the distinct dark band across abdomen.
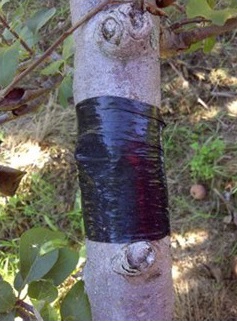
Figure 3. Electrical sticky tape around limb to detect San Jose scale crawler activity.
Figure 4 shows the average trap catch throughout the season in orchards where adult SJS flight was monitored. First generation activity began late May and continued into June while 2nd generation flight occurred late July to early August. These observations are similar to findings in previous years.
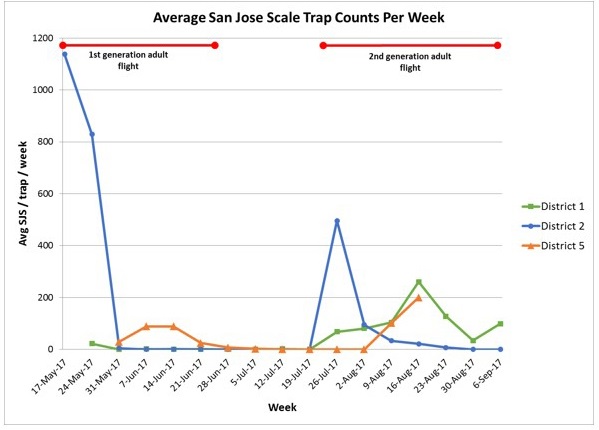
Figure 4: Average weekly trap catch throughout the season in orchards where adult SJS flight was monitored from Districts 1, 2, and 5.
Table 2 summarizes the crawler emergence predictions for orchards in District 1, 2, 3 (March 1st biofix only) and 5. In all orchards for the 1st generation, Model C predicted emergence approximately 1 week later than Models A and B likely due to a slightly higher base temperature (10.5°C). However, Model A tended to predict an earlier 2nd generation emergence compared to Model B.
| Model | Biofix 1st Generation |
Biofix 2nd Generation |
Base T | Crawler Emergence 1st Generation |
Crawler Emergence 2nd Generation |
|---|---|---|---|---|---|
| District 1 - A |
March 1st
|
March 1st
|
10
|
June 15-16
|
August 4-5
|
| District 1 - B |
May 23
|
July 24
|
10
|
June 14-15
|
August 13-14
|
| District 1 - C |
May 23
|
N/A*
|
10.5
|
June 19-23
|
N/A*
|
| District 2 - A |
March 1st
|
March 1st
|
10
|
June 14-15
|
August 9-10
|
| District 2 - B |
May 25
|
July 25
|
10
|
June 14-15
|
August 16-17
|
| District 2 - C |
May 25
|
N/A
|
10.5
|
June 19-23
|
N/A
|
| District 3*** - A |
March 1st
|
March 1st
|
10
|
June 23-24
|
August 17-18
|
| District 5 - A |
March 1st
|
March 1st
|
10
|
June 22-23
|
August 16-17
|
| District 5 - B |
May 26
|
August 1
|
10
|
June 18-19
|
August 21-22
|
| District 5 - C |
May 26
|
N/A
|
10.5
|
June 28-July 2
|
N/A
|
* This model does not have degree day timing for 2nd generation.
** Trapping was not done at this site.
Overall, the models were very accurate in predicting SJS crawler activity:
- In District 1, crawlers were first detected June 19 for 1st generation and August 14 for 2nd generation.
- In District 2, crawlers were first detected June 21 for 1st generation and August 15 for 2nd generation.
Activity was similar in orchards within the same area indicating regional monitoring and predictions can be used for management decisions.
Further studies are planned to compare timing of targeted insecticides with predicted crawler emergence to determine how precise these applications should be. Since crawler activity for each generation is approximately 5-6 weeks, an application applied early in emergence (within 1st or 2nd week) followed by a subsequent application 2 weeks later should provide effective control, depending on the pest pressure. While one application targeting peak emergence can be done for low pressure orchards, it is not an ideal management approach given the extended activity of this pest.
Special thanks to the cooperating growers for allowing the use of their orchard and technical assistance by Margaret Appleby, Ellen Cole and Micah Diller-Harder.