Public Accounts 2016-17: Annual report
The annual report is a high-level summary of the fiscal year’s results. It includes financial statements, analyzes the state of the province’s finances and outlines achievements for the fiscal year.
Foreword
I am pleased to present Ontario’s Public Accounts for the fiscal year 2016–17.
The Public Accounts of Ontario demonstrate that the Province is on the path to balance. Ontario’s actual performance in 2016–17 outperformed the forecast in the 2016 Budget.
The Public Accounts show that Ontario’s deficit for 2016–17 is $1.0 billion. This result is $3.3 billion lower than projected in the 2016 Budget and $0.5 billion lower than the interim projection in the 2017 Budget. This is as a result of revenue growing at a faster pace than spending.
I am proud to say that this is the eighth year in a row that Ontario has beaten its deficit target.
Getting back to balance is part of our plan to create jobs, grow our economy and help people in their everyday lives.
The path to balance
Our plan to return to balance is clear: make strategic investments to grow our economy while spending responsibly.
Our government is restoring balance through targeted, measured and fiscally responsible decisions — managing growth in program spending and fostering job creation and economic growth. We are making investments in key services such as health care and education, while at the same time lowering costs for necessities such as electricity and child care.
Ontario’s economy is strong, with our real growth domestic product (GDP) growth having outpaced that of all other G7 countries over the last three years. Not only has Ontario’s economy been one of the fastest-growing among the provinces, it is also the most efficient, with the lowest program spending per capita.
In addition to balancing the budget, we are also tackling debt. Our continued focus on capital investment is fuelling economic growth, which is resulting in GDP growing more quickly than debt. This will help us to lower Ontario’s net debt-to-GDP ratio to the government’s pre-recession level of 27 per cent.
Our plan is working: Ontario is set to balance the budget in 2017–18 and maintain a balanced budget into the future. A balanced budget means more funding for the programs and services people rely on most. It means that more revenue can be spent on priorities such as health care and education. This will spur economic growth and improve the quality of life for people today and in future generations.
Accounting changes
Treasury Board Secretariat prepares the Public Accounts in accordance with the accounting standards for governments issued by the Public Sector Accounting Board. To further enhance accountability and transparency, we have adopted a few accounting changes for this year’s Public Accounts, two of which are discussed below.
For the first time, we are presenting third-party revenues for hospitals, school boards and colleges with other revenues of the Province. Third-party revenues for these organizations were previously netted against the respective sectors’ expenses. This change increases transparency and is consistent with Public Sector Accounting Standards and reporting practices of other Canadian governments. While this shift in presentation increases both revenues and expenses, it does not affect the annual deficit, net debt or accumulated deficit.
We are also reporting the net pension assets for jointly sponsored pension plans in this year’s Public Accounts.
Since 2001, and until the 2015–16 Public Accounts, Ontario had recognized pension assets in its financial statements. Last year, the Province’s professional accounting staff and the Auditor General’s Office could not reach a consensus on the appropriate application of the Public Sector Accounting Board standards regarding pension accounting for two of Ontario’s jointly sponsored pension plans: the Ontario Teachers’ Pension Plan (OTPP) and the Ontario Public Service Employees Union Pension Plan (OPSEUPP).
To help resolve this issue, the government formed the Pension Asset Expert Advisory Panel to deliver independent advice and recommendations. The Panel was made up of accounting, legal and pension experts in the areas of jointly sponsored pension plan governance, actuarial modelling for pension plans and Public Sector Accounting Standards.
After careful study, the Panel concluded that Ontario’s share of the surplus of the net pension assets of both the OTPP and OPSEUPP should continue to be recognized as an asset in the Province’s financial statements. Further, the Panel advised that recognizing the asset will provide an accurate representation of the Province’s financial position.
The government accepted the Panel’s recommendations. As such, we have prepared this year’s financial statements in accordance with the Public Sector Accounting Standards for pension asset accounting that have been used since 2001.
Openness and transparency
As part of our commitment to openness and transparency we are using data visualization tools to help Ontarians better understand the Province’s finances.
This year, Ontario has:
- Released downloadable data sets through Ontario’s Open Data Catalogue, including data on government organizations, government business enterprises and Trusts.
- Created new data visualizations tools, including interactive data tables, to help people easily sort and review key financial information.
To access these new tools, and to see the full Public Accounts online, visit Ontario.ca/publicaccounts.
Conclusion
The government will continue to build on its track record of responsible fiscal management.
Staying on the path to balance, while continuing to invest in key programs and services, is part of Ontario’s plan to create jobs, grow our economy and help people in their everyday lives.
Original signed by
The Honourable Liz Sandals
President of the Treasury Board
Introduction
The Annual Report is a key element of the Public Accounts of the Province of Ontario and is central to demonstrating the Province’s transparency and accountability in reporting its financial activities and position. Ontario’s Consolidated Financial Statements present the financial results for the 2016-17 fiscal year against the 2016 Budget released in February 2016 and the financial position of the government as at March 31, 2017. As in previous years, the Annual Report also compares the current year’s results to the prior year’s results and provides a five-year trend analysis for a number of key financial ratios.
A number of changes have been made in this year’s financial statements to improve transparency and align with Public Sector Accounting Standards. For comparative purposes, the prior years’ results have been restated to reflect these changes. For additional details on these changes, including the recognition of net pension assets for the Province’s jointly sponsored pension plans, see "Accounting changes" on page 31 of this report.
Producing the Public Accounts of Ontario requires the teamwork and collaboration of many stakeholders across Ontario’s public sector. The Office of the Auditor General plays a critical role in auditing and reporting on the Province’s financial statements, and the Standing Committee on the Public Accounts also plays an important role in providing legislative oversight and guidance. I would like to thank everyone for their contributions.
We welcome your comments on the Public Accounts. Please share your thoughts by email at infoTBS@ontario.ca, or by writing to the Office of the Provincial Controller, Re: Annual Report, Treasury Board Secretariat, Second Floor, Frost Building South, 7 Queen’s Park Crescent, Toronto, Ontario M7A 1Y7.
Original signed by
Cindy Veinot, FCPA, FCA, CMA, CPA (DE)
Assistant Deputy Minister and Provincial Controller
Treasury Board Secretariat
Guide to the Public Accounts
The Public Accounts of the Province of Ontario comprise this Annual Report and three supporting volumes.
The Annual Report includes a Financial Statement Discussion and Analysis, the Consolidated Financial Statements of the Province and other supporting schedules and disclosures.
Financial Statement Discussion and Analysis
The first section of the Annual Report is the Financial Statement Discussion and Analysis section, which:
- Compares the Province’s financial results to both the 2016 Budget for the year and results for the previous year;
- Shows trends in key financial items and indicators of financial condition;
- Sets out key potential risks to financial results and explains how the government manages them;
- Includes descriptions of various assets and liabilities on the statement of financial position; and
- Presents non-financial activities results and discusses important initiatives related to enhancing transparency and accountability.
The Consolidated Financial Statements
The Consolidated Financial Statements show the Province’s financial position at the end of the previous fiscal year, its financial activities during the reporting period and its financial position at the end of the fiscal year. The statements are linked, and figures that appear in one statement may affect another.
The Province’s financial statements are presented on a consolidated basis, meaning that the Province’s statement of financial position and statement of operations reflect the combination of ministry results as well as financial results for entities that are controlled by the government (see Note 1 to the Consolidated Financial Statements for more details). Therefore, reported revenues and expenses of the Province can be affected directly by the activities of ministries as well as the performance of controlled entities such as government business enterprises (GBEs) and broader public sector (BPS) organizations such as hospitals, school boards and colleges. In addition, the Province’s results are also affected by transfer payments made to non-consolidated entities, such as municipalities and universities.
The financial statements comprise:
- The Consolidated Statement of Operations, which provides a summary of the government’s revenue for the period less its expenses, and shows whether the government incurred an operating deficit or surplus for the year. The results for the current year are presented along with the Budget plan as presented in February 2016, and the financial results for the prior fiscal period. The annual surplus/deficit has an impact on the Province’s financial position.
- The Consolidated Statement of Financial Position, which reports the Province’s assets and liabilities and is also known as the balance sheet. The Province’s total liabilities include debt and other long-term financing. Financial assets include cash, short-term investments, amounts due from others and investment in GBEs. The difference between total liabilities and financial assets is the Province’s net debt, which provides a measure of the future government revenues that will be required to pay for the government’s past transactions. Non-financial assets, mainly tangible capital assets such as highways, bridges and buildings, are subtracted from net debt to arrive at the accumulated deficit. An operating deficit in the year increases the accumulated deficit.
- The Consolidated Statement of Change in Net Debt, which shows how the Province’s net debt position changed during the year. The main factors increasing net debt are the annual deficit and additions to tangible capital assets, which increase liabilities.
- The Consolidated Statement of Change in Accumulated Deficit, which is a cumulative total of all the Province’s annual deficits and surpluses to date. It is mainly affected by the annual surplus or deficit in a year.
- The Consolidated Statement of Cash Flow, which shows the sources and uses of cash and cash equivalents over the year. Two major sources of cash are revenues and borrowings. Uses of cash include funding for operating costs, investments in capital assets and debt repayment. The statement is presented in what is referred to as the indirect method, meaning that it starts with the annual surplus or deficit and reconciles that to the cash flow from operations by adding or subtracting non-cash items, such as amortization of tangible capital assets. It also shows cash used to acquire tangible capital assets and investments, as well as cash generated from financing activities.
When reading the Consolidated Financial Statements, it is essential to also read the accompanying notes and schedules, which summarize the Province’s significant accounting policies and give more information on underlying financial activities, market value of investments, contractual obligations and risks. Commentary is also provided on changes to accounting policies in the current year and possible future changes to accounting standards.
Other elements of the Annual Report
- In management’s Statement of Responsibility, the government acknowledges its responsibility for the Consolidated Financial Statements and the Financial Statement Discussion and Analysis. The Statement, which appears on page 5, outlines the accounting policies and practices used in preparing the financial statements and acknowledges the government’s responsibility for financial management systems and controls.
- The Auditor General’s Report, which appears on pages 49 to 52, expresses an opinion under the Auditor General Act as to whether the statements present fairly the annual financial results and financial position of the government in accordance with Canadian Public Sector Accounting Standards.
Supporting volumes
Volume 1 contains ministry statements and detailed schedules of debt and other items. Individual ministry statements compare actual expenses to the amounts appropriated by the Legislative Assembly. Appropriations are made through the Estimates, Supplementary Estimates and annual Supply Act (as modified by Treasury Board Orders), other statutes and special warrants, if any. The ministry statements include amounts appropriated to fund certain provincial organizations, including hospitals, school boards and colleges. The financial results of all provincial organizations included in the government reporting entity in accordance with Public Sector Accounting Standards are consolidated with those of the Province to produce the Consolidated Financial Statements in accordance with the accounting policies as described in Note 1 to the statements.
Volume 2 contains the individual financial statements of significant provincial corporations, boards and commissions that are part of the government’s reporting entity, as well as other miscellaneous financial statements.
Volume 3 contains the details of payments made by ministries to vendors (including sales tax) and transfer payment recipients that exceed certain thresholds, including payments to suppliers of temporary help services; payments made directly to a supplier by the ministry for employee benefits; travel payments for employees; total payments for grants, subsidies or assistance to persons, businesses, non-commercial institutions and other government bodies; other payments to suppliers of goods and services; and statutory payments.
Statement of responsibility
The Consolidated Financial Statements are prepared by the Government of Ontario in accordance with the accounting principles for governments issued by the Public Sector Accounting Board (PSAB) of the Chartered Professional Accountants of Canada (CPA Canada).
The government accepts responsibility for the objectivity and integrity of these Consolidated Financial Statements and the Financial Statement Discussion and Analysis.
The government is also responsible for maintaining systems of financial management and internal control to provide reasonable assurance that transactions recorded in the Consolidated Financial Statements are within statutory authority, assets are properly safeguarded and reliable financial information is available for preparation of these Consolidated Financial Statements.
The Consolidated Financial Statements have been audited by the Auditor General of Ontario in accordance with the Auditor General Act and Canadian Auditing Standards. Her report appears on pages 49 to 52 of this document.
Original signed by
Scott Thompson
Deputy Minister
Ministry of Finance
August 18, 2017
Original signed by
Helen Angus
Deputy Minister, Treasury Board Secretariat and Secretary of Treasury Board and Management Board of Cabinet
August 18, 2017
Original signed by
Cindy Veinot, FCPA, FCA, CMA, CPA (DE)
Assistant Deputy Minister and Provincial Controller
Treasury Board Secretariat
August 18, 2017
Financial statement discussion and analysis
Highlights
2016-17 Financial highlights ($ billions) Table 1
| Consolidated Statement of Operations For the fiscal year ended March 31 | 2016 Reclassified Budget |
2016-17 Actual | 2015-16 Restated Actual |
Change from 2016 Reclassified Budget | Change from 2015-16 Restated Actual |
|---|---|---|---|---|---|
| Total revenue | 138.5 | 140.7 | 136.1 | 2.2 | 4.6 |
| Expense | |||||
| Programs | 129.4 | 130.0 | 128.1 | 0.6 | 1.9 |
| Interest on debt | 12.4 | 11.7 | 11.6 | (0.7) | 0.1 |
| Total expense | 141.8 | 141.7 | 139.7 | (0.1) | 2.0 |
| Reserve | 1.0 | - | - | (1.0) | - |
| Annual deficit | (4.3) | (1.0) | (3.5) | 3.3 | 2.5 |
| Consolidated Statement of Financial Position As at March 31 | |||||
| Financial assets | 93.8 | 93.4 | 0.4 | ||
| Liabilities | 395.4 | 388.8 | 6.6 | ||
| Net debt | (301.6) | (295.4) | 6.2 | ||
| Non-financial assets | 108.1 | 103.4 | 4.8 | ||
| Accumulated deficit | (193.5) | (192.0) | 1.5 |
Note: Numbers may not add due to rounding.
Comparison to the 2016 Budget plan
The Province of Ontario recorded a deficit of $1.0 billion for the 2016-17 fiscal year, an improvement of $3.3 billion from the $4.3 billion deficit projected in the 2016 Budget (see Table 1).
The improvement was mainly due to revenues that were $2.2 billion above the plan and the budgeted reserve of $1.0 billion that was not used.
Despite the challenges stemming from an uncertain global economic setting, Ontario’s economy grew, with real GDP increasing by 2.7 per cent in 2016, above the forecast of 2.2 per cent in the 2016 Budget.
Total revenue for 2016-17 came in at $140.7 billion, which was $2.2 billion higher than the 2016 Budget. This was largely due to higher-than-expected corporations tax revenues, income from GBEs and fees, donations and other revenues from BPS organizations (hospitals, school boards and colleges), which was offset by lower transfers from the Government of Canada and other non-tax revenue.
Total spending for 2016-17 came in at $141.7 billion, which was $0.1 billion lower than the 2016 Budget. Program spending was $130.0 billion, up $0.6 billion from the plan of $129.4 billion. Spending in health, children’s and social services and other programs was higher-than-planned. Interest on debt expense was $11.7 billion, which was $0.7 billion below the plan of $12.4 billion, due mainly to lower-than-forecast interest rates, and cost effective borrowing and debt management.
Net debt, the difference between total liabilities and financial assets, was $301.6 billion as at March 31, 2017, which was $6.7 billion lower than the 2016 Budget.
Comparison to the 2015-16 fiscal year
Provincial revenues increased by $4.6 billion, or 3.4 per cent, over the previous year (see Table 1). This increase was due in part to nominal GDP growth of 4.6 per cent in 2016, which contributed to higher taxation revenues. Higher transfers from the federal government, particularly Canada Health Transfer, Canada Social Transfer and funding for infrastructure projects, also increased revenues.
Year-over-year, total spending rose by $2.0 billion, or 1.5 per cent, going from $139.7 billion to $141.7 billion. Spending in health, education, and children’s and social services programs was higher. Interest on debt rose by 1.0 per cent, from $11.6 billion to $11.7 billion, reflecting the increase in total debt.
As a result of higher growth in revenue than spending, the annual deficit fell from $3.5 billion in 2015-16 to $1.0 billion in 2016-17. This represents the eighth consecutive year Ontario has achieved better-than-planned results.
Total liabilities increased by $6.6 billion and total financial assets increased by $0.4 billion, which resulted in an increase of $6.2 billion in net debt.
The net book value of capital assets (non-financial assets) such as roads and bridges owned by the Province grew by $4.8 billion during the year, reflecting new capital investments, mainly in the transportation, health and education sectors.
The accumulated deficit rose by $1.5 billion, mainly as a result of the annual deficit for 2016-17 of $1.0 billion.
During the year cash was generated from issuing long-term debt of $26.6 billion and sale of temporary investments and Hydro One shares totaling $5.7 billion. Cash generated was used mainly to fund current year expenditure and the annual deficit of $1.0 billion, provide $10.0 billion for investment in capital assets and repay maturing debt of $21.5 billion.
Analysis of 2016-17 results
Details of 2016-17 actual results ($ billions) table 2
| Item | 2016 Reclassified Budget |
2016-17 Actual | 2015-16 Restated Actual |
Change from 2016 Reclassified Budget | Change from 2015-16 Restated Actual |
|---|---|---|---|---|---|
| Revenue | |||||
| Taxation | 91.8 | 94.3 | 91.8 | 2.5 | 2.5 |
| Government of Canada | 25.1 | 24.5 | 23.1 | (0.6) | 1.4 |
| Fees, donations and other revenues from hospitals, school boards and colleges | 7.4 | 8.0 | 7.5 | 0.6 | 0.5 |
| Income from government business enterprises | 5.1 | 5.6 | 4.9 | 0.5 | 0.7 |
| Other non-tax revenue | 9.1 | 8.3 | 8.8 | (0.8) | (0.5) |
| Total revenue | 138.5 | 140.7 | 136.1 | 2.2 | 4.6 |
| Expense | |||||
| Health sector | 55.8 | 56.0 | 55.0 | 0.2 | 1.0 |
| Education sector3 | 26.6 | 26.6 | 26.0 | - | 0.6 |
| Children’s and social services sector | 15.8 | 16.0 | 15.5 | 0.2 | 0.5 |
| Postsecondary and training sector | 10.2 | 10.1 | 9.9 | (0.1) | 0.2 |
| Justice | 4.5 | 4.6 | 4.6 | 0.1 | - |
| Other programs |
16.5 | 16.7 | 17.1 | 0.2 | (0.4) |
| Total program expense | 129.4 | 130.0 | 128.1 | 0.6 | 1.9 |
| Interest on debt | 12.4 | 11.7 | 11.6 | (0.7) | 0.1 |
| Total expense | 141.8 | 141.7 | 139.7 | (0.1) | 2.0 |
| Reserve | 1.0 | - | - | (1.0) | - |
| Annual deficit | (4.3) | (1.0) | (3.5) | 3.3 | 2.5 |
Note: Numbers may not add due to rounding.
Change in presentation of hospitals, school boards and colleges
In the current year, the Province changed the presentation of hospitals, school boards and colleges to present third-party revenues of these organizations with revenues of the Province. Previously third-party revenues were netted against the respective sectors’ expenses. This change increases the total revenues and expenses of the Province, but has no impact on the annual deficit. The change was made to fully comply with Public Sector Accounting Standards. For comparability and consistency purposes, the prior years’ results and the 2016 Budget have been reclassified to reflect this change in presentation. See "Accounting changes" on page 31 for further details.
Revenue
Comparison to the 2016 Budget plan
In the 2016 calendar year, Ontario’s real GDP grew by a solid 2.7 per cent, driven by gains in consumer spending and exports. Growth was above the forecast of 2.2 per cent in the 2016 Budget.
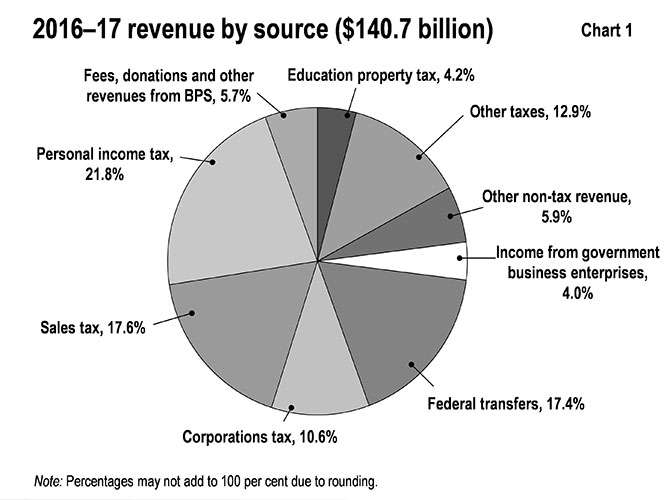
Revenues for 2016-17 came in at $140.7 billion, or 1.6 per cent higher than the 2016 Budget. See Chart 1 for a breakdown of revenues by source.
- Taxation revenues were $2.5 billion, or 2.8 per cent higher-than-projected in the 2016 Budget. Corporations tax revenues were $2.8 billion higher due to stronger than-expected revenues from tax returns processed for 2016 and prior tax years than assumed in the 2016 Budget. Sales tax revenues were $0.8 billion higher, due to Ontario’s larger share of the overall Harmonized Sales Tax (HST)/Goods and Services Tax (GST) revenue pool, as the provincial economy performed better than the rest of Canada in 2015 and 2016. The strong housing market in 2016 contributed to a $0.7 billion increase in land transfer tax revenues. However, personal income tax revenues came in $1.5 billion lower, reflecting weaker 2016 tax assessments.
- Transfers from the Government of Canada were lower than the 2016 Budget forecast by $0.6 billion, mainly reflecting lower-than-expected funding for infrastructure projects and other federal payments, including transfers to government agencies, hospitals, school boards and colleges. This decline was partially offset by new transfers under the strategic investment fund for affordable housing and postsecondary and training.
- Fees, donations and other revenues from BPS organizations was $0.6 billion higher than the 2016 Budget, mainly due to higher-than-expected revenues from non provincial sources for hospitals, and higher international tuition fee and other revenues for colleges.
- Income from GBEs was $0.5 billion higher, reflecting higher-than-projected net income from the Ontario Lottery and Gaming Corporation (OLG) and the Liquor Control Board of Ontario (LCBO), including a gain of $0.2 billion from the sale of the LCBO’s head office lands.
- Other non-tax revenues were $0.8 billion lower, mainly reflecting the carbon allowance proceeds from the first cap-and-trade program auction which will be recognized in 2017-18 instead of 2016-17 as budgeted; and lower sales and rentals revenue, mainly due to gains on the sale of the LCBO’s head office lands being reported as income from GBEs in 2016-17 instead of sales and rentals revenue as presented in the 2016 Budget. This decrease is partially offset by higher revenue from power supply contract recoveries.
Comparison to prior year and earlier years
Total revenues were up $4.6 billion, or 3.4 per cent, from the previous year.
- Taxation revenues, excluding the large decline in electricity payments-in-lieu of taxes from a one-time impact of the sale of Hydro One shares in 2015, grew by $5.4 billion, or 6.1 per cent, reflecting stronger corporations tax assessments for 2016 and prior years, and higher HST and land transfer tax revenues from economic growth.
- Revenues from the Government of Canada were also higher in 2016-17 by $1.4 billion, reflecting higher transfers for major federal funding programs including the Canada Health Transfer, the Canada Social Transfer and new funding for infrastructure projects under the strategic investment fund for affordable housing and postsecondary and training.
- Fees, donations and other revenues from BPS organizations were $0.5 billion higher over the prior year, mainly due to higher international tuition fee and other revenues reported by colleges and higher revenues from non-provincial sources reported by hospitals.
- Income from GBEs was higher in 2016-17 by $0.7 billion, due to higher revenues from the OLG, LCBO and Hydro One Limited (Hydro One), including a gain of $0.2 billion from the sale of the LCBO’s head office lands.
- Other non-tax revenue was lower by $0.5 billion in 2016-17, mainly reflecting lower revenue from electricity debt retirement charge, sales and rentals, and miscellaneous revenues.
Electricity sector changes in ownership
Hydro One secondary offering
In April 2016, the Province completed a secondary offering of Hydro One common shares, selling 14.0 per cent of its common shares at a price of $23.65 per share, generating gross proceeds of $2.0 billion. The Province reported a gain of $0.5 billion from the offering, which was credited to the Trillium Trust. As of March 31, 2017, the Province owned approximately 70 per cent of Hydro One’s common shares.
An additional gain of $70 million was deferred in connection with the purchase by Ontario Power Generation Inc. (OPG) of nine million Hydro One common shares through the secondary offering. OPG purchased these shares to distribute to eligible existing employees as part of future share delivery obligations under net-zero collective agreements entered into in 2015. The gain will be recognized as the shares are distributed to employees over a period of up to 15 years starting in 2018.
Hydro One Brampton sale
In February 2017, the Province sold its interest in Hydro One Brampton Networks Inc. through a sale of shares to Alectra Utilities Corporation. As a result of the sale, the Province reported a gain of $109 million. The government has committed to crediting the net proceeds from the sale to the Trillium Trust.
Revenue trend
Chart 2 shows the recent trends in revenue for the Province’s major revenue sources.
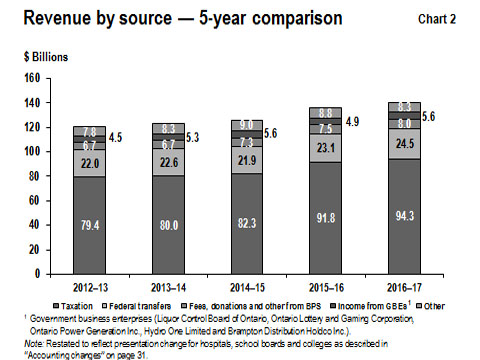
Taxation revenue
Between 2012-13 and 2016-17, taxation revenue grew at an annual average rate of 4.4 per cent, higher than the average annual nominal GDP growth of 3.9 per cent over the same period.
Although economic growth and increases in taxation revenue are clearly linked, the relationship is affected by several factors. Growth in some revenue sources, such as corporations tax and mining tax, can diverge significantly from economic growth in any given year, due to the inherent volatility of business profits as well as the use of tax provisions such as the option to carry losses forward or backward. The impact of housing completions and re-sales on HST and land transfer tax revenue is proportionately greater than their contribution to GDP. As well, changes in such sources as volume-based gasoline and fuel taxes are more closely aligned to growth in real as opposed to nominal GDP, as these revenue sources are less influenced by price changes.
Much of the rising trend in taxation revenues between 2012-13 and 2016-17 reflects a growing economy and revenue generated from tax measures. These tax measures included those aimed at improving tax fairness and addressing the underground economy.
Federal government transfers
Government of Canada transfers are based on existing federal-provincial funding arrangements and formulas. These include major federal transfer programs such as the Canada Health Transfer, Canada Social Transfer and Equalization programs, as well as transfers for social housing, infrastructure and labour market programs. There are also a number of smaller federal transfers to the Province, which are largely program-specific. Some transfers are ongoing, while others are time-limited.
Between 2012-13 and 2016-17, Government of Canada transfers grew at an annual average rate of 2.8 per cent.
Fees, donations and other revenues from BPS organizations
Between 2012-13 and 2016-17, fees, donations and other revenues from BPS organizations grew at an annual average rate of 4.6 per cent. The growth is mainly due to an upward trend of international tuition fee and other revenues.
Income from GBEs
Revenue of the Province includes the net income of five GBEs: the OLG, the LCBO, OPG, Hydro One Limited
Between 2012-13 and 2016-17, income from GBEs grew at an annual average rate of 5.6 per cent.
Other non-tax revenues
Other non-tax revenues arise from a number of sources, including vehicle and driver registration fees; sales and rentals of goods and services; other fees, licences and permits; reimbursements of provincial expenditures in delivering certain services; royalties for the use of Crown resources; and such revenue sources from the electricity sector as the debt retirement charge, power supply contract recoveries and net reduction of power purchase contract liability.
Other non-tax revenues grew at an annual average rate of 1.6 per cent between 2012-13 and 2016-17.
Expense
Comparison to the 2016 Budget plan
Total expense in 2016-17 was $141.7 billion, which was $0.1 billion lower than the 2016 Budget. Program spending was $130.0 billion, up $0.6 billion from the plan of $129.4 billion. Spending in health, justice, children’s and social services and other programs was higher-than-planned, offset by lower spending in the postsecondary and training programs (see Table 2). See Chart 3 for details of program expense by sector.
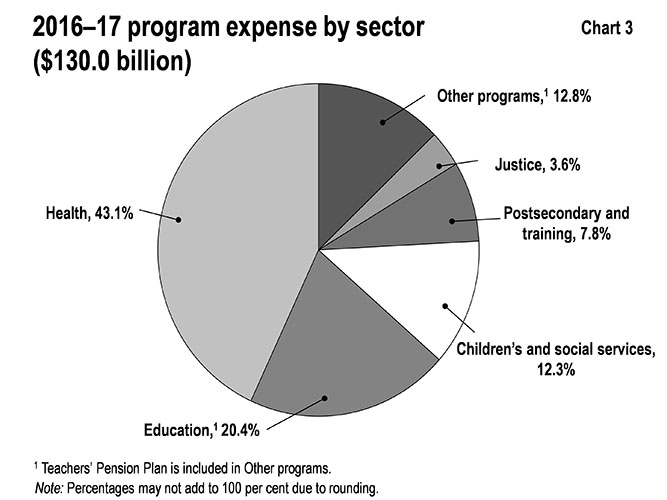
Total program spending was $0.6 billion higher than the Budget, resulting in actual program expense of $130.0 billion. The increase was attributable to:
- Health sector expense that was $239 million above plan, mainly due to higher than planned spending in hospital operations, physician services, complex malignant hematology and hematopoietic cell transplantation.
- Children’s and social services sector expense that was $190 million higher than-planned, mainly due to additional spending to address demand for the Ontario Disability Support Program and for young adults with complex special needs as well as expanding supports for children and youth with autism.
- Justice sector expense that was $102 million higher than-planned, mainly due to settlements under the Proceedings Against the Crown Act, reforms to the corrections system and ensuring wage parity for First Nations police officers.
- Education sector expense that was $36 million higher than-planned, mainly due to slightly higher than-projected enrolment.
- Other programs expense that was $140 million higher-than-planned, mainly due to federal and provincial investments in social and affordable housing as well as the Ontario Rebate for Electricity Consumers. There was lower-than-forecast infrastructure spending due to revised timelines for Building Canada Fund projects and municipal transit projects.
Increases in these sectors and programs were partially offset by:
- Postsecondary and training sector expense that was $67 million lower than-expected, mainly due to lower-than-forecast demand for employment and training programs, offset in part by increased capital transfer payments to universities through additional federal postsecondary infrastructure funding.
Chart 4 shows spending by type of expense. Government spending related to salaries and benefits includes those expenses for organizations consolidated as part of the government reporting entity, including hospitals, school boards and colleges as well as the Ontario Public Service. The expense labelled "Transfers" in Chart 4 includes payments to doctors for physician services but does not include transfers to hospitals, school boards and colleges; these are reflected in the other expense types as reported by the organizations.
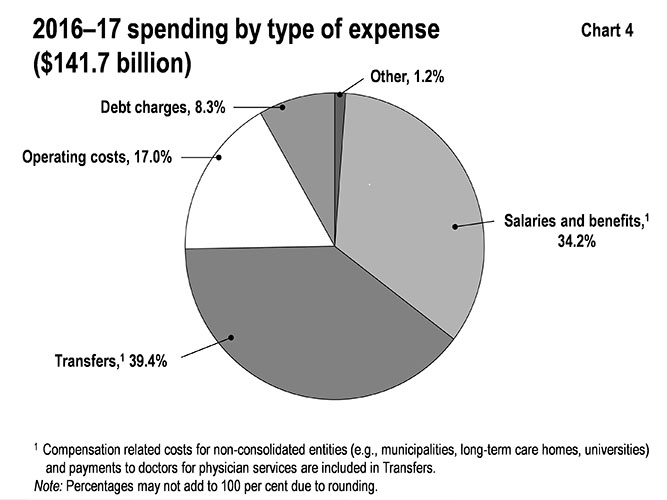
Transfers reflect payments to a variety of service providers, including non-consolidated entities in the public sector, to support the delivery of public services. These outside parties include, for example, child care providers, social service agencies and health care professionals. As service providers, a large share of the spending of these third parties typically goes to salaries and benefits.
Comparison to prior year and earlier years
Year-over-year, program spending grew by $1.9 billion, or 1.5 per cent in 2016-17.
Health care represents the largest share of government program spending. Ongoing transformation efforts to make the sector more effective and sustainable are vital to managing overall spending growth while continuing to improve access to care for patients. These continuing efforts have moderated the year-over-year growth in health sector spending in recent years, resulting in an increase of 1.9 per cent in 2016-17.
Chart 5 shows the recent trends in spending for major program areas.
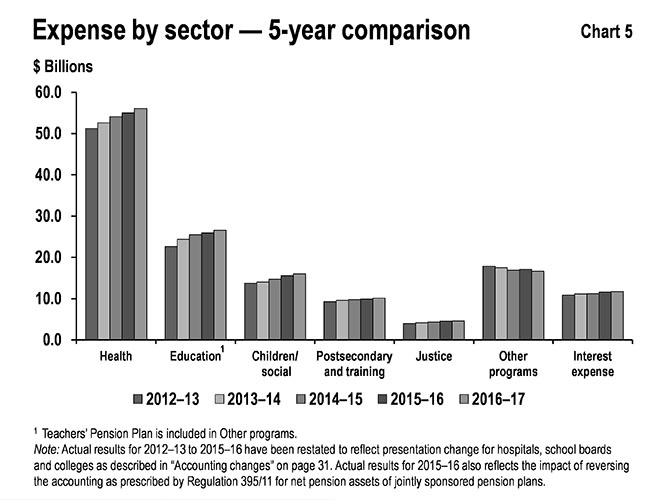
- Health sector expense increased from $51.2 billion in 2012-13 to $56.0 billion in 2016-17, or on average by 2.3 per cent per year. These increases are due in part to increasing demands for health care services from an aging and growing population, along with other factors, such as new drugs and technologies. Increased spending included new investments in home and community care, long term care homes and mental health, and physician services; as well as specialized services such as cancer treatment.
- Education sector expense increased from $22.6 billion in 2012-13 to $26.6 billion in 2016-17, or on average by 4.1 per cent per year. Expense in 2012-13 included a one-time savings of $1.3 billion from reducing liabilities carried by school boards for sick-day banking and retirement gratuities. Excluding this one-time savings in the 2012-13 results, the education sector expense increased on average by 2.7 per cent per year between 2012-13 and 2016-17. The increase is mainly due to the introduction of full-day kindergarten, which has been made available to every four- and five-year-old in Ontario since September 2014; and other investments, including negotiated labour enhancements and increases in school renewal funding.
- Children’s and social services sector expense increased from $13.7 billion in 2012-13 to $16.0 billion in 2016-17, or on average by 3.9 per cent per year. The increase primarily reflects social assistance rate increases as well as investments in developmental services, autism and complex special needs programs and the Ontario Child Benefit.
- Postsecondary and training sector expense increased from $9.3 billion in 2012-13 to $10.1 billion in 2016-17, or on average by 2.2 per cent per year. The increase is mainly due to continued funding to support enrolment growth in postsecondary institutions, growth in student financial assistance programs and increases in postsecondary capital transfer payments.
- Justice sector expense increased from $4.0 billion in 2012-13 to $4.6 billion in 2016-17, or on average by 3.9 per cent per year. The increase is mainly due to the provincial upload of court security costs from municipalities, compensation in the Ontario Provincial Police and correctional services programs, and improved access to legal aid for low-income Ontarians.
- Other programs expense decreased by $1.2 billion from $17.9 billion in 2012-13 to $16.7 billion in 2016-17. This decrease is mainly due to the end of time-limited funding related to the Ontario Clean Energy Benefit program and the 2015 Pan/Parapan American Games, as well as the redesign of the Ontario Municipal Partnership Fund program, to better target funding to northern and rural municipalities.
Interest costs
The change in presentation of hospitals, school boards and colleges, as described on page 13, includes net interest expense on the debt of these organizations that was previously reported as an expense in their respective sectors and that is now being included in the interest on debt expense.
Interest on debt expense was $0.7 billion below plan in 2016-17, mainly as a result of lower-than-forecast interest rates, lower borrowing requirements as a result of a lower than planned deficit, and cost-effective borrowing and debt management.
Interest expense grew from $11.6 billion in 2015-16 to $11.7 billion in 2016-17 (see Table 2).
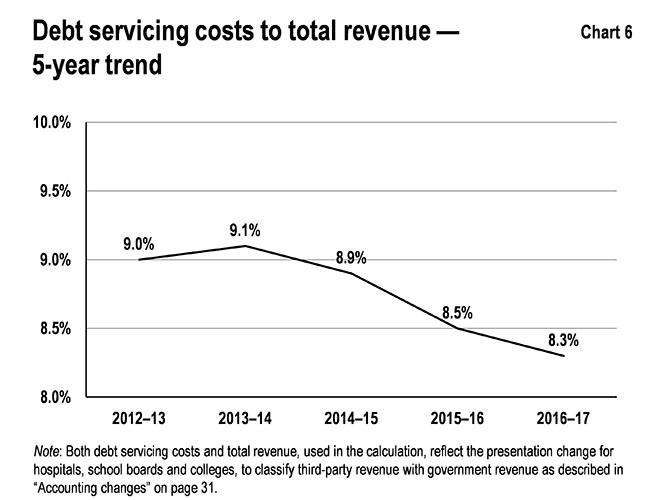
Chart 6 shows that although interest costs have grown in absolute terms, they have steadily fallen as a percentage of the Province’s revenues since 2013-14. The debt servicing cost to total revenue ratio is now at its lowest level from its peak at 15.5 per cent in 1999-2000. This is mainly due to historically low interest rates, coupled with cost effective debt management.
Statement of financial position analysis
Financial assets
Financial assets ($ billions) table 3
| Item | 2016-17 Actual | % of Total | 2015-16 Restated Actual | % of Total | Variance Increase (Decrease) |
|---|---|---|---|---|---|
| Cash and cash equivalents | 16.4 | 17.5% | 13.6 | 14.6% | 2.8 |
| Investments | 18.0 | 19.2% | 21.8 | 23.3% | (3.8) |
| Accounts receivable | 11.2 | 11.9% | 11.1 | 11.8% | 0.1 |
| Loans receivable | 11.9 | 12.7% | 11.5 | 12.4% | 0.3 |
| Net pension asset | 11.0 | 11.8% | 9.3 | 10.0% | 1.8 |
| Other assets | 3.0 | 3.2% | 2.5 | 2.8% | 0.5 |
| Investment in government business enterprises | 22.3 | 23.7% | 23.6 | 25.2% | (1.3) |
| Total financial assets | 93.8 | 100.0% | 93.4 | 100.0% | 0.4 |
Note: Numbers may not add due to rounding.
Financial assets consist of items such as cash and cash equivalents, and investments that are available to the Province to meet its expenditure needs; accounts and loans receivable, which are amounts it expects to receive from third parties; and other items, including net pension asset and investment in GBEs.
The Province’s financial assets increased by $0.4 billion in 2016-17 over the prior year. These increases were attributable to (see Table 3):
- Cash and cash equivalents that was $2.8 billion higher, as a result of operating, investing, capital and financing activities;
- Net pension asset that was $1.8 billion higher, reflecting investment gains on plan assets in recent years;
- Loans receivable that was $0.3 billion higher, mainly due to higher lending to municipalities for infrastructure projects;
- Accounts receivable that was $0.1 billion higher, mainly due to an increase in trade receivable at year-end; and
- Other assets that was $0.5 billion higher, in part as a result of increase in the asset balance due from market participants held by the Independent Electricity System Operator (IESO).
These increases were offset by:
- Investments that were $3.8 billion lower mainly due to lower holdings of Canadian bonds at year end in 2016-17; and
- Investment in GBEs that was $1.3 billion lower mainly due to the Province’s decreased ownership interest in Hydro One and the sale of Hydro One Brampton Networks Inc. in February 2017.
Chart 7 shows the recent trends in financial assets for the Province.
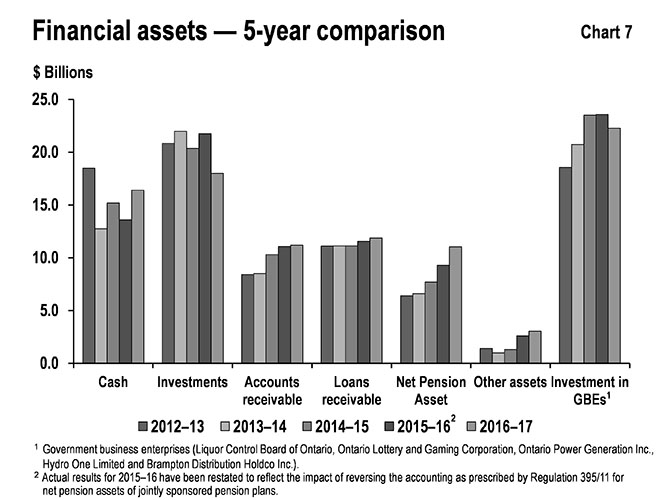
The five-year trend shows a steady gain in investment in GBEs from 2012-13 to 2014-15, reflecting an increase in net assets reported for these entities. The same upward trend did not continue in 2015-16, mainly due to the Province’s decreased ownership interest in Hydro One and the sale of Hydro One Brampton Networks Inc. in February 2017.
The five-year trend for net pension asset shows an upward trend reflecting investment gains on plan assets over the years. The other assets shows a small decrease from 2012-13 to 2013-14, but from 2013-14 to 2016-17 there was an upward trend, mainly due to restated 2015-16 and 2016-17 results, including asset balances due from market participants held by the Independent Electricity System Operator.
The level of other financial assets, including cash, accounts receivable and investments, tends to be more variable, since these assets often reflect specific circumstances at year end, such as pre-borrowing for the following period’s needs.
Tangible capital assets
The government is responsible for a large portfolio of non-financial assets, which is almost entirely made up of tangible capital assets.
Tangible capital assets owned by the Province and its consolidated entities represent the largest component of the Province’s infrastructure investments. These assets include those it owns directly, such as provincial highways, as well as the assets of hospitals, school boards, colleges and agencies that are consolidated in its financial statements. The assets of GBEs are reflected in the Province’s statement of financial position as an investment in GBEs.
The reported net book value of Ontario’s tangible capital assets was $107.3 billion in 2016-17, increasing by $4.8 billion over the prior year. Buildings, including hospitals, schools and college facilities, make up the single largest share, at $54.1 billion. The total also includes assets under construction, some of which are being built using the Alternative Financing and Procurement (AFP) model, in which the private sector finances the assets during construction. The balance sheet includes assets under construction in accordance with the Province’s accounting policy. The impacts of AFPs on balance sheet liabilities are discussed in "Other long-term financing" on page 28.
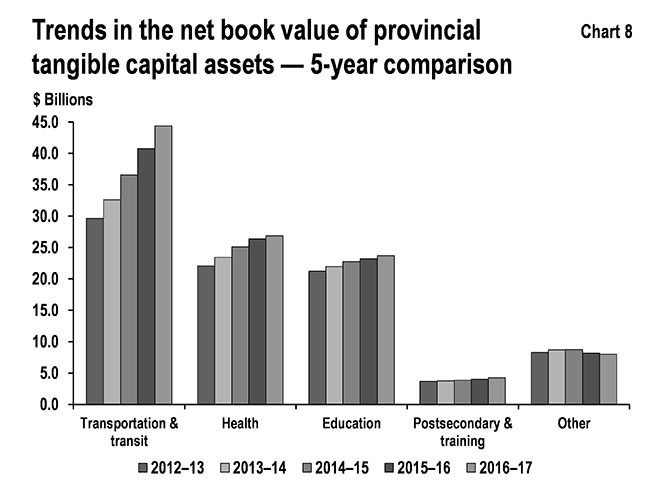
Growth in the net book value of capital assets has averaged 6.0 per cent annually over the period between 2012-13 and 2016-17. Most of the growth has been in new and renewed buildings and in transportation infrastructure, including provincial highways, bridges and the transit network owned by Metrolinx, an agency of the Province. See Chart 8 for the recent trends in provincial tangible capital assets.
Infrastructure expenditures
One of the goals of investing in capital is to improve the economic growth of the Province. A recent study by the Centre for Spatial Economics (C4SE), entitled The Economic Benefits of Public Infrastructure Spending in Canada, finds that, over the long term, real GDP in Ontario will rise up to $6 on average per dollar of public infrastructure spending.
The Province’s infrastructure spending in 2016-17 was $12.9 billion (see Table 4). This included $10.0 billion invested in assets owned by the Province and its consolidated entities, as discussed in "Tangible capital assets" on page 25, $2.9 billion provided for capital investment to non-consolidated partners such as universities and municipalities, and other infrastructure expenditures. The total was lower than the $16.2 billion set out in the 2016 Budget because of lower-than-forecast construction activity for the period.
2016-17 infrastructure expenditures ($ Billions) Table 4
| Sector | Investment in Capital Assets |
Transfers and Other Infrastructure Expenditures |
Total Infrastructure Expenditures |
|---|---|---|---|
| Transportation and transit | 5.3 | 0.7 | 6.0 |
| Health | 2.2 | 0.4 | 2.7 |
| Education | 1.6 | - | 1.6 |
| Postsecondary and training | 0.6 | 0.3 | 0.9 |
| Other sectors |
0.3 | 1.5 | 1.7 |
| Total expenditures |
10.0 | 2.9 | 12.9 |
Note: Numbers may not add due to rounding.
Liabilities
The Province’s liabilities consist of debt and other financial obligations, including accounts payable, unspent funds it received from the federal government and the estimated cost of future payments, including other employee future benefits liability (see Table 5).
Liabilities ($ Billions) Table 5
| Item | 2016-17 Actual | % of Total | 2015-16 Restated Actual | % of Total | Variance Increase (Decrease) |
|---|---|---|---|---|---|
| Accounts payable and accrued liabilities | 20.2 | 5.1% | 19.4 | 5.0% | 0.8 |
| Debt | 333.1 | 84.2% | 327.4 | 84.2% | 5.7 |
| Other long-term financing | 13.7 | 3.5% | 14.1 | 3.6% | (0.5) |
| Deferred revenue and capital contributions | 11.5 | 2.9% | 10.8 | 2.8% | 0.7 |
| Other employee future benefits liability | 10.5 | 2.7% | 10.8 | 2.8% | (0.3) |
| Other liabilities | 6.4 | 1.6% | 6.3 | 1.6% | 0.1 |
| Total liabilities | 395.4 | 100.0% | 388.8 | 100.0% | 6.6 |
Note: Numbers may not add due to rounding.
Debt
Debt and other long-term financing make up the largest share of liabilities. Debt increased by $5.7 billion in 2016-17 to $333.1 billion at year-end, primarily to finance the operating deficit and investments in infrastructure.
Table 6 summarizes how the Province used its net new financing in 2016-17.
| Use of new financing by the Province, 2016-17 ($ Billions) | Table 6 |
|---|---|
| Operating deficit and other transactions |
(1.3) |
| Investment in capital assets owned by the Province and its consolidated organizations, including hospitals, school boards and colleges |
9.9 |
| Decrease in the Province’s cash and investments | (3.4) |
| 5.2 | |
| Decrease in other long-term financing |
0.5 |
| Net new financing | 5.7 |
The government completed an annual borrowing program of $27 billion in 2016-17.
Other long-term financing
This category includes debt incurred to finance construction of public assets, including those procured through the AFP model. All assets that are owned by the Province and its consolidated entities, and the associated financing liabilities, are reflected on the Province’s balance sheet during construction and as the liabilities are incurred. For information on asset investments, refer to "Tangible capital assets" on page 25.
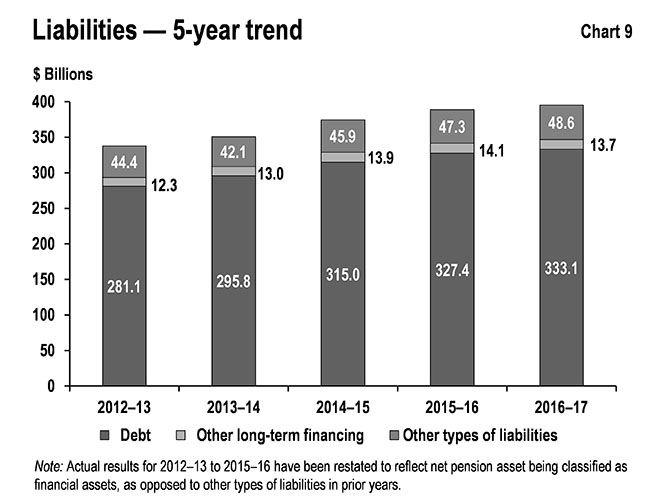
Other types of liabilities
Other types of liabilities include accounts payable, other employee future benefits, unspent transfers received from the federal government representing deferred revenues, and other liabilities.
Chart 9 shows the recent trends in liabilities for the Province. This trend over the period between 2012-13 and 2016-17 shows public debt rising, mainly to fund capital investments and the annual deficit. The upward trend in other long-term financing did not continue in 2016-17, mainly due to a substantial completion payment made in 2016-17 for the Highway 407 Phase 1 project. Other types of liabilities, including accounts payable and deferred revenue, tend to be more variable, since they often reflect specific circumstances at year end, such as accrued liabilities for goods and services.
Risks and risk management
The Province’s financial results and financial reporting are subject to risks and uncertainties over which the government has limited or no control. These include:
- Actual economic and/or revenue growth that differs from forecast;
- Significant changes in financial statement items, especially taxation revenues, arising from actual results that differ from accounting estimates;
- Unforeseen changes in transfer payments from the federal government;
- Demand for entitlement-based public services or a change in other expense, including pension expense, that reflects actual experience that is significantly different than forecast;
- Unusual weather patterns, extreme weather events and natural disasters with major financial impacts;
- Security breaches or other malicious behaviour that could interrupt services, result in loss of information, compromise privacy and/or damage equipment or facilities;
- The outcomes of legal settlements, arbitration and negotiations, and possible defaults on projects and potential defaults affecting loan and funding guarantees;
- Financial market conditions, including access to capital markets, currency exchange rates and interest rates, that differ from expectations; and
- Changes in accounting standards.
Ontario’s revenues rely heavily on the level and pace of economic activity in the province. Ontario manages risks to the revenue forecast by consulting with private sector economists and tracking their economic forecasts to inform the government’s planning assumptions. For prudent fiscal planning, the Ministry of Finance’s real GDP growth projections are slightly below the average private sector forecast.
The Province monitors information flows about revenues on an ongoing basis to assess potential risks to its finances. It also works constantly to enhance information flows for the same purpose. Collaboration with the Canada Revenue Agency, which administers roughly 74 per cent of Ontario’s taxation revenues, is essential to achieving this. As well, Ontario is currently leading a federal, provincial and territorial working group that is exploring ways to enhance corporate income tax revenue forecasting and monitoring.
The possible impacts on tax revenue of actual growth in the economy and other parameters differing from the assumptions used in the Budget is disclosed on pages 269-274 of the 2016 Budget, which is available at: http://www.fin.gov.on.ca/en/budget/ontariobudgets/2016/papers_all.pdf.
There are also risks arising from other sources of revenue, such as federal transfers and income from GBEs. Because these represent a smaller share of total revenue, the risks they present are generally less material to the revenue forecast and, in any event, are difficult or impossible to predict or quantify. Note 1 to the Consolidated Financial Statements provides additional details on measurement uncertainty.
On the expense side, the fiscal plan includes contingency funds to help mitigate risks. In the 2016 Budget, these totaled $1.2 billion: $1.1 billion for operating risks and $100 million for capital. Funds were used to support initiatives such as emergency forest firefighting, supporting individuals in the Ontario Disability Support Program, additional school renewal funding and additional funding to support improved patient services in hospitals.
Provisions for losses that are likely to occur as a result of contingent liabilities, such as ongoing litigation, and that can be reasonably estimated, are expensed and reported as liabilities. Note 1 to the Consolidated Financial Statements provides further details.
Note 3 to the Consolidated Financial Statements explains the Province’s risk management strategies, which are intended to ensure that exposure to borrowing-related risk is managed in a prudent and cost-effective manner.
Changes in Canadian generally accepted accounting principles for the public sector issued by the Public Sector Accounting Board (PSAB) can have an impact on the Province’s budgets, estimates and actual results. Treasury Board Secretariat actively monitors proposed changes and provides input to standard setters to support the development of standards that support sound public policy decision-making and transparency and accountability in reporting.
As required under the Fiscal Transparency and Accountability Act, 2004, a reserve is included in the projected surplus/deficit each year to guard against unforeseen revenue and expense changes that could have a negative impact on the Province’s fiscal performance. The 2016 Budget plan included a $1.0 billion reserve for 2016-17. Excluding this reserve, the 2016 Budget projected a deficit of $3.3 billion. Because the reserve is a forecast provision, and the fiscal results for 2016-17 are now finalized, a reserve is not reflected in the Province’s financial statements. The final deficit for the 2016-17 fiscal year is $1.0 billion, a $3.3 billion improvement compared with the 2016 Budget projection of $4.3 billion, which included the reserve.
Accounting changes
Changes in provincial reporting policies
The 2016-17 Consolidated Financial Statements of the Province reflect a number of changes consistent with the requirements of the Public Sector Accounting Handbook. Specifically, the Province’s 2016-17 Public Accounts reflect:
- Recognition of net pension assets for the Province’s jointly sponsored pension plans, including the Ontario Teachers’ Pension Plan (OTPP) and the Ontario Public Service Employees’ Union Pension Plan (OPSEUPP);
- A change in the basis of accounting of the financial results for Ontario Power Generation and Hydro One on the Province’s financial statements to reflect International Financial Reporting Standards (IFRS);
- A change in the presentation of revenues and expenses of the annual operating results for hospitals, school boards and colleges in the Consolidated Statement of Operations; and
- Adoption of rate-regulated accounting by the Independent Electricity System Operator (IESO), a government controlled organization.
Accounting for net pension assets of jointly sponsored pension plans
Consistent with the accounting policy the Province adopted in 2001 for jointly sponsored pension plans and the recommendations of the independent Pension Asset Expert Advisory Panel
In last year’s Public Accounts, the government adopted a time-limited regulation to reflect the Auditor General’s interpretation of Public Sector Accounting Standards for the treatment of net pension assets for 2015-16 (the "Pension Adjustment"). As announced at the time the 2015-16 Public Accounts were released, the government subsequently established an independent Pension Asset Expert Advisory Panel
Earlier this year, the Panel released its report
Independent Pension Asset Expert Advisory Panel’s advice
The Panel’s report concluded that under Public Sector Accounting Standards (PSAS), the Province’s share of the net pension assets of both the OTPP and the OPSEUPP should be recognized as an asset in Ontario’s financial statements, stating that:
- The accounting surplus in the plan has a future economic benefit
- The government controls access to that accounting surplus
- The accounting surplus exists as the result of past transactions and events
- No additional agreements between the sponsors specifying when and by how much
- contributions will be reduced are necessary to record an asset under PSAS
- It would be misleading not to recognize the Province’s share of the assets in Public Accounts.
In addition, the Panel concluded that the government will be able to benefit from the full amount of each net pension asset, and as a result, no reduction in the value is necessary.
The Panel subsequently reviewed the Province’s accounting for the Healthcare of Ontario Pension Plan (HOOPP) and the Colleges of Applied Arts and Technology Pension Plan (CAATPP). The Panel concluded that, based on the difference in the governance structure of these plans as compared to OTPP and OPSEUPP, a full valuation allowance should be applied to any net pension asset for CAATPP or HOOPP
Change in accounting for energy sector government business enterprises
The financial results of the Province’s investments in rate-regulated GBEs as at March 31, 2017 (Ontario Power Generation Inc. and Hydro One Limited), are consolidated in the Province’s consolidated financial statements under the modified equity method, as required by Public Sector Accounting Standards. As permitted by securities regulators, the entities’ stand-alone financial statements are prepared based on Generally Accepted Accounting Principles in the United States (US GAAP). Under the Public Sector Accounting Standards, the results of GBEs are required to be reflected on the Province’s financial statements based on International Financial Reporting Standards (IFRS). As of April 1, 2016, the Province has presented the results of these two rate-regulated entities as they would be reported under IFRS (including IFRS 14 - Regulatory Deferral Accounts), rather than US GAAP, as they had been reported previously. While the impact of this change on the Province’s 2016-17 results is not material to the annual deficit in 2016-17, differences between US GAAP and IFRS-based results for future reporting periods may be significant primarily due to differences in the accounting standards on asset retirement obligations, which affects the Province’s reporting because of OPG’s obligations for fixed asset removal and nuclear waste management. The entities themselves will continue to prepare stand-alone financial statements on a US GAAP basis.
Adoption of rate-regulated accounting by the Independent Electricity System Operator
In 2016, IESO changed its accounting policy regarding the recognition of market accounts assets and liabilities on its financial statements, and adopted rate-regulated accounting. The change was made to better reflect the assets and liabilities and amounts due to and from market participants held by IESO on behalf of IESO-administered markets at year end. As this change was applied retroactively, IESO’s 2015-16 comparative financial statements were also restated for comparative purposes. Recognition of the market accounts increases both other assets and other liabilities at March 31, 2017 by $1.7 billion. There is no impact on the accumulated deficit, net debt or revenue and expense as a result of recognizing the market accounts. The IESO’s adoption of rate-regulated accounting resulted in a decrease of $82 million in the 2016-17 opening accumulated deficit, and an increase in the 2016-17 annual deficit by $24 million.
Presentation of hospitals, school boards and colleges
Starting with the 2016-17 Public Accounts, the Province’s Statement of Operations presents the third-party revenues of hospitals, school boards and colleges with revenue of the Province to fully comply with Public Sector Accounting Standards. Previously, third party revenues of these sectors were netted against the respective sectors’ expenses. In addition, interest on debt for these sectors, which was previously classified with the respective sectors’ expenses, is now presented with other interest on debt. While both revenues and expenses increase, this change in presentation does not affect the Province’s reported deficit. The prior year financial statements and the 2016 Budget have been reclassified to reflect this change in presentation.
Summaries of the restatements/reclassifications to the reported 2015-16 annual results and 2016-17 Budget are provided in Table 7 and Table 8.
Details of Restated 2015-16 Actual Results ($ billions) table 7
| Item | 2015-16 Reported actual | Pension asset restatement | BPS presentation change | 2015-16 Restated actual |
|---|---|---|---|---|
| Revenue | ||||
| Taxation | 91.8 | - | - | 91.8 |
| Government of Canada | 22.9 | - | 0.3 | 23.1 |
| Fees, donations and other revenues from hospitals, school boards and colleges | - | - | 7.5 | 7.5 |
| Income from investment in government business enterprises | 4.9 | - | - | 4.9 |
| Other non-tax revenue | 8.8 | - | - | 8.8 |
| Total Revenue | 128.4 | - | 7.8 | 136.1 |
| Expense | ||||
| Health sector | 51.1 | - | 3.9 | 55.0 |
| Education sector |
25.0 | - | 1.0 | 26.0 |
| Children’s and social services sector | 15.5 | - | - | 15.5 |
| Postsecondary and training sector | 7.6 | - | 2.3 | 9.9 |
| Justice | 4.6 | - | - | 4.6 |
| Other programs |
18.6 | (1.5) | - | 17.1 |
| Total Program Expense | 122.4 | (1.5) | 7.1 | 128.1 |
| Interest on debt | 11.0 | - | 0.6 | 11.6 |
| Total Expense | 133.4 | (1.5) | 7.8 | 139.7 |
| Annual Deficit | (5.0) | 1.5 | - | (3.5) |
Note: Numbers may not add due to rounding.
Details of Reclassified 2016-17 Budget ($ billions) table 8
| Item | Original 2016-17 Budget | BPS presentation change | Reclassified 2016-17 Budget |
|---|---|---|---|
| Revenue | |||
| Taxation | 91.8 | - | 91.8 |
| Government of Canada | 24.6 | 0.5 | 25.1 |
| Fees, donations and other revenues from hospitals, school boards and colleges | - | 7.4 | 7.4 |
| Income from investment in government business enterprises | 5.1 | - | 5.1 |
| Other non-tax revenue | 9.1 | - | 9.1 |
| Total revenue | 130.6 | 7.9 | 138.5 |
| Expense | |||
| Health sector | 51.8 | 4.0 | 55.8 |
| Education sector |
25.6 | 0.9 | 26.6 |
| Children’s and social services sector | 15.8 | - | 15.8 |
| Postsecondary and training sector | 7.9 | 2.3 | 10.2 |
| Justice | 4.5 | - | 4.5 |
| Other programs |
16.5 | - | 16.5 |
| Total program expense | 122.1 | 7.3 | 129.4 |
| Interest on debt | 11.8 | 0.6 | 12.4 |
| Total expense | 133.9 | 7.9 | 141.8 |
| Reserve | 1.0 | - | 1.0 |
| Annual deficit | (4.3) | - | (4.3) |
Note: Numbers may not add due to rounding.
Key financial ratios
The use of key measures of financial position helps readers of the Annual Report assess the financial position of the Province. Through the levels and trends of these measures, readers are able to gauge the impacts of economic and other events on the Province’s finances, as well as how the government has responded. The ratio, and the level of each, over the past five years are outlined in Table 9.
Key financial ratios table 9
as at the end of the fiscal period
| Item | Item | 2012-13 | 2013-14 | 2014-15 | 2015-16 | 2016-17 |
|---|---|---|---|---|---|---|
| Sustainability | Net debt-to-GDP (%) | 37.2% | 38.5% | 39.2% | 38.7% | 37.8% |
| Sustainability | Net debt to total revenue (%) | 210.1% | 217.9% | 226.2% | 216.9% | 214.3% |
| Sustainability | Net debt per capita ($) | $ 18,722 | $ 19,648 | $ 20,753 | $ 21,219 | $ 21,871 |
| Flexibility | Debt charges to total revenue (%) | 9.0% | 9.1% | 8.9% | 8.5% | 8.3% |
| Flexibility | Own-source revenue to GDP (%) | 14.5% | 14.4% | 14.3% | 14.8% | 14.6% |
| Vulnerability | Federal transfers to total revenue (%) | 18.3% | 18.4% | 17.4% | 17.0% | 17.4% |
| Vulnerability | Foreign currency debt to total debt (%) | 24.3% | 22.9% | 20.9% | 18.8% | 16.7% |
| Vulnerability | Unhedged foreign currency debt (%) | 0.7% | 0.5% | 0.3% | 0.3% | 0.2% |
Notes: Actual results for 2012-13 to 2015-16 used for calculation have been restated to reflect 1) the presentation change for hospitals, school boards and colleges, to classify third-party revenue with government revenue; and 2) the impact of reversing the accounting as prescribed by Regulation 395/11 for net pension assets of jointly sponsored pension plans, as described in "Accounting changes" on page 31. Net debt was restated to reflect prepaid expenses and inventory supplies being reclassified as non-financial assets, as opposed to financial assets in prior years.
Measures of sustainability
Net debt provides a measure of the future government revenues that will be required to pay for the government’s past transactions. Net debt as a percentage of the Province’s GDP shows the financial demands on the economy resulting from the government’s spending and taxation policies. A lower ratio of net debt-to-GDP indicates higher sustainability.
The Province’s net debt-to-GDP ratio was 37.8 per cent at the end of fiscal year 2016-17. Between 2012-13 and 2014-15, because net debt grew more quickly than GDP, the ratio increased from 37.2 per cent to 39.2 per cent before dropping back to 37.8 per cent in 2016-17, as GDP grew faster than net debt from 2015-16 to 2016-17.
The government continues to maintain a target of returning net debt to GDP to the pre-recession level of 27 per cent by 2029-30. An important component in achieving this is the government’s balanced budget projection from 2017-18 onward. The government plans to invest more than $190 billion in capital infrastructure over 13 years starting from 2014-15. These capital investments will be amortized over a period of time that corresponds to the useful life of the assets. After balancing the budget, increases in debt will be limited to the difference between the cash investment to build the assets and the amortization, which is a non-cash expense.
The government’s plan to reduce the ratio of net debt-to-GDP therefore hinges on the balanced budget and investing in capital assets to help the economy grow, both of which will help achieve the 27 per cent target.
The ratio of net debt to total revenue is another measure of sustainability, since net debt reflects the future revenue that is required to pay for past transactions and events. A lower net debt to revenue ratio indicates higher sustainability. In 2012-13, the ratio was 210.1 per cent. It rose to 226.2 per cent in 2014-15, as net debt grew more quickly than revenue. The ratio fell to 214.3 per cent in 2016-17, indicating that total revenues increased at a greater rate than did net debt.
Measures of flexibility
The ratio of interest on debt to total revenue shows the share of provincial revenue that is being used to pay borrowing costs and thus is not available for programs. A lower ratio indicates that a government has more flexibility to direct its revenues to programs. The ratio has steadily fallen for Ontario over the past five years, from a high of 9.1 per cent in 2013-14 to the current level of 8.3 per cent. Lower interest rates, as well as the Province’s strategy of extending the term of its borrowing program and locking in historically low interest rates for a longer period has also contributed to lower interest costs. This strategy has extended the weighted average term to maturity of provincially issued debt from approximately 9 years in 2009-10 to 14 years in 2016-17.
Own-source revenue as a share of the provincial GDP shows the extent to which the government is using funds from the provincial economy collected through taxation, user fees and other revenue sources it controls. Too high a taxation burden makes a jurisdiction uncompetitive, so increases in the ratio can reduce future revenue flexibility. Ontario’s ratio was stable between 2012-13 and 2016-17.
Measures of vulnerability
Transfers from the federal government as a percentage of total revenue are an indicator of the degree to which the Province relies on the federal government for revenue. A very high ratio shows that a provincial government is very reliant on federal transfers, a source of revenue over which it has limited or no control, and is therefore vulnerable to shifts in federal policy on transfers. Ontario’s highest share of revenue from federal transfers in the past five years was 18.4 per cent, in 2013-14. The lowest was 17.0 per cent, in 2015-16. The gradual decline largely represents the expiration of time-limited federal transfers, including the HST transition payment, and the maturing of federal stimulus programs put in place following the global economic crisis in 2008.
Foreign currency debt to total debt is a measure of vulnerability to changes in foreign currency exchange rates. Accessing borrowing opportunities in foreign currencies allows Ontario to diversify its investor base and take advantage of lower borrowing costs. It also ensures that the Province will continue to have access to capital in the event that domestic market conditions become more challenging. Ontario manages foreign currency risk by hedging its exposure to Canadian dollars through the use of financial instruments. Effective hedging has allowed the Province to consistently limit its exposure to foreign currency fluctuations to 0.7 per cent of debt issued for provincial purposes in 2013-14, declining to 0.2 per cent in 2016-17.
Responsible fiscal management
The 2016-17 annual deficit of $1.0 billion was an improvement of $3.3 billion from the $4.3 billion deficit target laid out in the 2016 Budget. As a result, Ontario has achieved better-than-planned results in each of the last eight years.
The government’s record of strong fiscal management is due to an ongoing focus on managing growth in spending, as well as stimulating the economy and protecting revenue. Historically low interest rates have also helped the government overachieve on its fiscal targets and have supported its efforts to balance the budget while cost-effectively managing debt.
As a result of Ontario’s plan to grow the economy and the government’s ongoing commitment to transforming programs and services, the 2017 Budget plan delivered on the government’s commitment to restore balance in 2017-18. The Province is also projecting balanced budgets in both 2018-19 and 2019-20.
A balanced budget allows the government to invest more in health care, education and other priorities, and positions the Province to better respond to demographic challenges and unexpected global economic changes.
After declines in revenue in 2008-09 and 2009-10, paralleled by poor economic conditions in those years, Ontario’s economic and revenue performance have shown steady gains. Ontario’s economic recovery from the global recession has been driven by solid economic fundamentals, supported by long-term job-recovery efforts such as significant infrastructure investments. Between 2012-2013 and 2016-2017, revenue has grown at an average annual rate of 4.0 per cent, while nominal GDP has grown at an average annual rate of 3.9 per cent.
To protect provincial revenues, better support consumer and work safety and provide a level playing field for legitimate businesses, the government has focused on fighting underground economic activities. As noted in the 2017 Budget, Ontario has generated over $1.2 billion in revenue since 2013-14 through ongoing, enhanced compliance-focused measures.
Government action to manage growth in spending has achieved results. Program expense fell to 16.3 per cent of GDP in 2016-17, lower than the 18.8 per cent reached in 2009-10. Ontario has the lowest per-capita program spending among all Canadian provinces.
Program Review, Renewal and Transformation
Through Program Review, Renewal and Transformation (PRRT), the government is supporting evidence-based decision-making, and identifying transformational initiatives focused on modernizing services, finding savings and improving outcomes for Ontarians. The government will continue to review its programs to deliver the best possible results at the lowest cost. Evidence-based decision-making supports the use of limited public resources to improve outcomes and ensure the long-term sustainability of provincial programs and services that will meet the needs of Ontarians in the digital era.
Managing compensation
The 2017 Budget stated that the government will continue to take a balanced approach to managing compensation. This approach will recognize the need to maintain a stable, flexible and high-performing public-sector workforce that supports the government’s transformational priorities and at the same time ensures that public services continue to remain affordable.
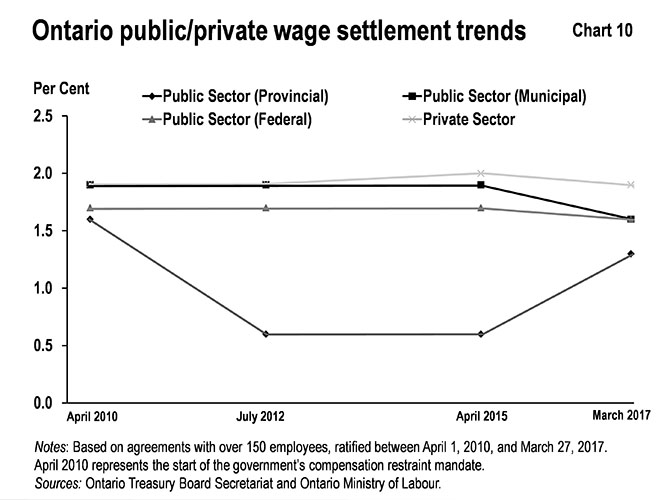
Wage outcomes in the provincial public sector continue to track below the municipal, federal and private sectors in Ontario.
Managing interest on debt
The interest on debt expense of $11.7 billion reported for 2016-17 was an improvement of $0.7 billion over the 2016 Budget. Through a combination of lower-than-forecast deficits and borrowing requirements, lower-than-forecast interest rates and cost-effective debt management, interest on debt has consistently come in below plan in each year since the 2010 Budget.
Non-financial activities
This section discusses key non-financial performance in major sectors. The purpose is to allow readers of the Annual Report to understand how the government is using the funds available to it to achieve specific outcomes.
Health care
The government continued to transform Ontario’s health care system to become more patient-centred and focused on better access to care, quality and value, as committed to in the Patients First: Action Plan for Health Care, launched in 2015. Patients First has four main goals: increase access to health care, improve care coordination, better inform Ontarians to support their health care decisions, and protect patients and the Province’s health care system for the future.
In 2016-17, the Province continued to make progress towards all four goals.
Access:
The Province made significant investments to increase patient access to the right care in their own homes, in the community and at the hospital. Investments for home and community care have increased by over five per cent and have provided enhanced home care to support patients with high needs, as well as caregiver supports.
In 2016 there were 140,167 nurses employed in Ontario, up 1.9 per cent or 2,642 more nurses from 2015.
The government announced a new facility at Sunnybrook Health Sciences Centre that will be built to offer specialized treatment for people with blood cancers. This investment along with the University Health Network’s Princess Margaret Cancer Centre, Hamilton Health Sciences and The Ottawa Hospital, will increase the capacity for malignant hematology services that includes stem cell transplants.
The government also celebrated the substantial completion of the Peel Memorial Centre for Integrated Health and Wellness in November 2016. The Centre officially opened in April 2017 and offers a wide range of services including an urgent care centre for those with non-life threatening illnesses or injuries, a day surgery facility, mental health and addictions programs, day clinics for dialysis for patients and diagnostic imaging services.
In addition, a new Ehlers-Danlos Syndrome clinic was opened in February 2017 at two hospital sites: Toronto General Hospital and the Hospital for Sick Children. This clinic will help improve access to specialized care and treatment for people living with this rare disease and help improve the transition from paediatric to adult care.
Connect:
The government passed the Patients First Act, 2016, which aims to help patients and their families obtain better access to a more local and integrated health care system, improving the patient experience and delivering higher-quality care. The legislation enhances Local Health Integration Network (LHIN) responsibility for home and community care, as well as strengthening the LHINs’ relationship with public health.
Inform:
Starting January 1, 2017, restaurants, convenience stores, grocery stores, movie theatres and other food service premises with 20 or more locations in Ontario have been required to post calorie counts for standard food items, giving people access to more information to help them make healthy choices.
The government designated Dr. David Williams, Ontario’s Chief Medical Officer of Health, as Ontario’s first-ever Provincial Overdose Coordinator to launch a new surveillance and reporting system to better respond to opioid overdoses in a timely manner, and inform how best to direct care.
Protect:
The Office of the Patient Ombudsman opened on July 1, 2016. The Ombudsman will receive and respond to complaints from patients about public hospitals, long-term care (LTC) homes and home care services, in order to help meet the needs of patients who have not had their concerns resolved through existing complaint mechanisms.
As announced on August 12, 2016, the government updated its rigorous inspection framework of LTC homes to include:
- Continued annual resident quality inspections for all LTC homes, to ensure that all homes are brought into compliance.
- A risk-based inspection framework, which prioritizes LTC homes based on risk, so that homes with complaints, critical incidents, compliance history and other risk factors are prioritized and are subject to extended inspections. This is in alignment with recommendations from the Auditor General’s 2015 report on Ontario’s Long-Term Care Homes Quality Inspection Program.
Ontario expanded the publicly funded immunization program in two significant initiatives, informed by evidence to support the investment. Starting in September 2016, students in grade 7, including boys, are offered the HPV vaccine to protect against human papillomavirus (HPV) infection and related cancers. Also, in September 2016, Ontario introduced a shingles immunization program for eligible seniors 65 to 70 years of age.
An amendment to the regulation under the Smoke-Free Ontario Act came into effect on January 1, 2017, which banned the sale of most menthol-flavoured tobacco products and clove cigarettes. This will help protect young people from the harmful effects of smoking, as almost half of young smokers in Ontario use flavoured tobacco products, while approximately a quarter of young smokers use menthol-flavoured products, making it by far the most popular flavour among youth.
Education
Ontario’s publicly funded early years and education system is focused on building a bright future for the province’s children and students, a strong workforce and a vibrant economy.
Outcomes reported in 2016-17 included:
- More high school students graduating. In 2016, 86.5 per cent of students graduated from high school, compared to 68 per cent in 2004. This is an increase of more than 18 percentage points.
Postsecondary and training
Postsecondary and training plays a critical role in preparing people in every community and occupation with the knowledge and skills that help build a strong and successful province. Ontario’s economic prosperity and competitive advantage are increasingly dependent on a highly skilled, diverse and adaptive workforce.
Outcomes reported in 2016-17 included:
- Helping people in Ontario achieve higher levels of education. In 2016, the province achieved a 68 per cent postsecondary attainment rate, higher than the rate for any country in the Organisation for Economic Co-operation and Development.
- Investments in student financial assistance since 2003 have resulted in more than double the number of students qualifying for aid, while enrolment has increased by 38 per cent. Rates of participation in postsecondary education among Ontario’s young people are higher than for the rest of Canada.
Condition of provincial tangible capital assets
As part of the annual budgeting process, each ministry that owns and operates infrastructure is required to prepare and update a plan to properly maintain its assets.
In line with the Infrastructure for Jobs and Prosperity Act, 2015, the Province compiled a Provincial Infrastructure Asset Inventory in 2016. The inventory is the foundation for informing infrastructure planning, and in particular, for advising on appropriate funding allocations between infrastructure expansion and renewal needs.
The inventory currently contains over 10,000 tangible capital assets, such as buildings, as well as the entirety of the province’s bridges and road network. The inventory includes most of the infrastructure assets owned or consolidated (i.e., broader public sector) by the Province as well as their age, condition and value. It does not include capital assets that are owned by other levels of government, such as marine ports and airports (federal) or local roads and community centres (municipal).
Moving forward, a robust dataset will facilitate the integration of other relevant data, such as demographics, into the infrastructure planning process. The asset inventory will be updated annually to include additional asset classes (e.g., machinery and equipment) and more information that is comparable across sectors, along with establishing a baseline to measure change over time. The Province continues to develop consistent approaches to collecting and reporting infrastructure asset information and ensuring metrics are reliable and timely to support robust, evidence-based infrastructure planning and decision-making.
The Province will use the inventory to track, monitor and report on the physical condition of assets. The inventory contains Facility Condition Indexes (FCIs), Bridge Condition Indexes (BCIs) and Pavement Condition Indexes (PCIs) as performance measures of the state of infrastructure asset and repair and renewal needs.
To help ensure that public infrastructure is aligned with the needs of Ontarians, the government is creating a long-term infrastructure plan that describes the Province’s existing infrastructure portfolio, outlines anticipated needs of the portfolio and proposes strategies to meet these needs. The Province plans to release the plan by the end of 2017.
Transparency and accountability
Ontario continues to take steps to enhance government transparency and fiscal accountability in financial reporting.
Recent developments in public sector accounting standards
The Province’s financial reports are prepared in accordance with the accounting principles for governments issued by the Public Sector Accounting Board (PSAB) of the Chartered Professional Accountants of Canada (CPA Canada).
PSAB’s project on the concepts underlying financial performance remains a work in progress. Ontario, along with other senior Canadian governments, continues to monitor the work of the project’s task force and to provide input to support high-quality Canadian public sector accounting standards.
As described in Note 17 to the Consolidated Financial Statements, future changes in both public sector and private sector accounting standards may affect how assets, liabilities, revenues and expenses are reported in the Province’s consolidated financial reports. Other current projects that are being closely monitored by Ontario include PSAB’s review of its employment benefits standard, which includes accounting for pensions as well as accounting for financial instruments, foreign currency translation, asset retirement obligations, revenue reporting and public-private partnerships.
The C.D. Howe Institute Fiscal Accountability Report
Each year, the C.D. Howe Institute, an independent research organization supporting economically sound public policies, produces a report on its assessment of the fiscal planning and reporting practices of senior Canadian governments.
The Institute observes that financial reports are a vital tool for understanding governments’ financial plans and activities. In this regard, consistency and comparability of planned and actual results in the Budget, Estimates and summary financial statements of the Province are essential to allow users to compare performance against the Budget plan and to understand longer-term trends.
The most recent report assesses the quality of financial information released by senior Canadian governments and their success or failure in achieving their budgetary goals over the past 15 years.
The report acknowledges that Ontario scored well with respect to the consistency and accessibility of their headline numbers, but that a qualified audit opinion
Other matters
Trillium Trust
The Trillium Trust Act, 2014, provides for an account to be maintained in the Public Accounts that records the prescribed amounts of financial benefits to Ontario from the disposition of qualifying assets under the Act. The Act also requires the account to record all expenditures made under the Act to support infrastructure investments. A report on the financial activities of the Trillium Trust is included as a schedule in Volume 1 of the Public Accounts.
Volume 1 shows that the balance of the Trillium Trust as at March 31, 2017, was $5.05 billion. This reflects an opening balance of $1.35 billion; $3.96 billion credited to the Trillium Trust in 2016-17 from the sale of Hydro One Limited shares and the sale of the LCBO’s head office lands; and $0.26 billion in expenditures from the Trillium Trust in 2016-17 toward investments in infrastructure.
Digital tools
Once again, the government is making it easier for Ontarians to understand the government’s finances by providing digital tools to present Public Accounts data in innovative, interactive and visual formats. This year’s tools are available at Ontario.ca/publicaccounts and include:
- Interactive data visualization tools that graphically present details on asset and expense information contained in Volume 1;
- Fully sortable data tables that summarize the financial statements from Volume 2, and the detailed schedules of payments from Volume 3; and
- Downloadable open data sets that provide the five-year trend for government revenue by source, revenue by sector, and statement of operations.
These tools help make the Province’s finances easier to understand, access and use, and are part of Ontario’s commitment to creating a more open and transparent government.
Footnotes
- footnote[1] Back to paragraph Amounts reported as "Plan" in the 2016 Budget have been reclassified to reflect a presentation change for hospitals, school boards and colleges. Third-party revenue for these organizations, previously netted against sector expenses is now classified as revenue, as described in "Accounting changes" on page 31. The annual and accumulated deficit were not affected by the reclassification.
- footnote[2] Back to paragraph Actual results for 2015-16 have been restated to reflect both the presentation change as described in footnote 1 as well as the impact of reversing the accounting as prescribed by Regulation 395/11 for net pension assets of jointly sponsored pension plans, as described in "Accounting changes" on page 31.
- footnote[3] Back to paragraph Amounts reported as "Plan" in the 2016 Budget have been reclassified to reflect a presentation change for hospitals, school boards and colleges. Third-party revenue for these organizations, previously netted against sector expense, is now classified as revenue, as described in "Accounting changes" on page 31.
- footnote[4] Back to paragraph Actual results for 2015-16 have been restated to reflect both the presentation change as described in footnote 1 as well as the impact of reversing the accounting as prescribed by Regulation 395/11 for net pension assets of jointly sponsored pension plans, as described in "Accounting changes" on page 31.
- footnote[5] Back to paragraph Teachers’ Pension Plan expense is included in Other programs. In the Consolidated Financial Statements, this expense item appears under the Education sector. Schedule 4 to the financial statements provides details.
- footnote[6] Back to paragraph The 2016 Budget included a Year End Savings Target of $800 million to be achieved through operational efficiencies.
- footnote[7] Back to paragraph Provincial revenues from Hydro One Limited’s net income are in proportion to provincial ownership.
- footnote[8] Back to paragraph Before August 31, 2015, Hydro One Brampton Networks Inc., a subsidiary of Brampton Distribution Holdco Inc., was a subsidiary of Hydro One and its results were included in those of Hydro One in the Province’s financial reports.
- footnote[9] Back to paragraph Includes adjustments for the net book value of assets disposed of during the year, as well as changes in valuation.
- footnote[10] Back to paragraph Mainly transfers for capital purposes to municipalities and universities and expenditure for capital repairs.
- footnote[11] Back to paragraph Includes government administration, natural resources, social, culture and tourism sectors.
- footnote[12] Back to paragraph Includes third-party capital investments in consolidated entities such as hospitals, schools boards and colleges.
- footnote[13] Back to paragraph The Province’s operating deficit of $1.0 billion was offset by a net $2.3 billion in changes to assets and liabilities that provided cash for operating purposes. See the Consolidated Statement of Cash Flow.
- footnote[14] Back to paragraph New investments of $10.0 billion less proceeds of $0.1 billion from the sale of tangible capital assets.
- footnote[15] Back to paragraph Including net increase in financing of capital projects through AFP. See Note 4 to the Consolidated Financial Statements.
- footnote[16] Back to paragraph See https://news.ontario.ca/tbs/en/2017/02/pension-asset-expert-advisory-panel-submits-report.html.
- footnote[17] Back to paragraph See https://news.ontario.ca/tbs/en/2016/11/ontario-names-expert-panel-to-review-pension-assets.html.
- footnote[18] Back to paragraph See /page/pension-asset-expert-advisory-panel-report.
- footnote[19] Back to paragraph See https://news.ontario.ca/tbs/en/2017/02/pension-asset-expert-advisory-panel-submits-report.html.
- footnote[20] Back to paragraph See /page/pension-asset-expert-advisory-panel-supplemental-report.
- footnote[21] Back to paragraph Teachers’ Pension Plan expense is included in Other programs. In the Consolidated Financial Statements, this expense item appears under the Education sector. Schedule 4 to the financial statements provides details.
- footnote[22] Back to paragraph Teachers’ Pension Plan expense is included in Other programs. In the Consolidated Financial Statements, this expense item appears under the Education sector. Schedule 4 to the financial statements provides details.
- footnote[23] Back to paragraph Teachers’ Pension Plan expense is included in Other programs. In the Consolidated Financial Statements, this expense item appears under the Education sector. Schedule 4 to the financial statements provides details.
- footnote[24] Back to paragraph Teachers’ Pension Plan expense is included in Other programs. In the Consolidated Financial Statements, this expense item appears under the Education sector. Schedule 4 to the financial statements provides details.
- footnote[25] Back to paragraph See https://news.ontario.ca/tbs/en/2016/10/ontario-releases-2015-16-public-accounts.html.