Public Accounts 2020-21: Annual report
The annual report is a high-level summary of the fiscal year’s results. It includes financial statements, analyzes the state of the province’s finances and outlines achievements for the fiscal year.
Foreword
I am pleased to present the 2020–21 Public Accounts for the Province of Ontario. Each year, the government releases the Public Accounts to give the people of Ontario a clear, honest and transparent view into how their taxpayer dollars were managed. Since day one, our government has been fully committed to restoring trust and accountability in Ontario’s finances — and throughout the COVID-19 pandemic, we have not wavered in meeting those goals.
The COVID-19 pandemic made the 2020–21 fiscal year a period like no other. It created unprecedented financial planning challenges for all jurisdictions around the world. Our government embraced full transparency and accountability to the people of Ontario by becoming the first jurisdiction in Canada to release a fiscal plan that reflected the potential impacts of COVID-19 through the March 2020 Economic and Fiscal Update (Ontario’s Action Plan 2020: Responding to COVID-19). Then, in November 2020, we published the 2020 Ontario Budget (Ontario’s Action Plan: Protect, Support, Recover), which included significant additional investments, and revised economic forecasts in the face of significant uncertainty about the pandemic. At every step of this difficult journey, our government has ensured the people of Ontario had access to regular and timely updates with the latest available information on our ongoing fight against COVID-19.
The 2020–21 Public Accounts reveal that our government spared no expense in protecting the health and safety of the people of Ontario, supporting families and businesses, and ensuring that our frontline heroes were equipped to safeguard our collective well-being. Throughout this fiscal year, we made available every resource necessary to respond to the COVID-19 pandemic.
In fact, government program spending rose by $16.7 billion compared to 2019–20. This represents the single largest year-over-year dollar increase in program spending on record for Ontario. These critical investments include increases of $5.8 billion (9.1 per cent) in the health sector and $1.1 billion (3.6 per cent) in the education sector over 2019–20.
In total, the province invested $19.1 billion responding to the COVID-19 pandemic. These investments created real and measurable positive results for the people of Ontario including:
- Over $3 billion in urgent and unprecedented support to over 110,000 small businesses required to close or significantly restrict services as a result of provincial public health measures.
- Over $3 billion in provincial contributions to support 444 municipalities and 110 transit systems across the province help relieve financial pressures created by the pandemic and ensure that people who need to get around, including our frontline workers, have safe and reliable transit service during COVID-19 pandemic.
- Over $1.6 billion in temporary resources available for the 2020–21 school year to support the safe reopening and operation of schools.
- $1.5 billion to support long‐term care homes during the COVID‐19 pandemic, including funding for infection prevention and containment measures, staffing supports and personal protective equipment (PPE).
- $703 million to add over 3,100 hospital beds to create capacity and be ready to respond to any scenario.
- $369.3 million to purchase 290 million pieces of PPE and critical supplies and equipment (CSE), including 120 million surgical masks, 138 million gloves, 11 million disinfectant and cleaning products and 4 million face shields.
- Distributed all 20.5 million doses of the vaccines administered across Ontario.
As reported in the 2021 Ontario Budget, the government made $13.3 billion in time‐limited pandemic response and extraordinary contingencies available in 2020–21 through one-time COVID‐19 Health Sector Expense, the COVID-19 Health Contingency Fund and the Support for People and Jobs Fund. These strategic contingencies allowed the government to prudently respond in real-time to emerging and unforeseen needs. By the end of the 2020–21 fiscal year, both funds had been fully allocated.
This year has been one of immense challenges for all Ontarians. Through their determination, perseverance and steadfast adherence to public health guidance, we have continued to meet those challenges head-on. But we know that we must remain vigilant. That is why we will continue to leverage the full extent of Ontario’s fiscal firepower to protect people’s health and jobs.
Original signed by
The Honourable Prabmeet Sarkaria
President of the Treasury Board
Introduction
The Annual Report is a key element of the Public Accounts of the Province of Ontario and is central to demonstrating the Province’s transparency and accountability in reporting its financial activities and position. Due to the extraordinary challenges of planning during a global pandemic, the government released the March 2020 Economic and Fiscal Update (Ontario’s Action Plan 2020: Responding to COVID-19) a one-year economic and fiscal update based on the latest economic projections. As projections were revised, the government released the 2020 Ontario Budget (Ontario’s Action Plan: Protect, Support, Recover) in November 2020.
To provide clarity and transparency to the people of Ontario, this Annual Report presents the financial results for the 2020–21 fiscal year against both the March 2020 Economic and Fiscal Update and the 2020 Ontario Budget. As in previous years, the Annual Report also compares the current year’s results to the prior year’s results and provides a five-year trend analysis for many key financial ratios.
Producing the Public Accounts of Ontario requires the teamwork and collaboration of many stakeholders across Ontario’s public sector. The Office of the Auditor General plays a critical role in auditing and reporting on the Province’s financial statements, and the Standing Committee on the Public Accounts also plays an important role in providing legislative oversight and guidance. I would like to thank everyone for their contributions and collaboration.
We welcome your comments on the Public Accounts. Please share your thoughts by email to infoTBS@ontario.ca, or by writing to the Office of the Provincial Controller, Re: Annual Report, Treasury Board Secretariat, Second Floor, Frost Building South, 7 Queen’s Park Crescent, Toronto, Ontario M7A 1Y7.
Original signed by
Carlene Alexander, CPA, CGA, MBA
Deputy Minister and Comptroller General
Office of the Comptroller General
Treasury Board Secretariat
Statement of Responsibility
The Consolidated Financial Statements are prepared by the Government of Ontario in accordance with the accounting principles for governments issued by the Public Sector Accounting Board (PSAB).
The Consolidated Financial Statements are audited by the Auditor General of Ontario in accordance with the Auditor General Act, and with Canadian generally accepted assurance standards. The Auditor General expresses an independent audit opinion on these Consolidated Financial Statements. Her report, which appears on pages 53-55, provides her audit opinion and the basis for this opinion.
Management prepares the Consolidated Financial Statements in accordance with generally accepted accounting principles for the public sector. Management is also responsible for maintaining systems of financial management and internal controls to provide reasonable assurance that transactions recorded in the Consolidated Financial Statements are within statutory authority, assets are properly safeguarded, and reliable financial information is available for preparation of these Consolidated Financial Statements.
Original signed by
Carlene Alexander, CPA, CGA, MBA
Deputy Minister and Comptroller General,
Office of the Comptroller General Treasury Board Secretariat
August 27, 2021
Original signed by
Greg Orencsak
Deputy Minister,
Ministry of Finance
August 27, 2021
Original signed by
Maureen Buckley, CPA, CA
Assistant Deputy Minister and Provincial Controller,
Treasury Board Secretariat
August 27, 2021
The Government of Ontario is responsible for the Consolidated Financial Statements and accepts responsibility for the objectivity and integrity of these Consolidated Financial Statements and the Financial Statement Discussion and Analysis. Those charged with governance are responsible for overseeing the Government of Ontario’s financial reporting process.
Original signed by
The Honourable Prabmeet Sarkaria
President of the Treasury Board
August 27, 2021
Original signed by
The Honourable Peter Bethlenfalvy
Minister of Finance
August 27, 2021
Financial statement discussion and analysis
Highlights
2020–21 Financial highlights ($ Billions) - table 1
| Consolidated statement of operations for the fiscal year ended March 31 | March 2020 Economic and fiscal update | 2020 Budget | 2020–21 Actual | 2019–20 Actual | Change from March 2020 Economic and fiscal update | Change from 2020 Budget | Change from 2019–20 Actual |
|---|---|---|---|---|---|---|---|
| Total revenue | 156.3 | 151.1 | 164.9 | 156.1 | 8.6 | 13.8 | 8.8 |
| Expense: Programs | 161.1 | 174.6 | 169.0 | 152.3 | 7.9 | (5.6) | 16.7 |
| Expense: Interest on debt | 13.2 | 12.5 | 12.3 | 12.5 | (0.9) | (0.2) | (0.2) |
| Total expense | 174.3 | 187.0 | 181.3 | 164.8 | 7.0 | (5.7) | 16.5 |
| Reserve | 2.5 | 2.5 | – | – | (2.5) | (2.5) | – |
| Annual deficit | (20.5) | (38.5) | (16.4) | (8.7) | 4.1 | 22.1 | (7.7) |
| Consolidated statement of financial position as at March 31 | March 2020 Economic and fiscal update | 2020 Budget1 | 2020–21 Actual | 2019–20 Actual | Change from March 2020 Economic and fiscal update | Change from 2020 Budget | Change from 2019–20 Actual |
|---|---|---|---|---|---|---|---|
Financial assets | 117.4 | 94.1 | 23.3 | ||||
Liabilities | 491.0 | 447.4 | 43.6 | ||||
| Net debt | (373.6) | (353.3) | (20.3) | ||||
Non-financial assets | 134.3 | 127.6 | 6.7 | ||||
| Accumulated deficit | (239.3) | (225.8) | (13.5) |
Note: Numbers may not add due to rounding.
Financial highlights
The March 2020 Economic and Fiscal Update was reflective of the uncertainty and volatility at the beginning of the pandemic. The outlook did not account for all the sudden, unforeseen and substantial impacts on the economy and Ontario’s finances — much of which was still unknowable at the time. The government made immediate funding available to ensure a comprehensive and timely response to the COVID-19 pandemic across the health sector and other critical public services. Throughout the first, second and third waves of the pandemic, the government worked in partnership with hospitals, the long-term care sector, schools, municipalities, First Nations and other public-sector organizations to provide the necessary resources for the evolving pandemic landscape — a tumultuous period that often required redeploying resources to meet critical emerging needs. Through the 2020 Budget released in November 2020, further additional investments were made in critical areas to meet emerging needs. As we move forward, the Ontario government is fully committed to continuing to do whatever it takes to protect the health and safety of the people of Ontario.
Prior year 2019–20 actuals vs. 2020–21 actuals
- The Province ended with a $16.4 billion deficit for the fiscal year ended March 31, 2021, which is $7.7 billion higher than the previous year’s deficit, primarily due to higher program expenses, and partially offset by higher revenues and lower interest on debt (see Table 1 above).
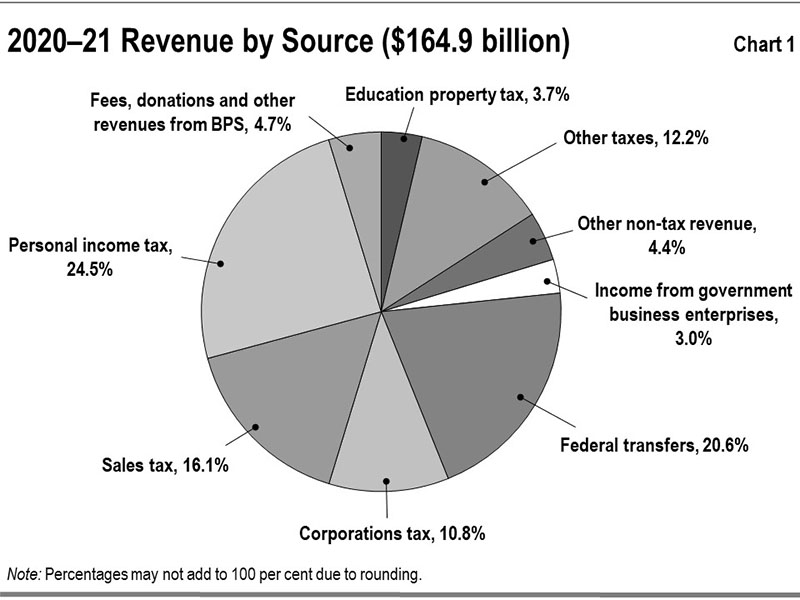
- Total revenues are $164.9 billion, which are $8.8 billion or 5.6 per cent higher than the previous year, mainly due to an increase in transfers from the Government of Canada and an increase in taxation revenue, while there was a decrease in revenue from hospitals, school boards and colleges and net income from Government Business Enterprises (GBEs). See details on pages 10-11.
- Total program expenses are $169.0 billion, which are $16.7 billion or 11.0 per cent higher than the previous year. While investments are higher in health, education, children’s and social services, justice and other programs, program expenses in postsecondary education are lower. See details on pages 16-18.
- Higher expenses in the health sector of $5.8 billion or 9.1 per cent from the previous year and children’s and social services sector of $0.4 billion or 2.3 per cent from the previous year primarily due to additional spending in response to the COVID-19 pandemic, including support for personal protective equipment (PPE) and other critical supplies, temporary pandemic pay and temporary personal support worker wage enhancement as well as the Province’s COVID-19 testing and vaccination roll-out;
- Higher expenses in the education sector of $1.1 billion or 3.6 per cent from the previous year primarily due to investments in schools to keep students and staff safe, and the Support for Learners and Ontario COVID-19 Child Benefit initiatives to provide time-limited financial support directly to parents to help offset added costs of COVID-19;
- Lower expenses in the postsecondary education sector of $0.7 billion or 6.7 per cent from the previous year primarily due to students receiving benefits from federal government programs in response to the COVID-19 pandemic;
- Higher expenses in the justice sector of $0.2 billion or 4.3 per cent from the previous fiscal year primarily due to the COVID-19 related costs at correctional institutions and a one-time accounting adjustment related to the Victim Fine Surcharges Program. This was partially offset by decreases in some operational costs during the COVID-19 pandemic and lower payments made under the Crown Liability and Proceedings Act, 2019; and
- Higher expenses in other programs of $10.1 billion or 38.8 per cent from the previous year primarily due to the Ontario Small Business Support Grant, that provided support to eligible small businesses impacted by COVID-19, as well as supports to municipalities and transit systems during the pandemic.
- Interest on debt is lower than the previous year by $0.2 billion or 1.6 per cent mainly due to lower borrowing rates on both refinancing maturities and new debt issued to fund the deficit and investments in capital assets. See details on page 27.
- The net book value of Ontario’s capital assets, such as buildings and transportation infrastructures, grew by $6.4 billion during the year. Ontario invested $13.0 billion in assets owned by the Province and its consolidated entities, which reflect new capital investments, mainly in the transportation, health and social sectors. The Province also made $2.4 billion in additional investments in transfers to non-consolidated partners and other infrastructure expenditures. See details on pages 31-33.
- Total liabilities increased by $43.6 billion and total financial assets increased by $23.3 billion, resulting in an increase of $20.3 billion or 5.7 per cent in net debt from the previous year (see details on pages 30-35). Accumulated deficit increased by $13.5 billion or 6.0 per cent from the previous year mainly as a result of the reported deficit of $16.4 billion offset by other adjustments. See details on page 59.
March 2020 Economic and Fiscal Update vs. 2020–21 actuals
- The Province ended with a $16.4 billion deficit for the fiscal year ended March 31, 2021, which is $4.1 billion lower than the March 2020 Economic and Fiscal Update primarily due to higher revenues and lower interest on debt and partially offset by an increase in program spending (see Table 1 above).
- Total revenues are $164.9 billion, which are $8.6 billion or 5.5 per cent higher than expected in the March 2020 Economic and Fiscal Update forecast due to higher transfers from the Government of Canada, taxation revenues and net income from GBEs, and partially offset by lower revenue from hospitals, school boards and colleges and other non-tax revenues. See details on page 11.
- Total program expenses are $169.0 billion, which are $7.9 billion or 4.9 per cent higher than the March 2020 Economic and Fiscal Update. While investments are higher in health, education, justice and other programs, program expenses in postsecondary education and children’s and social services are lower. See details on pages 18-21.
- Higher than planned expenses in the health sector of $1.7 billion or 2.5 per cent is primarily due to increased investments in hospitals and long-term care homes to address the COVID-19 pandemic;
- Higher than planned expenses in the education sector of $1.0 billion or 3.3 per cent is primarily due to investments in schools to keep students and staff safe, and in the Support for Learners and Ontario COVID-19 Child Benefit initiatives to provide time-limited financial support directly to parents to help offset added costs of COVID-19;
- Higher than planned expenses in the justice sector of $0.4 billion or 8.9 per cent is primarily due to COVID-19 expenses related to industrial cleaning, commodity and medical supplies, accommodation lease costs to ensure correctional institutions and court facilities are safe and accessible, funding to the Alcohol and Gaming Commission of Ontario (AGCO) as a result of reduced recoveries from the horseracing, cannabis and gaming sectors due to the closure of non-essential businesses during the pandemic, and a one-time accounting adjustment related to the Victim Fine Surcharges Program;
- Lower than planned expenses in the postsecondary education sector of $0.9 billion or 8.4 per cent and children’s and social services sector of $0.2 billion or 1.1 per cent is primarily due to individuals and families receiving benefits from federal government programs in response to the COVID-19 pandemic; and
- Higher than planned expenses in the other programs sector of $6.0 billion or 19.9 per cent is primarily due to the Ontario Small Business Support Grant, which provided support to eligible small businesses impacted by COVID-19, as well as supports to municipalities and transit systems during the pandemic.
- Interest on debt is lower than the March 2020 Economic and Fiscal Update by $0.9 billion or 6.8 per cent due to lower than forecast interest rates. See details on page 27.
2020 Budget vs. 2020–21 actuals
- The Province ended with a $16.4 billion deficit for the fiscal year ended March 31, 2021, which is $22.1 billion lower than the 2020 Budget primarily due to higher than projected revenues, lower program expenses and lower interest on debt (see Table 1 above). As the 2020 Budget, which was released in November 2020, was prepared during the second wave of the pandemic, the government spared no expense to provide unprecedented support for people and jobs. With continued uncertainty in the risk of surges and future waves of the pandemic, substantial amounts of funding were made available to critical areas, specifically health care and hospitals. The third wave did not peak and recede in Ontario until late spring/early summer 2021; therefore, spending was less than anticipated for 2020–21 as most of the spending to address the third wave of the pandemic occurred in 2021–22.
- Total revenues are $164.9 billion, which are $13.8 billion or 9.1 per cent higher than expected in the 2020 Budget forecast, mainly due to higher taxation revenues, net income from GBEs and transfers from the Government of Canada, while there was lower revenue from hospitals, school boards and colleges. See details on page 12.
- Total program expenses are $169.0 billion, which are $5.6 billion or 3.2 per cent lower than the 2020 Budget. While investments are higher in education and justice, program expenses in health, postsecondary education, children’s and social services and other programs are lower. See details on pages 22-23.
- Lower than planned expenses in the health sector of $3.5 billion or 4.8 per cent is primarily because of lower-than-forecasted expenses due to the evolving and uncertain landscape of the COVID-19 pandemic as well as lower than expected use of other health care services in the OHIP program, including fewer visits to physicians and fewer non emergency procedures;
- Higher than planned expenses in the education sector of $0.3 billion or 1.0 per cent is primarily due to investments in schools to keep students and staff safe, and in the Support for Learners and Ontario COVID-19 Child Benefit initiatives to provide time-limited financial support directly to parents to help offset added costs of COVID-19;
- Lower than planned expenses in the postsecondary education sector of $0.9 billion or 8.4 per cent and children’s and social services sector of $0.4 billion or 2.2 per cent is primarily due to individuals and families receiving benefits from federal government programs in response to the COVID-19 pandemic;
- Higher than planned expenses in the justice sector of $0.3 billion or 6.5 per cent is primarily due to COVID-19 expenses related to industrial cleaning; commodity and medical supplies; accommodation lease costs to ensure correctional services and court facilities are safe and accessible; operational support for the AGCO due to the closure of non-essential businesses during the pandemic, and a one-time accounting adjustment related to the Victim Fine Surcharges Program; and
- Lower total expenses of other programs of $1.3 billion or 3.5 per cent after accounting for a more than $3.0 billion investment in the Ontario Small Business Support Grant, that provided support to eligible small businesses impacted by COVID-19.
- Interest on debt is lower than the 2020 Budget by $0.2 billion or 1.6 per cent due to lower than forecast interest rates, offset by higher than budgeted consolidation adjustments including interest capitalization. See details on page 27.
Analysis of 2020–21 results
Revenue
Details of 2020–21 actual results ($ Billions) - table 2
| Item | March 2020 Economic and Fiscal Update | 2020 Budget | 2020–21 Actual | 2019–20 Actual | Change from March 2020 Economic and Fiscal Update | Change from 2020 Budget | Change from 2019–20 Actual |
|---|---|---|---|---|---|---|---|
| Revenue: Personal Income tax | 37.3 | 36.9 | 40.3 | 37.7 | 3.0 | 3.4 | 2.6 |
| Revenue: Sales tax | 29.1 | 24.9 | 26.6 | 28.6 | (2.5) | 1.7 | (2.0) |
| Revenue: Corporations tax | 15.2 | 9.9 | 17.8 | 15.4 | 2.6 | 7.9 | 2.4 |
| Revenue: Employer Health tax | 6.8 | 6.3 | 6.5 | 6.7 | (0.3) | 0.2 | (0.2) |
| Revenue: Education Property tax | 6.3 | 6.1 | 6.0 | 6.2 | (0.3) | (0.1) | (0.2) |
| Revenue: Ontario Health Premium | 4.1 | 4.0 | 4.3 | 4.1 | 0.2 | 0.3 | 0.2 |
| Gasoline and Fuel tax | 2.7 | 3.1 | 2.6 | 3.6 | (0.1) | (0.5) | (1.0) |
| Revenue: Other taxes | 6.7 | 6.3 | 6.7 | 5.9 | 0.0 | 0.4 | 0.8 |
| Total taxation Revenue | 108.2 | 97.5 | 110.9 | 108.3 | 2.7 | 13.4 | 2.6 |
| Government of Canada | 26.3 | 33.4 | 33.9 | 25.4 | 7.6 | 0.5 | 8.5 |
| Income from Government Business Enterprises | 4.1 | 3.6 | 5.0 | 5.9 | 0.9 | 1.4 | (0.9) |
| Other non-tax revenue | 17.6 | 16.7 | 15.1 | 16.5 | (2.5) | (1.6) | (1.4) |
| Total revenue | 156.3 | 151.1 | 164.9 | 156.1 | 8.6 | 13.8 | 8.8 |
Note: Numbers may not add due to rounding.
Change from 2019–20 actuals and earlier years
Total revenues for 2020–21 increased by $8.8 billion, or 5.6 per cent, from the previous year.
- Taxation revenue increased 2.4 per cent in 2020–21 despite real GDP decreasing 5.1 per cent in 2020. This was significantly different from experience in past major economic downturns where there was a large decline in taxation revenues corresponding to a significant decrease in real GDP. For example, taxation revenues declined by 5.6 per cent in 1991–92 while real GDP decreased 3.4 per cent in 1991, and taxation revenues declined by 5.8 per cent in 2009–10 while real GDP decreased 3.1 per cent in 2009. During 2020–21 unprecedented financial support from all levels of government was provided to people and businesses in response to the COVID-19 pandemic, which contributed to growth in Personal and Corporate Income Tax revenues. The increase in Taxation revenues reflects a $2.6 billion increase in Personal Income Tax (PIT) and $2.4 billion increase in Corporations Tax (CT), partially offset by a $2.0 billion decrease in Sales Taxes and an overall $0.4 billion decrease in All Other Taxes.
- Transfers from the Government of Canada increased $8.5 billion or 33.5 per cent higher primarily due to one-time funding related to the COVID-19 pandemic.
- Net income from GBEs decreased $0.9 billion or 15.3 per cent lower. Lower net income from the Ontario Lottery and Gaming Corporation (OLG) resulted from the closure of casinos due to COVID-19 public health restrictions. Net income from Ontario Power Generation Inc. (OPG), Hydro One Ltd. (HOL), the Liquor Control Board of Ontario (LCBO) and the Ontario Cannabis Retail Corporation (OCRC) increased.
- Other non-tax revenue including revenue from hospitals, school boards and colleges, decreased by $1.4 billion or 8.5 per cent in 2020–21, mainly due to reduced activity related to the COVID-19 pandemic. This was mainly due to lower revenue from service fees and tuition as a result of COVID-19 pandemic related measures and restrictions.
Change from the March 2020 Economic and Fiscal Update
The COVID-19 pandemic resulted in a significant contraction in economic activity around the world in 2020. Ontario’s real gross domestic product (GDP) declined 5.1 per cent in 2020. This was below the Ministry of Finance forecast of 0.0 per cent in the March 2020 Economic and Fiscal Update. Ontario’s real GDP increased 1.2 per cent in the first quarter of 2021.
Revenues for 2020–21 were $8.6 billion or 5.5 per cent higher than expected in the March 2020 Economic and Fiscal Update. See Chart 1 for a breakdown of revenues by source.
- Taxation revenues were $2.7 billion or 2.5 per cent higher than forecast in the March 2020 Economic and Fiscal Update, primarily due to a $3.0 billion increase in PIT and a $2.6 billion increase in CT, partially offset by a $2.5 billion decrease in Sales Taxes and a $0.5 billion decrease in all other taxes combined. During 2020–21 unprecedented financial support from all levels of government was provided to people and businesses in response to the COVID 19 pandemic, which contributed to growth in Personal and Corporate Income Tax revenues.
- Transfers from the Government of Canada were higher than projected by $7.6 billion or 28.9 per cent largely due to one‐time federal funding related to the COVID‐19 pandemic.
- Income from GBEs was $0.9 billion or 22.0 per cent higher than forecast. This was due to higher net income from OPG, HOL, and the LCBO. Net income from the OLG was lower as a result of the closure of casinos due to COVID-19 public health restrictions.
- Other non-tax revenues including revenue from hospitals, school boards and colleges, are lower than projected by $2.5 billion or 14.2 per cent. This was mainly due to lower revenue from service fees and tuition as a result of COVID-19 pandemic related measures and restrictions.
Change from the 2020 Budget
Ontario’s real GDP declined 5.1 per cent in the 2020 calendar year, less than the 6.5 per cent decline forecast in the 2020 Budget.
Revenues for 2020–21 were $13.8 billion or 9.1 per cent higher than expected in the 2020 Budget.
- Taxation revenues were $13.4 billion or 13.7 per cent higher than projected in the 2020 Budget, due to a $7.9 billion increase in HST, a $3.4 billion increase in PIT, a $1.7 billion increase in Sales Tax and a $0.3 billion increase in all other taxes combined.
- Transfers from the Government of Canada were $0.5 billion or 1.5 per cent higher mainly reflecting increased transfers related to the COVID-19 pandemic, and partially offset by lower transfers for infrastructure.
- Income from GBEs was $1.4 billion or 38.9 per cent higher as a result of higher than projected OPG, HOL, LCBO, and OLG net incomes.
- Other non-tax revenues, including revenue from hospitals, school boards and colleges, were $1.6 billion or 9.6 per cent lower mainly due to reduced activity related to the COVID-19 pandemic. This was mainly due to lower revenue from service fees and tuition as a result of COVID-19 pandemic related measures and restrictions.
Revenue trend
Chart 2 shows the recent trends in revenue for Ontario’s major revenue sources.
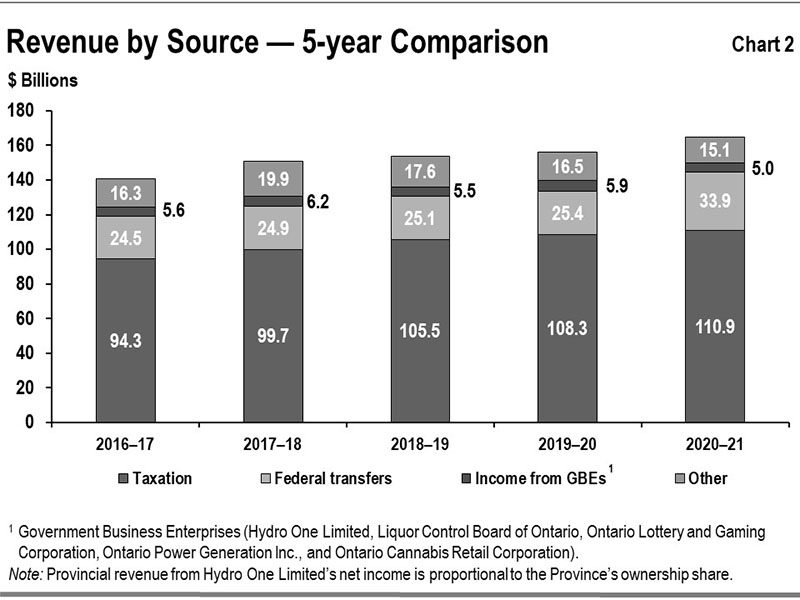
Taxation revenue
Between 2016–17 and 2019–20, taxation revenue grew at an annual average rate of 4.7 per cent. Much of the rising trend in taxation revenues over that period reflects economic growth, with nominal GDP growth averaging 4.1 per cent.
Taxation revenue growth in 2020–21 (+2.4 per cent) was significantly different from performance in past years where there was a significant decline in real GDP, including, for example 1991–92 ( 5.6 per cent) and 2009–10 (-5.8 per cent). During 2020–21 unprecedented financial support from all levels of government was provided to people and businesses in response to the COVID-19 pandemic which contributed to growth in Personal and Corporate Income Tax revenues.
Although economic growth and taxation revenue growth are closely linked, the relationship is affected by several factors, including but not limited to:
- Growth in some revenue sources, such as Corporations Tax and Mining Tax, which can diverge significantly from economic growth in any given year due to the inherent volatility of business profits as well as the use of tax provisions, such as, the option to carry losses forward or backward;
- The impact of housing completions and resales on HST and land transfer tax revenue which is proportionately greater than their contribution to GDP;
- Changes in volume-based gasoline and fuel taxes which are more closely aligned to growth in real GDP as opposed to nominal GDP since these revenue sources are not directly influenced by price changes; and
- During 2020–21 unprecedented financial support from all levels of government was provided to people and businesses in response to the COVID-19 pandemic, which contributed to growth in Personal and Corporate Income Tax revenues, but these did not directly increase GDP.
Federal government transfers
Between 2016–17 and 2019–20, Government of Canada transfers grew at an annual average rate of 1.1 per cent. In addition to major federal transfer programs such as the Canada Health Transfer and Canada Social Transfer, there are also a number of federal transfers to the Province which are largely program specific such as social housing, infrastructure and labour market programs. Some transfers are ongoing while others are time limited.
Total federal transfer revenues increased 33.5 per cent in 2020–21 largely due to one-time funding totaling $7.7 billion to support the provincial response to COVID-19. This one-time funding included $5.1 billion through the Safe Restart Agreement (SRA), $1.1 billion through the COVID-19 Essential Workers Support Fund, $763 million through the Safe Return to Class Fund, and other additional funding. For more details on Ontario’s COVID-19 expenses see pages 28-29.
Income from government business enterprises
Between 2016–17 and 2019–20, income from GBEs increased at an annual average rate of 1.9 per cent. In 2020–21, income from GBEs declined by $0.9 billion or 15.3 per cent. This is mostly due to the $2.0 billion lower net income of OLG in 2020–21 as a result of COVID-19 related closures of casinos. The income from Government Business Enterprises also includes the net income from the LCBO, OPG, HOL, and the OCRC.
Other non-tax revenues
Other non-tax revenues increased at an annual average rate of 0.5 per cent between 2016–17 and 2019–20. These declined in 2020–21 by 8.5 per cent, mainly due to lower revenue from service fees and tuition as a result of COVID-19 pandemic related measures and restrictions. Other non-tax revenues comprise a number of sources, including but not limited to revenue from hospitals, school boards and colleges, vehicle and driver registration fees, sales and rentals of goods and services, other fees, licenses and permits, reimbursements of provincial expenditures in delivering certain services, royalties for the use of Crown resources, and electricity sector revenues such as power supply contract recoveries.
Expense
Details of 2020–21 actual results ($ Billions) - table 3
| Expense | March 2020 Economic and Fiscal Update | 2020 Budget | 2020–21 Actual | 2019–20 Actual | Change from March 2020 Economic and Fiscal Update | Change from 2020 Budget | Change from 2019–20 Actual |
|---|---|---|---|---|---|---|---|
| Health sector | 67.8 | 73.0 | 69.5 | 63.7 | 1.7 | (3.5) | 5.8 |
| Education sector | 30.3 | 31.0 | 31.3 | 30.2 | 1.0 | 0.3 | 1.1 |
| Postsecondary education sector | 10.7 | 10.7 | 9.8 | 10.5 | (0.9) | (0.9) | (0.7) |
| Children’s and social services sector | 17.7 | 17.9 | 17.5 | 17.1 | (0.2) | (0.4) | 0.4 |
| Justice sector | 4.5 | 4.6 | 4.9 | 4.7 | 0.4 | 0.3 | 0.2 |
| Other programs | 30.1 | 37.4 | 36.1 | 26.0 | 6.0 | (1.3) | 10.1 |
| Total Program Expense | 161.1 | 174.6 | 169.0 | 152.3 | 7.9 | (5.6) | 16.7 |
| Interest on debt | 13.2 | 12.5 | 12.3 | 12.5 | (0.9) | (0.2) | (0.2) |
| Total expense | 174.3 | 187.0 | 181.3 | 164.8 | 7.0 | (5.7) | 16.5 |
| Reserve | 2.5 | 2.5 | – | – | (2.5) | (2.5) | – |
Note: Numbers may not add due to rounding.
The March 2020 Economic and Fiscal Update was reflective of the uncertainty and volatility at the beginning of the COVID-19 pandemic. The outlook did not account for all the sudden and substantial impacts on the economy and Ontario’s finances — much of which was still unknowable at the time. The government made immediate funding available to ensure a comprehensive and timely response to the pandemic across the health sector and other critical public services. Throughout the first, second and third waves of the pandemic, the government worked in partnership with hospitals, the long-term care sector, schools, municipalities, First Nations and other public-sector organizations to provide the necessary resources for the evolving pandemic landscape — a tumultuous period that often required redeploying resources to meet emerging needs. As the Province moves forward, the Ontario government is continuing to do whatever it takes to protect the health and safety of the people of Ontario.
Change from 2019–20 actuals
Total program expenses for 2020–21 increased by $16.7 billion or 11.0 per cent, from $152.3 billion in the previous fiscal year to $169.0 billion. Within the last 45 years, 2020–21 had the highest dollar year-over-year increase in annual program expenses.
- Health sector expense increased by $5.8 billion or 9.1 per cent over the previous fiscal year, mainly due to additional spending in response to the COVID-19 pandemic:
- This funding was used to support additional hospital beds to ensure hospitals can treat COVID-19 and other patients, reduce surgical backlogs from delayed or cancelled surgeries and procedures, PPE and other critical supplies, and support temporary pandemic pay and temporary personal support worker wage enhancement.
- The investments also supported the Province’s COVID-19 testing and vaccination roll out. Phase one of Ontario’s three-phased COVID-19 vaccination plan began in December 2020 and prioritized vaccinations for Ontario’s most vulnerable populations and those who care for them (approximately 1.8 million people), including health care workers as well as other priority groups such as, long-term care residents and staff, First Nation communities, seniors in retirement homes, and the elderly.
- In addition, there was increased funding to long-term care homes related to the containment of COVID-19 as well as an increase in Level of Care supports and strengthened long-term care capital programs.
- Health sector non-pandemic investments included:
- Funding to help cover working funds deficits for qualifying public hospitals to improve the financial health and stability of hospitals;
- Funding for hospitals to support care for the aging and growing population;
- Hospital-based mental health services and programs; and
- Capital expenses related to the purchase of critical laboratory, medical and information technology equipment.
- Education sector expense increased by $1.1 billion or 3.6 per cent over the previous fiscal year, mainly due to investments in schools to keep students and staff safe, as well as the Support for Learners and Ontario COVID-19 Child Benefit initiatives to provide direct payments to parents to help offset added costs of COVID-19:
- As of February 2021, Support for Learners received over 2.1 million applications of which over two million were processed for payment.
- As of May 2021, the Ontario COVID-19 Child Benefit received over 2.3 million applications of which 2.25 million were processed for payment.
- Postsecondary education sector decreased by $0.7 billion or 6.7 per cent over the previous fiscal year, mainly due to students receiving increased federal benefits, as well as lower-than-forecasted college sector spending due to lower enrolment and reduced on-campus activities as a result of COVID-19;
- Children’s and social services sector expense increased by $0.4 billion or 2.3 per cent over the previous fiscal year, primarily due to:
- Investments to support the COVID-19 pandemic response, including the temporary pandemic pay program, temporary personal support worker wage enhancement and the residential relief fund; and
- Transformational initiatives in the child welfare and developmental services programs to better meet the needs of children, youth and adults in care.
- Justice sector expense increased by $0.2 billion or 4.3 per cent over the previous fiscal year, mainly due to COVID-19 related costs at correctional institutions and a one-time accounting adjustment related to the Victim Fine Surcharges Program. This was partially offset by decreases in some operational costs during the COVID-19 pandemic and lower payments made under the Crown Liability and Proceedings Act, 2019; and
- Other programs expense increased by $10.1 billion or 38.8 per cent over the previous fiscal year, mostly reflecting:
- More than $3.0 billion for the Ontario Small Business Support Grant, that provided support to more than 100,000 eligible small businesses impacted by COVID-19;
- More than $2.7 billion in investments primarily to municipalities under the federal–provincial Safe Restart Agreement, additional COVID-19 recovery funding, the Social Services Relief Fund and Ontario Isolation Centres;
- Additional funding of more than $2.0 billion to support municipal transit systems during the pandemic. This included funding from Ontario and the federal government through the Safe Restart Agreement, as well as additional funding provided by the Province, to help municipalities continue to deliver critical transit services;
- Approximately $868 million increase for implementation of COVID-19 energy support programs including off-peak Time-Of-Use pricing, deferring a portion of Global Adjustment charges, the Energy Rebate Grant and the COVID-19 Energy Assistance Program;
- More than $400 million for the procurement of PPE for the education and public sectors as well as supply chain support costs during the COVID-19 pandemic;
- $176 million increase mainly due to investments in employment and training services, Occupational Health and Safety programs and the new Ontario Jobs Training tax credit;
- COVID-19 investments for prevention and control measures in retirement homes and support for the temporary pandemic premium pay for frontline workers; and
- COVID-19 supports for Indigenous communities, the recognition of contingent liabilities associated with land and land-related claims and the payment of mercury contamination settlement benefits.
- The increase in 2020–21 was partially offset by:
- $123 million decrease in the agriculture Production Insurance program, primarily due to extraordinary payments in 2019–20 because of crop conditions; and
- Lower than forecasted cultural media tax credit claims and lower expenditures by provincial tourism, culture, and heritage consolidated entities that had to temporarily limit or close their operations due to COVID-19.
Change from the March 2020 Economic and Fiscal Update
Total expense in 2020–21 was $181.3 billion, which was $7.0 billion higher than the March 2020 Economic and Fiscal Update. Program spending was $169.0 billion, up $7.9 billion from the plan of $161.1 billion. Spending in health, education, justice and other programs was higher than planned, partially offset by lower than planned spending in postsecondary education and children’s and social services (see Table 3). Interest on debt expense was $12.3 billion, which was $0.9 billion below the plan of $13.2 billion, primarily due to lower than forecast interest rates, offset by increased borrowings to fund a higher deficit.
See Chart 3 for details of program expense by sector.
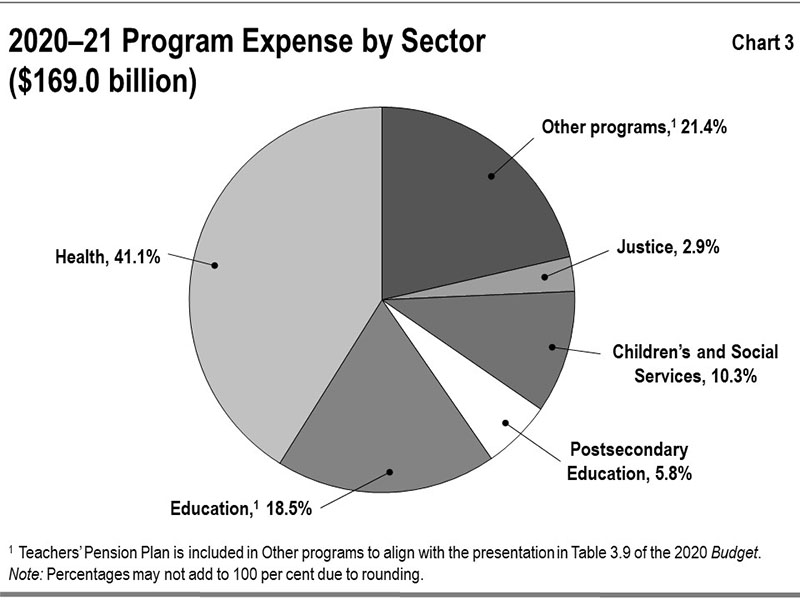
Total program spending was $7.9 billion or 4.9 per cent higher than the March 2020 Economic and Fiscal Update. The increase was primarily due to:
- Health sector expense that was $1.7 billion or 2.5 per higher than planned, primarily due to increased investments in hospitals and long-term care homes during the COVID-19 pandemic, partially offset by reduced spending in other health sector programs including fewer visits to physicians and fewer non-emergency procedures. Key health care investments included:
- Supporting the Province’s COVID-19 testing strategy, including maintaining and enhancing laboratory capacity and supporting assessment centres and testing sites;
- Creating additional hospital bed capacity during the COVID-19 pandemic and reducing backlogs from delayed or cancelled surgeries and procedures;
- Providing additional investments to help Ontario’s public hospitals recover from financial pressures created and worsened by COVID-19;
- Supporting Ontario’s three phased COVID-19 vaccination plan. Phase one began in December 2020 and prioritized vaccinations for Ontario’s most vulnerable populations and those who care for them (approximately 1.8 million people), including health care workers as well as other priority groups such as, long-term care residents and staff, First Nation communities, seniors in retirement homes, and the elderly; Supporting temporary pandemic pay, purchasing PPE and other critical supplies, and supporting public health efforts; and
- Investing in long-term care homes during the COVID-19 pandemic, including funding for infection prevention and control measures, staffing supports and PPE.
- Education sector expense that was $1.0 billion or 3.3 per cent higher than planned, mainly due to investments in schools to keep students and staff safe, as well as the Support for Learners and Ontario COVID-19 Child Benefit initiatives to provide direct payments to parents to help offset added costs of COVID-19, partially offset by lower than forecasted school board spending;
- Postsecondary education sector expense that was $0.9 billion or 8.4 per cent lower than planned, mainly due to students receiving increased federal benefits, as well as lower than forecasted college sector spending due to lower enrolment and reduced on-campus activities as a result of COVID-19;
- Children’s and social services sector expense that was $0.2 billion or 1.1 per cent lower than planned, primarily due to:
- Lower than projected spending on social assistance due to individuals and families receiving federal government benefits during the COVID-19 pandemic; and
- Lower developmental services spending with fewer clients coming into residential care and lower claims by families and individuals in the direct funding program.
- Justice sector expense that was $0.4 billion or 8.9 per cent higher than planned, primarily due to COVID-19 expenses for costs related to industrial cleaning, commodity and medical supplies, accommodation lease costs to ensure correctional institutions and court facilities are safe and accessible, operational support for the AGCO due to the closure of non-essential businesses during the pandemic, and a one-time accounting adjustment related to the Victim Fine Surcharges Program; and
- Other programs expense was $6.0 billion or 19.9 per cent higher than planned mainly due to:
- More than $3.0 billion for the newly created Ontario Small Business Support Grant, that provided support to more than 100,000 eligible small businesses impacted by COVID-19;
- More than $2.7 billion in investments primarily to municipalities under the federal–provincial Safe Restart Agreement, additional COVID-19 recovery funding, the Social Services Relief Fund and Ontario Isolation Centres;
- Additional funding of more than $2.0 billion to support municipal transit systems to deliver critical transit services during the pandemic. This included funding through the Safe Restart Agreement, as well as additional funding provided by the Province;
- Procurement of PPE for the education and public sectors as well as supply chain support costs during the COVID-19 pandemic;
- COVID-19 investments for prevention and control measures in retirement homes and support for the temporary pandemic premium pay for frontline workers; and
- COVID-19 supports for Indigenous communities, the recognition of contingent liabilities associated with land and land-related claims and the payment of mercury contamination settlement benefits.
- Other program expenses for 2020–21 also reflected:
- Lower than forecasted cultural media tax credit claims and lower expenditures by provincial tourism, culture, and heritage consolidated entities that had to temporarily limit or close their operations due to COVID-19;
- A decrease in infrastructure expenditures primarily due to slower than the expected construction progress and delivery partner claims related to Broadband Infrastructure, Investing in Canada Infrastructure Program and the Clean Water and Wastewater Fund as a result of COVID-19 pandemic;
- Lower than expected transfer payments due to revised construction timelines for municipal transit projects and lower than planned amortization due to delays in asset in service dates;
- Transfer of contingency funds for program expenses in various sectors during the pandemic to ensure that the health care system was not overwhelmed, critical supports were available, and investments were made in recovery efforts to support jobs and the economy; and
- Lower expenses across other programs due to the decreased operational cost during the pandemic.
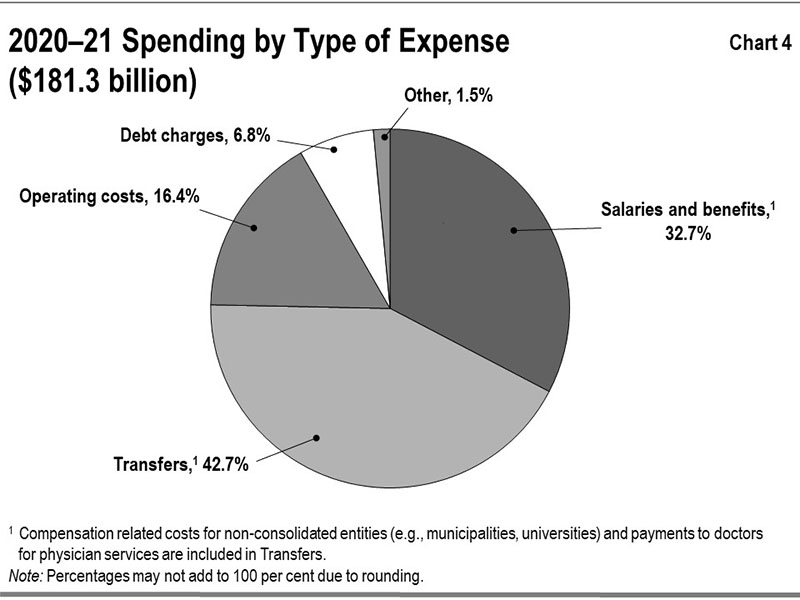
Chart 4 shows spending by type of expense. Government spending related to salaries and benefits includes those expenses for organizations consolidated as part of the government reporting entity including hospitals, school boards and colleges as well as the Ontario Public Service.
The expense labelled “Transfers” in Chart 4 reflect payments to a variety of service providers that support the delivery of public services. These third-party funding recipients include child care providers, social service agencies, municipalities, universities and health care professionals including physicians. As service providers, a large share of the spending of these third parties typically go to salaries and benefits. Transfers do not include transfers to hospitals, school boards and colleges — these are reflected in the other expense types such as operating costs and salaries and benefits, as reported by the organizations.
Change from the 2020 Budget
Total program spending was $5.6 billion lower than the 2020 Budget, resulting in an actual program expense of $169.0 billion. Changes in program spending were primarily attributable to:
- The 2020 Budget was prepared during the second wave of COVID 19 which introduced significant uncertainty regarding the future course, duration and severity of the pandemic. The 2020 Budget allocated additional resources to the Health sector. With continued uncertainty in the risk of surges and future waves of the pandemic, substantial amounts of funding was made available to critical areas specifically health care and hospitals. The third wave did not peak and recede in Ontario until late spring/early summer 2021, therefore spending was less than anticipated for 2020–21 as most of the spending to address the third wave of the pandemic occurred in 2021–22. Health sector expenses are $3.5 billion or 4.8 per cent lower than the 2020 Budget. Significant investments to respond to the pandemic were offset by lower-than-forecasted costs in other areas of health care.
- Health sector expenses included increased funding for the hospital bed capacity as well as key investments in the long-term care homes sector including support for infection prevention and control measures such as increased staffing, additional PPEs, and increased sanitization practices as well as support to provide capacity through the specialized care centres to manage outbreaks in the long-term care homes.
- Additionally, the COVID-19 pandemic resulted in lower utilization of the Assistive Devices and Supplies Program, fewer physician visits and fewer non-emergency procedures. Funding was provided to ensure that COVID-19 related physician services were available for new patient needs that emerged with the pandemic. This included temporary changes to redirect physician services to assessment centres and the hospital sector, enabling hospitals to maximize capacity and redeploy physicians to address the surge volumes of COVID-19 patients.
- Education sector expense that was $0.3 billion or 1.0 per cent above plan, mainly due to investments in schools to keep students and staff safe, as well as the Ontario COVID-19 Child Benefit to provide direct payments to parents to help offset added costs of COVID-19, partially offset by lower-than-forecasted school board spending;
- Postsecondary education sector expense that was $0.9 billion or 8.4 per cent below plan, mainly due to students receiving increased federal benefits, as well as lower-than-forecasted college sector spending due to lower enrolment and reduced on-campus activities as a result of COVID-19;
- Children’s and social services sector expense that was $0.4 billion or 2.2 per cent below plan, primarily due to:
- Lower than projected spending on social assistance due to individual families receiving federal government benefits during the COVID-19 pandemic; and
- Lower developmental services spending with fewer clients coming into residential care and lower claims by families and individuals in the direct funding program.
- Justice sector expense that was $0.3 billion or 6.5 per cent above plan, primarily due to COVID-19 expenses for costs related to industrial cleaning, commodity and medical supplies, accommodation lease costs to ensure correctional services and court facilities are safe and accessible, operational support for the AGCO due to the closure of non-essential businesses during the pandemic, and a one-time accounting adjustment related to the Victim Fine Surcharges Program. This increase was partially offset by a decrease in some operational costs as a result of the pandemic; and
- Other program expense that was $1.3 billion or 3.5 per cent below plan, mainly due to:
- A decrease in infrastructure expenditures primarily due to COVID-19 related delays, including construction delays and delivery partner claims related to Broadband Infrastructure, Investing in Canada Infrastructure Program and the Clean Water and Wastewater Fund;
- Lower expenditures by provincial tourism, culture, and heritage consolidated entities that had to temporarily limit or close their operations due to COVID-19;
- Transfer of contingency funds for program expenses in various sectors during the pandemic to ensure that the health care system was not overwhelmed, critical supports were available, and investments were made in recovery efforts to support jobs and the economy; and
- Lower than expected transfer payments due to revised construction timelines for municipal transit projects and lower than planned amortization due to delays in asset in service dates.
- Other program expenses in 2020–21 also reflected:
- The Ontario Small Business Support Grant, that provided support to more than 100,000 eligible small businesses impacted by COVID-19;
- Investments primarily to municipalities including additional COVID-19 recovery funding, the Social Services Relief Fund and Ontario Isolation Centres;
- Procurement of PPE for the education and public sectors as well as supply chain support costs during the COVID-19 pandemic;
- COVID-19 investments for prevention and control measures in retirement homes and support for the temporary pandemic premium pay for frontline workers; and
- COVID-19 supports for Indigenous communities, the recognition of contingent liabilities associated with land and land-related claims and the payment of mercury contamination settlement benefits.
Expense trend
Chart 5 shows the recent trends in spending for major program areas.
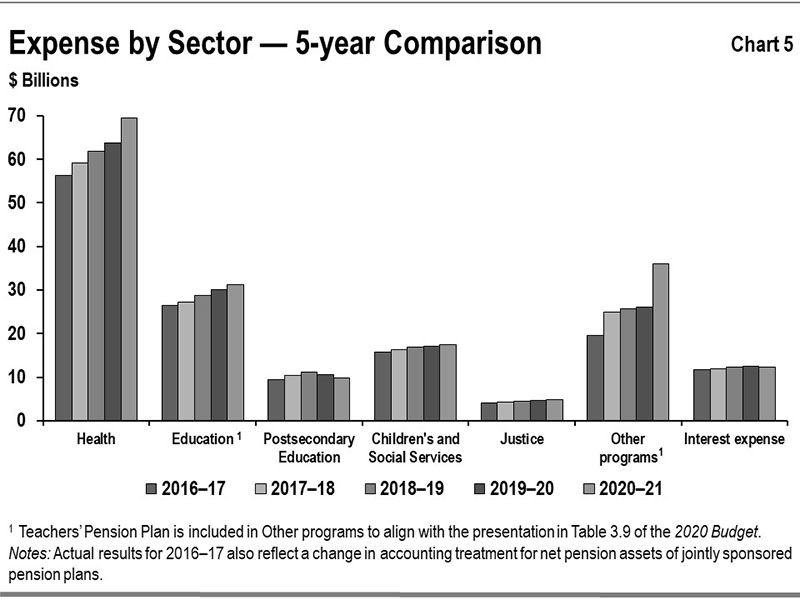
For many sectors, expense trends are increasing primarily due to time-limited investments in 2019–20 and 2020–21 as part of the government’s response to the COVID-19 pandemic, which included COVID-19 investments of $19.1 billion.
- Health sector expense increased from $56.2 billion in 2016–17 to $69.5 billion in 2020–21, or on average by 5.4 per cent per year. The increased funding is primarily due to:
- Time-limited investments to address COVID-19 pandemic including funding to prevent and contain the spread of COVID-19 in long-term care homes;
- Support for Ontario hospitals and home and community care services;
- Improving access to mental health and addictions services; and
- Demands for the OHIP program arising from population growth and utilization growth in drug programs and cancer procedures.
- Education sector expense increased from $26.5 billion in 2016–17 to $31.3 billion in 2020–21, or on average by 4.2 per cent per year. The increase is mainly due to:
- Providing direct support to help parents through the Support for Learners and Ontario COVID-19 Child Benefit initiatives and supporting the safe operations of schools across the education sector due to the COVID-19 pandemic in 2020–21; and
- Negotiated school board labour enhancements such as compensation increases and investments in staffing and local priorities. Enrolment also grew over this period.
- Postsecondary education sector expense increased from $9.4 billion in 2016–17 to $9.8 billion in 2020–21, or on average by 1.0 per cent per year. The increase is mainly due to increased college sector spending, partially offset by student financial assistance program and capital spending.
- Children’s and social services sector expense increased from $15.7 billion in 2016–17 to $17.5 billion in 2020–21, or on average by 2.7 per cent per year. This primarily reflects:
- Investments to support the COVID-19 pandemic response, including the temporary pandemic pay program and temporary personal support worker wage enhancement;
- Increases to Ontario Disability Support Program caseloads;
- Investments in the Ontario Autism Program;
- Growing demand and complexity of services required for individuals with developmental disabilities; and
- Transformational initiatives in the child welfare and developmental services programs to better meet the needs of children, youth and adults in care.
- Justice sector expense increased from $4.1 billion in 2016–17 to $4.9 billion in 2020–21, or on average by 4.1 per cent per year. The increase is primarily due to:
- COVID-19 expenses in 2020–21 related to industrial cleaning, commodity and medical supplies, and accommodation lease costs to ensure correctional services and court facilities were safe and accessible. This was partially offset by a decrease in some operational costs as a result of the pandemic;
- New initiatives related to anti-human trafficking and the gun, gang and reduction in violence strategy;
- Collective bargaining increases for the Ontario Provincial Police (OPP) and Correctional Services staff;
- Payments made under the Crown Liability and Proceedings Act, 2019; and
- A one-time accounting adjustment related to the Victim Fine Surcharges Program in 2020–21.
- Other programs expense increased from $19.5 billion in 2016–17 to $36.1 billion in 2020–21, or on average by 16.6 per cent per year. The increase is primarily due to the government’s response to address the COVID-19 pandemic with $10.2 billion in investments in 2020–21 to ensure that critical supports were available, and investments were made in recovery efforts to support jobs and the economy:
- An increase of over $6.0 billion related to the expansion of Electricity Rate Mitigation Programs, including the Ontario Electricity Rebate (OER) which has provided electricity bill relief to most residential customers, farmers, and small businesses. The OER has also increased transparency on electricity bills in Ontario, while maintaining rate mitigation initiatives. It also includes the launch of the Renewables Cost Shift, which reduced energy costs for medium-size and larger industrial and commercial businesses. Of this, approximately $938 million has been dedicated to COVID-19 energy support programs in 2020–21 including off-peak Time-Of-Use pricing, deferring a portion of Global Adjustment charges, and introducing the Energy Rebate Grant and COVID-19 Energy Assistance Program.
- More than $3.0 billion in one-time funding for the Ontario Small Business Support Grant, that provided support to more than 100,000 eligible small businesses impacted by COVID-19.
- More than $2.7 billion in investments primarily to municipalities under the federal–provincial Safe Restart Agreement, additional COVID-19 recovery funding, the Social Services Relief Fund and Ontario Isolation Centres.
- Over $2.0 billion in additional funding to support municipal transit systems during the pandemic in 2020–21, including funding from Ontario and the federal government through the Safe Restart Agreement, as well as additional funding provided by the Province to help municipalities continue to deliver critical transit services.
- An increase in capital investments in public transit and provincial highways including funding for municipal transit projects and amortization expenses for provincial assets in service.
- $509 million increase in expenditures from 2016–17 to 2020–21 for additional investments in federal–provincial cost sharing programs (Investing in Canada Infrastructure Program, Clean Water and Wastewater Funding), Toronto Waterfront Revitalization and Broadband Infrastructure.
- COVID-19 investments for prevention and control measures in retirement homes and support for the temporary pandemic premium pay for frontline workers.
- COVID-19 supports for Indigenous communities, the recognition of contingent liabilities associated with land and land-related claims and the payment of mercury contamination settlement benefits.
Interest on debt
Despite the challenges faced as a result of the pandemic, interest on debt expense was over $0.9 billion below plan from the March 2020 Economic and Fiscal Update in 2020–21, mainly as a result of lower than forecast interest rates on refinancing maturing debt as well as new debt issued to fund the deficit and investments in capital assets.
Interest on debt expense was $0.2 billion below plan from the 2020 Budget in 2020–21, mainly as a result of lower than forecast interest rates offset by higher than budgeted consolidation adjustments including lower interest capitalization.
Interest on debt expense fell from $12.5 billion in 2019–20 to $12.3 billion in 2020–21 as a result of lower borrowing rates on refinancing maturing debt as well as new debt issued to fund the deficit and investments in capital assets. See Table 3.
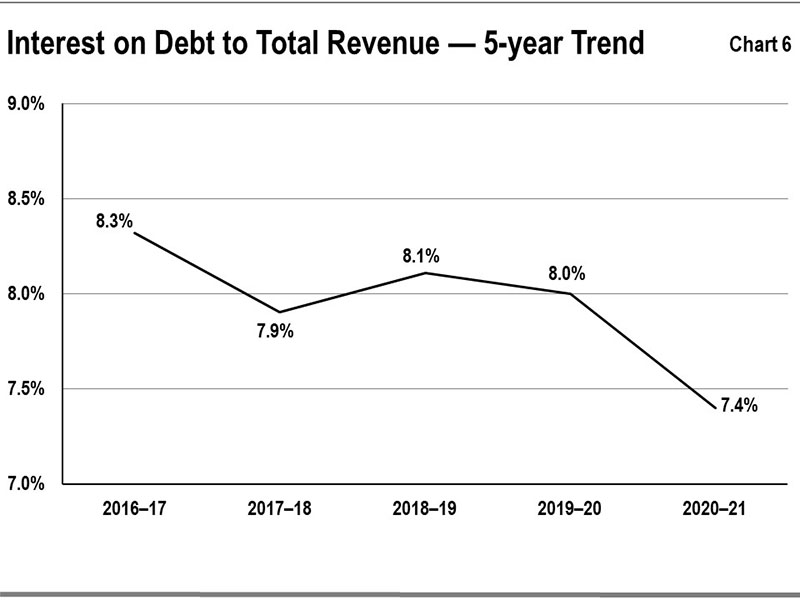
Chart 6 shows that the ratio of interest on debt to total revenue has fallen for Ontario over the past five years, from a high of 8.3 per cent in 2016–17 to the current level of 7.4 per cent. The decrease from 8.0 per cent in 2019–20 to 7.4 per cent in 2020–21 is due to the rate of increase in Ontario’s total revenues outstripping the rate of increase in the Province’s interest on debt expense.
COVID-19 analysis
2020–21 COVID-19 Expenses by Sector ($ Billions) - table 4
| Expense | 2020–21 Actual |
|---|---|
| Health sector | 5.1 |
| Education sector | 2.9 |
| Postsecondary education sector | 0.3 |
| Children’s and social services sector | 0.4 |
| Justice sector | 0.2 |
| Other programs | 10.2 |
| Total expense | 19.1 |
Note: Numbers may not add due to rounding.
Total estimated COVID-19 spending in 2020–21 was $19.1 billion, primarily attributable to:
- Health sector expense of $5.1 billion, including investments to:
- Ramp up COVID-19 testing and contact management and funding to support a provincewide vaccine rollout plan;
- Support hospitals with COVID-19 expenses and critical care capacity, including additional hospital beds, as well as funding to address the surgical backlog;
- Purchase PPE and critical supplies to protect health care workers, patients and people across the province and support infection prevention and control measures;
- Provide additional Mental Health and Addictions supports as the pandemic has intensified the need for more mental health and addiction services; and
- Support long‐term care homes during the COVID‐19 pandemic, including funding for infection prevention and containment measures, staffing supports and PPE.
- Education sector expense of $2.9 billion, including direct payments to parents through the Support for Learners and Ontario COVID-19 Child Benefit initiatives, as well as investments to safely reopen schools and child care settings.
- Other programs expense of $10.2 billion, including:
- $3.0 billion for the newly created Ontario Small Business Support Grant, which helped more than 100,000 small businesses that were required to close or significantly restrict services as a result of provincial public health measures;
- $2.7 billion primarily related to investments for municipal operating supports under the federal–provincial Safe Restart Agreement and provincial COVID-19 recovery funding, as well as providing critical homelessness services through the Social Services Relief Fund; and
- More than $2.0 billion mainly related to investments under the federal–provincial Safe Restart Agreement to provide funding to municipal transit systems to support safe operations during the COVID-19 pandemic.
Note: these totals are inclusive of federal support, such as the Safe Restart Agreement. Please see section below for more information.
Federal–Provincial COVID-19 Response Programs
- Since the start of the pandemic, Ontario worked in partnership with the federal government to secure significant federal investments to support the people of Ontario. Through the Safe Restart Agreement (SRA), $5.1 billion was provided to Ontario in 2020–21 to protect public health and safety, prepare for potential future waves of the virus, and further support the safe reopening of the economy.
- Ontario and the federal government finalized the agreement on September 16, 2020.
- Funding to Ontario was provided through various streams. A total of $3.1 billion was provided through health care streams, which includes $1.2 billion for testing, contact tracing, and data management; $1.2 billion for PPE; $466 million for health care system capacity and mental health services; and $287 million to support vulnerable populations. In addition, the SRA provided $1.8 billion for municipalities and transit and $235 million for child care for returning workers.
- In addition to the SRA, Ontario secured $1.1 billion in federal funding through the Support for Essential Workers Fund, which provided a temporary increase to wages of eligible frontline and support workers. Ontario also secured $763 million through the Safe Return to Class Fund, to provide critical supports and PPE to safely reopen schools, protect students, staff and support online and in-person learning. Ontario received one-time additional funding through the Workforce Development Agreement and recorded $8.6 million in one-time funding through the Canada-Ontario Bilateral Agreement for Pan-Canadian Virtual Care Priorities in Response to COVID-19 in addition to other supports.
Statement of financial position analysis
Financial assets
Financial Assets ($ Billions) - table 5
| Item | 2020–21 Actual | % of Total | 2019–20 Actual | % of Total | Variance Increase (Decrease) |
|---|---|---|---|---|---|
| Cash and cash equivalents | 33.4 | 28.4% | 23.1 | 24.5% | 10.3 |
| Investments | 28.9 | 24.6% | 26.1 | 27.7% | 2.8 |
| Accounts receivable | 15.3 | 13.0% | 9.8 | 10.4% | 5.5 |
| Loans receivable | 12.1 | 10.3% | 12.1 | 12.9% | 0.0 |
| Other assets | 1.2 | 1.0% | 1.2 | 1.3% | 0.0 |
| Investment in Government Business Enterprises | 26.6 | 22.7% | 21.8 | 23.2% | 4.8 |
| Total Financial Assets | 117.4 | 100.0% | 94.1 | 100.0% | 23.3 |
Note: Numbers may not add due to rounding.
Financial assets consist of items that include: cash and cash equivalents and investments that are available to the Province to meet its expenditure needs; accounts and loans receivable, which are amounts it expects to receive from third parties; and other items including investment in GBEs.
The Province’s financial assets increased by $23.3 billion in 2020–21 over the prior fiscal year. These increases were attributable to (see Table 5):
- Cash and cash equivalents were $10.3 billion higher mainly due to operating, investing, capital and financial activities that included pre-borrowings of $6.1 billion as a well as building up adequate liquid reserves to fund maturities of $3.3 billion due in the next fiscal year;
- Investments were $2.8 billion higher mainly as a result of pre-borrowing activities and maturity payment management, as well as an increase in investments by the broader public sector (BPS). Examples of investments include investments in government bonds and fixed income securities, such as Guaranteed Investment Certificates and Government of Canada Bonds;
- Accounts receivable were $5.5 billion higher mainly due to an increase in receivables for Personal Income Tax and other tax revenues, which were offset by decreases in Corporate and Sales Taxes. Increases in transfer payments and other receivables including payments from Government of Canada for programs and projects also contributed to the increase; and
- Investment in GBEs increased by $4.8 billion mainly driven by an increase in the fair value of the Ontario Nuclear Funds as well as retained earnings in GBEs.
Chart 7 shows the recent trends in financial assets for the Province.
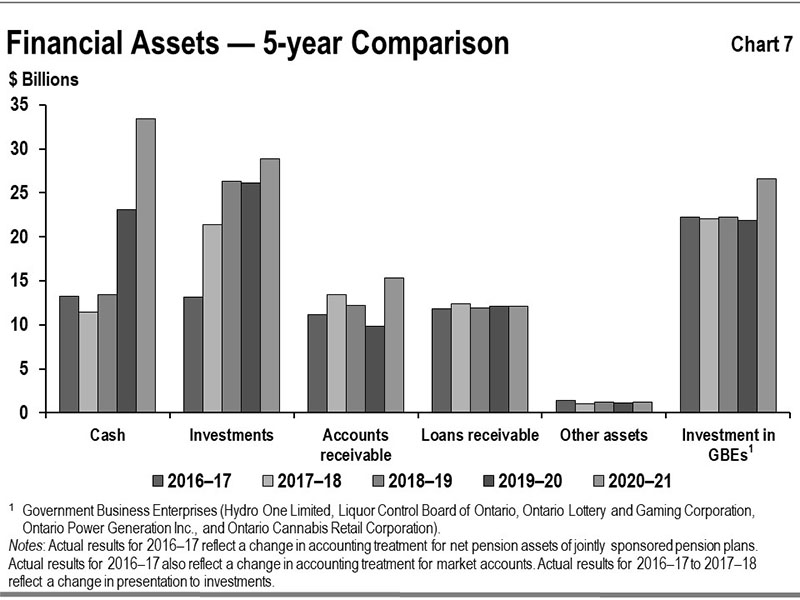
After relatively stable total net investments in GBEs to 2019–20, total investment in GBEs increased significantly in 2020–21. The net increase was mainly due to the increase in the fair value of investments in the Ontario Nuclear Funds for nuclear waste management and decommissioning, as well as the Province’s retained earnings in GBEs.
The level of other financial assets including cash, accounts receivable and investments, tends to be more variable since these assets often reflect specific circumstances at fiscal year end such as pre borrowing for the following period’s needs.
Tangible capital assets
The government is responsible for a large portfolio of non-financial assets which is almost entirely made up of tangible capital assets.
Tangible capital assets owned by the Province and its consolidated entities represent the largest component of Ontario’s infrastructure investments. These assets include those it owns directly, such as provincial highways, as well as the assets of hospitals, school boards, colleges and agencies that are consolidated in its financial statements. The assets of GBEs are reflected in the Province’s statement of financial position as an investment in GBEs under financial assets.
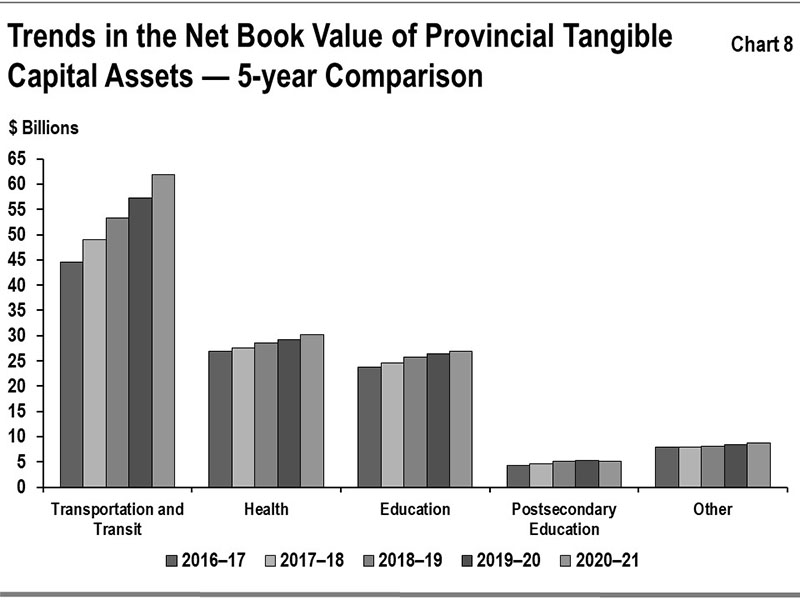
The reported net book value of Ontario’s tangible capital assets was $132.8 billion in 2020–21, increasing by $6.4 billion over the prior fiscal year. Buildings, including hospitals, schools and college facilities, make up the single largest share at $62.5 billion in aggregate. The total also includes assets under construction, some of which are being built using the public private partnership (P3) model, in which the private sector finances the assets during construction. The balance sheet includes assets under construction. The impacts of P3s on balance sheet liabilities are discussed in the Other Long-Term Financing section.
Growth in the net book value of capital assets has averaged 5.5 per cent annually over the period between 2016–17 and 2020–21. Most of the growth has been in new and renewed buildings and in transportation infrastructure including provincial highways, bridges and the transit network owned by Metrolinx, an agency of the Province.
See Chart 8 for the recent trends in the net book value of provincial tangible capital assets by sector.
Infrastructure expenditures
The Province’s infrastructure spending in 2020–21 was $15.4 billion (see Table 6). This included $13.0 billion invested in assets owned by the Province and its consolidated entities as discussed in the Tangible Capital Assets section, and $2.4 billion provided for capital investment to non consolidated partners such as universities and municipalities and other infrastructure expenditures. The total was lower than the $15.8 billion set out in the 2020 Budget primarily driven by delays in the delivery of capital projects across a number of sectors, as well as lower than forecast activity by delivery partners under claims-based programs, such as federal infrastructure programs. This was partially offset by higher than planned investments in the health sector, including facilities modifications and medical equipment to help address the COVID-19 outbreak.
Infrastructure expenditures, 2020–21 ($ Billions) - table 6
| Sector | Investment in Capital Assets | Transfers and Other Infrastructure Expenditures | Total Infrastructure Expenditures |
|---|---|---|---|
| Transportation and transit | 6.9 | 1.1 | 7.9 |
| Health | 2.9 | 0.2 | 3.1 |
| Education | 2.0 | 0.0 | 2.0 |
| Postsecondary education | 0.3 | 0.1 | 0.4 |
| Other sectors | 0.9 | 1.0 | 1.9 |
| Totals | 13.0 | 2.4 | 15.4 |
Note: Numbers may not add due to rounding.
Liabilities
The Province’s liabilities consist of debt and other financial obligations including accounts payable, unspent funds it received from the federal government and the estimated cost of future payments, including pensions and other employee future benefits liability. See Table 7.
Liabilities ($ Billions) - table 7
| Item | 2020–21 Actual | % of Total | 2019–20 Actual | % of Total | Variance Increase (Decrease) |
|---|---|---|---|---|---|
| Accounts payable and accrued liabilities | 36.7 | 7.5% | 28.6 | 6.4% | 8.1 |
| Debt | 405.0 | 82.5% | 372.8 | 83.3% | 32.2 |
| Other long-term financing | 16.9 | 3.4% | 15.0 | 3.4% | 1.9 |
| Deferred revenue and capital contributions | 14.2 | 2.9% | 13.2 | 3.0% | 1.0 |
| Pensions and other employee future benefits liability | 13.1 | 2.7% | 12.1 | 2.7% | 1.0 |
| Other liabilities | 5.2 | 1.1% | 5.7 | 1.3% | (0.5) |
| Total liabilities | 491.0 | 100.0% | 447.4 | 100.0% | 43.6 |
Note: Numbers may not add due to rounding.
Debt
Debt and other long-term financing make up the largest share of liabilities. From 2019–20 to 2020–21, debt increased by $32.2 billion to $405.0 billion at fiscal year-end, primarily to finance the operating deficit as well as investments in infrastructure.
Table 8 summarizes how the Province used its net new financing in 2020–21.
Use of new financing by the Province, 2020–21 ($ Billions) - table 8
| Item | Amount |
|---|---|
| Operating deficit and other transactions | 8.1 |
| Investment in capital assets owned by the Province and its consolidated organizations, including hospitals, school boards and colleges | 10.6 |
| Increase in the Province’s cash and investments funded by cash holdings | 13.0 |
| 31.7 | |
| Decrease in other long-term financing, Tangible Capital Assets financed by Public-Private Partnership (P3) | 0.4 |
| Net new financing | 32.2 |
Note: Numbers may not add due to rounding.
The government completed an annual borrowing program of $59.8 billion in 2020–21, compared to $39.5 billion borrowing program completed in 2019–20.
Other long-term financing
This category includes debt incurred to finance construction of public assets including those procured through the P3 model. All assets that are owned by the Province and its consolidated entities, and the associated financing liabilities, are reflected on the Province’s balance sheet during construction and as the liabilities are incurred. For information on asset investments, see the Tangible Capital Assets section.
Other types of liabilities
Other types of liabilities include accounts payable, pensions and other employee future benefits, unspent transfers received from the federal government representing deferred revenues and other liabilities.
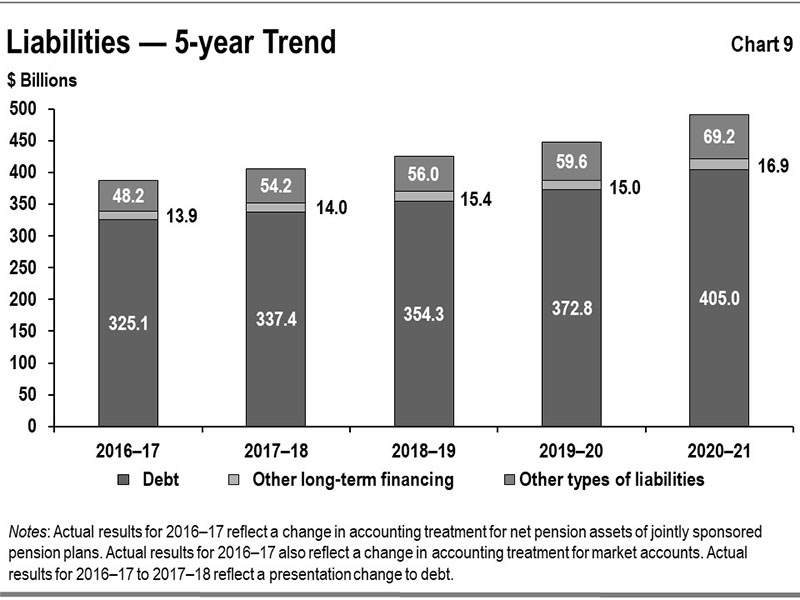
Chart 9 shows the recent trends in liabilities for the Province. This trend over the period between 2016–17 and 2020–21 shows public debt rising, mainly to fund capital investments and the annual deficit. Other types of liabilities, including accounts payable and deferred revenue, tend to be more variable since they often reflect specific circumstances at fiscal year-end such as accrued liabilities for goods and services.
Risks and risk management
The Province’s financial results and financial reporting are subject to various risks and uncertainties over which the government may have limited or no control. COVID-19 has been challenging for all governments worldwide, including Ontario, affecting the province’s health, economy and social structures, necessitating the government’s quick response in the face of a global threat. The response included additional expenditures and investments to protect citizens and enable continuity of services that the people of Ontario rely on, from health care, to justice systems, education, social services and more, with responsive policy and program changes. At the same time, the government took bold and timely steps to modernize services and offset economic impacts suffered by Ontario’s businesses.
To this end, the government utilized an array of tools including contingency funds to address risks that materialized. Through the use of the standard contingency fund, the Province committed a total of $3.0 billion ($2.9 billion for operating and $0.1 billion for capital) in the 2020 Budget, up from $1.3 billion in the March 2020 Economic and Fiscal Update. Given the uncertain and unprecedented impact of the global pandemic, an additional top-up of $2.1 billion to the standard contingency fund was made in 2020–21 after the 2020 Budget release. Funds from the standard contingency fund were used to support initiatives such as:
- Ontario COVID-19 Child Benefit to provide financial support for families with learners to help with additional costs during the COVID-19 pandemic;
- About 50 per cent of the Ontario Small Business Support Grant, which helped small businesses that were required to close or significantly restrict services as a result of provincial public health measures;
- Procurement of PPE for the education and public sectors as well as supply chain support costs during the COVID-19 pandemic;
- One-time assistance to Ontario’s 444 municipalities and as well as municipal transit systems to help local governments address municipal operating pressures and maintain critical services such as public transit;
- Maintaining homelessness supports to ensure continuity of critical supports for vulnerable people based on local need, and for municipal service managers and Indigenous program partners responding to rising COVID‑19 caseloads in shelter settings; and
- Recurring or as needed government expenses such as Emergency Forest Fire Fighting, Disaster Relief and Land Claims costs.
As part of the government’s effort to combat the pandemic and support the recovery of the province, the government also maintained dedicated pandemic-related contingency funds in 2020–21, which were fully allocated. In the March 2020 Economic and Fiscal Update, the Support for People and Jobs Fund totalled $2.0 billion and the COVID-19 Health Contingency Fund totalled $1.0 billion. In the 2020 Budget the Support for People and Jobs Fund totalled $5.0 billion and the COVID-19 Response including COVID-19 Health Contingency Fund totalled $8.3 billion.
In 2020–21, funds from the Support for People and Jobs Fund were used to support initiatives such as:
- Investing in the first round of payments for the Ontario Small Business Support Grant, which helped more than 100,000 small businesses that were required to close or significantly restrict services as a result of provincial public health measures;
- Providing payments to parents through the Support for Learners initiative to assist with the added costs of COVID-19 such as technology for online learning;
- Delivering urgent relief to small businesses and their landlords through the Ontario-Canada Emergency Commercial Rent Assistance Program, in partnership with the federal government;
- Delivering property tax rebates to approximately 14,000 businesses required to close or significantly restrict services as a result of provincial public health restrictions;
- Doubling the Guaranteed Annual Income System payment for six months, starting in April 2020, to provide urgent support for more than 190,000 low-income seniors;
- Expanding the Risk Management Program to support farmers with unforeseen challenges such as fluctuating market prices, extreme weather events like flooding or drought, and disease; and
- Supporting Indigenous-owned small and medium-sized businesses to help them with much needed capital during the pandemic, including loans of up to $50,000 for businesses that are either ineligible for, or unable to access, existing federal and provincial COVID-19 response initiatives for small businesses.
Funds from the COVID‐19 Health Contingency Fund were used to support initiatives such as:
- Provincial COVID-19 laboratory testing strategy, including maintaining and enhancing assessment centres, and contact tracing;
- Adding additional bed capacity in hospitals and alternate health facilities across the province to treat COVID-19 patients and improve access to care;
- Supporting hospitals with COVID-19 related expenses, including funding to reduce the surgical backlog from delayed or cancelled surgeries and procedures, and procuring PPE and critical supplies to protect health care workers, patients, and people across the province;
- Providing funding for additional Mental Health and Addictions supports as the pandemic has intensified the need for more mental health and addiction services; and
- Investing in long‐term care homes during the COVID‐19 pandemic, including funding for infection prevention and containment measures, staffing supports and PPE.
The Province monitors information flows regarding revenues on an ongoing basis to assess potential risks to its finances. Ontario’s revenues rely heavily on the level and pace of economic activity in the province. Ontario manages risks to the revenue forecast by consulting with private-sector economists to inform the government’s planning assumptions. For prudent fiscal planning, the Ministry of Finance’s real GDP growth projections are typically set slightly below the average private-sector forecast.
There are also risks arising from other sources of revenue, such as federal transfers and income from GBEs. Since these represent a smaller share of total revenue compared to larger revenue sources such as tax revenue — the risks they present are relatively less material to the fiscal plan. In addition, these risks are difficult to predict and quantify; for example, the federal transfers are subject to federal policy changes while GBEs’ net incomes are subject to regulatory decisions and market conditions. Note 1 to the Consolidated Financial Statements provides additional details on measurement uncertainty.
Collaboration with the Canada Revenue Agency, which administers approximately 77 per cent of Ontario’s taxation revenues, is essential to achieving this. As well, Ontario is currently exploring ways to enhance corporate income tax revenue forecasting and monitoring.
Provisions for losses that are likely to occur as a result of contingent liabilities such as ongoing litigation and land claims, and that can be reasonably estimated are expensed and reported as liabilities. Note 1 to the Consolidated Financial Statements provides further details.
Note 3 to the Consolidated Financial Statements explains the Province’s risk management strategies which are intended to ensure that exposure to borrowing-related risk is managed in a prudent and cost-effective manner.
Changes in Canadian generally accepted accounting principles (GAAP) for the public sector issued by the Public Sector Accounting Board can have an impact on Ontario’s budgets, estimates and actual results. While changes in Canadian GAAP had no material impacts in the current fiscal year, the Treasury Board Secretariat actively monitors proposed changes and provides input to standard setters to support the development of standards that support sound public policy decision-making, transparency and accountability in reporting.
As required under the Fiscal Sustainability, Transparency and Accountability Act, 2019 (FSTAA), a reserve is included in the projected surplus/deficit each year to guard against unforeseen revenue and expense changes that could have a negative impact on the Province’s fiscal performance. The 2020 Budget Plan included a $2.5 billion reserve for 2020–21. Due to the economic uncertainty caused by the pandemic, this was set at a historically high level, compared to typical reserve levels. Excluding this reserve, the projected deficit for 2020–21 in the 2020 Budget was $36.0 billion.
Key financial ratios
In this section of the Annual Report, the use of key measures of financial position will be used to assess Ontario’s financial position. The levels and trends of these measures indicate the impacts of economic and other events on the Province’s finances. The ratio and the level of each over the past five fiscal years are outlined in Table 9.
Key financial ratios - table 9
For the fiscal year ended March 31
| Item | Item | 2016–17 | 2017–18 | 2018–19 | 2019–20 | 2020–21 |
|---|---|---|---|---|---|---|
| Sustainability | Net debt- to-GDP (%) | 39.7% | 39.3% | 39.3% | 39.6% | 43.9% |
| Sustainability | Net debt to total revenue (%) | 223.2% | 215.0% | 219.9% | 226.4% | 226.5% |
| Sustainability | Net debt per capita ($) | $ 22,636 | $ 23,016 | $ 23,620 | $ 24,293 | $25,354 |
| Flexibility | Interest on debt to total revenue (%) | 8.3% | 7.9% | 8.1% | 8.0% | 7.4% |
| Flexibility | Own-source revenue to GDP (%) | 14.7% | 15.2% | 15.0% | 14.7% | 15.4% |
| Vulnerability | Federal transfers to total revenue (%) | 17.4% | 16.5% | 16.3% | 16.3% | 20.6% |
| Vulnerability | Foreign currency debt to revised total debt (%) | 17.1% | 17.9% | 17.1% | 16.1% | 15.8% |
| Vulnerability | Unhedged foreign currency debt (%) | 0.2% | 0.2% | 0.2% | 0.2% | 0.1% |
Notes:
- Actual results for 2016–17 reflect a change in accounting treatment for net pension assets of jointly sponsored pension plans.
- Net debt was restated to reflect prepaid expenses and inventory supplies being reclassified as non-financial assets, as opposed to financial assets in prior years.
- Beginning in 2019–20, Ontario is presenting public debt less of any investments in its own bonds and treasury bills.
- The forecasts of net debt and related ratios in the annual Budget are based on a calculation that includes the reserve.
Sources: Nominal GDP is based on Ontario Economic Accounts, First Quarter 2021, released by the Ontario Ministry of Finance. Population estimates are from Statistics Canada.
Measures of sustainability
Net debt provides a measure of the future government revenues that will be required to pay for the government’s past transactions. Net debt as a percentage of the Province’s GDP shows the financial demands on the economy resulting from the government’s spending and taxation policies. A lower ratio of net debt-to-GDP generally indicates higher sustainability.
The Province’s net debt-to-GDP ratio was 43.9 per cent at the end of fiscal year 2020–21, lower than the 47.0 per cent forecast in the 2020 Budget. As shown in Table 9, this ratio has increased by 4.3 per cent over the prior year largely due to the COVID-19 pandemic resulting in the significant increase in the deficit and the economic impact of the pandemic that resulted in lower GDP. The ratio of net debt to total revenue is another key measure of sustainability, since net debt reflects the future revenue that is required to pay for past transactions and events. A lower net debt-to-revenue ratio generally indicates higher sustainability. This ratio has increased by 0.1 percentage points from the prior year to 226.5 per cent in 2020–21, primarily due to net debt rising slightly faster than revenue.
Measures of flexibility
The ratio of Interest on Debt to Total Revenue shows the share of provincial revenue that is being used to pay interest expense on debt and therefore is not available for programs. A lower ratio generally indicates that a government has more flexibility to direct its revenues to programs. The ratio has fallen for Ontario over the past five years, from a high of 8.3 per cent in 2016–17 to the current level of 7.4 per cent. Lower interest rates on both refinancing maturities and new debt issued, as well as the Province’s strategy of extending the duration terms of its borrowing program and locking in historically low interest rates for a longer period, has also contributed to lower interest costs. This strategy has extended the weighted-average term to maturity of provincially issued debt from approximately eight years in 2009–10 to 12 years in 2020–21.
Own-source revenue as a share of Ontario’s GDP shows the extent to which the government is leveraging funds from the provincial economy collected through taxation, user fees and other revenue sources it controls. A high taxation burden may make a jurisdiction less competitive, therefore increases in this ratio may reduce future revenue flexibility. Ontario’s ratio was stable between 2016–17 and 2020–21.
Measures of vulnerability
Transfers from the federal government as a percentage of total revenue, is an indicator of the degree to which the Province relies on the federal government for revenue. A higher ratio may imply that a provincial government is more reliant on federal transfers. Provinces may have limited control over the value of these transfers and changes in federal policies can result in shifts in federal revenues to provinces.
Ontario’s share of revenue from federal transfers (including direct transfers to the BPS) increased from 17.4 per cent in 2016–17 to 20.6 per cent in 2020–21, mainly reflecting higher one-time funding related to the COVID-19 pandemic in 2020–21. Prior to 2020–21 the share of federal transfers had a largely declining trend over the previous 5 years reflecting lower equalization entitlements and a lower rate of growth relative to past years in the Canada Health Transfer.
Foreign currency debt to total debt is a measure of vulnerability to changes in foreign currency exchange rates. Accessing borrowing opportunities in foreign currencies allows Ontario to diversify its investor and funding base. It also ensures that the Province will continue to have adequate access to capital in the event that domestic market conditions become more challenging. Ontario manages foreign currency risk by hedging its exposure to foreign currencies through the use of financial instruments. Effective hedging has allowed the Province to consistently limit its exposure to foreign currency fluctuations to 0.2 per cent of debt issued for provincial purposes in 2016–17, declining to 0.1 per cent in 2020–21.
Fiscal management
Efficient and effective use of taxpayer dollars
To support long‐term economic growth and sustainable public finances, the government must evolve and continue to modernize its programs and services.
In October 2020, the Province released Ontario Onwards: Ontario’s COVID 19 Action Plan for a People-Focused Government, a plan to make government more effective for the people of Ontario. Ontario Onwards outlines how the government will:
- Make public-sector services and service delivery modern and customer focused, with reduced red tape while protecting public health and safety;
- Make public sector digital- and data-driven and put data at the centre of government decision-making;
- Increase efficiency, effectiveness and speed of government operations and decisions; and
- Improve government purchasing by leveraging the buying power of the Province, while taking advantage of the innovation and creativity of local Ontario businesses.
To improve how people and businesses experience services and supports in Ontario, the 2020 Budget announced an investment of $500 million through the Ontario Onwards Acceleration Fund. This fund is a vital step in achieving the vision of an Ontario that is among the most digitally advanced jurisdictions in the world. The government’s investments in projects that emphasize digital‐first and Lean methods will ensure more customer‐focused, efficient and effective delivery of services.
Initiatives receiving support from the fund in 2020–21 included:
- A new case management system for Tribunals Ontario, which will replace obsolete legacy systems. Once implemented, the new system will modernize client interactions, provide comprehensive online dispute resolution services, and enhance parties’ ability to monitor cases online and receive/submit documents electronically.
- The introduction of a new form of secure, electronic government-issued ID that can, once implemented, be used to conveniently access government and private-sector services while protecting data privacy.
- Increasing the capacity of the Lean and Continuous Improvements Office, which is implementing Lean management systems, reducing internal red tape, and imbedding Lean and continuous improvement across government.
- Projects supporting the government’s regulatory reform agenda. The government is working to improve Ontario’s regulatory framework by providing opportunities for immediate feedback, automating and digitizing operations for 24/7 responsiveness, and delivering customer‐focused services by expediting self‐registration and self‐reporting.
Since the outset of the pandemic, the Ontario government promised to do whatever is necessary to respond to COVID‐19, while balancing these needs with the long‐term sustainability of Ontario’s finances. Ontario’s plan for 2020–21 built in significant levels of prudence in the form of contingency funds to ensure it has the fiscal flexibility to respond to changing circumstances. It is also reflected in the government’s prudent decision to establish dedicated contingency funds to provide targeted, time‐limited support for critical services and address the extraordinary needs of the people of Ontario throughout the pandemic.
As Ontario moves further into economic recovery, the government’s multi-year business planning process will continue to focus on transforming the way ministries do business and making government smarter, nimbler and more efficient. This will help to ensure that Ontario continues to be ready to respond to future crises and protect the long-term sustainability of the programs and services that the people and businesses of Ontario rely on.
Non-financial activities
This section discusses key non-financial results of major sectors. The purpose is to provide highlights of government spending and the related activities in these sectors.
Health care
The government acts as a steward of the health care sector, providing overall direction and leadership for the system, including planning and resource management. The government also manages key provincial programs including hospitals, long-term care homes, home and community care, OHIP, the assistive devices program, drug programs, emergency services, independent health facilities, and laboratory services.
The impact of the COVID-19 pandemic has been unprecedented with uncertain trajectory during most of 2020–21. The primary focus had been addressing extraordinary capacity challenges and making resources available across the health care system to ensure it is able to respond to the pandemic to protect the health of the people of Ontario.
The government made the following commitments in response to the COVID-19 outbreak:
- Invested approximately $104 million in 2020–21 to support Ontario’s three phased COVID-19 vaccination plan. Phase one began in December 2020 and prioritized vaccinations for Ontario’s most vulnerable populations and those who care for them (approximately 1.8 million people), including health care workers as well as other priority groups such as, long-term care residents and staff, First Nation communities, seniors in retirement homes, and the elderly.
- During Phase 1, vaccines were distributed through hospital site clinics, mobile teams, site-specific clinics, mass immunization clinics and pharmacies. Operation Remote Immunity provided vaccinations to northern and remote Indigenous communities.
- The Province worked with public health unit and hospital partners to establish mass immunization clinics, and started to ramp up pharmacies, primary care centre, and mobile clinics to mobilize for Phase 2 of the roll out. During this time, the Province established the Provincial Vaccine Call Centre to help Ontarians book appointments at mass immunization clinics and answer their questions about the vaccine roll out.
- Introduced a comprehensive COVID-19 testing strategy to rapidly identify and contain any COVID 19 outbreaks including testing sites and assessment centres, participating community laboratories and pharmacies.
- Invested an additional $100 million to support additional mental health and addictions services and supports for those impacted by the pandemic, including children, frontline workers, and individuals experiencing mental health and addictions issues.
- Additional investments to increase capacity to ensure hospitals could treat COVID-19 and other patients, including opening the new Cortellucci Vaughan Hospital, the first newly built hospital to open in Ontario in 30 years that adds net new capacity to the system.
- Provided a temporary wage enhancement on top of existing wages to personal support workers who work on the front lines and protect the most vulnerable patients in home and community care, long-term care homes and public hospitals.
- To reduce the impacts of the second wave of COVID-19 and the influenza season, launched the largest flu immunization campaign in Ontario’s history. Additional high-dose vaccines were purchased to protect the most vulnerable.
- Provided long-term care homes with the resources, tools, and assistance needed to keep residents and staff safe during the pandemic, including staffing, PPE and other prevention and containment measures.
Other results reported in 2020–21 include:
- Invested $176 million to help expand access for critical mental health and addictions support and reduce wait times for critical services. The funding supports children and youth mental health services, opioid addictions treatments, community mental health programs such as those that address eating disorders, and supportive housing programs for people who are homeless and face mental health and addictions issues.
- Supported hospitals to cover working funds deficits by providing qualifying public hospitals with additional funding, with a focus on small, medium as well as specialty and rehabilitation hospitals that carry a large fiscal strain due to their unique situations and historical funding challenges.
- Provided funding to support Ontario hospitals with their non-COVID related investments to continue working on expanding capacity and to help address hallway health care.
- Provided assistance for minor capital repairs and renovations in long-term care homes, including plumbing and water supply cleaning, ventilation and cooling, repairing or replacing furniture, equipment and other renovations to support physical distancing.
- Introduced the Connecting People to Home and Community Care Act, 2020, which, integrates home and community care into broader health system legislation and recognizes that home and community care is a vital part of an integrated health care system and no longer a stand-alone service. This new legislation will allow Ontario Health Teams to deliver more innovative models of home and community care. Patients will benefit from primary care, hospitals, home and community care and long-term care providers being able to collaborate directly to provide care that best meets individual care needs. Ontario Health Teams will work together to understand a patient's full health care history, directly connect them to the different types of care they need and help patients 24/7 in navigating the health care system.
Education
Ontario’s publicly funded early years and education system is focused on preparing Ontario’s children and students for success, ensuring that young people develop in-demand skills that can be applied to the labour market for good, high paying jobs.
Results reported by the Ministry of Education in 2020–21 include:
- Supported the continuity of learning by making home and remote learning more accessible across the province. Launched the Learn at Home website to offer students and parents access to high quality math and literacy resources in English and French. The site was regularly updated and expanded to include resources in a variety of subject areas for students in Kindergarten to Grade 12 and their families.
- Released the plan for the safe reopening of schools that prioritized the health and safety of students and staff and provided school boards with unprecedented resources and flexibility while accommodating regional differences in trends of public health indicators.
- Provided school boards with guidance to reopen Ontario’s schools and targeted, immediate and evidence-informed investments to support a number of initiatives such as PPE, staffing, public health nurses, testing capacity, health and safety training and supports for students’ mental health and students with special education needs.
- Improved child care. In 2020–21, there were 464,538 licensed child care spaces for children 0-12 years of age, a 0.4 per cent increase over 2019–20.
- Provided direct support to families through the Support for Learners and Ontario COVID-19 Child Benefit to help offset added costs of COVID-19. Both programs provided one-time funding for children and youth up to Grade 12, and for children and youth with special needs up to age 21. To date, over 2.1 million applications have been received and over 95 per cent of applications have been processed for the Support for Learners program. The Ontario COVID 19 Child Benefit was made automatically to all recipients of the Support for Learners payment and received over 200,000 new applications bringing total applications to 2.3 million. Of these more than 97 per cent have been processed.
Postsecondary education
Ontario’s postsecondary system prepares students and job seekers with the high-quality education, skills and opportunities needed to get good jobs, providing Ontario’s employers with the skilled workforce and talent they need to thrive and prosper.
The Ministry of Colleges and Universities provides operating funding to publicly assisted colleges, universities and Indigenous Institutes, manages capital funding programs in the postsecondary sector and funds world-class research in Ontario universities, colleges and academic hospitals fueling the province’s economic growth.
Results reported in 2020–21 include:
- Provided financial assistance through OSAP to over 425,000 students in the 2020–21 fiscal year.
- Provided more than $100 million for 22 publicly assisted colleges and universities to help address the financial impacts of COVID-19 in 2020–21.
- A 71 per cent postsecondary education attainment rate in 2020–21, which remained steady from 71 per cent in 2019–20.
- Invested in 35 peer-reviewed research projects that are advancing knowledge related to preventing, detecting and treating COVID-19 through the Ontario COVID-19 Rapid Research Fund.
Children’s and social services
The Ministry of Children, Community and Social Services (MCCSS) funds and delivers programs and services that promote thriving and inclusive communities, help the people of Ontario build independence and improve their quality of life.
Results reported in 2020–21 include:
- Provided a temporary wage enhancement of $3 per hour on top of existing wages for workers who provide direct support services including to children and youth with special needs and their families through MCCSS-funded programs and services, including respite.
- Expanded access to emergency assistance for the people of Ontario in financial crisis needing help paying for food and housing, who are not already on social assistance and do not have access to other supports.
- Created the Emergency Benefit for Ontarians for those who receive income support from Ontario Works or the Ontario Disability Support Program to assist with additional COVID-19 costs, such as food, cleaning supplies, PPE and non-medical transportation.
- Partially or fully exempted some income types received under Canada’s federal COVID-19 benefits for existing social assistance recipients, while allowing them to retain access to the health and other benefits they receive through social assistance if the federal benefits would otherwise make them financially ineligible.
- Making additional funding available for emergency shelters, food banks, charities, non-profits, and emergency services to enable the support of vulnerable populations, including the homeless and low-income families who use social services.
- Provided supports to address increased costs for service providers as the incidence of gender based violence and domestic violence has continued to increase during the pandemic.
- Ensured Children’s Aid Societies continue to operate and provide services to children, youth and families during the pandemic by encouraging societies to use technology where possible and appropriate and do wellness check-ins while also observing local public health recommendations.
- Made regulatory and policy amendments to ensure that throughout the COVID-19 outbreak, youth in care who turn 18 and former youth in care who turn 21 will not age out of the supports and services they are currently receiving through Children’s Aid Societies.
- Supported and provided flexibility to service providers for children with special needs and autism and continued to provide the Ontario Autism Program interim one-time funding to all new registrants.
- Implemented temporary changes to its family support and respite programs to support families, while physically distanced at home and while community-based programs and services are limited.
- Providing emergency assistance to support First Nations, Inuit and Métis partners and urban Indigenous service providers with COVID-19 and related emergency-response initiatives that will promote community health and well-being.
- In addition, recognizing the impact of the COVID-19 outbreak, the Premier’s Council on Equality of Opportunity is working collaboratively with government, communities and young people to provide advice on policies and programs to address the disproportionate impacts of the outbreak on marginalized families and youth.
Justice
The justice sector supports the administration and delivery of justice services, including the administration of courts, prosecution of offences, and provision of legal services and supports to victims and vulnerable persons, as well as administering the public safety, policing and correctional systems to ensure that Ontario’s diverse communities are supported and protected.
Results reported in 2020–21 include:
- Throughout the COVID-19 emergency and recovery, the Ministry of the Attorney General has worked with partners to move more justice services online and accelerate access to justice through a number of groundbreaking innovations. The Justice Accelerated Strategy builds on this momentum and includes additional capacity for conducting court proceedings, offering more remote proceedings, and providing online methods for filing and interacting with the court.
- The Ministry of the Solicitor General is responsible for community safety, including emergency management. During COVID-19, the ministry-operated Provincial Emergency Operations Centre helped ensure effective and coordinated responses through daily contact with lead provincial ministries such as the Ministry of Health, municipal and First Nation communities, government and non-government agencies, and federal partners.
- The Ministry of the Solicitor General implemented and oversaw enforcement of orders made under three COVID-19 declared provincial emergencies between March 17, 2020 and June 2, 2021, including two Stay-at-Home orders.
- The Solicitor General was appointed co-chair of the Province’s COVID-19 Vaccine Distribution Task Force and the ministry, in partnership with the Ministry of Health, have shared responsibility for the successful rollout of Ontario’s immunization program.
- The Ministry of the Solicitor General also introduced and is responsible for the Reopening Ontario (A Flexible Response to COVID-19) Act, 2020, which extends specific orders to help reduce transmission of COVID-19 and has been instrumental for the safe reopening of the province. The Solicitor General provides monthly reports on the Act.
- During the COVID-19 emergency, measures were put in place to protect ministry frontline workers and support the delivery of critical programs and services to the people of Ontario. Guidance was provided to police officers, firefighters, coroners, forensic personnel and correctional service staff in response to COVID-19, including best practices for physical distancing and use of PPE.
- In its 2019 Budget, the Government of Ontario announced plans to establish a competitive market for legal, online gambling in Ontario. The 2020 Budget announced that an AGCO subsidiary would be established to conduct and manage the new iGaming offerings. On July 6, 2021, amendments to the Alcohol Cannabis and Gaming Regulation and Public Protection Act, 1996 came into effect which establish the iGaming subsidiary with a mandate to conduct and manage internet gaming (iGaming). The subsidiary, called iGaming Ontario, was incorporated on the same day. Ontario’s iGaming market is expected to launch in December 2021.
- Throughout 2020–21, the Ministry of the Attorney General and the Ontario Ministry of Finance have been seeking input from stakeholders in the alcohol industry along with the public to support the development of new regulations that will modernize the legal framework for the sale, service and delivery of alcohol. The government expects to proclaim the new framework into force in fall 2021. The new framework aims to reduce burden and increase flexibility for businesses, as well as make it easier for both businesses and consumers to understand the rules.
- In 2020–21, the First Nations Policing Program supported the employment of over 400 First Nation Constables to help First Nations receive sustainable, accountable, equitable and culturally responsive policing. The Province also contributed to significant infrastructure investments that directly benefited seven First Nations police services that deliver frontline policing to over 85 First Nations in Ontario.
Condition and capacity of provincial tangible capital assets
Infrastructure investments should be made using an evidence-based approach. This includes a focus on asset management to ensure the delivery of high-quality public services, while efficiently managing the costs.
- The Province compiled its first asset inventory in 2016 as a key step in managing provincial assets more effectively. The inventory is now updated annually and currently contains information such as the location, age, condition and value of over 15,000 tangible capital assets including buildings and the Province’s entire road and bridge network. This covers the majority of the infrastructure assets owned or consolidated (i.e., certain BPS organizations) by the Province, as well as some other assets that are funded in part, but not owned or consolidated, by the Province.
- The Province uses the inventory to track, monitor and report on the physical condition of assets. For example, the inventory contains indicators such as Facility Condition Indexes (FCIs), Bridge Condition Indexes (BCIs) and Pavement Condition Indexes (PCIs), which help to inform the state of infrastructure assets.
- Ontario continues to expand infrastructure asset data management to include other relevant data such as the current and projected capacity and utilization of assets. This integrated data provides a base to support evidence-based infrastructure planning decisions which help ensure that infrastructure investments provide value for money and are made at the right time and the right place.
Transparency and accountability
Ontario continues to take steps that enhance government transparency and fiscal accountability in financial reporting. Throughout the fiscal year, the Province provides regular updates on Ontario’s finances. The Annual Report and Consolidated Financial Statements along with supplementary information are central to demonstrating the Province’s transparency and accountability in reporting its financial activities and position at the end of the year.
Recent developments in public sector accounting standards
The Province’s financial reports are prepared in accordance with the accounting principles for governments issued by the Public Sector Accounting Board (PSAB) of the Chartered Professional Accountants of Canada (CPA Canada).
As described in Note 1 to the Consolidated Financial Statements, future changes in both public-sector and private-sector accounting standards may affect how assets, liabilities, revenues and expenses are reported in Ontario’s consolidated financial reports. Other current projects that are being closely monitored by Ontario include PSAB’s review of its employment benefits standard, which includes accounting for pensions as well as accounting for financial instruments, foreign currency translation, asset retirement obligations, revenue reporting and public-private partnerships (P3s).
The C.D. Howe Institute fiscal accountability report
Annually, the C.D. Howe Institute issues its annual commentary on fiscal reporting transparency of senior Canadian governments, with a focus on the relevance, accessibility, timeliness and reliability of these government financial reports. Each government is assigned a letter grade based on the quality of the numbers presented in these reports, access and user friendliness, and the ability to use them for various decision-making purposes.
The last report was released in August 2020 covering the Public Accounts of Ontario 2018–2019. In the report, for the second consecutive year, Ontario had improved its grade.
At the sign-off date for the 2020–21 Public Accounts, the 2021 Fiscal Accountability Report covering the Public Accounts of Ontario 2019–2020 had not been issued.
Footnotes
- footnote[1] Back to paragraph The Consolidated Financial Statements are reported using the 2020 Budget as the Budget comparator.
- footnote[3] Back to paragraph Ontario Teachers’ Pension Plan impact is included in Other programs to align with the presentation in Table 3.9 of the 2020 Budget. In the Consolidated Financial Statements, this item appears under the Education sector. Schedule 4 to the financial statements provides details.
- footnote[4] Back to paragraph Prior year comparatives have been reclassified to be reflected on the same basis as that used to report the actual current year expenses. See Note 17 of the Consolidated Financial Statements.
- footnote[2] Back to paragraph All one-time COVID-19 Health response expenses in the 2020 Budget have been reclassified from Other programs sector to the Health sector.
- footnote[5] Back to paragraph Includes adjustments for the net book value of assets disposed during the year, as well as changes in valuation.
- footnote[6] Back to paragraph Mainly transfers for capital purposes to municipalities and universities and expenditure for capital repairs.
- footnote[7] Back to paragraph Includes government administration, natural resources, social, culture and tourism sectors.
- footnote[8] Back to paragraph Includes third-party investments in consolidated entities such as hospitals, colleges and school boards.
- footnote[9] Back to paragraph Decrease in cash from a net increase of $8.3 billion in changes to assets and liabilities net of the Province’s operating deficit of $16.4 billion. See the Consolidated Statement of Cash Flow.
- footnote[10] Back to paragraph New TCA investments of $10.8 billion less proceeds of $0.2 billion from the sale of tangible capital assets.
- footnote[11] Back to paragraph Decrease in cash due to Investment purchases in excess of retirements of $2.7 billion and the build-up of cash reserve of $10.3 billion.
- footnote[12] Back to paragraph Including net decrease in financing of capital projects through Public-Private Partnership (P3). See Note 4 to the Consolidated Financial Statements.