Public Accounts 2021-22: Annual report
The annual report is a high-level summary of the fiscal year’s results. It includes financial statements, analyzes the state of the Ontario government’s finances and outlines achievements for the fiscal year.
Foreword
I am pleased to present the 2021–22 Public Accounts for the province of Ontario. Each year, the government releases the Public Accounts to give the people of Ontario a comprehensive and transparent view into the province’s finances. From day one, and throughout the pandemic, our government has maintained its commitment to be fully accountable to Ontarians on the state of our province’s finances, and this year is no different.
As was the case in many other jurisdictions, the significant uncertainty caused by the pandemic has made financial planning more difficult than ever before. That uncertainty meant that people in all sectors and walks of life were forced to continually re-evaluate plans to meet new and unforeseen circumstances. The Ontario government is not immune to these uncertainties, and it is during times like these when our steadfast and prudent approach to the management of public sector finances is needed the most.
Throughout the year, we prioritized investments that support the health and well-being of Ontarians, while continuing to build Ontario’s future by spending $17.7 billion on infrastructure, including $6.1 billion on public transit and $2.6 billion on provincial highways. In fact, we invested $2.3 billion more on infrastructure than the previous year, with increased spending on public transit, schools, health care and community infrastructure across Ontario.
Building on our record in 2020–21, we invested $170.5 billion in 2021–22 — $1.5 billion more than the previous year — to ensure Ontarians continued to have access to the critical programs and services they depend on. In March 2021, one year into the pandemic, our government released the 2021 Budget focusing on two vital priorities: protecting people’s health and protecting our economy. In November 2021, we released the 2021 Ontario Economic Outlook and Fiscal Review: Build Ontario, a plan to build the foundation for Ontario’s recovery and prosperity by getting shovels in the ground on critical infrastructure, attracting new investment and restoring our province’s leadership in auto manufacturing.
During the 2021–22 fiscal year, the Omicron variant took hold in Ontario, further stretching capacity in our hospitals and impacting every part of our economy. To meet this new challenge, our government once again leveraged our fiscal strength to support the people and businesses of Ontario. We made unprecedented investments in the health care sector to support and enhance the system, including by adding even more hospital beds and stabilizing the health and long-term care workforce, in addition to supporting the province’s COVID-19 testing strategy and vaccine roll-out. Combined, these efforts resulted in the largest year-over-year increase in health sector spending on record with an additional $6.2 billion over the prior year, for a total of $75.7 billion.
As a Province, our progress would not have been possible without the collective strength and resilience of the people of Ontario, who continued to rise to these extraordinary challenges. Hard working Ontarians are returning to offices, students are back in classrooms and friends and families are gathering together again.
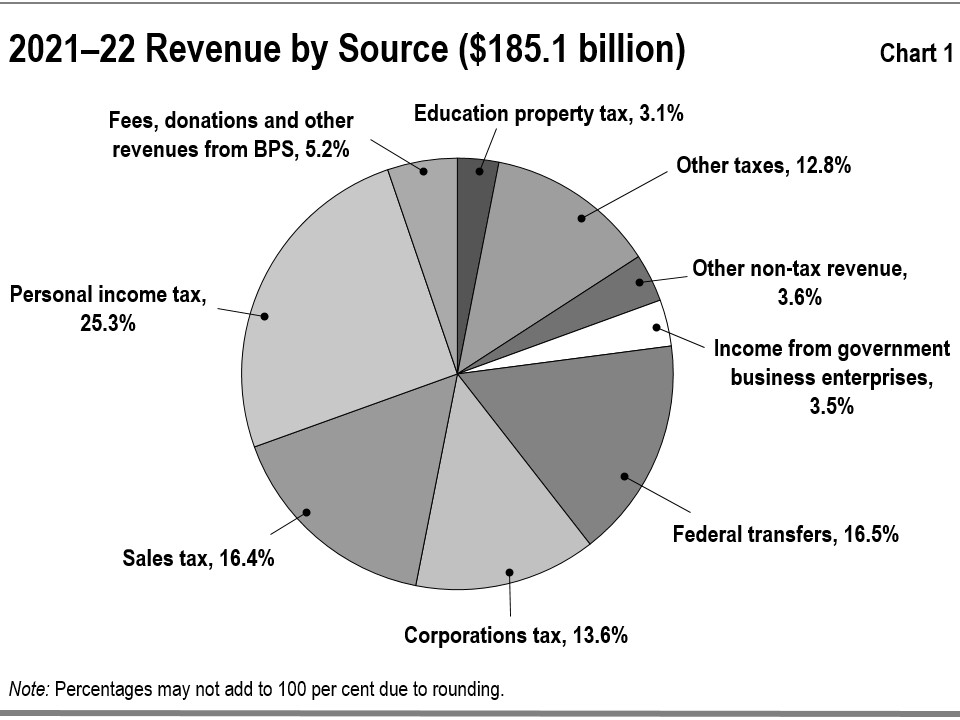
The Public Accounts 2021–22 show a markedly improved fiscal position compared to the 2021 Budget. In 2021-22, total revenue in Ontario was $185.1 billion — 20.2 per cent, or $31.1 billion higher than the 2021 Budget forecast. Higher-than-expected revenues exceeded expenses, leaving the province with a $2.1 billion surplus in 2021-22, which puts the province in a better position to manage the global economic uncertainty we now face. Ontario’s situation is not unique. Other provinces that have released updates to their 2021-22 deficit figures, including Quebec, Saskatchewan, Alberta and British Columbia, are also seeing revenues in excess of their initial forecasts.
While it has been a challenging year, these results show a resilient economy where households and business were well supported by programs from all levels of government. And they confirm the government made the right choices during the pandemic to support workers and businesses to enable them to bounce back strongly. However, the surplus recorded in the 2021–22 Public Accounts is not necessarily indicative of future results. We cannot build a prudent and responsible long-term fiscal plan based on short-term, and uncertain, economic circumstances. Amidst global uncertainty, the government will continue to be prudent fiscal stewards, preserving our ability to support people and businesses through any short-term economic slowdown.
Ontario will continue to provide regular updates on the province’s fiscal and economic outlook based on the latest information available. Our government’s next forward-looking fiscal update will be published in our 2022 Ontario Economic Outlook and Fiscal Review this fall.
We have continued to learn, to grow and to move forward. As we continue to emerge from the COVID‑19 pandemic, there are many challenges that lie ahead. But Ontarians can be assured that their government remains focused on supporting the people of Ontario, protecting the resilience of the province’s economy and on providing a plan that will keep Ontario open, safe and prepared.
Original signed by
The Honourable Prabmeet Singh Sarkaria
President of the Treasury Board
Introduction
The Annual Report is a key element of the Public Accounts of the province of Ontario and is central to demonstrating transparency and accountability in reporting its financial activities and position. Ontario’s Consolidated Financial Statements present the financial results for the 2021–22 fiscal year against the Budget released in March 2021, and the financial position of the government as of March 31, 2022. As in previous years, the Annual Report also compares the current fiscal year’s results to the prior fiscal year’s results and provides a five-year trend analysis for many key financial ratios.
Producing the Public Accounts of Ontario requires the teamwork and collaboration of many stakeholders across Ontario’s public sector. The Office of the Auditor General of Ontario plays a critical role in auditing and reporting on Ontario’s financial statements. The Standing Committee on Public Accounts also plays an important role in providing legislative oversight and guidance. I would like to thank everyone for their contributions and collaboration.
We welcome your comments on the Public Accounts. Please share your thoughts by email to infoTBS@ontario.ca, or in writing to the Office of the Provincial Controller, Re: Annual Report, Office of the Comptroller General, Treasury Board Secretariat, Second Floor, Frost Building South, 7 Queen’s Park Crescent, Toronto, Ontario M7A 1Y7.
Original signed by
Beili Wong, FCPA, FCA
Comptroller General and Deputy Minister
Office of the Comptroller General
Treasury Board Secretariat
Statement of Responsibility
The Consolidated Financial Statements are prepared by the government of Ontario in accordance with the accounting principles for governments issued by the Public Sector Accounting Board (PSAB).
The Consolidated Financial Statements are audited by the Auditor General of Ontario in accordance with the Auditor General Act, and with Canadian generally accepted assurance standards. The Auditor General expresses an independent audit opinion on these Consolidated Financial Statements. Her report, which appears on pages 47-49, provides her audit opinion and the basis for this opinion.
Management prepares the Consolidated Financial Statements in accordance with generally accepted accounting principles for the public sector. Management is also responsible for maintaining systems of financial management and internal controls to provide reasonable assurance that transactions recorded in the Consolidated Financial Statements are within statutory authority, assets are properly safeguarded, and reliable financial information is available for preparation of these Consolidated Financial Statements.
Original signed by
Beili Wong, FCPA, FCA
Comptroller General and Deputy Minister
Office of the Comptroller General
Treasury Board Secretariat
September 12, 2022
Original signed by
Greg Orencsak
Deputy Minister,
Ministry of Finance
September 12, 2022
Original signed by
Maureen Buckley, CPA, CA
Assistant Deputy Minister and Provincial Controller,
Treasury Board Secretariat
September 12, 2022
The government of Ontario is responsible for the Consolidated Financial Statements and accepts responsibility for the objectivity and integrity of these Consolidated Financial Statements and the Financial Statement Discussion and Analysis. Those charged with governance are responsible for overseeing the Ontario government’s financial reporting process.
Original signed by
The Honourable Prabmeet Sarkaria
President of the Treasury Board
September 12, 2022
Original signed by
The Honourable Peter Bethlenfalvy
Minister of Finance
September 12, 2022
Financial statement discussion and analysis
Highlights
2021–22 Financial highlights ($ Billions) - table 1
| Item | 2021 Budget | 2021–22 Actual | 2020–21 Actual | Change from 2021 Budget | Change from 2020–21 Actual |
|---|---|---|---|---|---|
| Total Revenue | 154.0 | 185.1 | 164.9 | 31.1 | 20.2 |
| Expense — Programs | 173.0 | 170.5 | 169.0 | (2.5) | 1.5 |
| Expense — Interest on debt | 13.1 | 12.6 | 12.3 | (0.5) | 0.3 |
| Total Expense | 186.1 | 183.0 | 181.3 | (3.1) | 1.7 |
| Reserve | 1.0 | – | – | (1.0) | – |
| Annual Surplus / (Deficit) | (33.1) | 2.1 | (16.4) | 35.2 | 18.5 |
Note: Numbers may not add due to rounding.
Consolidated Statement of Financial Position as at March 31
| Item | 2021–22 Actual | 2020–21 Actual | Change from 2020–21 Actual |
|---|---|---|---|
| Financial Assets | 129.8 | 117.5 | 12.3 |
| Liabilities | 510.2 | 491.1 | 19.1 |
| Net Debt | (380.4) | (373.6) | (6.8) |
| Non-Financial Assets | 143.6 | 134.3 | 9.3 |
| Accumulated Deficit | (236.9) | (239.3) | 2.4 |
Financial highlights
Prior Year 2020–21 Actuals vs. 2021–22 Actuals
- The Ontario government ended with a $2.1 billion surplus for the fiscal year ended March 31, 2022, comparing to the previous year’s deficit of $16.4 billion, mainly due to higher revenues (see Table 1 above).
- Total revenues are $ 185.1 billion, which are $ 20.2 billion or 12. 2 per cent higher than the previous year, primarily due to increases in taxation revenue and net income from Government Business Enterprises, partially offset by decreases in transfers from the Government of Canada . See details on pages 7-8.
- Total program expenses are $170. 5 billion, which are $1. 5 billion or 0. 9 per cent higher than the previous year. Investments are higher in the health, postsecondary education and justice sectors . Program expenses in education, children’s and social services and other program sectors are lower primarily due to one-time COVID‑19 investments in 2020–21. See details on pages 12-15.
- Interest on debt is higher than the previous year by $0.3 billion, or 2.4 per cent, mainly due to increased debt primarily to fund investments in capital assets. See details on page 21.
- Non-financial assets, including capital assets, increased by $9.3 billion from the previous year. The net book value of Ontario’s capital assets, such as buildings and transportation infrastructures, grew by $7.7 billion during the year. Ontario invested $14.7 billion in assets owned by the government and its consolidated entities, which reflect new capital investments, mainly in the transportation, health and education sectors. The government also made $3.0 billion in additional capital investments in transfers to non-consolidated partners and other infrastructure expenditures. See details on pages 25-27.
- Total liabilities increased by $19. 1 billion and total financial assets increased by $12. 3 billion, resulting in an increase of $ 6.8 billion or 1. 8 per cent in net debt from the previous year (see details on pages 24-29). The accumulated deficit decreased by $2. 4 billion, or 1.0 per cent, from the previous year mainly as a result of the reported surplus of $2.1 billion. See details on page 53.
2021 Budget vs. 2021–22 Actuals
- The Ontario government ended with a $2.1 billion surplus for the fiscal year ended March 31, 2022, comparing to a forecasted deficit of $33.1 billion in the 2021 Budget, primarily due to higher revenues (see Table 1 above).
- Total revenues are $ 185.1 billion, which are $ 31.1 billion or 20.2 per cent higher than projected in the 2021 Budget, largely due to higher taxation revenues reflecting a resilient economy and higher-than-expected inflation. Transfers from the Government of Canada , net income from Government Business Enterprises were also higher than projected, while lower-than-expected revenue from other non-tax revenue was reported by ministries and government agencies. See details on page 9.
- Total program expenses are $170. 5 billion, which are $2. 5 billion or 1. 4 per cent lower than the 2021 Budget. Investments are higher in the health and justice sectors – mainly due to additional funding to address the COVID‑19 pandemic. They are lower in other sectors. See details on pages 16-18.
- Interest on debt is lower than the 2021 Budget by $0.5 billion, or 3.8 per cent, due to lower borrowings of approximately $14.0 billion and higher -than -budgeted interest capitalization. See details on page 21.
Analysis of 2021–22 results
Revenue
Details of 2021–22 actual results ($ Billions) - table 2
| Revenue | 2021 Budget | 2021–22 Actual | 2020–21 Actual | Change from 2021 Budget | Change from 2020–21 Actual |
|---|---|---|---|---|---|
| Personal Income Tax | 36.4 | 46.8 | 40.3 | 10.4 | 6.5 |
| Sales Tax | 27.6 | 30.4 | 26.6 | 2.8 | 3.8 |
| Corporations Tax | 14.4 | 25.2 | 17.8 | 10.8 | 7.4 |
| Employer Health Tax | 6.4 | 7.2 | 6.5 | 0.8 | 0.7 |
| Education Property Tax | 5.8 | 5.7 | 6.0 | (0.1) | (0.3) |
| Ontario Health Premium | 4.1 | 4.4 | 4.3 | 0.3 | 0.1 |
| Gasoline and Fuel Tax | 3.2 | 3.0 | 2.6 | (0.2) | 0.4 |
| Other Taxes | 6.9 | 9.0 | 6.7 | 2.1 | 2.3 |
| Total Taxation Revenue | 104.8 | 131.7 | 110.9 | 26.9 | 20.8 |
| Government of Canada | 27.4 | 30.6 | 33.9 | 3.2 | (3.3) |
| Income from Government Business Enterprises | 4.5 | 6.4 | 5.0 | 1.9 | 1.4 |
| Other non-tax revenue | 17.2 | 16.3 | 15.1 | (0.9) | 1.2 |
| Total Revenue | 154.0 | 185.1 | 164.9 | 31.1 | 20.2 |
Note: Numbers may not add due to rounding.
Change from 2020–21 actuals
Total revenues for 2021–22 increased by $ 20.2 billion or 12. 2 per cent from the previous year.
- Taxation revenue increased by $20.8 billion or 18.8 per cent in 2021–22, mostly reflecting a resilient economy that bounced back strongly from the COVID‑19 pandemic-induced downturn in 2020 and rising inflation which contributed to higher nominal GDP growth. Economic activity strengthened in 2021 as the economy reopened, while households and businesses continued to be well supported by programs from all levels of government, and unprecedented monetary policy support by the Bank of Canada. Ontario’s labour market and housing market grew strongly in 2021, while consumer spending and business profits posted strong gains which led to higher revenues from Personal Income Tax, Corporations Tax, Sales Tax and Land Transfer Tax.
- Transfers from the Government of Canada decreased by $3.3 billion or 9. 7 per cent, mostly reflecting reduced COVID‑19 time-limited funding. This decrease was partially offset by higher transfers from major federal funding programs, including the Canada Health Transfer, the Canada Social Transfer, support for home care and mental health, as well as early learning and child care.
- Income from Government Business Enterprises (GBEs) increased by $1.4 billion or 28. 0 per cent, largely due to higher net income from the Ontario Lottery and Gaming Corporation (OLG) and the Ontario Power Generation (OPG). Higher OLG net income reflects the earlier than expected easing of COVID‑19 public health restrictions at land-based gaming sites, as well as strong performance in lottery and digital offerings. Higher OPG net income mainly reflects better operational performance and realized gains in the Ontario Nuclear Funds.
- Other non-tax revenue including revenue from the Broader Public Sector increased by $ 1.2 billion or 7.9 per cent in 2021–22. This increase mainly reflects higher third-party revenue from hospitals, colleges and school boards, and consolidated government agencies following the easing of the COVID‑19 restrictions. The overall Other non-tax revenue increase is partially offset by lower revenue from vehicles and driver registration fees due to the elimination and refund of vehicle permit and sticker validations fees.
Change from the 2021 Budget
Ontario’s nominal GDP grew 11.9 per cent in the 2021 calendar year, the strongest annual pace since the early 1980s, and up from a projection of 6.2 per cent at the time of the 2021 Budget.
Revenues for 2021–22 were $ 31.1 billion or 20.2 per cent higher than expected in the 2021 Budget.
- Taxation revenues were $26.9 billion or 25. 7 per cent higher than projected in the 2021 Budget, reflecting a resilient economy that bounced back strongly from the pandemic-induced downturn in 2020 , and higher-than-projected inflation. This contributed to nominal GDP growth being significantly stronger than expected, while households and businesses continued to be well supported by programs from all levels of government, and unprecedented monetary policy support by the Bank of Canada.
- Transfers from the Government of Canada were $3.2 billion or 11. 7 per cent higher, mainly due to additional one-time funding through the federal Budget Implementation Act, 2021 (Bill C-30) and amendments to the Federal-Provincial Fiscal Arrangements Act to support COVID‑19 recovery, and recognizing in-kind federal revenue associated with Personal Protective Equipment (PPE) and COVID‑19 testing. These increases were partially offset by lower-than-expected funding for infrastructure programs due to slower -than -expected delivery of projects resulting from the COVID‑19 pandemic.
- Income from GBEs was $1.9 billion or 42.2 per cent higher, mainly reflecting higher revenue from OPG and OLG. Net income from OPG was higher mainly due to better than forecast operational performance and realized gains in the Ontario Nuclear Funds. OLG’s net income was higher due to stronger -than -expected performance in the OLG lottery business and digital offerings .
- Other non-tax revenues, including revenues from the Broader Public Sector, were $0.9 billion or 5.2 per cent lower, mainly due to the elimination and refund of vehicle permit and sticker validation fees. This decline was partially offset by higher revenue from royalties and other miscellaneous revenue sources.
Revenue trend
Chart 2 shows the recent trends in revenue for Ontario’s major revenue sources.
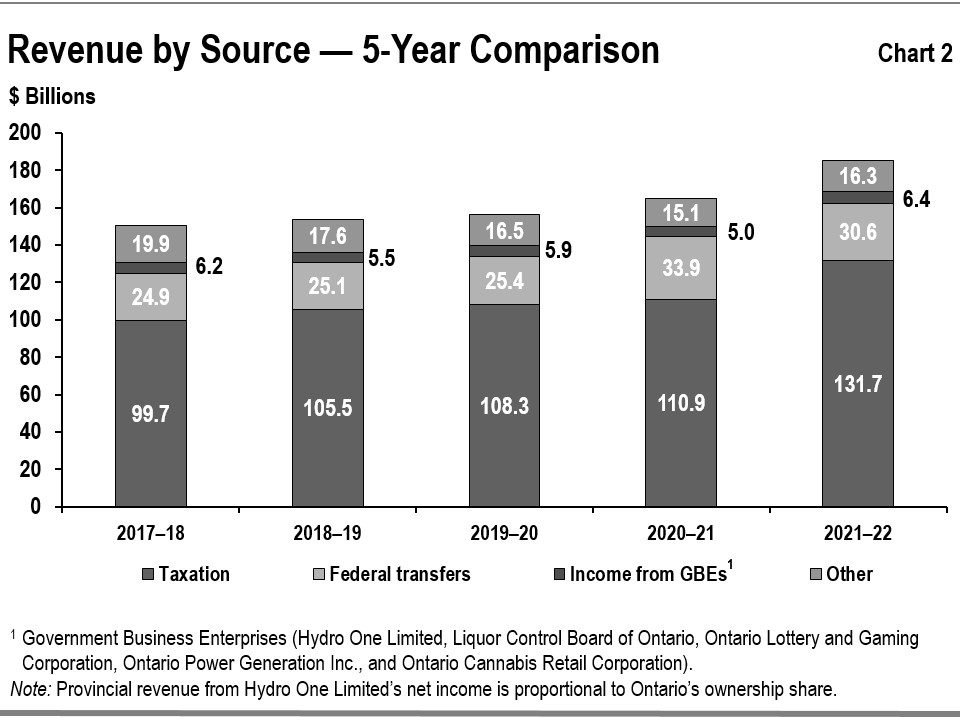
Taxation revenue
Between 2017–18 and 2021–22 taxation revenue grew at an average annual rate of 7.2 per cent, higher than the average annual rate of nominal GDP growth of 4.1 per cent.
Taxation revenue growth in 2021–22 (+18.8 per cent) reflected a resilient economy that bounced back strongly from the pandemic-induced downturn in 2020. Nominal GDP growth was significantly stronger than expected partly driven by higher-than-projected inflation while households and businesses continued to be well supported by programs from all levels of government, and unprecedented monetary policy support by the Bank of Canada.
Although economic growth and taxation revenue growth are closely linked, the relationship is affected by several factors, including but not limited to:
- Growth in some revenue sources, such as Corporations Tax and Mining Tax, which can diverge significantly from economic growth in any given year due to the inherent volatility of business profits as well as the use of tax provisions, such as the option to carry losses forward or backward;
- The impact of housing completions and resales on HST and Land Transfer Tax revenue which is proportionately greater than their contribution to GDP;
- Changes in volume-based gasoline and fuel taxes which are more closely aligned to growth in real GDP as opposed to nominal GDP since these revenue sources are not directly influenced by price changes; and
- During 2021–22, continued financial support from all levels of government was provided to people and businesses in response to COVID‑19, as well as unprecedented monetary policy support from the Bank of Canada, which contributed to growth in Personal and Corporate Income Tax revenues, but these did not directly increase GDP.
Federal government transfers
Between 2017–18 and 2021–22, Government of Canada transfers grew at an average annual rate of 5.3 per cent. In addition to major federal transfer programs such as the Canada Health Transfer and Canada Social Transfer, there are also a number of federal transfers that are largely program specific such as social housing, infrastructure and labour market programs. Some transfers are ongoing while others are time limited.
Total federal transfer revenues decreased 9. 7 per cent in 2021–22 largely due to reduced COVID‑19 time-limited funding. This decrease was partially offset by higher transfers from major federal funding programs including the Canada Health Transfer, the Canada Social Transfer, support for home care and mental health, early learning and child care, as well as one-time transfers. For more details on the changes in Federal –Provincial COVID‑19 Response Programs, see page 23.
Income from government business enterprises
Between 2017–18 and 2021–22, income from GBEs increased at an average annual rate of 1.2 per cent. This increase reflects increases in total net income from GBEs. Income from GBEs includes the net income from the LCBO, OLG, OPG, Hydro One Limited (HOL) and the Ontario Cannabis Retail Corporation (OCRC). OLG’s net income, while has improved this year, has yet to fully recover to its pre-pandemic level.
Other non-tax revenues
Other non-tax revenues decreased at an annual average rate of 4.8 per cent between 2017–18 and 2021–22. This is mainly due to the elimination of carbon allowance proceeds and the Electricity Debt Retirement Change in 2018 –19, as well as lower sales and rentals. In addition, other non-tax revenues declined in 2021 –22 partly due to the elimination of vehicle permit and sticker validation fees. Other non-tax revenues are comprised of a number of revenue sources, including but not limited to revenue from hospitals, school boards and colleges, sales and rentals of goods and services, other fees, licences and permits, reimbursements of provincial expenditures in delivering certain services, royalties for the use of Crown resources, and electricity sector revenues such as power supply contract recoveries.
Expense
Details of 2021–22 actual results ($ Billions) - table 3
| Expense | 2021 Budget | 2021–22 Actual | 2020–21 Actual | Change from 2021 Budget | Change from 2020–21 Actual |
|---|---|---|---|---|---|
| Health sector | 74.9 | 75.7 | 69.5 | 0.8 | 6.2 |
| Education sector | 31.3 | 29.9 | 31.3 | (1.4) | (1.4) |
| Postsecondary education sector | 10.7 | 10.6 | 9.8 | (0.1) | 0.8 |
| Children’s and social services sector | 17.9 | 17.1 | 17.4 | (0.8) | (0.3) |
| Justice sector | 4.8 | 5.0 | 4.8 | 0.2 | 0.2 |
| Other programs | 33.4 | 32.1 | 36.2 | (1.3) | (4.1) |
| Total Program Expense | 173.0 | 170.5 | 169.0 | (2.5) | 1.5 |
| Interest on debt | 13.1 | 12.6 | 12.3 | (0.5) | 0.3 |
| Total Expense | 186.1 | 183.0 | 181.3 | (3.1) | 1.7 |
| Reserve | 1.0 | - | - | (1.0) | - |
Note: Numbers may not add due to rounding.
Change from 2020–21 actuals
Total program expenses for 2021–22 increased by $1.5 billion or 0.9 per cent, from $169.0 billion in the previous fiscal year to $170.5 billion.
- Health sector expense increased by $6.2 billion or 8.9 per cent over the previous fiscal year, mainly due to increased spending in base health sector programs as the province gradually re ‑opened during the year , as well as additional spending in response to the COVID‑19 pandemic. There was also lower expense due to an accounting adjustment to record personal protective equipment inventory, in compliance with the public sector accounting standards and in alignment with a recommendation from the Office of the Auditor General of Ontario. Key health care investments included:
- $1.8 billion for Ontario’s COVID‑19 testing strategy and the vaccine roll-out, including laboratory capacity and assessment centres ;
- $1.6 billion in additional hospital funding which also includes COVID‑19 supports ;
- $1.2 billion to support increased utilization of health care services, including more visits to physicians and practitioners, increased spending on drug programs to support the aging population, as well as the addition of new therapies ;
- $0.9 billion to stabilize the health and long-term care workforce, including supports for the temporary retention incentive for Ontario's nurses, the accelerated training program and wage enhancement for personal support workers, and the Long-Term Care Staffing Plan to increase daily direct care for residents ;
- $0.3 billion in additional investments to expand home and community care services, as well as to address increased demand for mental health services and specialized care for children and youth with eating disorders ; and
- $0.2 billion to support long-term care homes during the COVID‑19 pandemic, including funding for enhanced prevention and containment measures and for an increased level of care.
- While base funding for education increased by $0.4 billion, total education sector expense decreased by $1.4 billion or 4.5 per cent over the previous fiscal year . This is mainly due to time-limited COVID‑19 funding supports intended for one year only in 2020–21, such as $0.9 billion for the Ontario COVID‑19 Child Benefit and $0.4 billion for the Support for Learners program.
- Postsecondary education sector increased by $0.8 billion or 8.2 per cent over the previous fiscal year, mainly due to higher college sector spending from increased on-campus activities after the easing of restrictions and closures due to COVID‑19, as well as $0.2 billion for higher spending on student financial assistance.
- Children’s and social services sector expense decreased by $0.3 billion or 1.7 per cent over the previous fiscal year, primarily due to temporary federal COVID‑19 support programs that directly led to $0.2 billion in lower demand /eligibility for social assistance and the Ontario Child Benefit. In addition, there was lower spending on temporary COVID ‑19 ‑related programs and supports as conditions of the pandemic have evolved.
- Justice sector expense increased by $0.2 billion or 4.2 per cent over the previous fiscal year, mainly due to funding for the COVID‑19 Vaccine Distribution Secretariat and the Ontario Provincial Police, as well as improvements to segregation conditions in correctional facilities and the modernization and operation of Ontario’s correctional services system, as well as investments to reduce the backlog of criminal cases.
- Other programs expense decreased by $4.1 billion or 11.3 per cent over the previous fiscal year, mostly reflecting:
- $2.8 billion decrease due to the tapering off of the time-limited Ontario Small Business Support/Relief Grant payments, which supported small businesses impacted by COVID‑19 restrictions;
- $2.3 billion decrease primarily due to the wind-down of time-limited COVID‑19 investments for municipalities, including $1.4 billion in the federal –provincial Safe Restart Agreement and $0.5 billion in provincial COVID‑19 Recovery Funding for Municipalities;
- $1.5 billion decrease primarily due to the time-limited Safe Restart Agreement funding provided to support municipal transit systems in the previous year;
- $157 million decrease primarily due to the time-limited Canada Emergency Commercial Rent Assistance program ending in 2020–21, which delivered urgent COVID‑19-related relief to small businesses and their landlords in partnership with the federal government;
- $146 million decrease primarily due to an accounting adjustment to record personal protective equipment as inventory for the non-health sector , in compliance with the public sector accounting standards and aligned with a recommendation from the Office of the Auditor General of Ontario; and
- $114 million decrease primarily due to lower uptake from the agricultural sector for demand-driven Business Risk Management programming, driven by various factors such as commodity prices and weather conditions.
- The decrease in 2021–22 is partially offset by:
- $1.2 billion increase primarily due to higher Employee Pension and Benefits including a one-time change in the basis of estimate for Workplace Safety and Insurance Board (WSIB) expense and an increase in costs for Retired Pensioners’ Benefits;
- Approximately $506 million increase related to initiatives to respond to the impacts of COVID‑19, including the enhancement to the Reconnect Ontario Program, the creation of the Tourism Recovery Program, and other COVID‑19 supports, as well as higher than anticipated demand for the cultural and media tax credits;
- $488 million increase mainly due to COVID‑19 supports for workers and employers. This includes enhancements to the Skills Development Fund and the Ontario Jobs Training Tax Credit to address challenges in hiring, training , retraining, and upskilling workers, as well as protections for workers and employers through the Ontario COVID‑19 Worker Income Protection Benefit to reimburse employers for COVID‑19 paid leave days;
- $449 million net increase primarily due to investments under the suite of Electricity Rate Mitigation programs (Ontario Electricity Rebate and the Comprehensive Electricity Plan) and an increase in contaminated sites liability;
- $359 million increase primarily due to increased investments for the Ontario Community Infrastructure Fund and the Investing in Canada Infrastructure Program; and
- $68 million increase primarily due to expenses associated with record visitation in Ontario Parks in 2021, additional spending for the Ontario Clean Water Agency, as well as investment in wastewater monitoring to inform public health decision-making .
See Chart 3 for details of program expense by sector.
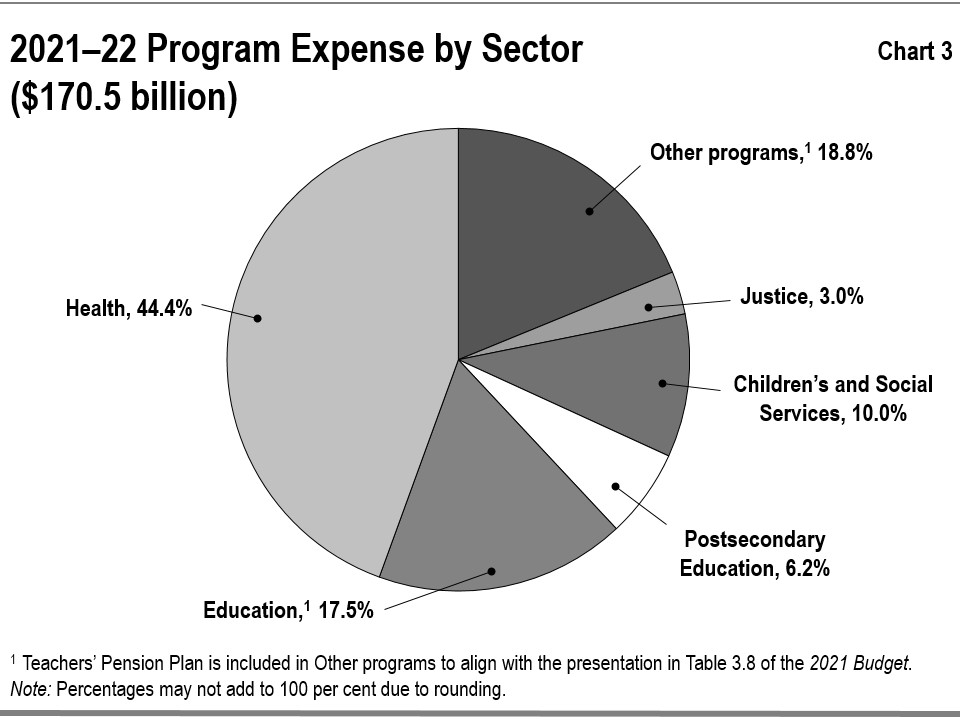
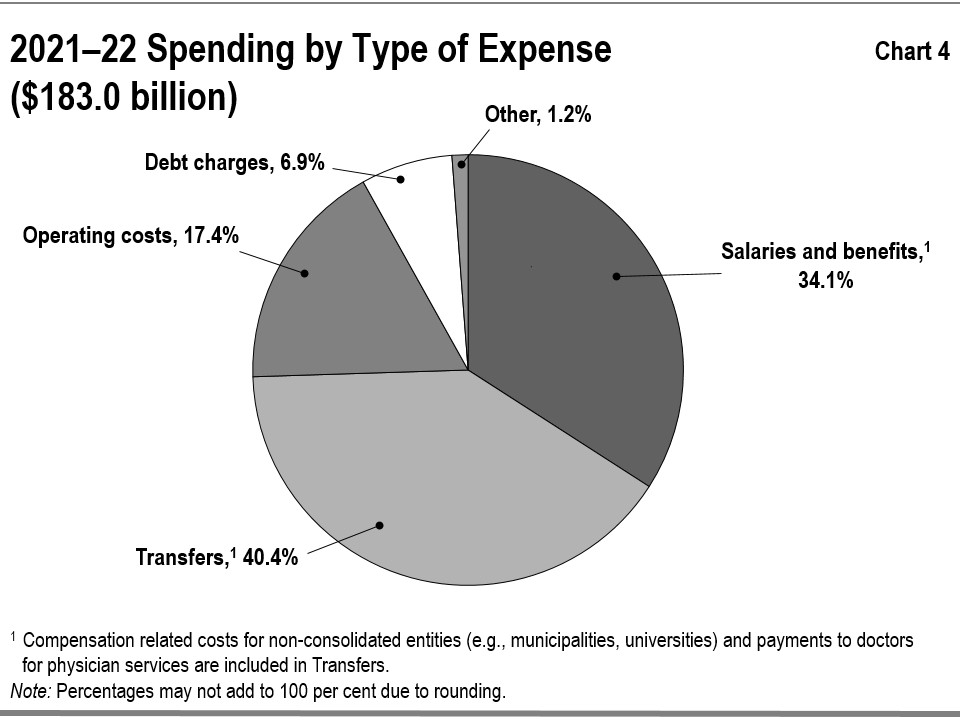
Chart 4 shows spending by type of expense. Government spending related to salaries and benefits includes those expenses for organizations consolidated as part of the government reporting entity, including hospitals, school boards and colleges, as well as the Ontario Public Service.
The expense labelled “Transfers” in Chart 4 reflect payments to a variety of service providers that support the delivery of public services. These third-party funding recipients consist of health care professionals including physicians, social service agencies, universities, child care providers, and municipalities. As service providers, a large share of the spending of these third parties typically go to salaries and benefits. Transfers do not include transfers to hospitals, school boards and colleges — these are reflected in the other expense types such as operating costs and salaries and benefits, as reported by the organizations.
Change from the 2021 Budget
Total program spending for 2021–22 was $ 170.5 billion, which is $2.5 billion or 1.4 per cent lower than the 2021 Budget . Changes in program spending were primarily attributed to:
- Health sector expense was $0.8 billion or 1.1 per cent above plan, mainly due to increased investments in hospitals and long-term care homes to address COVID‑19 , including support for more than 3,000 additional hospital and critical care beds, enhanced prevention and containment measures, as well as retention and stabilization of health human resources including nurses and personal support workers. There was also funding to continue Ontario’s COVID‑19 vaccination plan and to expand home and community care services. The variance in the health sector includes $0.5 billion lower-than-planned expense due to an accounting adjustment to record personal protective equipment inventory , in compliance with public sector accounting standards and in alignment with a recommendation from the Office of the Auditor General of Ontario.
- Education sector expense was $1.4 billion or 4.5 per cent below plan, primarily due to lower school board spending resulting from a decline in non-government revenue from sources such as fundraising, community use of schools , international student tuition, and lower-than-projected enrolment due to the continued impacts of COVID‑19.
- Postsecondary education sector expense was $0.1 billion or 0.9 per cent below plan, mainly due to lower -than -expected student uptake based on need for financial assistance as a result of continued federal supports and lower -than -projected enrolment. This was partially offset by higher -than -forecasted college sector spending as a result of campuses re-opening after COVID‑19-related restrictions and closures.
- Children’s and social services sector expense was $0.8 billion or 4.5 per cent below plan, primarily due to the continuation of temporary federal COVID‑19 support programs that led to lower-than-expected demand /eligibility for social assistance and the Ontario Child Benefit. The expense also reflects investments to provide a wage enhancement for eligible personal support workers and direct support workers in the sector.
- Justice sector expense was $0.2 billion or 4.2 per cent above plan, primarily due to COVID ‑19 supports such as the COVID‑19 Vaccine Distribution Secretariat, additional funding to address the backlog of criminal cases, and to support the Ontario Provincial Police.
- Other program expense that was $1.3 billion or 3.9 per cent below plan, mainly due to:
- $2.3 billion decrease primarily due to the transfer of contingency funds for program expenses in various sectors to respond to emerging needs for health care, workers, infrastructure and businesses, and unforeseen events;
- $503 million decrease primarily due to realigned implementation timelines for programs such as the Broadband and Cellular Infrastructure Program and the Investing in Canada Infrastructure Program;
- $443 million decrease in municipal transfer payments due to revised timelines for municipal transit projects and lower-than-forecasted amortization expense; and
- $80 million decrease primarily due to lower uptake from the agricultural sector for demand-driven Business Risk Management programming, driven by various factors such as commodity prices and weather conditions.
- The decrease was partially offset by:
- Increase of $0.9 billion due to higher Employee Pension and Benefits including a one ‑time change in the basis of estimate for Workplace Safety and Insurance Board expense and an increase in costs for Retired Pensioners’ Benefits;
- Increase of $0.2 billion for supports for workers and employers, including the introduction of the Ontario COVID‑19 Worker Income Protection Benefit program and enhancements to the Ontario Jobs Training Tax Credit and the Skills Development Fund to aid in Ontario’s economic recovery;
- Increased expense of $186 million due to higher -than -expected forest fire activity across the province and associated emergency support ;
- Increase of $152 million primarily reflecting additional relief on energy bills during COVID‑19;
- Increase of $152 million associated with the recognition of contingent liabilities for land and land-related claims and Ontario’s statutory obligations as per the English and Wabigoon River Systems Mercury Contamination Settlement Agreement Act, 1986; and
- Net increase of $105 million primarily due to the extension of the time-limited COVID‑19-related Ontario Small Business Support/Relief Grant programs and increased funding for tax credit programs, partially offset by lower-than-forecasted spending in time-limited investments.
Expense trend
Chart 5 shows the recent trends in spending for major program areas.
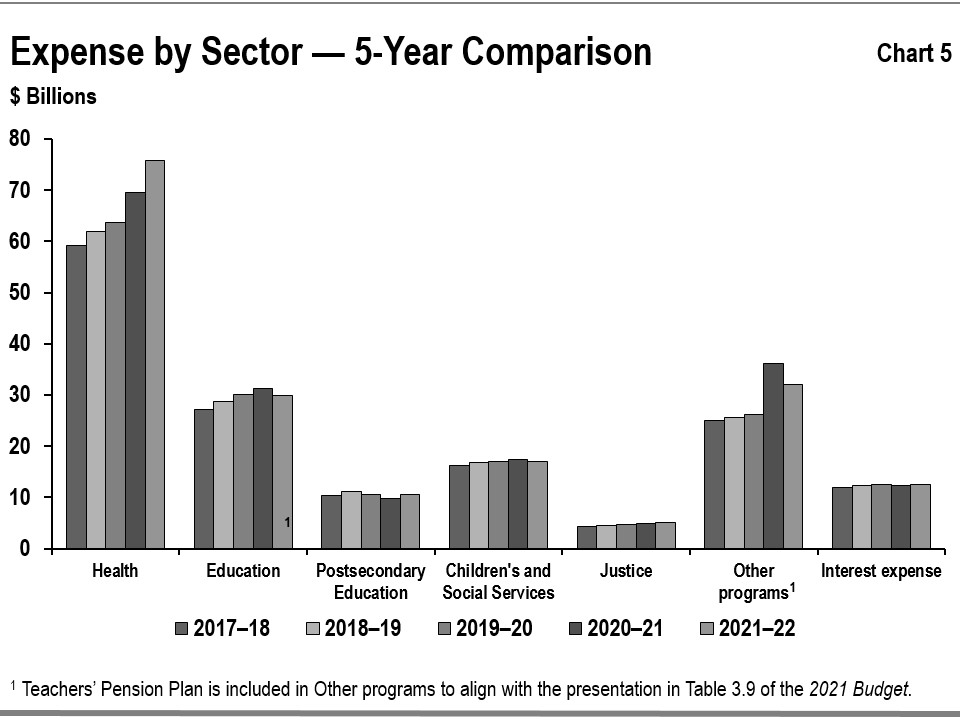
- Health sector expense increased from $59.1 billion in 2017–18 to $75.7 billion in 2021–22, or on average by 6.4 per cent per year. The increased funding is primarily due to:
- Support for Ontario’s hospitals and home and community care services;
- Investments to meet demand for health care services arising from population growth and increased utilization of drug programs, cancer care treatments and blood services;
- Additional funding to improve access to mental health and addiction services;
- Investments to address long-term care sector waitlists and capacity challenges by building new long-term care beds, including four new long-term care homes as part of the Accelerated Build Pilot Program ; and
- Time-limited investments to address the COVID‑19 pandemic including funding to prevent and contain the spread of COVID‑19 in long-term care homes .
- Education sector expense increased from $27.3 billion in 2017–18 to $29.9 billion in 2021–22, or on average by 2.3 per cent per year. The increase is mainly due to:
- Higher annual school board funding and enrolment, as well as negotiated school board labour agreements such as compensation increases and investments in staffing and local priorities; and
- Federal and provincial initiatives in 2020–21 and 2021–22 to help the education sector respond to the COVID‑19 pandemic and support the needs of students and staff.
- Postsecondary education sector expense increased from $10.5 billion in 2017–18 to $10.6 billion in 2021–22, or on average by 0.3 per cent per year. The increase is mainly due to increased college sector spending. This was partially offset by the wind-down of time ‑limited federal infrastructure investments and other capital spending, as well as changes in uptake of student financial assistance programs.
Children’s and social services sector expense increased from $16.2 billion in 2017–18 to $17.1 billion in 2021–22, or on average by 1.3 per cent per year. This increase primarily reflects:
- New investments to provide wage enhancement for eligible personal support workers and direct support workers in the social services sector;
- Increased investment to support client needs in the Ontario Disability Support Program, Ontario Autism Program and Developmental Services programs; and
- Additional funding for COVID‑19 supports such as enhanced cleaning, personal protective equipment and short-term staffing for residential and community service providers.
- Justice sector expense increased from $4.3 billion in 2017–18 to $5.0 billion in 2021–22, or on average by 4.2 per cent per year. The increase is primarily due to:
- Investments in programs such as the Public Safety Radio Network, the Guns, Gangs and Violence Reduction Strategy, and Ontario’s Anti-Human Trafficking Strategy;
- Funding to improve segregation conditions, modernize the correctional services system though infrastructure investments and support for frontline workers, as well as address the backlog of criminal cases; and
- Funding to support the government’s response to COVID‑19 through the management of emergency orders, pandemic management in congregate settings, and the COVID‑19 Vaccine Distribution Secretariat including mobile vaccination clinics.
- Other programs expense increased from $25.0 billion in 2017–18 to $32.1 billion in 2021–22, or on average by 6.5 per cent per year. The increase is primarily due to:
- Higher Employee Pension and Benefits due to a one-time change in the basis of estimate for Workers’ Safety Insurance Board expense, and an increase in costs for Retired Pensioners’ Benefits;
- Infrastructure program investments in the Broadband and Cellular Action Plan, the Investing in Canada Infrastructure Program and the Ontario Community Infrastructure Fund;
- Investments in transportation resulting in growth in amortization expense due to transit and highway capital projects coming into service and increased Metrolinx operating expenses.
- Investments under the suite of electricity rate mitigation programs primarily under the Ontario Electricity Rebate program and the Comprehensive Electricity Plan program, as well as time-limited rate mitigation efforts in response to COVID‑19;
- Time-limited COVID‑19 investments to support the hiring, training, retraining, and upskilling of workers through the Skills Development Fund and the Ontario Jobs Training Tax Credit, as well as funding to provide paid sick days through the Ontario COVID‑19 Worker Income Protection Benefit program; and
- COVID‑19 investments for prevention and control measures in retirement homes and support for the temporary pandemic premium pay for frontline workers.
Interest on debt
Interest on debt expense was $0.5 billion below plan from the 2021 Budget in 2021–22, mainly as a result of lower than planned borrowings of approximately $14.0 billion and higher -than -budgeted interest capitalization, slightly offset by a small increase in the cost of borrowing from 1.9 per cent to 2.1 per cent.
Interest on debt expense increased from $12.3 billion in 2020–21 to $12.6 billion in 2021–22 as a result of increased debt primarily to fund investments in capital assets.
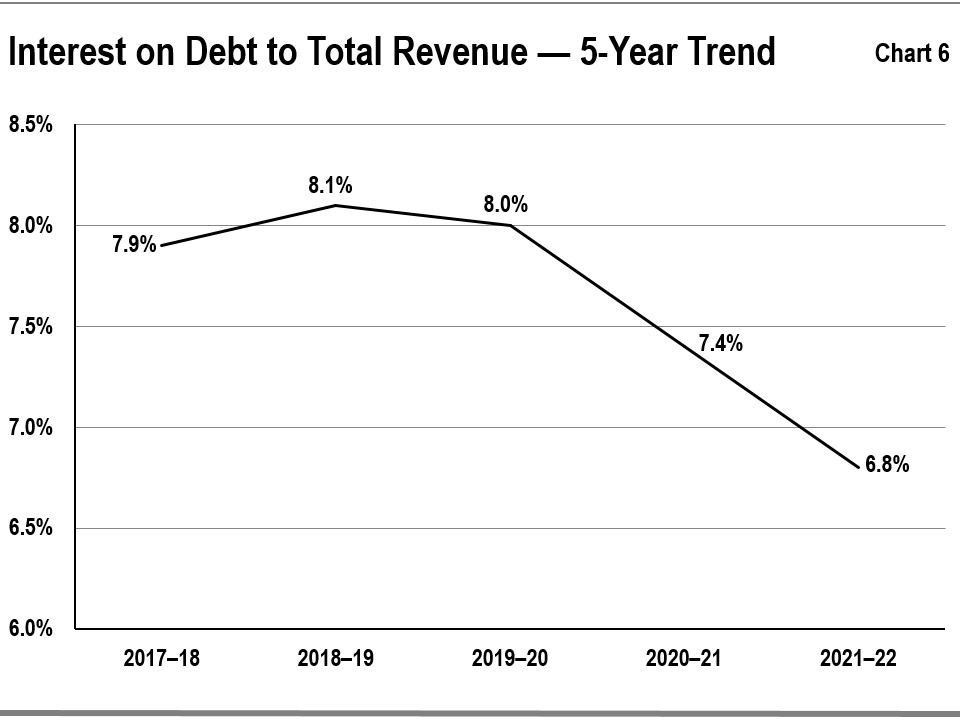
Chart 6 shows that the ratio of interest on debt to total revenue has fallen for Ontario over the past four years, from a high of 8.1 per cent in 2018–19 to the current level of 6.8 per cent. The decrease from 7.4 per cent in 2020–21 to 6.8 per cent in 2021–22 is due to the rate of increase in Ontario’s total revenues outstripping the rate of increase in the interest on debt expense.
COVID‑19 analysis
2021–22 COVID‑19 Expenses by Sector ($ Billions) - table 4
| Expense | 2021–22 Actual | 2020–21 Actual | Change from 2020–21 Actual |
|---|---|---|---|
| Health sector | 6.2 | 5.1 | 1.1 |
| Education sector | 1.1 | 2.9 | (1.8) |
| Postsecondary education sector | 0.1 | 0.3 | (0.2) |
| Children’s and social services sector | 0.3 | 0.4 | (0.1) |
| Justice sector | 0.3 | 0.2 | 0.1 |
| Other programs | 2.9 | 10.2 | (7.3) |
| Total Expense | 10.9 | 19.1 | (8.2) |
Note: Numbers may not add due to rounding.
Total COVID‑19 spending in 2021–22 decreased by $8.2 billion from $19.1 billion in the previous fiscal year to $10.9 billion.
- COVID‑19 spending in the Health sector increased by $1.1 billion over the previous fiscal year, mainly due to investments to support the COVID‑19 testing and vaccine strategy, as well as additional funding to help stabilize the health and long-term care workforce and support infection prevention and containment measures in long-term care homes.
- COVID‑19 spending in the Education sector decreased by $1. 8 billion over the previous fiscal year, mainly due to time-limited COVID‑19 funding supports in 2020–21, such as the Ontario COVID‑19 Child Benefit, the Support for Learners program, emergency child care and the safe restart of schools. The 2021–22 spending also reflects COVID‑19 investments in schools, including temporary staffing, school operations, school ventilation improvements, rapid test kits, learning recovery and renewal, connectivity supports for remote learning technology, and increased access to school board reserves.
- COVID‑19 spending in the Postsecondary education sector decreased by $0.2 billion over the previous fiscal year mainly due to the time-limited funding provided to postsecondary education institutions in 2020–21 to address the financial impacts of COVID‑19.
- COVID‑19 spending in Other programs decreased by $7.3 billion over the previous fiscal year, mainly due to:
- $2. 8 billion decrease due to
- the tapering off of the time-limited Ontario Small Business Support /Relief Grant programming, which supported small businesses impacted by COVID‑19 restrictions.
- $2.4 billion decrease in the Ministry of Municipal Affairs and Housing mainly due to time-limited investments in 2020–21 such as $1.4 billion in the Safe Restart Agreement and $0.5 billion in provincial COVID‑19 Recovery Funding for Municipalities. There was also $0.5 billion lower expense in the Social Services Relief Fund in 2021–22 compared to the prior year.
- $1.8 billion decrease due to the conclusion of time-limited funding under the Safe Restart Agreement to support operating pressures for municipal transit systems.
- $591 million decrease in electricity bill supports due to the conclusion of funding to defer Global Adjustment charges and reduced need for off-peak Time of Use electricity support.
- The decrease was partially offset by:
- Increase of $760 million in time-limited COVID‑19 investments to support the hiring, training, retraining and upskilling of workers through the Skills Development Fund and the Ontario Jobs Training Tax Credit, as well as funding to provide paid sick days through the Ontario COVID‑19 Worker Income Protection Benefit program .
- The decreased COVID‑19 2021–22 spending also reflects an accounting adjustment to record personal protective equipment inventory, in compliance with public sector accounting standards and in alignment with a recommendation from the Office of the Auditor General of Ontario.
Note: these totals are inclusive of federal support . Some federal funding received also supported increased spending for base programs, including in the health sector, to meet increased demand. Please see section below for more information.
Federal–Provincial COVID‑19 Response Programs
- In 2021–22, Ontario continued to work in partnership with the federal government to secure federal investments to support the people of Ontario. In total, Ontario received $3.7 billion in COVID‑19 time-limited funding in 2021–22 from the federal government.
- This amount includes a one-time payment of $1.9 billion in funding through the federal Budget Implementation Act, 2021, and amendments to the Federal –Provincial Fiscal Arrangements Act to support COVID‑19 recovery.
- Additionally, as part of the time-limited Workforce Development Agreement top-up, Ontario received an additional $388 million.
- Through the Safe Long-term Care Fund, Ontario also received a one-time payment of $380 million to support its comprehensive efforts to enhance infection prevention and control in long-term care homes.
- This federal revenue also includes various supports for virtual health care , the justice sector, recognition of the value of personal protective equipment (PPE), and the COVID‑19 rapid antigen tests received in-kind from the federal government, as well as other supports.
Statement of financial position analysis
Financial assets
Financial Assets ($ Billions) - table 5
| Item | 2021–22 Actual | % of Total | 2020–21 Actual | % of Total | Variance Increase (Decrease) |
|---|---|---|---|---|---|
| Cash and cash equivalents | 34.2 | 26.3% | 33.5 | 28.5% | 0.7 |
| Investments | 26.5 | 20.4% | 28.9 | 24.6% | (2.4) |
| Accounts receivable | 26.9 | 20.7% | 15.3 | 13.0% | 11.6 |
| Loans receivable | 11.9 | 9.2% | 12.1 | 10.3% | (0.2) |
| Other assets | 1.4 | 1.1% | 1.2 | 1.0% | 0.2 |
| Investment in Government Business Enterprises | 28.8 | 22.2% | 26.6 | 22.6% | 2.2 |
| Total Financial Assets | 129.8 | 100.0% | 117.5 | 100.0% | 12.3 |
Note: Numbers may not add due to rounding.
Financial assets consist of items that include cash and cash equivalents and investments that are available to the government to meet its expenditure needs; accounts and loans receivable, which are amounts it expects to receive from third parties; and other items including investment in GBEs.
Ontario’s financial assets increased by $12. 3 billion in 2021–22 over the prior fiscal year. The increase was attributable to (see Table 5):
- Cash and cash equivalents were $0. 7 billion higher mainly due to investment maturity payment management;
- Investments were $2. 4 billion lower, mainly as a result of maturity payment management of provincially held bonds. Investments held by the broader public sector (BPS) have increased slightly. Examples of investments include investments in government bonds and fixed‑income securities, such as Guaranteed Investment Certificates and Government of Canada Bonds;
- Accounts receivable were $11.6 billion higher mainly due to an increase in taxes receivable and transfer payments from Government of Canada; and
- Investment in GBEs were $2.2 billion higher, mainly due to higher net assets in GBEs, including investment earnings from the Ontario Nuclear Funds for nuclear waste management and decommissioning.
Chart 7 shows the recent trends in financial assets for the government.
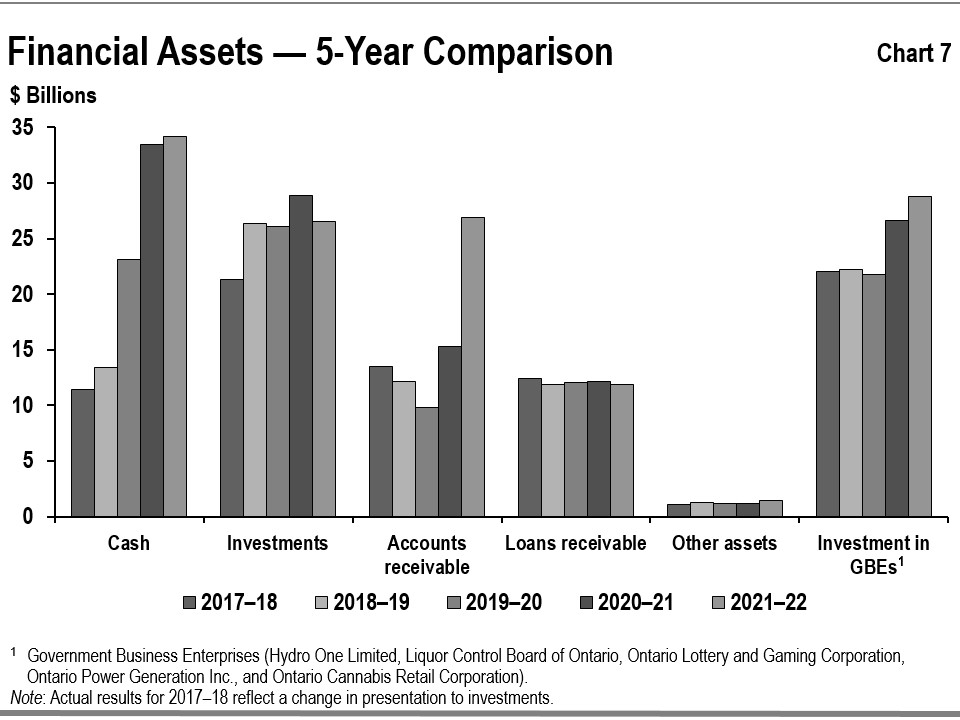
After a large increase in total net investments in GBEs in 2020–21, total investment in GBEs showed a smaller increase in 2021–22. The net increase was mainly due to the net assets increase in GBEs, including investment earnings from the Ontario Nuclear Funds for nuclear waste management and decommissioning.
The level of other financial assets, including cash, accounts receivable and investments, tends to be more variable since these assets often reflect specific circumstances at the fiscal year‑end such as pre‑borrowing for the following period’s needs.
Tangible capital assets
The government is responsible for a large portfolio of non-financial assets which is almost entirely made up of tangible capital assets.
Tangible capital assets owned by the government and its consolidated entities represent the largest component of Ontario’s infrastructure investments. These assets include those it owns directly, such as provincial highways, as well as the assets of hospitals, school boards, colleges and agencies that are consolidated in its financial statements. The assets of GBEs are reflected in Ontario’s statement of financial position as an investment in GBEs under financial assets.
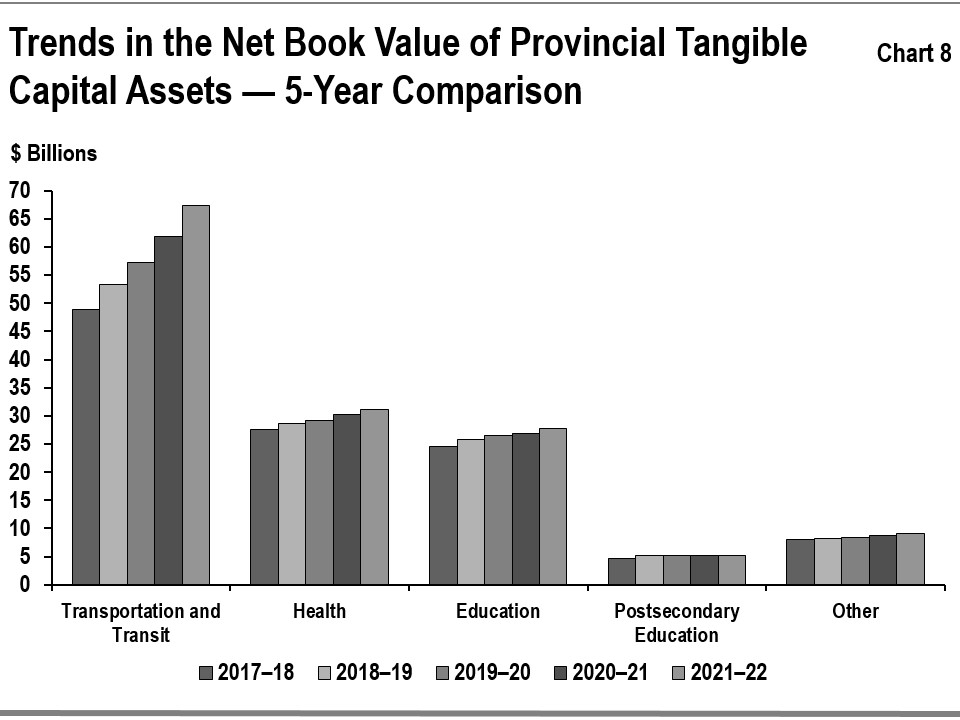
The reported net book value of Ontario’s tangible capital assets was $140.5 billion in 2021–22, increasing by $7.7 billion, or 5.8 per cent over the prior fiscal year. Buildings, including hospitals, schools and college facilities, make up the single largest share at $64.7 billion in aggregate. The total on the balance sheet also includes assets under construction, some of which are being built using the public private partnership (P3) model, in which the private sector finances the assets during construction. The impacts of P3s on balance sheet liabilities are discussed in the Other Long ‑Term Financing section.
Growth in the net book value of capital assets has averaged 5.4 per cent annually over the period between 2017–18 and 2021–22. Most of the growth has been in new and rehabilitated buildings and transportation infrastructure including provincial highways, bridges and the transit network owned by Metrolinx, an agency of the government.
See Chart 8 for the recent trends in the net book value of provincial tangible capital assets by sector.
Infrastructure expenditures
Ontario’s infrastructure spending in 2021–22 was $17.7 billion (see Table 6). This included $14.7 billion invested in assets owned by the government and its consolidated entities as discussed in the Tangible Capital Assets section, and $3.0 billion provided for capital investment to non‑consolidated partners such as universities and municipalities as well as other infrastructure expenditures.
Total infrastructure spending in 2021-22 was $2.3 billion higher than the previous year, with increased expenditures across all sectors. This includes increased investments for public transit, schools, health care and correctional facilities, as well as doubling the annual investment in the Ontario Community Infrastructure Fund.
The total was lower than the $18.6 billion set out in the 2021 Budget, primarily driven by decreases due to capital project delays and revised implementation timelines in the education, postsecondary education, justice and other sectors. These decreases are partially offset by an increase in the transportation sector due to accelerated progress on construction of major public transit projects, and higher -than -planned spending in the health sector, including increased hospital infrastructure expenditures during the COVID‑19 pandemic.
Infrastructure expenditures, 2021–22 ($ Billions) - table 6
| Sector | Investment in Capital Assets | Transfers and Other Infrastructure Expenditures | Total Infrastructure Expenditures |
|---|---|---|---|
| Transportation and transit | 7.9 | 1.0 | 8.9 |
| Health | 3.0 | 0.2 | 3.2 |
| Education | 2.4 | 0.0 | 2.4 |
| Postsecondary education | 0.5 | 0.1 | 0.6 |
| Other sectors | 0.9 | 1.6 | 2.6 |
| Totals | 14.7 | 3.0 | 17.7 |
Note: Numbers may not add due to rounding.
Liabilities
Ontario’s liabilities consist of debt and other financial obligations including accounts payable, unspent funds it received from the federal government and the estimated cost of future payments, including pensions and other employee future benefits liability. See Table 7.
Liabilities ($ Billions) - table 7
| Item | 2021–22 Actual | % of Total | 2020–21 Actual | % of Total | Variance Increase (Decrease) |
|---|---|---|---|---|---|
| Accounts payable and accrued liabilities | 30.0 | 5.9% | 36.8 | 7.5% | (6.8) |
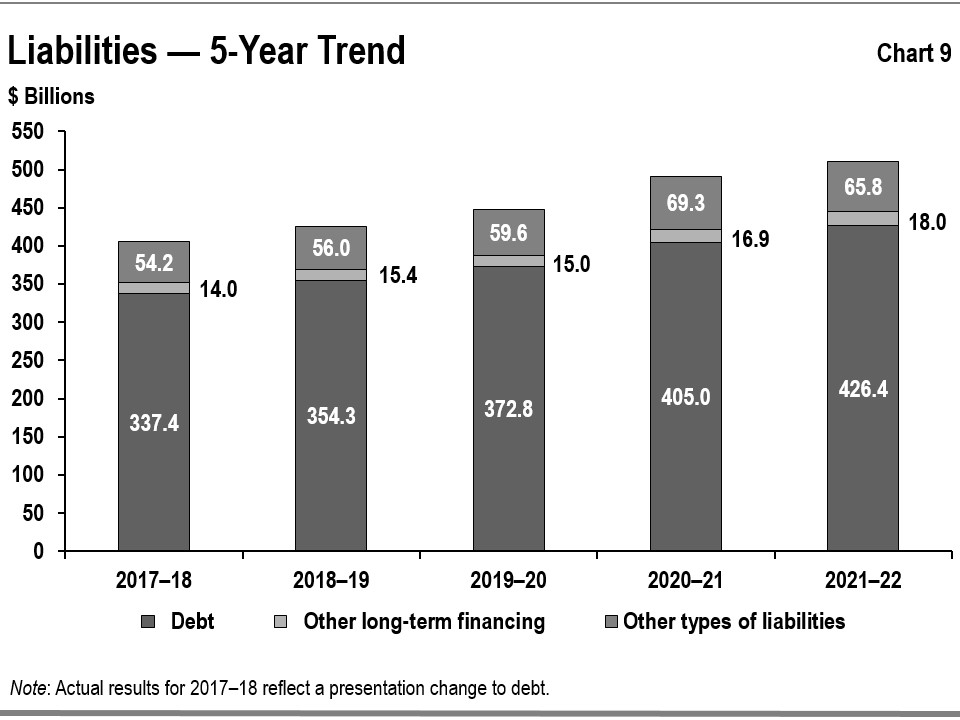
| Debt | 426.4 | 83.6% | 405.0 | 82.5% | 21.4 |
| Other long-term financing | 18.0 | 3.5% | 16.9 | 3.4% | 1.1 |
| Deferred revenue and capital contributions | 16.5 | 3.2% | 14.2 | 2.9% | 2.3 |
| Pensions and other employee future benefits liability | 14.4 | 2.8% | 13.1 | 2.7% | 1.3 |
| Other liabilities | 4.9 | 1.0% | 5.2 | 1.1% | (0.3) |
| Total Liabilities | 510.2 | 100.0% | 491.1 | 100.0% | 19.1 |
Note: Numbers may not add due to rounding.
Debt
Debt makes up the largest share of liabilities. From 2020–21 to 2021–22, debt increased by $21.4 billion to $426.4 billion at fiscal year-end, primarily to finance Ontario’s investments in infrastructure as well as operating cash requirements.
Table 8 summarizes how the government used its net new financing in 2021–22.
Use of new financing by the Province, 2021–22 ($ Billions) - table 8
| Item | Amount |
|---|---|
| Operating surplus and other transactions | 9.8 |
| Investment in capital assets owned by the government and its consolidated organizations, including hospitals, school boards and colleges | 12.5 |
| Decrease in the government’s cash and investments funded by cash holdings | (1.6) |
| Subtotal | 20.7 |
| Decrease in other long-term financing, Tangible Capital Assets financed by Public-Private Partnership (P3) | 0.7 |
| Net new financing | 21.4 |
Note: Numbers may not add due to rounding.
The government completed an annual borrowing program of $41.1 billion in 2021–22, compared to the $59.8 billion borrowed in 2020–21.
Other long-term financing
This category includes obligations to finance construction of public assets including those procured through the P3 model and total debt of the Broader Public Sector. All assets that are owned by the Ontario government and its consolidated entities, and the associated financing liabilities, are reflected on Ontario’s balance sheet during construction and as the liabilities are incurred. For information on asset investments, see the Tangible Capital Assets section.
Other types of liabilities
Other types of liabilities include accounts payable, pensions and other employee future benefits, unspent transfers received from the federal government representing deferred revenues and other liabilities.
Chart 9 shows the recent trends in liabilities for Ontario. This trend over the period between 2017–18 and 2021–22 shows public debt rising, mainly to fund capital investments and the annual deficits. Other types of liabilities, including accounts payable and deferred revenue, tend to be more variable since they often reflect specific circumstances at the fiscal year-end such as accrued liabilities for goods and services.
Risks and risk management
Ontario’s financial results and financial reporting are subject to various risks and uncertainties over which the government may have limited or no control.
The ongoing monitoring of revenues allows government to assess potential risks to its finances. Ontario’s revenues rely heavily on the level and pace of economic activity in the province. Ontario manages risks to the revenue forecast by consulting with private-sector economists to inform the government’s planning assumptions. For prudent fiscal planning, the Ontario Ministry of Finance’s real GDP growth projections are typically set slightly below the average private-sector forecast.
There are also risks arising from other sources of revenue, such as federal transfers and income from GBEs. Since these represent a smaller share of total revenue compared to larger revenue sources such as tax revenue — the risks they present are relatively less material to the fiscal plan. In addition, these risks are difficult to predict and quantify; for example, the federal transfers are subject to federal policy changes while GBEs’ net incomes are subject to regulatory decisions and market conditions. Note 1 to the Consolidated Financial Statements provides additional details on measurement of uncertainty.
Collaboration with the Canada Revenue Agency, which administers approximately 77 per cent of Ontario’s taxation revenues, is essential to achieving this. As well, Ontario is currently exploring ways to enhance corporate income tax revenue forecasting and monitoring.
The COVID‑19 pandemic has been challenging for all governments worldwide, including Ontario, affecting the province’s health, economy and social structures, necessitating the government’s quick response in the face of this global threat. During the fiscal year 2021–22, COVID‑19 continued to pose significant risks and called for a targeted response and proactive mitigation in order to protect the people of Ontario and the economy.
The response included additional expenditures and investments to protect citizens and enable continuity of services that the people of Ontario rely on, from health care to justice systems, education, social services and more, with responsive policy and program changes resulting in shifts to fiscal planning and forecasts. When COVID‑19 vaccines became available, the government mobilized substantial financial and human resources to support an unprecedented vaccination campaign. At the same time, the government remained focused to continue modernizing services and offsetting economic impacts suffered by Ontario’s businesses.
The government utilized an array of tools including contingency funds to address risks that materialized. In the 2021 Budget, the government committed a total of $2.1 billion ($1.9 billion for operating and $0.2 billion for capital) for the standard contingency fund. After release of the 2021 Budget, an additional top-up of $0.3 billion to the standard contingency fund was made to support the implementation of initiatives announced as part of the 2021 Ontario Economic Outlook and Fiscal Review. Funds from the standard contingency fund were used to support initiatives such as:
- Investments to support wage enhancement for personal support workers to retain the workforce needed to build a stronger and more resilient health care system that is better prepared to respond to a crisis;
- Investments to train up to 8,200 new personal support workers for high-demand jobs in Ontario's health and long-term care sectors to address the shortage in the personal support workforce;
- Critical municipal infrastructure through the Ontario Community Infrastructure Fund;
- Additional support made available for property tax and energy cost relief to eligible businesses that were required to close or significantly restrict services due to provincial public health measures;
- Additional funding for Emergency Forest Fire Fighting to respond to a severe fire season;
- Additional funding to Emergency Management Ontario to manage emergency declarations for municipalities and First Nations;
- The Ontario COVID‑19 Worker Income Protection Benefit to reimburse eligible employers for infectious disease emergency leave paid to employees; and
- Additional funding to support hospitals during the COVID‑19 pandemic, including expenses such as personal protective equipment, additional staff , infection prevention and control measures, as well as funding to support the rollout of COVID‑19 vaccines .
As part of the Ontario government’s effort to combat COVID‑19 and support the recovery of the province, the government also maintained dedicated pandemic-related contingency funds in
2021–22, which were fully allocated throughout the year. In the 2021 Budget, the Support for People and Jobs Fund ($1 billion) and the Pandemic Fund ($4 billion) were fully allocated. In the 2021 –22 First Quarter Finances the government allocated an additional $2.2 billion to the Time-Limited COVID‑19 Fund, which was further increased by $500 million as part of the 2021 Ontario Economic Outlook and Fiscal Review, bringing the total to $2.7 billion.
In 2021–22, funds from the Support for People and Jobs Fund were used to support initiatives such as:
- Ontario’s Tourism Recovery Program was implemented to help tourism operators, anchor businesses and attractions to recover from the impacts of COVID‑19. This initiative provided support for historically successful businesses that have helped to drive employment and visitation in their regions by assisting with costs related to restructuring, safe reopening, recalibrated marketing activities and partnership development .
Social services relief funding for municipal service managers and Indigenous program partners to help address the impacts of COVID‑19 on vulnerable people, including those experiencing and at ‑risk of homelessness . In 2021–22, funds from the Pandemic Fund were used to support initiatives such as:
- Ontario’s Testing Strategy to help contain the COVID‑19 virus, protect lives and allow economic activity to continue in the safest way possible;
- Funding to support the continued COVID‑19 response and recovery in long‐term care homes, including prevention and containment measures, as well as to support the health and safety of residents and staff;
- Funding to support the administration, distribution and rollout of Ontario’s COVID‑19 vaccination campaign; and
- Funding to support hospitals in the response to COVID‑19.
In 2021–22, funds from the Time-Limited COVID‑19 Fund were used for initiatives such as:
- Supporting municipal transit systems as they recover from the COVID‑19 pandemic;
- Additional funding to support hospitals during the COVID‑19 pandemic, including expenses such as personal protective equipment, additional staff, infection prevention and control measures , as well as the rollout of COVID‑19 vaccines;
- Investments to help long-term care homes prevent and contain the spread of COVID‑19, including increased staffing supports and purchasing additional personal protective equipment and supplies;
- The Ontario Business Costs Rebate Program to provide property tax and energy cost rebates to eligible businesses that were required to close or reduce indoor capacity as part of the additional public health measures in response to the COVID‑19 Omicron variant;
- Applying off-peak Time-Of-Use electricity pricing for residential, small business and farm customers for all hours of the day, 7 days per week for a 21-day period, while Ontario was in modified Step 2 of the Roadmap to Reopen;
- The Ontario COVID‑19 Small Business Relief Grant to support small businesses that were subject to closures as part of the additional public health measures in January 2022; and
- Additional investments to support the COVID‑19 Vaccine Distribution Secretariat, safe operations of correctional facilities during the pandemic, and frontline Ontario Provincial Police and correctional officers.
As required under the Fiscal Sustainability, Transparency and Accountability Act, 2019, a reserve is included in the projected surplus/deficit each year to guard against unforeseen revenue and expense changes that could have a negative impact on the government’s fiscal performance. The 2021 Budget Plan included a $1.0 billion reserve for 2021–22. Excluding this reserve, the projected deficit for 2021–22 in the 2021 Budget was $32.1 billion.
Provisions for losses that are likely to occur as a result of contingent liabilities, such as ongoing litigation and land claims, and that can be reasonably estimated are expensed and reported as liabilities. Note 1 to the Consolidated Financial Statements provides further details.
Note 3 to the Consolidated Financial Statements explains the government’s risk management strategies which are intended to ensure that exposure to borrowing-related risk is managed in a prudent and cost-effective manner.
Changes in Canadian generally accepted accounting principles (GAAP) for the public sector issued by the Public Sector Accounting Board (PSAB) can have an impact on Ontario’s budgets, estimates and actual results. While changes in Canadian GAAP had no material impacts in the current fiscal year, the Office of the Comptroller General, Treasury Board Secretariat actively monitors proposed changes and provides input to standard setters to support the development of standards that support sound public policy decision-making, transparency and accountability in reporting.
Key financial ratios
In this section of the Annual Report, the use of key measures of financial position will be used to assess Ontario’s financial position. The levels and trends of these measures indicate the impacts of economic and other events on the Ontario government’s finances. The ratio and the level of each over the past five fiscal years are outlined in Table 9.
Key financial ratios - table 9
For the fiscal year ended March 31
| Item | 2017–18 | 2018–19 | 2019–20 | 2020–21 | 2021–22 |
|---|---|---|---|---|---|
| Sustainability — Net Debt- to-GDP (%) | 39.3% | 39.4% | 39.6% | 43.1% | 39.2% |
| Sustainability — Net Debt to Total Revenue (%) | 215.0% | 220.2% | 226.4% | 226.5% | 205.6% |
| Sustainability — Net Debt per Capita ($) | $23,016 | $23,657 | $24,293 | $25,334 | $25,658 |
| Flexibility — Interest on Debt to Total Revenue (%) | 7.9% | 8.1% | 8.0% | 7.4% | 6.8% |
| Flexibility — Own-Source Revenue to GDP (%) | 15.2% | 15.0% | 14.6% | 15.1% | 15.9% |
| Vulnerability — Federal Transfers to Total Revenue (%) | 16.5% | 16.3% | 16.3% | 20.6% | 16.5% |
| Vulnerability — Foreign Currency Debt to Revised Total Debt (%) | 17.9% | 17.1% | 16.1% | 15.8% | 16.1% |
| Vulnerability — Unhedged Foreign Currency Debt (%) | 0.2% | 0.2% | 0.2% | 0.1% | 0.1% |
Notes:
1) Net debt was restated to reflect prepaid expenses and inventory supplies being reclassified as non-financial assets, as opposed to financial assets in prior years.
2) Beginning in 2019–20, Ontario is presenting public debt less of any investments in its own bonds and treasury bills.
3) The forecasts of net debt and related ratios in the annual Budget are based on a calculation that includes the reserve.
Sources: Nominal GDP is based on Ontario Economic Accounts, First Quarter 2022, released by the Ontario Ministry of Finance. Population estimates are from Statistics Canada.
Measures of sustainability
Net debt provides a measure of the future government revenues that will be required to pay for the government’s past transactions. Net debt as a percentage of Ontario’s GDP shows the financial demands on the economy resulting from the government’s spending and taxation policies. A lower ratio of net debt-to- GDP generally indicates higher sustainability.
The government’s net debt-to- GDP ratio was 39. 2 per cent at the end of fiscal year 2021–22, lower than the 48.8 per cent forecast in the 2021 Budget. As shown in Table 9, this ratio has decreased by 3. 9 percentage points over the prior year largely due to the rate of increase in Ontario’s GDP outstripping the rate of increase in the net debt. The ratio of net debt to total revenue is another key measure of sustainability, since net debt reflects the future revenue that is required to pay for past transactions and events. A lower net debt-to-revenue ratio generally indicates higher sustainability. This ratio has decreased by 20. 9 percentage points from the prior year to 205.6 per cent in 2021–22, primarily due to revenues rising faster than net debt.
Measures of flexibility
The ratio of Interest on Debt to Total Revenue shows the share of provincial revenue that is being used to pay interest expense on debt and therefore is not available for programs. A lower ratio generally indicates that a government has more flexibility to direct its revenues to programs. The ratio has fallen for Ontario over the past five years, from a high of 8.1 per cent in 2018 –19 to the current level of 6.8 per cent. Despite upward movements in interest rates from the previous year, the government’s strategy of extending the duration terms of its borrowing program and locking in interest rates that continued to be historically low, for a longer period, has also contributed to lower interest costs. This strategy has extended the weighted-average term to maturity of provincially issued debt from approximately eight years in 2009 –10 to over 14 years in 2021–22.
Own-source revenue as a share of Ontario’s GDP shows the extent to which the government is leveraging funds from the provincial economy collected through taxation, user fees and other revenue sources it controls. A high taxation burden may make a jurisdiction less competitive, therefore increases in this ratio may reduce future revenue flexibility. During 2020 –21 and 2021–22, financial support from all levels of government were provided to people and businesses in response to COVID‑19 , which contributed to growth in Personal and Corporate Income Tax revenues. As this support did not directly increase GDP, it led to an increase in the ratio.
Measures of vulnerability
Transfers from the federal government as a percentage of total revenue is an indicator of the degree to which Ontario relies on the federal government for revenue. A higher ratio may imply that a provincial government is more reliant on federal transfers. Provinces may have limited control over the value of these transfers, and changes in federal policies can result in shifts in federal revenues to provinces.
Ontario’s share of revenue from federal transfers (including direct transfers to the BPS) is 16.5 per cent in 2021 -22, the same level as 2017–18.
Foreign currency debt to total debt is a measure of vulnerability to changes in foreign currency exchange rates. Accessing borrowing opportunities in foreign currencies allows Ontario to diversify its investor and funding base. It also ensures that the government will continue to have adequate access to capital in the event that domestic market conditions become more challenging. Ontario manages foreign currency risk by hedging its exposure to foreign currencies through the use of financial instruments. Effective hedging has allowed the government to consistently limit its exposure to foreign currency fluctuations to 0.2 per cent of debt issued for provincial purposes in 2017–18, declining to 0.1 per cent in 2020–21 and remaining unchanged in 2021–22.
Fiscal management
Efficient and effective use of taxpayer dollars
To support long-term economic growth and sustainable public finances, the Ontario government must evolve and continue to modernize its programs and services. The ongoing Program Review process ensures that programs are continuously assessed for opportunities to modernize, improve outcomes, and become fiscally sustainable and efficient. Since its launch in 2019–20, the Program Review process has resulted in new and improved programs through service modernization, increased efficiencies and oversight, revised policies and reduced red tape.
Non-financial activities
This section discusses key non-financial results of major sectors. The purpose is to provide highlights of Ontario government spending and the related activities in these sectors.
Health care
The government acts as a steward of the health care sector, providing overall direction and leadership for the system, including planning and resource management. The Ontario government also manages key provincial programs including hospitals, long-term care homes, home and community care, the Ontario Health Insurance Plan (OHIP), the assistive devices program, drug programs, emergency services, independent health facilities, as well as laboratory services.
Throughout 2021–22, the primary focus has continued to be on protecting the health and well-being of the people of Ontario during the COVID‑19 pandemic. The government took decisive actions to respond to the COVID‑19 Delta and Omicron variants, implementing a robust and responsive testing strategy and developing a comprehensive plan to gradually re-open the province.
Supported by the advice of the Chief Medical Officer of Health and other public health experts, Ontario has made significant strides in its efforts to fight COVID‑19 by continuing to implement a comprehensive and responsive vaccine distribution plan, which enabled Ontario to achieve one of the highest vaccination rates in the world. By the end of 2021–22, more than 90 per cent of people on Ontario aged 12 and over had received at least two doses of the vaccine.
The government made the following commitments in response to the COVID‑19 outbreak:
- Expanding the COVID‑19 vaccine rollout to include children and youth aged 5 and older , as well as to administer booster doses to eligible people in Ontario. By March 31, 2022, over 32 million COVID‑19 vaccines had been administered across the province;
- Making it mandatory for hospitals, long-term care homes, paramedics and home and community care service providers to have COVID‑19 immunization policies for all staff, support workers, contractors, students and volunteers. As well, requiring mandatory vaccinations for those working and volunteering in all long-term care homes;
- Ensuring the availability of the COVID‑19 rapid antigen test supply for Ontario’s most vulnerable populations living and working in the highest risk settings, including hospitals, long-term care homes, First Nation, Inuit and Métis communities, as well as public health units to ensure continued access to testing through the COVID‑19 Omicron wave ;
- Providing support to Ontario’s hospitals and the community health sector to perform more surgeries, MRI and CT scans, and procedures, including on evenings and weekends, as part of a wider, comprehensive surgical recovery plan to provide patients with the care they need ; and
- Expanding in-patient surge beds and day treatment spaces at four pediatric hospitals for children and youth with eating disorders, given the sharp rise in incidence since the COVID‑19 pandemic began.
The government also continued to move forward with building a connected and integrated health system, addressing hallway health care, improving the patient and caregiver experience, improving the well-being of residents in long-term care, and supporting health care providers.
Other results reported in 2021–22 include:
- Proclaiming landmark legislation through the Fixing Long-Term Care Act, 2021, which includes new measures to support the three pillars of the government’s plan to fix long-term care: improving staffing and care; driving quality through better accountability, enforcement, and transparency; and building modern, safe, comfortable long-term care homes for Ontario’s seniors.
- This legislation establishes a system level target of an average of four hours of daily direct care per resident provided by registered nurses, registered practical nurses and personal support workers, by March 31, 2025.
- Supporting the recruitment and retention of the health care workforce, including:
- A temporary wage enhancement for personal support workers (PSWs), which became permanent in 2022–23;
- A temporary retention incentive bonus for nurses;
- Prioritizing the recruitment of the Nursing Graduate Guarantee program positions in acute care settings, resulting in hiring more than 1,000 nurses throughout the year; and
- Training over 16,000 new PSWs through the Accelerated PSW Training Program for the long-term care sector.
- Expanding hospital capacity with dedicated funding to create more than 3,000 additional hospitals beds, as well as operational funding to ensure all publicly funded hospitals received a minimum one-per cent increase to keep pace with patient needs and increase access to high-quality care for patients and families.
- Continued progress to build 30,000 net new long-term care beds and redevelop older beds by 2028. As of June 2022, Ontario has 31,705 new and 28,648 upgraded beds in the development pipeline, including 5,231 beds under construction and 1,774 beds opened.
- Strengthened the inspections program in the long-term care sector by taking steps to double the number of inspectors by fall 2022 and launched a new proactive inspections program to improve the quality of care provided to residents.
- Announced nine new Ontario Health Teams, for a total of 51, which will care for 95 per cent of the province’s population at maturity.
Education
Ontario’s publicly funded early years and education system is focused on preparing Ontario’s children and students for success, ensuring that young people develop in-demand skills that can be applied to the labour market for good, high -paying jobs.
Results reported by the Ministry of Education in 2021–22 include:
- Updating the COVID‑19 health and safety guidance for schools and child care centres that prioritized the health and safety of children, students and staff, and provided school boards and child care operators with resources and flexibility while accommodating regional differences in trends of public health indicators.
- Providing school boards and child care operators with targeted COVID‑19 health and safety investments including for PPE, staffing, school-focused nurses in local public health units, testing capacity, health and safety training and supports for students’ mental health and students with special education needs.
- Improving child care. As of April 1, 2021, there were 464,538 licensed child care spaces for children 0-12 years of age, a 0.4 per cent increase over the previous year.
- Continuing to modernize curriculum to ensure students have foundational and transferrable skills that prepare them for work and life. This includes:
- New Grade 9 de-streamed mathematics and science courses, and a revised elementary science and technology curriculum ;
- Announcing a plan to expand First Nations, Métis and Inuit content and learning in the Grades 1 -3 social studies curriculum to further strengthen mandatory learning on residential schools, and to foster greater understanding within the province’s education system of the intergenerational legacy borne by Indigenous families ;
- Expanding access to high-quality online learning courses for secondary school students through partnerships with school boards, TVO and TFO. Also, launching an online learning preview site, allowing students to make informed decisions about their course selections for the 2022–23 school year ; and
- Continuing to expand job skills programs; including expansion in the 13 Specialist High Skills Major sectors identified as having the strongest focus on technological education and the skilled trades.
Postsecondary education
Ontario’s postsecondary system prepares students and job seekers with the high-quality education, skills and opportunities needed to get good jobs, providing Ontario’s employers with the skilled workforce and talent they need to thrive and prosper.
The Ministry of Colleges and Universities provides operating funding to publicly assisted colleges, universities and Indigenous Institutes, manages capital funding programs in the postsecondary sector and funds world-class research in Ontario universities, colleges and academic hospitals fueling the province’s economic growth.
Results reported in 2021–22 include:
- Providing financial assistance through the Ontario Student Assistance Program (OSAP) to over 420,000 students in the 2021–22 fiscal year ;
- A 73 per cent postsecondary education attainment rate in 2021–22, which is a two percentage points increase from 71 per cent in 2020–21;
- Through the Virtual Learning Strategy, in partnership with eCampusOntario, supporting over 400 projects to create digital content, develop online learning and teaching skills, and pilot educational technologies to support online course and program offerings; and
- Launching Intellectual Property Ontario, a new board-governed agency that will serve as a resource for intellectual property (IP) expertise to help researchers and companies maximize the value of their IP, strengthen their capacity to grow and compete in the global market.
Children’s and social services
The Ministry of Children, Community and Social Services funds and delivers programs and services that promote thriving and inclusive communities, help the people of Ontario build independence and improve their quality of life.
Results reported in 2021–22 include:
- Launching new Ontario Autism Program services, including caregiver mediated early years programs providing access to early years services to over 2,800 eligible families;
- Funding 27 new anti-human trafficking projects that will protect and prevent at-risk individuals from being exploited;
- Establishing Children at Risk of Exploitation Units in Durham Region and in the City of Toronto — a first for Ontario — and two licensed sites for specialized out-of-home care for children and youth who have been sex trafficked;
- Reducing the spread of COVID‑19 in congregate care settings through investments and protection measures to reduce transmission and prevent service disruption;
- Introducing an online option for families applying to the Special Services at Home and the Assistance for Children with Severe Disabilities programs — a more convenient application process for up to 11,000 families per year;
- Expanding the Centralized Intake pilot for Ontario Works to 15 additional municipalities, including Toronto. This now supports 35 municipalities and 104 local Ontario Works offices, with time saved on more than 100,000 applications received and processed to date;
- Funding $46 million in healing, health and wellness programs designed and delivered by and for Indigenous peoples in First Nations and in urban and rural communities;
- Investing $60 million to increase access to rehabilitation services for children and youth with special needs — helping to serve up to 10,000 more preschool-aged children with speech and language needs, and up to 47,000 more children and youth with rehabilitation needs annually; and
- Investing approximately $190 million in community-based agencies across Ontario to provide services and supports to women and dependents who have experienced violence or are at risk of experiencing violence, including gender-based domestic violence.
Justice
The justice sector supports the administration and delivery of justice services, including the administration of courts, prosecution of offences, provision of legal services and supports to victims and vulnerable persons, as well as administering the public safety, policing and correctional systems to ensure that Ontario’s diverse communities are supported and protected.
Results reported in 2021–22 include:
- Responding to the COVID‑19 pandemic with innovative digital solutions in the criminal justice system, including moving services online and expanding remote hearing technology. As well, implementing the Virtual Courts and Criminal Justice Video Strategies, Criminal Justice Digital Design, and GPS electronic monitoring for bail strategies.
- Working to ensure safety in courtrooms by upgrading courtroom equipment to support virtual and hybrid hearings ; installing plexiglass barriers and hand sanitizer stations and providing personal protective equipment; as well as developing and implementing an online jury pre ‑screening and check-in tool for prospective jurors to complete before their summons date. Since its launch, the tool has screened over 140,000 potential jurors.
- Expanding digital filing to an additional 36 courthouses and dozens of other police and justice sector partners, in order that police could file criminal charges electronically, helping to speed up the criminal justice process.
- Implementing a new Criminal Case Backlog Recovery Strategy that supports the hiring of additional Crown prosecutors and new staff to prioritize public safety, safeguard an individual’s constitutional right to a trial within a reasonable timeframe, and ensure offenders are held accountable for their crimes.
- Partnering with Ministry of Health and Metrolinx to implement GO-VAXX, a new, convenient mobile option for people to receive their COVID‑19 vaccine, including hotspot communities as well as in malls, festivals, community hubs and events. As of March 31, 2022, more than 52,300 people had received vaccination via GO-VAXX.
- Recognizing the need to support police with leading-edge equipment and technology to meet the complex demands of modern police operations. This includes providing the tools they need to do their jobs, improve public safety and strengthen roadside law enforcement efforts across Ontario, such as investing in the Automated Licence Plate Recognition technology to mitigate the elimination of licence plate stickers by allowing the capability of capturing vehicles of interest such as amber alerts, drivers with a suspended licence and stolen vehicles.
- Investing in the build of a new, modern 345-bed multi-purpose correctional centre complex in Thunder Bay to support safe community reintegration and address overcrowding in correctional facilities. The investment builds on Ontario’s strategy to invest more than $500 million over five years to transform correctional services.
- Constructing new structures at both the Thunder Bay Correctional Centre and the Kenora Jail allowed for increased access to literacy, skills development and technology programs that support safe community reintegration. This investment also helped address overcrowding in Kenora and Thunder Bay during construction of the new Thunder Bay Correctional Complex.
- Coordinating the evacuation of approximately 3,700 First Nation community members during a challenging forest fire season , as well as piloted new hosting models in Sudbury, Peel Region and London.
- Investing in correctional and police frontline workers, and in new measures to prevent harmful items and substances such as drugs, alcohol, weapons and cell phones from entering Ontario’s adult correctional facilities. This included investments in more tools and technology to increase detection, enhance security measures, and improve the collection, analysis and sharing of data with justice sector partners to ensure the safety of staff and individuals in custody. As well, investing in the mental health services available to the Ontario Provincial Police (OPP) and their families. Police personnel are among the professionals who are most likely to be exposed to occupational stress situations while protecting communities.
Condition and capacity of provincial tangible capital assets
Infrastructure investments should be made using an evidence-based approach. This includes a focus on asset management to ensure the delivery of high-quality public services, while efficiently managing the costs.
- The Province compiled its first infrastructure asset inventory in 2016 as a key step in managing provincial assets more effectively. The infrastructure asset inventory is now updated annually and currently contains information such as the location, age, condition and value of over 15,000 tangible capital assets, including buildings and Ontario’s entire road and bridge network. This covers the majority of the infrastructure assets owned or consolidated (i.e., certain BPS organizations) by the Ontario government, as well as some other assets that are funded in part, but not owned or consolidated, by the government.
- The Province uses the infrastructure asset inventory to track, monitor and report on the physical condition of assets. For example, the infrastructure asset inventory contains indicators such as Facility Condition Indexes (FCIs), Bridge Condition Indexes (BCIs) and Pavement Condition Indexes (PCIs), which help to inform the state of infrastructure assets.
- Ontario has expanded its infrastructure asset data to include other relevant data and analysis such as the current and projected capacity and utilization of assets. This integrated data provides a base to support evidence-based infrastructure planning decisions which help ensure that infrastructure investments provide value for money and are made at the right time and the right place.
Transparency and accountability
Ontario continues to take steps that enhance government transparency and fiscal accountability in its financial reporting. Throughout the fiscal year, the government provides regular updates on Ontario’s finances. The Annual Report and Consolidated Financial Statements, along with supplementary information, are central to demonstrating the government’s transparency and accountability in reporting its financial activities and its position at the end of the fiscal year.
Recent developments in public sector accounting standards
The Ontario government’s financial reports are prepared in accordance with the accounting standards for governments set by the Public Sector Accounting Board (PSAB) and contained in the Chartered Professional Accountants of Canada (CPA Canada) Public Sector Accounting Handbook.
As described in Note 1 to the Consolidated Financial Statements, future changes in both public-sector and private-sector accounting standards may affect how assets, liabilities, revenues and expenses are reported in Ontario’s consolidated financial reports. Other current projects that are being closely monitored by Ontario include concepts underlying financial performance, employee benefits, government not-for-profit strategy and annual improvements projects.
The C.D. Howe Institute fiscal accountability report
Annually, the C.D. Howe Institute issues its commentary on fiscal reporting transparency of senior Canadian governments, with a focus on the relevance, accessibility, timeliness and reliability of these government financial reports, including the Public Accounts. Each government is assigned a letter grade based on the quality of the numbers presented in these reports, access and user friendliness, and the ability to use them for various decision-making purposes.
The last report was released in September 2021. In the report, for the second consecutive year, Ontario had maintained its grade.
At the time of the Auditor General opinion date for the 2021–22 Public Accounts, the 2022 Fiscal Accountability Report covering the Public Accounts of Ontario 2020–2021 had not been issued.
Chart Descriptions
Chart 1: 2021–22 Revenue by Source
This chart shows the percentage composition of Ontario’s Total Revenues in 2021–22 by source. Total revenue is $185.1 billion.
Personal Income Tax accounts for 25.3 per cent. Sales Tax accounts for 16.4 per cent. Federal Transfers account for 16.5 per cent. Other taxes account for 12.8 per cent. Corporations Tax accounts for 13.6 per cent. Fees, donations and other revenues from Broader Public Sector accounts for 5.2 per cent. Other non-tax revenue accounts for 3.6 per cent. Education Property Tax accounts for 3.1 per cent. Income from Government Business Enterprises accounts for 3.5 per cent.
Note: Percentages may not add to 100 per cent due to rounding.
Chart 2: Revenue by Source—5-Year Comparison
This bar graph shows recent trends in revenue for Ontario’s major revenue sources. The source categories include taxation, federal transfers, income from Government Business Enterprises, and other revenues for the period between 2017–18 to 2021–22.
Notes: Government Business Enterprises are: Hydro One Limited, Liquor Control Board of Ontario, Ontario Lottery and Gaming Corporation, Ontario Power Generation Inc. and Ontario Cannabis Retail Corporation. Provincial revenue from Hydro One Limited’s net income is proportional to the government’s ownership share.
Chart 3: 2021–22 Program Expense by Sector
This chart shows the percentage composition of Ontario’s program expenses in 2021–22 by sector. Program expense equals total expense minus interest on debt expense. Total program expense in 2021–22 was $170.5 billion.
The detail of the program expenses by sector is as follows: Health accounts for 44.4 per cent; Education accounts for 17.5 per cent; Other programs account for 18.8 per cent; Children’s and Social Services account for 10.0 per cent; Postsecondary Education accounts for 6.2 per cent; and Justice accounts for 3.0 per cent.
Notes: The Teachers’ Pension Plan expense is included in Other programs and align with the presentation in Table 3.8 of the 2021 Budget. Percentages may not add to 100 per cent due to rounding.
Chart 4: 2021–22 Spending by Type of Expense
This chart shows the percentage composition of Ontario’s total expenses in 2021–22 by type of expense. Total expense is $183.0 billion.
Transfers account for 40.4 per cent. Salaries and benefits account for 34.1 per cent. Operating costs account for 17.4 per cent. Debt charges account for 6.9 per cent. Other expenses account for 1.2 per cent.
Notes: Compensation related costs for non-consolidated entities (e.g., municipalities, universities) and payments to doctors for physician services are included in Transfers. Percentages may not add to 100 per cent due to rounding.
Chart 5: Expense by Sector—5-Year Comparison
This bar graph shows the trend in total spending for major program areas: Health, Education, Children’s and Social Services, Postsecondary Education, Justice, Other programs, and interest expense for the period between 2017–18 to 2021–22.
Notes: The Teachers’ Pension Plan is included in Other programs to align with the presentation in Table 3.9 of the 2021 Budget.
Chart 6: Interest on Debt to Total Revenue— 5-Year Trend
This graph shows that although for the most part, interest costs have grown in absolute terms, they have steadily fallen as a percentage of Ontario’s revenues since 2017–18. This is mainly due to prevailing low interest rates coupled with cost-effective debt management.
Chart 7: Financial Assets—5-Year Comparison
This bar graph shows the trend in Ontario’s financial assets by category: cash, investments, accounts receivable, loans receivable, other assets, and investment in Government Business Enterprises from 2017–18 to 2021–22.
Note: Government Business Enterprises include: Hydro One Limited, Liquor Control Board of Ontario, Ontario Lottery and Gaming Corporation, Ontario Power Generation Inc. and Ontario Cannabis Retail Corporation.
Actual results for 2017–18 reflect a change in presentation to investments.
Chart 8: Trends in the Net Book Value of Provincial Tangible Capital Assets—5-Year Comparison
This bar graph shows the trends in net book value of provincial tangible capital assets by sector: Transportation and Transit, Health, Education, Postsecondary Education and Other for the period between 2017–18 to 2021–22.
Chart 9: Liabilities—5-Year Trend
This bar graph shows the recent trends in total liabilities for Ontario by type: debt, other long-term financing, and other types of liabilities from 2017–18 to 2021–22.
Note: Actual results for 2017–18 reflect a presentation change to debt.
Footnotes
- footnote[1] Back to paragraph The Consolidated Financial Statements are reported using the 2021 Budget as the Budget comparator.
- footnote[2] Back to paragraph For presentation purposes, one-time COVID‑19-related spending was shown separately within COVID‑19 Time-Limited Funding in the 2021 Budget, which have been included in the respective sectors in this table. The change in presentation does not impact ministry allocations or ministry structure(s).
- footnote[3] Back to paragraph Ontario Teachers’ Pension Plan impact is included in Other programs to align with the presentation in Table 3.8 of the 2021 Budget. In the Consolidated Financial Statements, this item appears under the Education sector. Schedule 4 to the financial statements provides details.
- footnote[4] Back to paragraph Prior year comparatives have been reclassified to be reflected on the same basis as that used to report the actual current year expenses. See Note 17 to the Consolidated Financial Statements.
- footnote[5] Back to paragraph Includes adjustments for the net book value of assets disposed during the year, as well as changes in valuation.
- footnote[6] Back to paragraph Mainly transfers for capital purposes to municipalities and universities and expenditure for capital repairs.
- footnote[7] Back to paragraph Includes social and justice sectors, broadband infrastructure, government administration, natural resources, and the culture and tourism industries.
- footnote[8] Back to paragraph Includes third-party investments in consolidated entities such as hospitals, colleges and school boards.
- footnote[9] Back to paragraph Decrease in cash from a net decrease of $11.9 billion in changes to assets and liabilities net of the government’s operating surplus of $2.1 billion. See the Consolidated Statement of Cash Flow.
- footnote[10] Back to paragraph New Tangible Capital Asset (TCA) investments of $13.0 billion less proceeds of $0.5 billion from the sale of tangible capital assets.
- footnote[11] Back to paragraph Increase in cash due to investment retirements in excess of purchases of $2.3 billion and the build-up of cash reserve of $0.7 billion.
- footnote[12] Back to paragraph Including net decrease in financing of capital projects through Public Private Partnership (P3). See Note 4 to the Consolidated Financial Statements.