State of the Woodland Caribou Resource Report: Part 2
The State of the Woodland Caribou Resource Report provides an overview of initiatives undertaken towards the protection and recovery of caribou. Part 2 provides technical details and outlines key findings of the monitoring and assessment of caribou within Ontario’s Continuous Distribution (except the Lake Superior Coast Range); describes the distribution of caribou and summarizes the findings from the initial Integrated Range Assessments.
Cite as: Ministry of Natural Resources & Forestry (MNRF). 2014. State of the Woodland Caribou Resource Report. Species at Risk Branch, Thunder Bay, Ontario. + 156 pp.
Foreword
There are two ecotypes of woodland caribou in Ontario, which are referred to by their primary habitat: forest- dwelling woodland caribou and forest-tundra woodland caribou. The forest-dwelling boreal population of woodland caribou (Rangifer tarandus caribou) (referred to as “caribou” in this document), is listed as a threatened species under the Endangered Species Act, 2007 (ESA). As a threatened species, caribou receive both species and habitat protection. This means that harming caribou or damaging their habitat is prohibited.
The ESA requires that recovery strategies and government response statements are prepared within prescribed timelines for species listed as endangered or threatened. In 2008, the Recovery Strategy for the Woodland Caribou (Rangifer tarandus caribou) (Forest-dwelling, Boreal population) in Ontario (Ontario Woodland Caribou Recovery Team 2008) was finalized, providing scientific advice to the Minister of Natural Resources and Forestry on how to protect and recover caribou populations in Ontario. The government response statement to that recovery strategy was Ontario’s Woodland Caribou Conservation Plan (the CCP) (MNR 2009). The CCP outlines the government’s goal for the recovery of caribou. It identifies actions that the then Ministry of Natural Resources (MNR), now the Ministry of Natural Resources and Forestry (MNRF), intends to take to conserve and recover caribou in Ontario.
Ontario’s woodland caribou conservation goal
To maintain self-sustaining, genetically-connected local populations of woodland caribou (forest-dwelling boreal population) where they currently exist, improve security and connections among isolated mainland local populations, and facilitate the return of caribou to strategic areas near their current extent of occurrence.
The ESA requires a report of progress towards the protection and recovery of a species five years after publishing the government’s response statement. In addition, the CCP includes a policy commitment to developing a “State of the Woodland Caribou Resource Report” in 2014. This document meets both legislative and policy requirements.
Ontario’s Woodland Caribou Conservation Plan Progress Report (Progress Report) (MNR 2012) shares information on the accomplishments achieved in the three years since the release of the CCP. This document includes and builds on the achievements outlined in the Progress Report. While not a review or revision of the CCP, the State of the Woodland Caribou Resource Report reports on the actions the MNRF committed to in the CCP and provides a thorough overview of initiatives undertaken towards the protection and recovery of caribou. The report is divided into three parts:
Part One: Reports on MNRF’s more than 11 million dollar investment on progress made towards recovery actions and commitments in the CCP, including reporting on the status of policy, planning and resource management commitments.
Part Two: Provides technical details and communicates key findings of the monitoring and assessment of caribou within Ontario’s Continuous Distribution (except Lake Superior Coast Range); describes the distribution of caribou and summarizes the findings from the initial Integrated Range Assessments.
Part Three: Gives a technical summary of information on MNRF’s extensive Collaborative Provincial Caribou Research Program that discusses the findings of research commitments under the CCP.
Each part of the report can be read independently of the others but is still part of the State of the Woodland Caribou Resource Report. Additional supporting information can be found in the Appendices for each part.
Executive summary
This is the second part of the State of the Woodland Caribou Resource Report. It delivers on the commitment in Ontario’s Woodland Caribou Conservation Plan (CCP)(MNR 2009) to report on caribou distribution in Ontario by summarizing findings of monitoring and assessment of caribou within Ontario’s Continuous Distribution (not including the Lake Superior Coast Range).
Following the Integrated Range Assessment Protocol for Woodland Caribou Ranges in Ontario (the Protocol) (MNRF 2014c), MNRF has completed Integrated Range Assessments for 13 ranges in the Continuous Distribution, excluding Lake Superior Coast Range. Range condition has been determined based on when the Integrated Range Assessment took place. The Integrated Range Assessments are based on population and habitat states; population state includes population size, which was determined using minimum animal count and population trend, which was calculated using annual recruitment rates and adult female survival rates, and habitat state was determined by analyzing natural and anthropogenic (human-caused) disturbance as well as the amount and arrangement of habitat. These Integrated Range Assessments are documented in the Integrated Range Assessment Reports (MNRF 2014d-k). Caribou distribution was explored in a number of other ways as well, such as along the northern boundary of Continuous Distribution and included caribou use of space, the probability of occupancy in a given area, their current southern distribution, and genetic connectivity.
Northern boundary of continuous distribution
The southern boundary of the Northern Taiga Ecoregion (1E) (Crins et al. 2009) was used as the new northern boundary for the Continuous Distribution and the constituent ranges along that edge in the Range Delineation Report (MNRF 2014a). Recent research (Berglund et al. 2014) suggests that the southern boundary of the Northern Taiga Ecoregion (1E) is a reasonable, ecologically-based approximation of the northern range limit for the forest- dwelling ecotype.
Winter distribution observations
Two-stage winter distribution surveys were conducted in February and/or March across the ranges in the Continuous Distribution, supplying data for estimates of caribou occupancy, distribution, recruitment rates and population size and trend.
In the ranges in the Far North of Ontario, higher numbers of evidence of the presence of caribou, either observations of actual caribou or signs of caribou activity were noted within the Missisa Range, largely near the interface between the Ontario Shield and Hudson Bay Lowlands Ecozones (MNRF 2014g). Caribou were most evenly dispersed within the James Bay Range, whereas in the Spirit, Ozhiski and Kinloch Ranges, which have frequent and abundant wildfires, caribou were associated with areas of older forest and peatlands (MNRF 2014g).
In the more southern ranges, caribou were generally found in areas with a higher amount of older conifer forest or peatlands and generally not found in areas of young forest (MNRF 2014d-f, h-k). Higher numbers of evidence of the presence of caribou, either observations of actual caribou or signs of caribou activity were found in areas within the ranges that had the lower amounts of natural and anthropogenic disturbance (MNRF 2014d-f, h-k).
Population size
There is a wide variation in minimum animal count (MAC) among the ranges. Using the data from all winter distribution surveys between 2008 and 2012, the sum of the MAC across all ranges in Ontario is estimated to be 3,334 (MNRF 2014d-k). In most cases there are likely many more caribou than suggested by the MAC for each range. For example, the MAC for the Sydney Range is 55 caribou from the winter distribution survey; a subsequent recruitment survey the following year yielded a MAC of 74 caribou (MNRF 2014k). Nonetheless, a MAC of 3,334 represents the absolute minimum number of forest-dwelling caribou in Ontario.
Population trend
The average annual population trend (l) was found to be less than 0.99 for all ranges and is from 0.86 to 0.98 (Figure 2-6) (MNRF 2014d-k). Based on Environment Canada (2008, 2011), this supports an interpretation that caribou populations within Ontario may be in a short-term decline. Population trend and survival could not be calculated for the Swan or Ozhiski Ranges, due to small sample sizes. However, both ranges had recruitment rates lower than the assumed threshold required for a population to be considered stable or increasing (MNRF 2014g).
Disturbance assessment
Currently, cumulative disturbance varies from 6 percent (James Bay Range) to 62.7 percent (Sydney Range) across the Continuous Distribution (Table 2-1) (MNRF 2014d-k). Based on the relationship between disturbance and recruitment, the Berens, Pagwachuan and all ranges in the Far North of Ontario are likely to have stable or increasing population growth (MNRF 2014c; EC 2011). The Churchill, Brightsand, Nipigon and Kesagami ranges are considered “uncertain to have a stable or increasing population growth” (MNRF 2014e, f, i, h). The level of disturbance on the Sydney range is 62.7%; as a result, it is unlikely that the population growth on the Sydney range is stable or increasing based on the conditions at the time of the Integrated Range Assessment (MNRF 2014k).
Habitat assessment
There was less habitat (winter and/or refuge) available within the Sydney, Kesagami, Berens, and Pagwachuan Ranges than would be expected in natural conditions (MNRF 2014d, h, j-k). The Churchill Range was found to have an amount of winter and refuge habitat consistent with natural conditions (MNRF 2014f). The Brightsand and Nipigon Ranges were found to have an amount of refuge habitat above what is expected in natural conditions and an amount of winter habitat consistent with natural conditions (MNRFe, i).
There was more fragmentation of winter and/or refuge habitat within Berens, Sydney, Nipigon, Pagwachuan, Kesagami and Brightsand Ranges than would be expected in natural conditions (MNRF 2014d, e, h-k). The Churchill Range was found to have a suitable arrangement of both winter and refuge habitat (MNRF 2014f).
Integrated risk assessment
As described in the Protocol (MNRF 2014c), the term ‘risk’ refers to the projected likelihood that caribou occupying a range are self-sustaining. Generally, high risk indicates a low likelihood of a self-sustaining population and low risk indicates a high likelihood of a self-sustaining population.
A number of ranges were determined to be at high or intermediate risk. There is a high level of risk in the Sydney Range (MNRF 2014k), an intermediate level of risk in the Brightsand, Churchill, Kesagami, Nipigon, Pagwachuan, Kinloch, Missisa, Spirit and James Bay Ranges (MNRF 2014e-j) and a low level of risk in the Berens, Ozhiski and Swan ranges (MNRF 2014d, g). A number of ranges exhibited low disturbance assessment values; however, direct population trend evidence suggested populations may be in decline.
Range condition
Range condition varied across Ontario (Table 2-3, Figure 2-11) and was based on the conditions at the time that the Integrated Range Assessments were conducted. The Ozhiski and Swan ranges were determined to have a range condition “sufficient to sustain caribou” (MNRF 2014g). Conversely, the Kesagami and Sydney ranges were determined to be” insufficient to sustain caribou” (MNRF 2014h, k). The remaining ranges were determined to be “uncertain if they are sufficient to sustain caribou” (MNRF 2014d-g, i, j).
Annual home ranges
Some of the data collected from monitoring and assessment activities, including the Far North Caribou Project and Integrated Range Assessments as well as the Research Project, were used to calculate caribou annual home ranges (the area in which a caribou lives and travels). Specifically, telemetry data from 208 collared females were analysed to produce annual home range estimates based on minimum convex polygons (MCPs) and kernel density estimates (KDEs).
These analyses have provided insight into the amount of space that is essential for individual caribou to meet their life requirements. In general, annual movement of caribou is greater in the north than in the south and greater in the east than in the western portions of northern Ontario.
Probability of occupancy
The probability of occupancy was consistently higher along the interface of the Ontario Shield and Hudson Bay Lowlands Ecozones (MNRF 2014d-k). High probabilities within the Spirit, Swan, and Ozhiski ranges were associated with large peatland complexes (MNRF 2014g). The ranges in the Far North of Ontario had lower probability of caribou occupancy in areas with young forest.
In the more southern ranges, the highest probabilities of occupancy were correlated with mature conifer forest (greater than or equal to 36 years old), treed bog, or sparse forest (MNRF 2014g). Low probabilities were correlated most strongly with areas exhibiting abundant disturbance or young forest (less than 36 years old, early succession) (MNRF 2014d-k). Occupancy patterns were comparatively high in the vicinity of Wabakimi (Brightsand Range) (MNRF 2014e) and Woodland Caribou (Berens and Sydney Ranges) Provincial Parks (MNRF 2014d, k).
Current southern distribution
Change in probability of occupancy near the southern extent of the Continuous Distribution may be one of the best indicators of whether range recession is continuing or has been halted. The probability of occupancy for the current southern boundary as well as a 50 km north of it has been determined and will be used as a benchmark to determine if range recession is occurring in the future.
Genetic connectivity
Preliminary analysis reveals no evidence of genetic isolation among caribou within the Continuous Distribution. Caribou occupying the Far North of Ontario exhibit a higher level of genetic diversity than caribou to the south. Areas along the interface of the Shield and Lowlands Ecozones contain animals with a diverse genetic component compared with those found farther east and south (Thompson and Wilson in Berglund et al. 2014).
1 State of the Woodland Caribou Resource Report: Part 1
The State of the Woodland Caribou Resource Report provides an overview of initiatives undertaken towards the protection and recovery of caribou. Part 1 reports on the progress of the recovery actions and commitments in the Caribou Conservation Plan, which has been supported by a more than $11-million investment, as well as the status of policy, planning and resource management commitments.
2 Monitoring and assessment
2.1 Introduction
This part of the State of the Woodland Caribou Resource Report summarizes the findings of the monitoring and assessment of caribou within Ontario’s Continuous Distribution (Figure 2-1) as a deliverable of the CCP. In the CCP, Ontario committed to expand monitoring efforts in order to provide baseline data on populations, range occupancy, southern edge of the Continuous Distribution, and population health within the province. For detailed information on how the ranges were delineated, refer to the Delineation of Woodland Caribou Ranges in Ontario (‘Range Delineation Report’) (MNRF 2014a).
Between 2008 and 2013, Ontario conducted a number of monitoring and assessment activities across the Continuous Distribution (with the exception of the Lake Superior Coast Range). This was done using various methods, such as two- stage winter aerial surveys, recruitment surveys, GPS collar deployment and the collection of genetic material.
The data that was collected during the monitoring and assessment activities represents baseline information that supported Integrated Range Assessments for each range as committed to in the CCP and further supported by the Range Management Policy in Support of Woodland Caribou Conservation and Recovery (‘Range Management Policy’) (MNRF 2014b). Data was also used to support other caribou initiatives in Ontario, such as the Far North Caribou Project [Woodland caribou in the Far North of Ontario: Background information in support of land use planning technical report (Berglund et al. 2014)], as well as refining the northern boundary between forest-dwelling and forest-tundra woodland caribou, use of space, probability of occupancy, current southern distribution, and genetic connectivity. All caribou data that was collected (observations, flight lines, collar locations, etc.) have been incorporated into the standardized provincial layers in Land Information Ontario (LIO 2014) and are publically accessible.
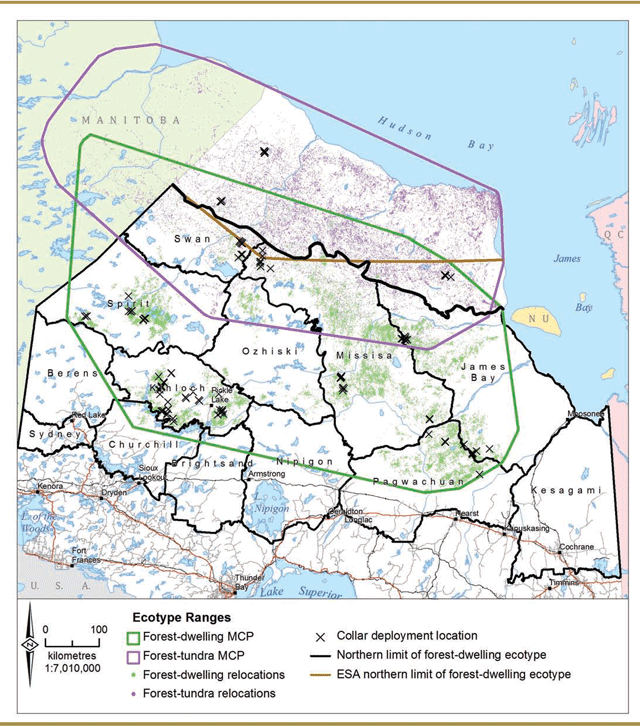
2.2 Northern boundary of continuous distribution
The southern boundary of the Northern Taiga Ecoregion (1E) (Crins et al. 2009) (Figure 2-2 black line) was used as the new northern boundary for the Continuous Distribution and the constituent ranges along that edge in the Range Delineation Report (MNRF 2014a). Recent research (Berglund et al 2014) suggests that the southern boundary of the Northern Taiga Ecoregion (1E) is a reasonable, ecologically based approximation of the northern range limit for the forest-dwelling ecotype. This boundary could be used to inform changes that correspond to the Boreal Caribou (DU6) and Eastern Migratory (DU4) Designatable Units, as identified by the Committee on the Status of Endangered Wildlife in Canada (COSEWIC 2011).
This line differs from the line identified in the Recovery Strategy for the Woodland Caribou (Rangifer tarandus caribou) (Forest-dwelling, Boreal population) in Ontario (OWCRT 2008) and the CCP (Figure 1 in MNR 2009) that was used to provide a general policy reference for the protection and recovery efforts directed towards the forest-dwelling ecotype in Ontario (Figure 2-2 brown line).
Movement behaviour of collared female caribou throughout the Far North of Ontario was used to assign individuals as belonging to either the forest-dwelling or forest-tundra ecotype. Once the caribou were classified, a geographic distribution was characterised for each ecotype using minimum convex polygons (MCP). MCP is a two- dimensional shape, which encloses all locations of the caribou data that was used in the analysis. The MCP connects the outermost observation points creating the smallest polygon possible while enclosing all data points (Figure 2-2). The results suggested geographic overlap where both ecotypes occurred at the interface of the Northern Taiga Ecoregion with the Big Trout Lake and James Bay Ecoregions during winter. Regular winter movements of forest- tundra individuals into the Big Trout Lake and James Bay Ecoregions from the north occur, and individuals exhibiting forest-dwelling characteristics have also occasionally made excursions north (Abraham et al 2012; Wilson 2013; Pond in Berglund et al. 2014).
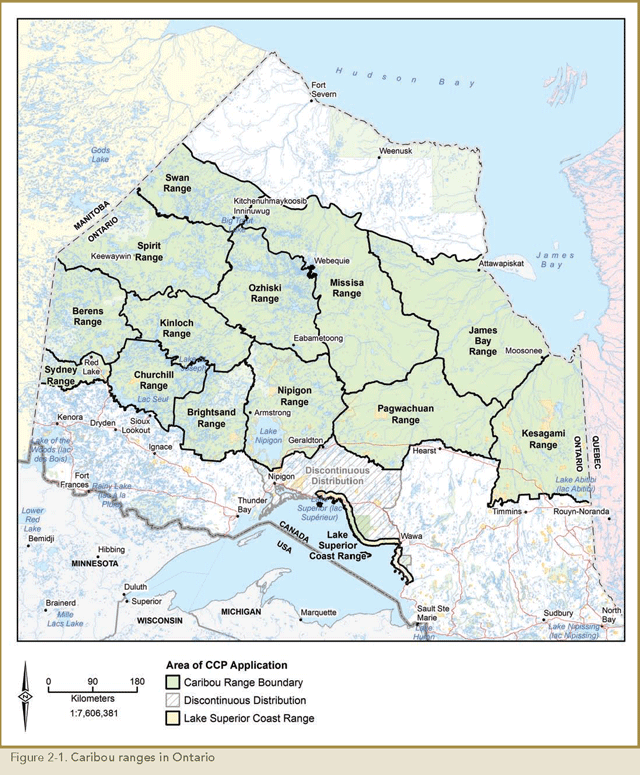
Enlarge Figure 2-1. Caribou ranges in Ontario (PDF)
2.3 Integrated Range Assessments
As committed to in the CCP, an Integrated Range Assessment was conducted for each range in the Continuous Distribution (with the exception of the Lake Superior Coast Range) (Figure 2-1). Integrated Range Assessments were completed following the Integrated Range Assessment Protocol for Woodland Caribou Ranges in Ontario (‘the Protocol’) (MNRF 2014c). The Protocol describes the process used to conduct an Integrated Range Assessment and prepare an Integrated Range Assessment Report (IRAR) for each range as outlined by the Range Management Policy. The Integrated Range Assessment process was adapted from the scientific findings described by Environment Canada (EC) (2011). Caution is warranted in the interpretation of the Integrated Range Assessment results due to the limitations of available data and conditions or circumstances not readily integrated in the analysis framework. This caution should be expressed by considering the Integrated Range Assessment Report contents as a whole. One should not take the individual lines of evidence or data summaries out of context or their intended purpose as described in the Protocol which describes the specific intent and role for each section of the Integrated Range Assessment Report.
An Integrated Range Assessment is a quantitative and qualitative analysis that leads to a statement of range condition based on when the Integrated Range Assessment took place. The Integrated Range Assessment involves an evaluation of four quantitative lines of evidence, two relating to caribou population state (population size and trend) and two relating to habitat state (disturbance assessment and habitat assessment). Three of these lines of evidence (population size, trend, and habitat disturbance) (Integrated Risk Assessment) were adapted from the Scientific Assessment to Inform the Identification of Critical Habitat for Woodland Caribou (Rangifer tarandus caribou), Boreal Population, in Canada (EC 2008). Habitat assessment (amount and arrangement of habitat) as a fourth line of evidence is combined with the Integrated Risk Assessment to determine range condition.
Integrated Range Assessment Reports (MNRF 2014d-k) were produced for all ranges, with the exception of Lake Superior Coast Range. For more detailed information, please see the range specific IRARs (MNRF 2014d-k).
2.3.1 Winter distribution surveys
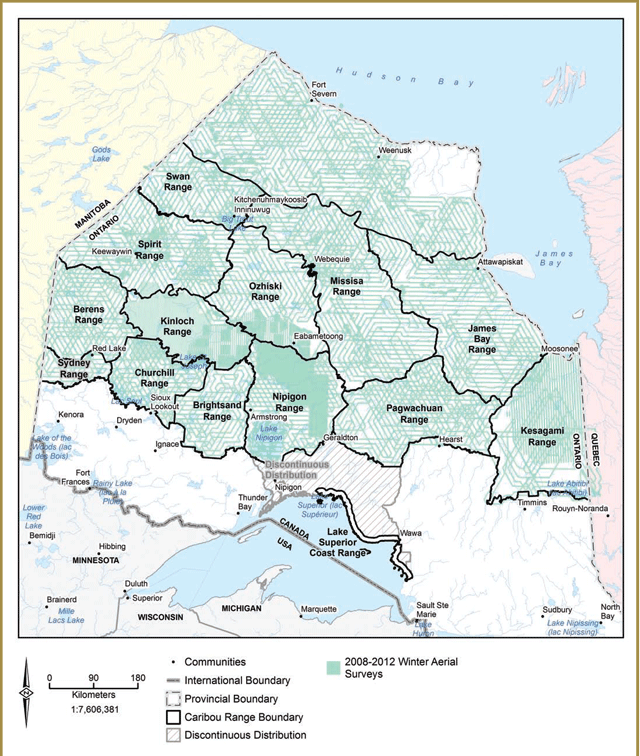
Two-stage winter distribution surveys were conducted in February and/or March across the ranges in the Continuous Distribution (Lake Superior Coast Range not included) (Figure 2-3). These surveys allow for the collection of population data that will support the estimates of probability of occupancy, caribou winter distribution, population size, general recruitment rates and population trends. Over five years (2008 to 2012), these surveys were conducted across Ontario; the distribution of surveys extended as far north as the Hudson Bay and James Bay coasts. Resulting data were used to inform occupancy modelling and population health.
The first stage was a hexagon-based (approximately 100 km2 cell size) survey conducted by plane (fixed-wing) in which observations of caribou, moose, wolves and wolverine, as well as evidence of their presence was recorded. The second stage was conducted by helicopter (rotary-wing) that targeted areas where groups of caribou and extensive fresh caribou presence were identified during the fixed-wing survey. This stage also provided essential information on sex ratios and recruitment rates which were used in the determination of population trends. More details regarding the survey design and sampling effort standards can be found in the Protocol (MNRF 2014c).
Both survey stages were completed in a single year (usually taking 2-3 weeks to complete a range) for most of the ranges. Some of the ranges in the Far North of Ontario were not surveyed in their entirety during a single survey season so data was compiled from multiple years of survey work.
2.3.2 Winter distribution observations
All direct and indirect (tracks, slushing, cratering, etc.) caribou observations were recorded (Figure 2-3). All direct observations (caribou that were visually observed) were counted and classed as either adults or calves and the adults classed as male or female, if possible. All animals observed were classed as unknown adults, adult males, adult females, calves, or unknown age and sex.
In the ranges in the Far North of Ontario, higher concentrations of observations were observed within the Missisa Range, largely in proximity to the interface between the Ontario Shield and Hudson Bay Lowlands Ecozones (MNRF 2014g). Caribou were most evenly dispersed within the James Bay Range, whereas in the Spirit, Ozhiski and Kinloch Ranges, which have frequent and abundant wildfires, caribou were associated with areas of older forest and peatlands (Figure 2-4) (MNRF 2014g).
In the more southern ranges, caribou were generally found in areas with a higher amount of older conifer forest or peatlands and generally not found in areas of young forest. Higher concentrations of observations were found in areas within the ranges that had lower amounts of natural and anthropogenic disturbance (MNRF 2014d-f, h-k).
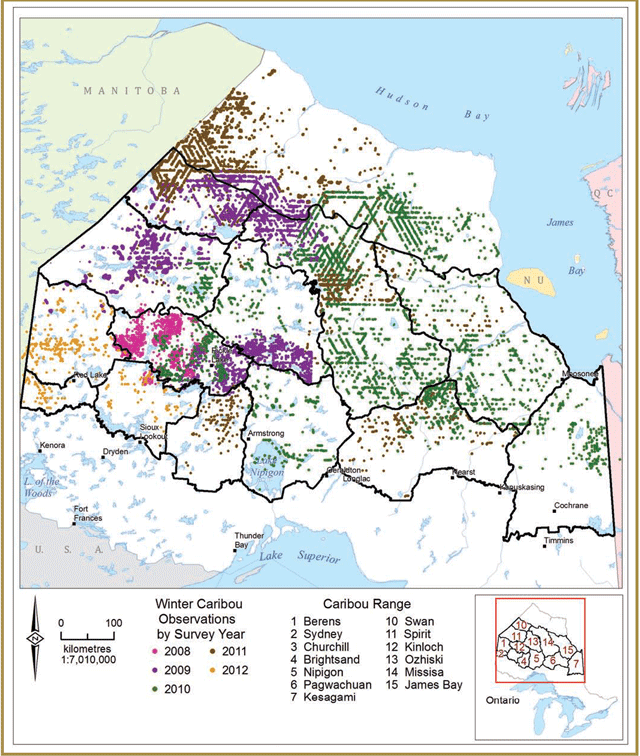
Observations reflect the aerial transects flown by the fixed-wing aircraft as well as areas of intensive rotary-wing aircraft surveys. Observations in the Far North include both caribou ecotypes (forest-dwelling and forest-tundra), particularly in proximity to the northern limit of the Swan, Missisa, and James Bay ranges.
Enlarge Figure 2-4. Caribou observations from the two-stage winter distribution surveys (PDF)
2.3.3 Population state
The Protocol (MNRF 2014c) describes how two lines of evidence – population size as well as population trend – are used to assess population state. These two lines of evidence are used, along with habitat disturbance to determine the Integrated Risk Assessment. Details of data and analyses are described in individual IRARs (MNRF 2014d-k) and the interpretation of lines of evidence and Integrated Risk Assessment can be found in the Protocol (MNRF 2014c).
2.3.3.1 Population size
Generating a reliable population estimate of caribou is generally not considered possible using conventional wildlife inventory and assessment techniques due to their patchy distribution, cryptic nature, and difficulty in estimating detection error (DeCesare et al. 2012). Therefore, minimum animal count (MAC) is considered to be an absolute minimum number of caribou within a range and it is not synonymous with a population size estimate. However, it is used as a conservative estimate of population size which is one of the lines of evidence used to determine risk to caribou and contributes to range condition.
Practical survey limitations in population estimates are reflected in the Protocol (MNRF 2014c) in response to survey methodologies designed primarily for the estimation of probability of occupancy. Furthermore, MAC may be expected to vary with survey conditions, survey intensity, and surveyor experience. Degree of survey effort is an important factor when interpreting MAC. For the more southern ranges, MAC was calculated using observations from the winter distribution surveys from the first year of the Integrated Range Assessment (MNRF 2014d-f, h-k). For the ranges in the Far North of Ontario, MAC was calculated using observation from multiple years of winter distribution surveys because these ranges were not surveyed in their entirety in a single year (MNRF 2014g).
There is a wide variation in MAC among the ranges (Figure 2-5).Using the data from all winter distribution surveys between 2008 and 2012 the sum of the MAC across all ranges in Ontario is estimated to be 3,334 (Figure 2-5) (MNRF 2014d-k). In most cases there are likely many more caribou than suggested by the MAC for each range. For example, the MAC for the Sydney Range is 55 caribou from the winter distribution survey; a subsequent recruitment survey the following year yielded a MAC of 74 caribou (MNRF 2014k). Nonetheless, a MAC of 3,334 represents the absolute minimum number of forest-dwelling caribou in Ontario. This summary should be interpreted with caution because caribou are a wide-ranging species with generally low detectability and may move between ranges. In addition, observations during late winter, particularly within the Swan Range and the northern 100 km of the Missisa and James Bay ranges may not be exclusively forest-dwelling caribou, as these areas may host forest-tundra caribou during winter (MNRF 2014g). For more details on MAC was obtained for each range, please see the individual IRAR(MNRF 2014d-k) for that range.
Recruitment surveys in subsequent years have yielded more caribou than initially estimated for the MAC in the IRA process. There were 640 caribou observed in the Swan Range during 2011 recruitment surveys; 332 in the Kinloch Range in 2012; 74 in the Sydney Range in 2013.
2.3.3.2 Population trend
Population trend is an indicator of self-sustainability, preferably measured over a short period of time (three to five years). The intent of this line of evidence is to estimate a population trend reflective of the demographic response to range condition, including the intensity and extent of the natural and anthropogenic risk factors operating within the range (MNRF 2014c).
Calf recruitment is defined as the number of young produced that survive to the end of the first year and are estimated from winter surveys conducted in February or March. Adult female survival rate is determined as the number of collared animals alive after a given time period. An adult female survival rate of 85%, coupled with a recruitment rate of approximately 29 calves per 100 adult female caribou, is required for a population to be considered stable or increasing (EC 2008; 2011).
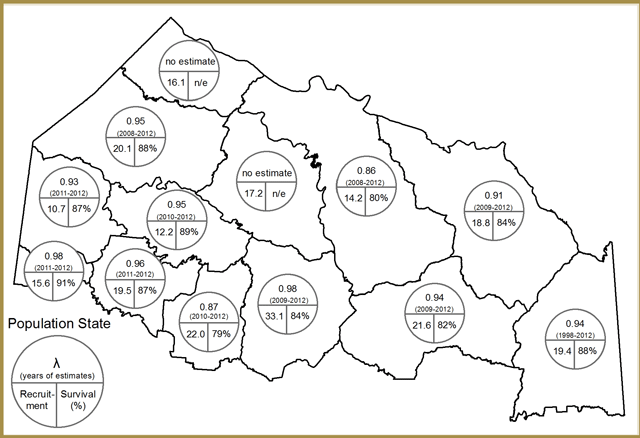
Calf recruitment was determined in the first year by the winter distribution survey (from 2008 to 2012) and in subsequent years by recruitment surveys that targeted collared females and their associated groups (from 2009 to 2013) (MNRF 2014d-k). Annual adult female survival was determined by monitoring collared female caribou over a defined number of years following the first year of winter distribution surveys. Average (geometric mean) survival rates varied between 79 to 91% across the caribou ranges (MNRF 2014 d-k). Average (geometric mean) recruitment rates varied between 10.7 to 33 across the caribou ranges with only the Nipigon Range having a number closer to, or greater than, the accepted threshold (Figure 2-6) (MNRF 2014d-k).
Estimates of population trend (λ, or lambda) were calculated if both annual recruitment rates and adult female survival rates were available (MNRF 2014c). Lambda is defined as the intrinsic rate of growth and can be used as an indicator of population trend (i.e. increasing, decreasing, or stable). A population exhibiting a trend value less than 0.99 is interpreted as declining (EC 2008; 2011). If multiple years’ worth of estimates were available, an average (geometric mean) annual population trend was calculated. Population trend is one of the lines of evidence used to determine risk to caribou and contributes to range condition.
The average (geometric mean) annual population trend was found to be less than 0.99 for all ranges and is 0.86 to 0.98 (Figure 2-6). Based on Environment Canada (2008, 2011), this supports an interpretation that caribou populations within Ontario may be in a short-term decline. Due to small sample sizes, population trend and survival could not be calculated for the Swan or Ozhiski Ranges (MNRF 2014g). However, both ranges had recruitment rates lower than the assumed threshold required for a population to be considered stable or increasing (MNRF 2014g).
There are challenges in interpreting population trend data based on variability across ranges such as:
- the representativeness (i.e. sample size, capture location, initial age, and vigor) of collared caribou from which survival estimates are generated;
- the ability of surveyors to estimate age and sex of observed caribou without error and/or bias under challenging survey conditions; and,
- despite the relatively short-term estimates of population trend (1-4 years), they can be a reflection of longer term environmental conditions and not simply a “good” or “bad” year for caribou (or series of years).
For a more detailed explanation and interpretation of results for individual ranges, refer to the range-specific Integrated Range Assessment Report (MNRF 2014d-k).
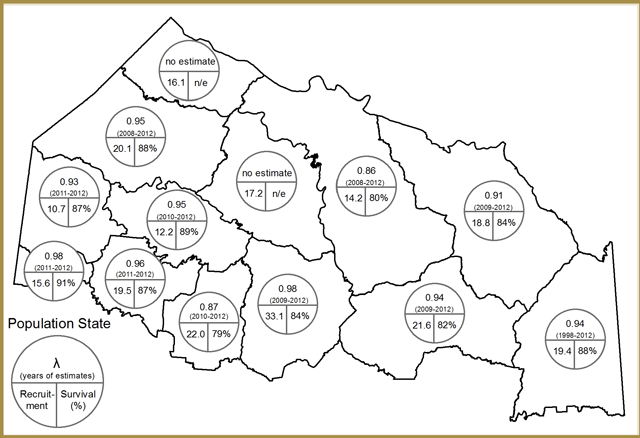
Population trend is based upon the average (geometric mean) survival estimate (%) and the average (geometric mean) recruitment estimate (calves/100 adult females). There is no estimate (n/e) of population trend and survival for the Swan or Ozhiski ranges due to small sample size.
| Range | Average population trend (λ) | Time period | Recruitment | Survival (%) |
|---|---|---|---|---|
| Barens | 0.93 | 2011-2012 | 10.7 | 87% |
| Sydney | 0.98 | 2011-2012 | 15.6 | 91% |
| Churchill | 0.96 | 2011-2012 | 19.5 | 87% |
| Brightsand | 0.87 | 2010-2012 | 22.0 | 79% |
| Nipigon | 0.98 | 2009-2012 | 33.1 | 84% |
| Pagwachuan | 0.94 | 2009-2012 | 21.6 | 82% |
| Kesagami | 0.94 | 1998-2012 | 19.4 | 88% |
| Swan | No estimate | n/e | 16.1 | n/e |
| Spirit | 0.95 | 2008-2012 | 20.1 | 88% |
| Kinloch | 0.95 | 2010-2012 | 12.2 | 89% |
| Ozhiski | No estimate | n/e | 17.2 | n/e |
| Missisa | 0.86 | 2008-2012 | 18.8 | 84% |
| James Bay | 0.94 | 1998-2012 | 19.4 | 88% |
2.3.4 Habitat state
The Protocol (MNRF 2014c) describes how two lines of evidence – disturbance as well as habitat amount and arrangement – are used to assess habitat state. The disturbance analysis is used in the Integrated Risk Assessment, while the amount and arrangement of habitat is used, in conjunction with the result of the Integrated Risk Assessment, in the determination of range condition. Details of data and analyses are described in individual IRARs (MNRF 2014d-k) and the interpretation of lines of evidence and Integrated Risk Assessment can be found in the Protocol (MNRF 2014c).
2.3.4.1 Disturbance assessment
The disturbance assessment involved the calculation of a disturbance footprint, which is used as an estimator of cumulative effects related to expected functional habitat loss. This is completed by conducting a disturbance analysis. It is an independent but indirect predictor of recruitment, and likelihood of stable or increasing population growth (EC 2011).
The disturbance analysis involves the collation of the cumulative landscape contributions of multiple sources of habitat alteration, including natural events such as fire or blowdown, and anthropogenic (human) activities and infrastructure as well as forest harvesting and burns that are less than 36 years old (Figure 2-7). Some components of this footprint are dynamic and will change through time as forests re-grow after natural disturbance or forest harvesting, or as mineral exploration and mining activity expands or contracts. The frequency and size of natural disturbances, primarily wildfire, varies greatly across ranges with the most aggressive fire regimes on the Ontario Shield Ecozone and the least aggressive in the Hudson Bay Lowlands Ecozone (Figure 2-7).
Anthropogenic disturbance is extensive within many parts of the seven southern ranges and, with the exception of the Berens Range, is a larger contributor than wildfire to overall range disturbance in those ranges (Table 2-1) (MNRF 2014d-k). In the ranges in the Far North of Ontario, anthropogenic disturbance is comparatively low, but is most prevalent in the Missisa Range and is primarily associated with high levels of mineral exploration activity (Figure 2-7) (MNRF 2014g).
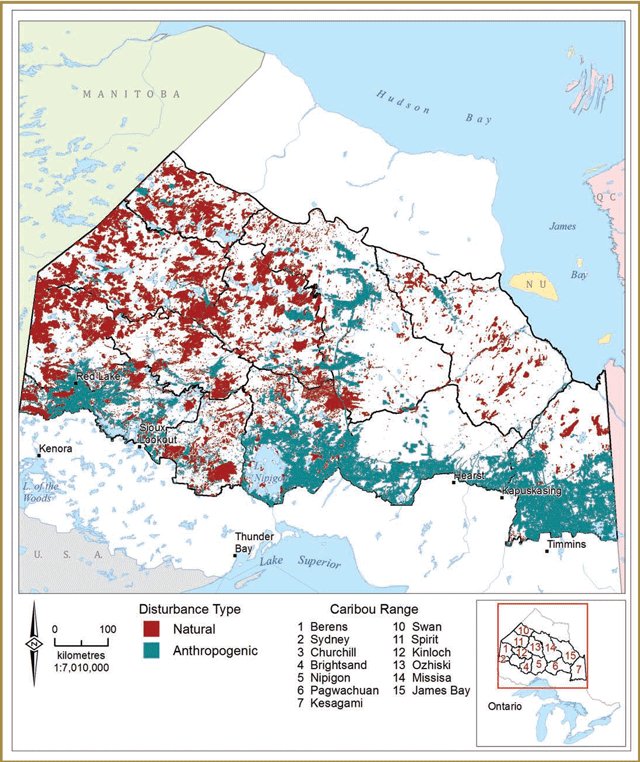
Enlarge Figure 2-7. Natural and anthropogenic disturbances (PDF)
The meta-analysis of caribou ranges across Canada found that the likelihood of stable or increasing population growth is inversely related to the amount of disturbance (EC 2011). Ranges with less than 35 percent disturbance have a likelihood of stable or increasing population growth exceeding 0.6, which is the threshold at which the population is thought to be self-sustaining. Ranges with more than 45 percent disturbance have a likelihood of stable or increasing population growth less than 0.4. Ranges with 35 to 45 percent disturbance are as likely as not to have stable or increasing population growth (MNRF 2014c; EC 2011). The amount of disturbance is one of the lines of evidence used to determine risk to caribou and contributes to range condition.
Currently, cumulative disturbance varies from six percent (James Bay Range) to 62.7 percent (Sydney Range) across the Continuous Distribution (Table 2-1) (MNRF 2014d-k). The likelihood of stable or increasing population growth spans from 0.9 to 0.2, respectively (MNRF 2014d-k). The disturbance levels in the ranges of the Far North of Ontario are less than the federal 35 percent (0.6) threshold and are generally less disturbed than the southern ranges (MNRF 2014d-k). The disturbance levels in a number of the more southern ranges are in the 35 to 45 percent (0.6 to 0.4) range (MNRF 2014d-f, h-k).
The Berens, Pagwachuan and all ranges in the Far North of Ontario have a likelihood of stable or increasing population growth ranging between 0.65 to 0.9 (MNRF 2014d, j, g) and are therefore likely to have self-sustaining populations (MNRF 2014c; EC 2011). In the Sydney, it is unlikely that the population growth is stable or increasing, with an estimated probability of 0.2 based on the conditions at the time the Integrated Range Assessment was completed (MNRF 2014k). The Brightsand, Churchill, Nipigon and Kesagami Ranges are considered to have a probability of stable or increasing population growth of uncertain with estimated probability ranging from 0.45 to 0.55 (MNRF 2014e, f, i, h).
As described in the Protocol (MNRF 2014c), the disturbance analysis could underestimate other factors that may contribute to functional habitat loss such as sensory disturbance (e.g. noise from industrial or recreational activities), or other human activities that may influence the distribution, abundance, or hunting patterns of predators.
| Ranges | % Disturbance (Natural; Anthropogenic) |
Likelihood of stable or increasing population growth (Pr (λ≥ stable)) |
|---|---|---|
| Berens | 28.7 (19.4; 9.3) | 0.70 |
| Sydney | 62.7 (16.2; 46.6) | 0.20 |
| Churchill | 41.3 (5.4; 35.9) | 0.47 |
| Brightsand | 43.5 (10.4; 33.1) | 0.45 |
| Nipigon | 38.4 (4.6; 33.8) | 0.55 |
| Pagwachuan | 31.0 (0.5; 30.5) | 0.65 |
| Kesagami | 43.7 (2.0; 41.7) | 0.45 |
| Swan | 23.5 (20.3; 3.2) | 0.78 |
| Spirit | 28.6 (25.1; 3.5) | 0.70 |
| Kinloch | 19.6 (14.1; 5.5) | 0.80 |
| Ozhiski | 27.6 (20.0; 7.6) | 0.70 |
| Missisa | 14.4 (5.0; 9.4) | 0.86 |
| James Bay | 6.6 (4.3; 2.3) | 0.90 |
2.3.4.2 Habitat assessment
In Ontario, functional habitats important to caribou include winter and refuge habitat. Winter habitat provides for winter forage availability while refuge habitat provides for predator avoidance when available at adequate quantities and spatial extent. Winter habitat can often provide for refuge as well. Ontario’s current approach to identifying these habitats was developed based on knowledge and the results of habitat- related research (Brown et al. 2007; Ferguson and Elkie 2004). This work was developed within areas of Ontario that have Forest Resources Inventories (FRI). More detail can be found in the Forest Management Guide for Boreal Landscapes (OMNR 2014).
The habitat assessment evaluated both the amount and arrangement of habitat components (winter habitat, refuge habitat, mature conifer, young forest, etc.) to determine the degree of similarity to expected natural levels of habitat for the range and is described in the Protocol (MNRF 2014c). The analysis compares the current amount and arrangement of habitat with the level that has been estimated to occur in a natural landscape (Elkie et al. 2012). Maintaining or moving towards the estimated amount of habitat that is within the middle fiftieth percentile (or interquartile range) of the Simulated Range of Natural Variation (SRNV) is assumed to provide a habitat condition that avoids extreme conditions that may increase risk to caribou (MNRF 2014b). Maintaining or moving towards the estimated mean arrangement of habitat is also assumed to provide a habitat condition that avoids extreme conditions of habitat fragmentation that may increase risk to caribou.
The amount of winter and refuge habitat in the Sydney and Kesagami Ranges, and the western side of the Pagwachuan Range (Figure 2-8) was below the interquartile range of the estimated natural conditions of the SRNV (MNRF 2014h, j, and k). Amounts of either winter or refuge habitat within the Berens, and the eastern side of Pagwachuan Range were below the interquartile range of the estimated natural conditions (MNRF 2014 I, j). In other words, there was less habitat (winter and/or refuge) available within these ranges than would be expected in a natural condition. The Churchill Range was found to have an amount of winter and refuge habitat (within the interquartile range) consistent with natural conditions as estimated by the SRNV (MNRF 2014f). The Brightsand and Nipigon Ranges were found to have an amount of refuge habitat above the interquartile range of what is expected in natural conditions and an amount of winter habitat within the interquartile range, so consistent with natural conditions as estimated by the SRNV (MNRFe, i).
The arrangement of winter habitat in the Berens, Kesagami, Nipigon, Pagwachuan and Sydney Ranges (Figure 2-8 and 2-9) was fragmented relative to the estimated natural conditions of the SRNV (MNRF 2014d, h-j); refuge habitat arrangement in the Brightsand Range was also fragmented relative to the estimated natural conditions (MNRF 2014e). In other words, there was more fragmentation (of winter and/or refuge) within these ranges than would be expected in a natural condition. The Churchill Range was found to have a suitable arrangement of both winter and refuge habitat (MNRF 2014f)).
Similar to the importance of winter and refuge habitat for caribou, are areas of forest that are younger than 36 years old. Large areas of young forest are generally considered undesirable for caribou but are an essential component of a dynamic landscape and if they exhibit the right biophysical components can become future caribou habitat. The amount of young forest was also compared to the SRNV for the more southern ranges. The ranges, with the exception of the Kesagami Range, had suitable amounts of young forest (MNRF 2014d-g, i-k). See IRARs of the seven southern ranges (MNRF 2014d-f, h-k) for range-specific results.
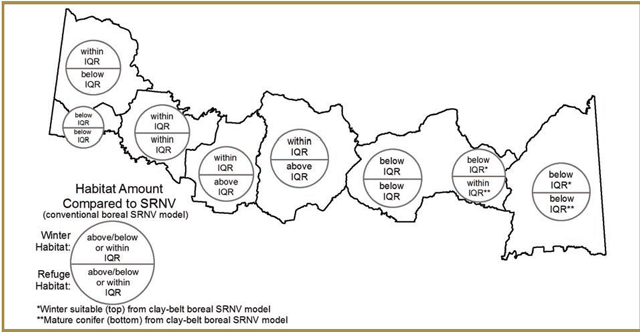
Analysis determined whether the current amounts of habitat were above, below, or within the interquartile range (IQR) of the SRNV.
| Region | Winter habitat | Refuge habitat |
|---|---|---|
| Barens | Within IQR | Below IQR |
| Sydney | Below IQR | Below IQR |
| Churchill | Within IQR | Within IQR |
| Brightsand | Within IQR | Above IQR |
| Nipigon | Within IQR | Above IQR |
| East Pagwachuan | Below IQR | Below IQR |
| West Pagwachuan | Below IQR* | Within IQR** |
| Kesagami | Below IQR* | Below IQR** |
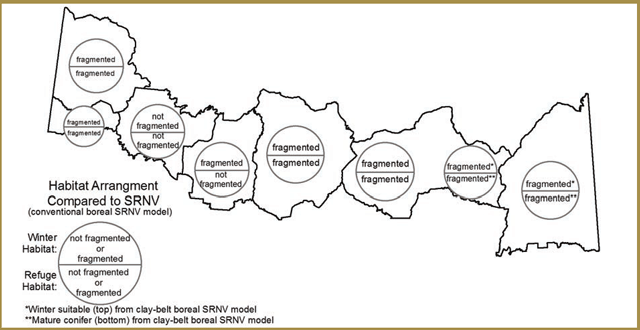
| Region | Winter habitat | Refuge habitat |
|---|---|---|
| Barens | Fragmented | Fragmented |
| Sydney | Fragmented | Fragmented |
| Churchill | Not fragmented | Not fragmented |
| Brightsand | Fragmented | Not fragmented |
| Nipigon | Fragmented | Fragmented |
| East Pagwachuan | Fragmented | Fragmented |
| West Pagwachuan | Fragmented* | Fragmented** |
| Kesagami | Fragmented* | Fragmented** |
* Winter suitable (top) from clay belt boreal SRNV model
2.3.4.3 Habitat in the Far North
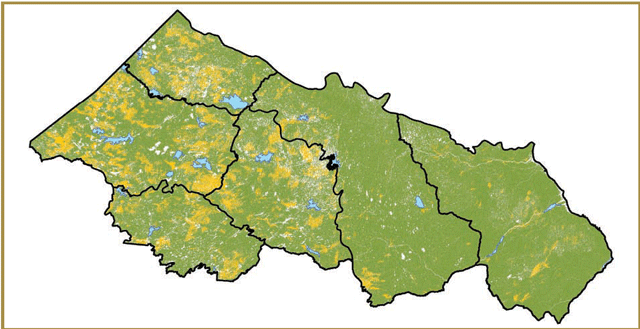
In the Far North of Ontario, where Forest Resources Inventory (FRI) information is not available, neither reliable estimates of current amount of habitat nor the projected SRNV are achievable with existing information. Therefore the dataset, Far North Land Cover (LIO 2013a) was used as a surrogate for caribou habitat. Also, specific habitat models do not yet exist to translate the amount and arrangement of these landscape components into relative caribou habitat values. In the Far North of Ontario there is little knowledge about the relationship between these land cover classes and the forest or peatland ecosystem conditions captured by them, especially in the Swan, Spirit, Ozhiski and James Bay Ranges. However, the Protocol (MNRF 2014a) describes a conventional boreal habitat and clay-belt boreal habitat models (MNRF 2014g).
At a broad scale, the amount of each land cover class from Far North Land Cover is a direct measure of the amount of habitat that may provide for caribou life requirements (Figure 2-10, Table 2-2) (MNRF 2014g). This analysis represents the most basic measure of the amount of various habitat components at a broad landscape level. Over time this provides the opportunity to conduct comparative evaluations against future landscape conditions.
| Range Area (ha) Land Cover Classification | Swan 2,513,578 ha (,000) |
Swan % |
Spirit 4,666,255 ha (,000) |
Spirit % |
Kinloch 2,672,476 ha (,000) |
Kinloch % |
Ozhiski 3,871,021 ha (,000) |
Ozhiski % |
Missisa 6,966,862 ha (,000) |
Missisa % |
James Bay 6,035,852 ha (,000) |
James Bay % |
|---|---|---|---|---|---|---|---|---|---|---|---|---|
| Coniferous Swamp | 130 | 5.2 | 264 | 5.7 | 196 | 7.4 | 563 | 14.5 | 1,102 | 15.8 | 464 | 7.7 |
| Treed Peatland | 0 | 0.0 | 4 | 0.1 | 81 | 3.0 | 28 | 0.7 | 0 | 0.0 | 0 | 0.0 |
| Open Fen | 80 | 3.2 | 91 | 1.9 | 19 | 0.7 | 22 | 0.6 | 397 | 5.7 | 612 | 10.1 |
| Treed Fen | 276 | 11.0 | 412 | 8.8 | 70 | 2.6 | 205 | 5.3 | 1,260 | 18.1 | 2,246 | 37.2 |
| Open Bog | 104 | 4.1 | 198 | 4.2 | 134 | 5.0 | 118 | 3.0 | 1,029 | 14.8 | 1,104 | 18.3 |
| Treed Bog | 440 | 17.5 | 261 | 5.6 | 293 | 11.0 | 180 | 4.6 | 1,415 | 20.3 | 725 | 12.0 |
| Sparse Treed | 337 | 13.4 | 516 | 11.1 | 78 | 2.9 | 120 | 3.1 | 136 | 1.9 | 12 | 0.2 |
| Mixed Treed | 50 | 2.0 | 221 | 4.7 | 82 | 3.1 | 265 | 6.8 | 90 | 1.3 | 22 | 0.4 |
| Coniferous Treed | 135 | 5.4 | 918 | 19.7 | 985 | 36.9 | 1,120 | 28.9 | 581 | 8.3 | 133 | 2.2 |
| Bedrock | 0 | 0.0 | 17 | 0.4 | 2 | 0.1 | 3 | 0.1 | 1 | 0.0 | 0 | 0.0 |
| Disturbance | ||||||||||||
| (Non and Sparse Woody) | 38 | 1.5 | 488 | 10.5 | 768 | 6.3 | 138 | 3.6 | 81 | 1.2 | 88 | 1.5 |
| Disturbance (Treed/Shrub) | 368 | 14.6 | 525 | 11.3 | 170 | 6.4 | 384 | 9.9 | 150 | 2.2 | 66 | 1.1 |
| Sand/Gravel/Mine Tailings | 0 | 0.0 | 0 | 0.0 | 0 | 0.0 | 0 | 0.0 | 0 | 0.0 | 4 | 0.1 |
| Community/Infrastructure | 1 | 0.0 | 1 | 0.0 | 2 | 0.1 | 2 | 0.0 | 0 | 0.0 | 1 | 0.0 |
| Agriculture | 0 | 0.0 | 0 | 0.0 | 0 | 0.0 | 0 | 0.0 | 0 | 0.0 | 0 | 0.0 |
Three of the four lines of evidence described above population size, population trend, and disturbance contributed to the Integrated Risk Assessment in determining the level of risk to caribou within each range (MNRF 2014c). As described in the Protocol (MNRF 2014c), the term risk refers to the projected likelihood that caribou occupying a range are self-sustaining. Generally, high risk (low likelihood of a self-sustaining population) is undesirable in terms of caribou conservation and low risk (high likelihood of a self-sustaining population) is desirable. The scientific basis for this weight of evidence approach is documented by Environment Canada (2011).
A number of ranges were determined to be at a high or intermediate level of risk (low or uncertain likelihood of a self-sustaining population). There is a high level of risk in the Sydney Range (MNRF 2014k), an intermediate level of risk in the Brightsand, Churchill, Kesagami, Nipigon, Pagwachuan, Kinloch, Missisa, Spirit and James Bay ranges (MNRF 2014e-j) and a low level of risk (high likelihood of a self-sustaining population) in the Berens, Ozhiski and Swan Ranges (MNRF 2014d, g). A number of ranges exhibited low disturbance assessment values; however, direct population trend evidence suggested populations may be in decline.
Using a weight-of-evidence approach advocated in the Protocol (MNRF 2014c), the Integrated Risk Assessment must account for contradictory evidence as an indication of uncertainty. At the time when the Integrated Range Assessment Reports were published (MNRF 2014 d-k), the minimum of three years of recruitment information had not been met for the Berens, Churchill, Sydney, Ozhiski and Swan Ranges (MNRFd, f, g, k). Furthermore, three ranges which border other jurisdictions – Berens and Sydney (Manitoba) (MNRF 2014d, k) and Kesagami (Quebec) (MNRF 2014h) – have caribou use patterns and habitat considerations associated with the neighbouring jurisdiction that may influence the interpretation of results (see Berens, Kesagami and Sydney IRARs (MNRF 2014d, h, k)).
2.3.5 Range condition
Range condition is reflected in the IRARs as a statement pertaining to the ability of the range to sustain caribou if the current habitat and population conditions persist.
Range condition is declared with full acknowledgement and understanding of the current ability for the population to persist but with the additional insight provided by the habitat assessment. Range condition for each range was determined by using the outcome of the Integrated Risk Assessment and the fourth line of evidence – the habitat amount and arrangement (MNRF 2014c).
Range condition varied across Ontario (Table 2-3, Figure 2-11) and was based on the conditions at the time that the Integrated Range Assessments were conducted. The Ozhiski and Swan Ranges were determined to have a range condition sufficient to sustain caribou (MNRF 2014g). Conversely, the Kesagami and Sydney Ranges were determined to be insufficient to sustain caribou (MNRF 2014h, k). The remaining ranges were determined to be uncertain if they are sufficient to sustain caribou (MNRF 2014d-g, i, j).
Refer to Appendix 2 for an overview of the range-specific data used in determining range condition. Further information and greater detail can be found in the Integrated Range Assessment Reports (MNRF 2014c-j).
Table 2-3. Range condition of ranges in Ontario determined through the Integrated Range Assessment process (Figure 2-14) (MNRF 2014d-k)
- Range Name : Range Condition
- Berens:
- Uncertain if range condition is sufficient to sustain caribou
- Sydney:
- Insufficient to sustain caribou
- Churchill:
- Uncertain if range condition is sufficient to sustain caribou
- Brightsand:
- Uncertain if range condition is sufficient to sustain caribou
- Nipigon:
- Uncertain if range condition is sufficient to sustain caribou
- Pagwachuan:
- Uncertain if range condition is sufficient to sustain caribou
- Kesagami:
- Insufficient to sustain caribou
- Swan:
- Sufficient to sustain caribou; additional population trend data is required
- Spirit:
- Uncertain if range condition is sufficient to sustain caribou
- Kinloch:
- Uncertain if range condition is sufficient to sustain caribou
- Ozhiski:
- Sufficient to sustain caribou; additional population trend data is required
- Missisa:
- Uncertain if range condition is sufficient to sustain caribou
- James Bay:
- Uncertain if range condition is sufficient to sustain caribou
- Berens:
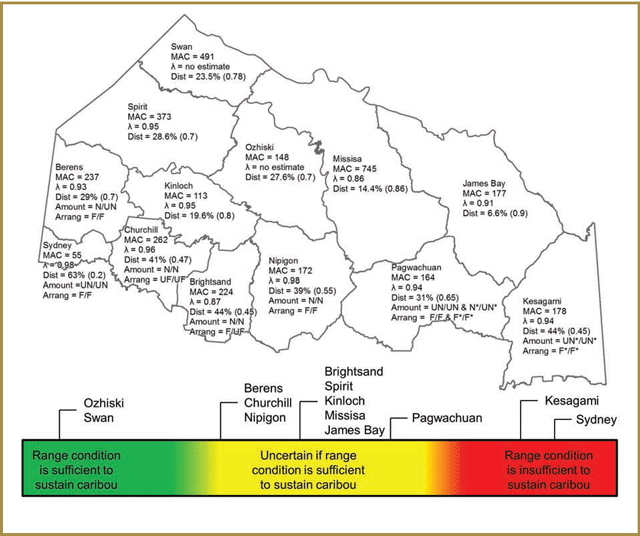
- MAC = minimum animal count; considered to be an absolute minimum number of caribou present within a range.
- λ = population trend
- Dist. = % of range disturbed
- Amount = Winter (natural (N) or unnatural (UN)) / Refuge (natural (N) or unnatural (UN).
- Arrangement = Winter (unfragmented (UF) or fragmented (F)) / Refuge (unfragmented (UF) or fragmented
- (F) Winter suitable (natural (N) or unnatural (UN)) / *Mature Conifer (natural (N) or unnatural (UN) for Amount and Arrangement in Kesagami Range and eastern side of Pagwachuan Range
| Range | MAC = minimum animal count; considered to be an absolute minimum number of caribou present within a range. | λ = population trend | Dist.= % of range disturbed | Amount = Winter (natural (N) or unnatural (UN)) / Refuge (natural (N) or unnatural (UN). | Arrangement = Winter (unfragmented (UF) or fragmented (F)) / Refuge (unfragmented (UF) or fragmented |
|---|---|---|---|---|---|
| Berens | 237 | 0.93 | 29% (0.7) | N/UN | F/F |
| Spirit | 373 | 0.95 | 28.6 (0.7) | N/A | N/A |
| Swan | 491 | no estimate | 23.5% (0.78) | N/A | N/A |
| Massisa | 745 | 0.86 | 14.4% (0.86) | N/A | N/A |
| James Bay | 177 | 0.91 | 6.6% (0.9) | ||
| Sydney | 55 | 0.98 | 63% (0.2) | UN/UN | F/F |
| Churchhill | 262 | 0.96 | 41% (0.47) | N/N | UF/UF |
| Kinloch | 113 | 0.95 | 19.6 (0.8) | N/A | N/A |
| Ozhiski | 148 | no estimate | 27.6% (0.7) | N/A | N/A |
| Brightsand | 224 | 0.87 | 44% (0.45) | N/N | F/UF |
| Nipigon | 172 | 0.98 | 39% (0.55) | N/N | F/F |
| Pagwachaun | 164 | 0.94 | 31% (0.65) | UN/UN &N/UN* | F/F&FFF |
| Kesagami | 178 | 0.94 | 44% (0.45) | UN/UN* | F/F* |
* Mature Conifer (natural (N) or unnatural (UN) for Amount and Arrangement in Kesagami Range and eastern side of Pagwachuan Rang
2.4 Annual home ranges
GPS-collar data collected from the research, and monitoring and assessment activities were used to calculate caribou annual home range sizes (the area in which a caribou lives and travels in a year) using two different methods. Specifi , telemetry data from 208 collared females were analysed to produce annual home range estimates based on minimum convex polygons (MCPs) and kernel density estimates (KDE). Caribou were only included in the analysis if location data was available for 75% of the time, across all four seasons, and telemetry data was subsampled at one location per day per caribou (selecting the point with the best location accuracy) to determine use of space.
The MCP is a two-dimensional shape that connects the outermost telemetry points creating the smallest polygon possible while enclosing all data points with straight lines. MCPs can overestimate home range size, so 95% MCPs were used. This minimizes the impact of points that were further from the centroid of the home range for each animal by removing the furthest 5% of locations. The locations that were removed would increase home range size, but do not represent areas that are regularly visited by each caribou.
The KDE describes the probability of finding an animal in any one place; it recognizes that not all areas visited by caribou are equally used. There are some areas that a caribou may visit rarely, so they could be excluded from the home range estimate. KDE home ranges are derived by drawing smooth contour lines (i.e. isopleths) at a given percentile (e.g. 95%) to represent the areas where the caribou is likely to be found 95% of the time. Areas visited rarely are excluded from the home range estimate, and as a result, KDE home ranges often consist of multiple polygons and are not continuous.
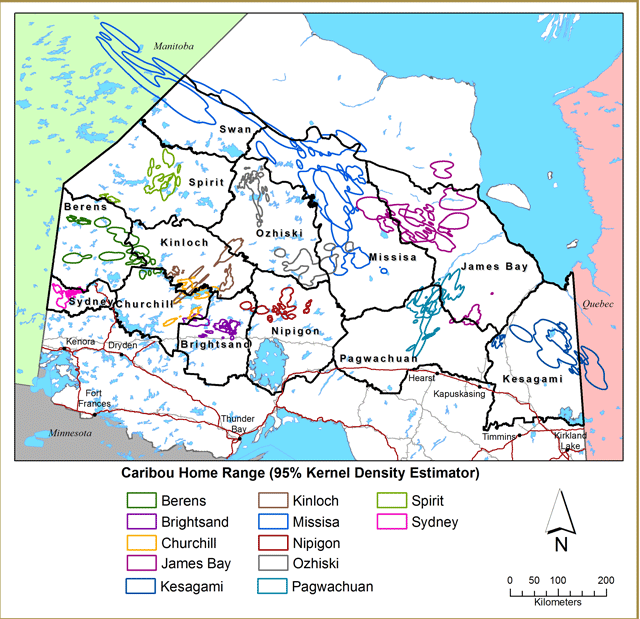
These analyses have provided insight into the amount of space that is essential for individual caribou to meet their life requirements. Annual home range sizes calculated using the MCP method varied from 62 km2 to 51,097 km2 (Table 2-4, Figure 2-12). In contrast, KDE home range sizes ranged from 98km2 to 37,707 km2. Due to the wide degree in variation of sample size (i.e. number of caribou analyzed) between ranges the mean home range sizes calculated for the ranges with higher samples sizes are likely to be more representative of general use of space patterns within their respective ranges than are the mean home range sizes calculated for ranges with smaller sample sizes. Figure 2-12 depicts MCPs that represent the annual home ranges of three collared caribou representative of each range (smallest, largest, and mean home range). Figure 2-13 shows the equivalent KDE home ranges for the same three collared caribou from each range. Generally MCP home ranges were larger than KDE home ranges especially for animals with larger space use for example in the ranges in the Far North of Ontario.
This information helps inform the scale of assessment, planning, and landscape management appropriate for conserving caribou and their habitat. The extent of movement by individual caribou confirms the need to assess caribou, consider amount and arrangement of habitat, and evaluate population health across large areas. Data also suggests that caribou movement and occupancy patterns reflect broad attributes of the landscape such as natural and anthropogenic disturbances, hydrology, and land cover. In general, annual movement of caribou is greater in the north than in the south and greater in the east than in the western portions of northern Ontario.
| Range* (sample size**) | 95% MCP (km2) Mean (Span) | 95% KDE (km2) Mean (Span) |
|---|---|---|
| Berens (n=22) | 1,678 (440 to 8,225) | 1,151 (323 to 4,351) |
| Brightsand (n=6) | 949 (311 to 2,659) | 691 (265 to 1,480) |
| Churchill (n=17) | 633 (62 to 1,279) | 470 (98 to 895) |
| James Bay (n=25) | 6,011 (1,101 to 20,239) | 4,028 (823 to 11,235) |
| Kesagami (n=29) | 3,209 (337 to 9,296) | 2,240 (253 to 9,116) |
| Kinloch (n=52) | 1,307 (299 to 4,082) | 967 (251 to 3,286) |
| Missisa (n=32) | 15,316 (2531 to 51,097) | 9,340 (912 to 30,601) |
| Nipigon (n=34) | 1,102 (205 to 3,632) | 670 (124 to 1,964) |
| Ozhiski (n=5) | 3,150 (1,025 to 7,288) | 1,171 (428 to 2,053) |
| Pagwachuan (n=30) | 3,000 (354 to 6,564) | 2,2201 (199 to 5,180) |
| Spirit (n=19) | 1,467 (271 to 3,569) | 1000 (234 to 2,112) |
| Swan (n=1) | 44,183 | 37,707 |
| Sydney (n=9) | 536 (333 to 840) | 435 (205 to 786) |
*Caribou were assigned to a range where they spent the majority of time within a year.
**208 caribou used in analysis for which “281 caribou years” were analyzed. Note that not all animals were collared for the full four year duration. A collared caribou assigned to a particular range in one year may be assigned to a different range in a subsequent year based on the range assignment (*).
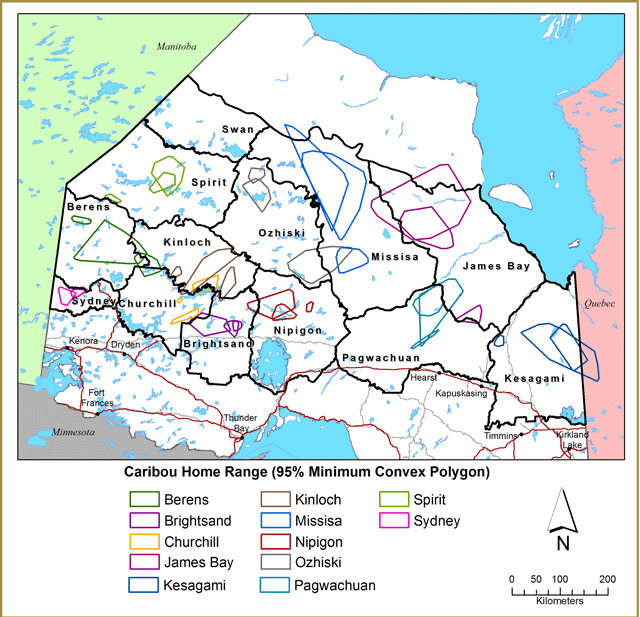
Enlarge Figure 2-12. Caribou home range (PDF)
Examples of the annual home ranges of three collared caribou representative of each range (smallest, largest, and the mean home range) as determined by MCP. Note: MCP for Swan Range was not mapped as only one animal met the criteria for the analysis and therefore it was not representative of an annual home range.
Enlarge Figure 2-13. Caribou home range (PDF)
Examples of the annual home ranges of three collared caribou representative of each range (smallest, largest, and the mean home range) as determined by KDE. Note: KDE for Swan Range was not mapped as only one animal met the criteria for the analysis and therefore it was not representative of an annual home range.
2.4 Probability of occupancy
Probability of occupancy is a calculated index of caribou occupancy used for tracking long-term trends in range occupancy patterns, and monitoring the stability of the southern boundary of the Continuous Distribution in Ontario (MNRF 2014c). Probability of occupancy was used as the method for characterizing and tracking caribou distribution in Ontario for the purposes of monitoring long-term trends in distribution, or extent of occurrence. Species distribution (occupancy) models can be powerful tools for conservation and management as they can be used to track changes in distribution over time, particularly when monitoring elusive, wide-ranging species with large space requirements such as caribou. This method uses observation information from the two stage winter surveys in conjunction with habitat data to model the likelihood that caribou occupy a specific area.
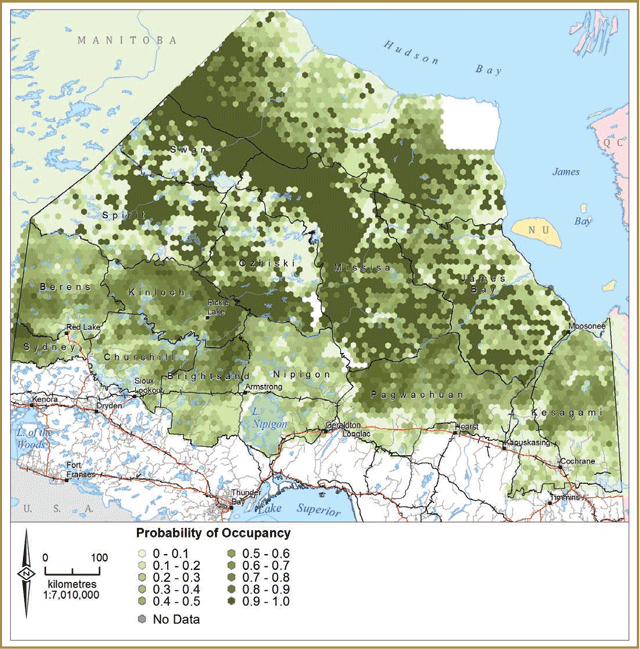
Probability of occupancy (Figure 2-14) across Ontario was estimated using various habitat models: for the ranges in the Far North of Ontario, one model per ecozone was used (Poley et al. 2013) and for the more southern ranges, there was one model per range. These models were produced using the systematic winter survey distribution observations (from the fixed-wing surveys), detection covariates (factors that might affect whether caribou could be detected), and habitat data covariates (factors likely to represent some degree of habitat selection for meeting the life requirements of caribou). For more details on how probability of occupancy was obtained for each range, please see the individual IRAR (MNRF 2014g) for that range.
As the province-wide probability of occupancy is supported by various independently developed models, it would be inappropriate to explicitly compare the probabilities from one model with probabilities from another model. For example, it would be inappropriate to compare the probabilities within the Sydney Range with those of the Spirit Range. However, it would be appropriate to compare the general and relative patterns of occupancy. Details of calculations and use of covariates are documented by Berglund et al. (2014) and in individual IRARs (MNRF 2014d-k). Additional discussion of the survey characteristics associated with caribou detection and the landscape attributes associated with caribou occupancy in the ecozones in the Far North of Ontario can be found in Part 3, Section 2.2.3 and in Poley et al. (2013).
Consistently high probability of occupancy was observed along the ecozone boundary between the Hudson Bay Lowlands and Ontario Shield Ecozones that runs from the south-western portion of the Missisa Range to the northern range boundary of the Missisa, and west through the Swan Range to the Manitoba border (Figure 2-14) (MNRF 2014g). High probabilities within the Spirit, Swan, and Ozhiski Ranges were associated with large peatland complexes (MNRF 2014g). All ranges in the Far North of Ontario had lower caribou occupancy in areas with young forest (MNRF 2014g). Details of the data analysis for each range are described in the individual IRARs (MNRF 2014d-k).
In the more southern ranges, the highest probabilities of occupancy were correlated with mature conifer forest (≥36 years old), treed bog, or sparse forest (MNRF 2014d-f, h-k). Low probabilities were correlated most strongly with areas exhibiting abundant disturbance or young forest (<36 years old, early succession) (MNRF 2014d-f, h-k). Occupancy patterns were comparatively high in the vicinity of Wabakimi (Brightsand Range) (MNRF 2014e) and Woodland Caribou (Berens and Sydney Ranges) Provincial Parks (MNRF 2014d, k).
Factors that may influence the interpretation of results may include variation in survey conditions, quantity and quality of habitat data used as habitat covariates, and the dynamics of forest habitats through the actions of fire, growth, succession, or anthropogenic activities.
2.6 Current southern distribution
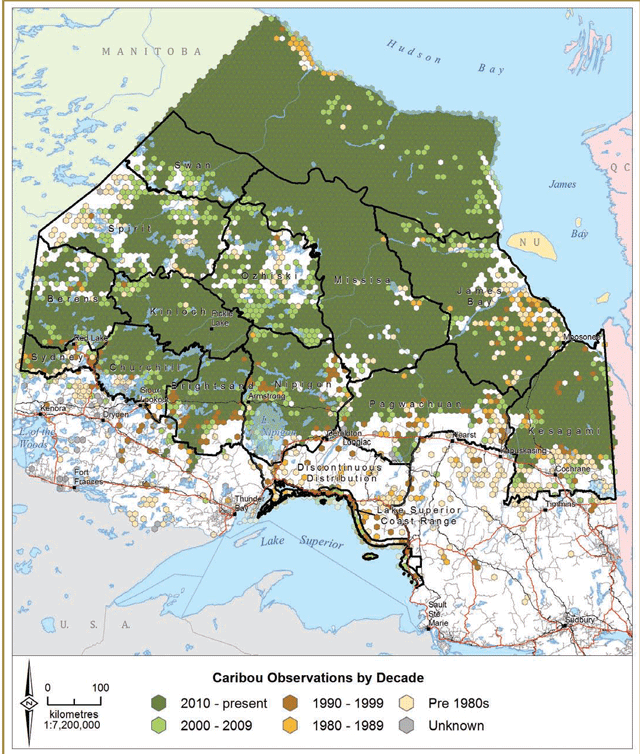
The CCP identified the need to provide baseline data on range occupancy near the southern edge of the Continuous Distribution of caribou in Ontario (MNR 2009). Historical caribou observations were obtained from LIO (LIO 2013b) and may include observational data results from surveys, collared caribou, research projects, as well as credible casual observations from MNRF staff and the general public (Figure 2-15) These observations illustrate the gradual erosion of the southern distribution over the time. Absence of observations may reflect low survey effort, lack of reporting, incomplete records, observations that do not meet the minimum standards or the absence of caribou.
Enlarge Figure 2-14. Probability of occupancy (PDF)
Models within the more southern ranges and the Kinloch Range were created independently and cannot be compared across ranges. Details of these models can be found in the Integrated Range Assessment Reports (MNRF2014d-k). Two models were created for the Far North ranges (Pond in Berglund et al. 2014).
Enlarge Figure 2-15. Caribou observations (PDF)
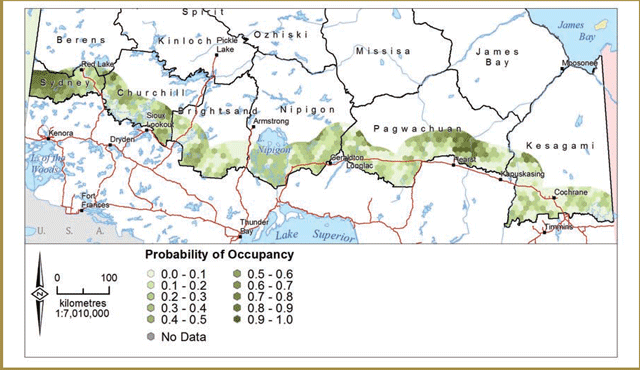
A change in the probability of occupancy near the southern extent of the Continuous Distribution may be one of the best indicators of whether range recession is continuing or has been halted. In the example below (Figure 2-16), the probability of occupancy was determined for an area 50 km north of the current southern boundary of Continuous Distribution. This will be used as a benchmark representing the year 2013 moving forward. The probability of occupancy was determined from the two-stage winter distribution surveys and covariates (2010-2012). Table 2-5 provides statistics related to occupancy within this band for each range evaluated.
| Range | # cells | Mean* | Stand. Dev. | Median | Min | Max | Range | Stand. Error |
|---|---|---|---|---|---|---|---|---|
| Berens | 24 | 0.23 | 0.13 | 0.20 | 0.06 | 0.51 | 0.44 | 0.03 |
| Sydney | 94 | 0.51 | 0.27 | 0.50 | 0.06 | 0.93 | 0.88 | 0.03 |
| Churchill | 109 | 0.26 | 0.19 | 0.21 | 0 | 0.89 | 0.89 | 0.02 |
| Brightsand | 119 | 0.16 | 0.15 | 0.11 | 0 | 0.59 | 0.59 | 0.01 |
| Nipigon | 140 | 0.24 | 0.11 | 0.26 | 0 | 0.63 | 0.63 | 0.01 |
| Pagwachuan | 246 | 0.26 | 024 | 0.18 | 0 | 0.95 | 0.95 | 0.02 |
| Kesagami | 199 | 0.13 | 0.14 | 0.09 | 0.01 | 0.80 | 0.79 | 0.01 |
2.7 Genetic connectivity
As outlined in the goal of the CCP, genetic analysis was conducted to better understand functional connectivity including movement patterns and how different groups are socially connected or isolated throughout Ontario. Genetic materials were obtained in a non-invasive manner by collecting fresh caribou fecal pellets throughout various monitoring and assessment activities and through the Research Program.
Preliminary analysis reveals that no evidence of genetic isolation exists among caribou within the Continuous Distribution. Caribou occupying the Far North of Ontario (Thompson and Wilson in Berglund et al. 2014) exhibit a higher level of genetic diversity than caribou to the south. In general, caribou residing in the Kesagami Range (and to a lesser extent in the Nipigon, Brightsand, and Churchill Ranges) are less genetically connected to caribou elsewhere in the province. It is notable that the area along the Shield/Lowlands Ecozone boundary contains animals with a diverse genetic component compared with those further east and south.
At present, the high degree of genetic similarity across the Far North of Ontario may be attributed to the extent of movement and the relatively continuous occupancy patterns across the Shield/Lowlands Ecozone boundary.
2.8 Conclusion
Monitoring and assessment activities included: winter distribution surveys and observations, probability of occupancy calculations, minimum animal counts, calf recruitment data, calculation of disturbance footprints, habitat assessments (evaluating the amount and arrangements of habitat components).
The IRARs were developed from data collected from monitoring and assessment activities in accordance with the CCP. This information along with detailed assessment methods resulted in the determination of range condition in the Continuous Distribution (MNRF 2014d-k).
Monitoring and assessment efforts of caribou within the Continuous Distribution of Ontario have enabled comprehensive evaluation of the current state of caribou populations and habitat – two key components for the protection and recovery of caribou in Ontario.
Abraham, K.F., B.A. Pond, S.M. Tully, V. Trim, D. Hedman, 2012 Chenier, and G.D. Racey. 2012. Recent changes in summer distribution and numbers of migratory caribou on the southern Hudson Bay coast. Rangifer Special Issue 20:269-276
Berglund, N.E., G.D. Racey, K.F. Abraham, G.S. Brown, B.A. Pond, and L.R. Walton. 2014. Woodland caribou (Rangifer tarandus caribou) in the Far North of Ontario: Background information in support of land use planning. Draft. Technical Report TR-147, Ministry of Natural Resources, Thunder Bay, Ontario. 160 pp.
Brown, G.S., W.J. Rettie, R.J. Brooks, and F.F. Mallory. 2007. Predicting the impacts of forest management on woodland caribou habitat suitability in black spruce boreal forest. Forest Ecology and Management 245: 137-147.
Elkie P., K. Green, G. Racey, M. Gluck, J. Elliott, G. Hooper, R. Kushneriuk, and R. Rempel, 2012. Science and Information in support of Policies that address the Conservation of Woodland Caribou in Ontario: Occupancy, Habitat and Disturbance Models, Estimates of Natural Variation and Range Level Summaries. Electronic Document. Ontario Ministry of Natural Resources, Forests Branch. Species at Risk Branch.
Environment Canada (EC). 2008. Scientific review for the identification of critical habitat for woodland caribou (Rangifer tarandus caribou), boreal population, in Canada. Environment Canada. Ottawa, Ontario. 72 pp. + Appendices.
EC. 2011. Scientific Assessment to Inform the Identification of Critical Habitat for Woodland Caribou (Rangifer tarandus caribou), Boreal Population, in Canada: 2011 Update. Environment Canada, Ottawa, Canada. 102 pp. + Appendices.
Ferguson, S.H. and P. Elkie. 2004. Seasonal movement patterns of woodland caribou (Rangifer tarandus caribou). Journal of Zoology 262(2): 125-134.
Land Information Ontario (LIO). 2013a. Far North Land Cover. Land Information Ontario Warehouse. Peterborough, Ontario. Ministry of Natural Resources. Date of Use: 01 June 2013.
LIO. 2013b. Species Observation, Provincially Tracked. Land Information Ontario Warehouse. Peterborough, Ontario. Ministry of Natural Resources. Date of Use: 01 June 2013.
LIO. 2014. Land Information Ontario Warehouse. Peterborough, Ontario. Ministry of Natural Resources. Digital Database available.
Ministry of Natural Resources (MNR). 2009. Ontario’s woodland caribou conservation plan. MNR, Queen’s Printer for Ontario. Toronto, Ontario, Canada. 24 pp.
Ministry of Natural Resources and Forestry [MNRF]. 2014a. Delineation of Woodland Caribou Ranges in Ontario. MNRF, Species at Risk Branch, Thunder Bay, Ontario.
MNRF. 2014b. Range Management Policy in Support of Woodland Caribou Conservation and Recovery. Species at Risk Branch, Thunder Bay, Ontario. 11 pp.
MNRF. 2014c. Integrated Assessment Protocol for Woodland Caribou Ranges in Ontario. Species at Risk Branch, Thunder Bay, Ontario. 104 pp.
MNRF. 2014d. Integrated Range Assessment for Woodland Caribou and their Habitat: Berens Range 2012. Species at Risk Branch, Thunder Bay, Ontario.
MNRF. 2014e. Integrated Range Assessment for Woodland Caribou and their Habitat: Brightsand Range 2011. Species at Risk Branch, Thunder Bay, Ontario.
MNRF. 2014f. Integrated Range Assessment for Woodland Caribou and their Habitat: Churchill Range 2012. Species at Risk Branch, Thunder Bay, Ontario.
MNRF. 2014g. Integrated Range Assessment for Woodland Caribou and their Habitat: Far North Ranges 2013. Species at Risk Branch, Thunder Bay, Ontario.
MNRF. 2014h. Integrated Range Assessment for Woodland Caribou and their Habitat: Kesagami Range 2010. Species at Risk Branch, Thunder Bay, Ontario.
MNRF. 2014i. Integrated Range Assessment for Woodland Caribou and their Habitat: Nipigon Range 2010. Species at Risk Branch, Thunder Bay, Ontario.
MNRF. 2014j. Integrated Range Assessment for Woodland Caribou and their Habitat: Pagwachuan Range 2011. Species at Risk Branch, Thunder Bay, Ontario.
MNRF. 2014k. Integrated Range Assessment for Woodland Caribou and their Habitat: Sydney Range 2012. Species at Risk Branch, Thunder Bay, Ontario.
MNRF. 2014l. Draft Wildland Fire Management Strategy for Ontario. Draft – for EBR registry posting – August 13, 2014. Peterborough, Ontario. 20 p.
Ontario Ministry of Natural Resources (OMNR). 2014. Forest Management Guide for Boreal Landscapes. Toronto: Queen’s Printer of Ontario. 104 pp.
Ontario Woodland Caribou Recovery Team (OWCRT). 2008. Recovery Strategy for the Woodland Caribou (Rangifer tarandus caribou) (Forest-Dwelling, Boreal Population) in Ontario, July 2008. Prepared for the Ontario Ministry of Natural Resources, Peterborough, Ontario, Canada. 98 pp.
Poley, L.G., B.A. Pond, J.A. Schaefer, G.S. Brown, J.C. Ray & D.S. Johnson. 2013. Occupancy patterns of large mammals in the Far North of Ontario under imperfect detection and spatial autocorrelation. Journal of Biogeography. 1-11.
Pond, B.A 2014. Ecotype Differentiation. pp. 43-49 in Berglund, N.E., G.D. Racey, K.F. Abraham, G.S. Brown, B.A. Pond, and L.R. Walton. 2014. Woodland caribou (Rangifer tarandus caribou) in the Far North of Ontario: Background information in support of land use planning. Technical Report TR-147, Ministry of Natural Resources and Forestry, Thunder Bay, Ontario. 160 pp.
Thompson, L., and P.J. Wilson. Genetic structure. pp. 83-88 in Berglund, N.E., G.D. Racey, K.F. Abraham, G.S. Brown, B.A. Pond, and L.R. Walton. 2014. Woodland caribou (Rangifer tarandus caribou) in the Far North of Ontario: Background information in support of land use planning. Technical Report TR-147, Ministry of Natural Resources and Forestry, Thunder Bay, Ontario. 160 pp.
Wilson, K. 2013. Temporal and spatial variation in home range size for two woodland caribou ecotypes in Ontario. Master’s Thesis, Trent University, Peterborough, Ontario, Canada.