Strategies for Minimizing the Disinfection By-Products Trihalomethanes and Haloacetic Acids
This report outlines simple, affordable strategies to minimize the formation of trihalomethanes and haloacetic acids when chlorinating drinking water.
Section 6.9: “In Ontario, a combined chlorine residual measurement below the 0.25 mg/L lower limit requires an adverse water quality notice to be issued, which may only be removed if corrective action is taken consisting of raising the residual to 0.25 mg/L or higher.”
Ce document hautement spécialisé n’est disponible qu’en anglais en vertu du règlement 411/97, qui en exempte l’application de la Loi sur les services en français. Pour obtenir de l’aide en français, veuillez communiquer avec le ministère d l’Environnement au 416 314-7933.
Acknowledgements
The Strategies of Minimizing the Disinfection By-Products Trihalomethanes and Haloacetic Acids were prepared under the guidance of the Ontario Ministry of the Environment (MOE) with the assistance of R.V. Anderson Associates Ltd. in association with Andrews, Hofmann and Associates Inc. This document underwent review by various branches of the MOE.
Introduction (1.0)
This report outlines simple, affordable strategies to minimize the formation of trihalomethanes (THMs) and haloacetic acids (HAAs) when chlorinating drinking water. These strategies include:
- Eliminating pre-chlorination / moving the chlorination point
- Practicing enhanced coagulation
- Optimizing chlorine dosing through disinfection benchmarking
- Switching to chloramines for secondary disinfection.
Case studies are presented, followed by flow charts providing implementation guidance for each strategy. A brief section on more capital-intensive alternative approaches to minimizing disinfection by-products is also provided at the end of the report.
Utilities must always ensure that they are achieving adequate disinfection to satisfy microbiological water quality standards and that pathogen control is maintained as the highest priority when considering implementing any of the disinfection by-product minimization strategies that are discussed here.
Consider Eliminating Pre-Chlorination (2.0)
Pre-chlorination is the addition of chlorine at an early point in the treatment train. Common reasons for pre-chlorinating include minimizing biological slime formation on filters, pipes, and tanks, controlling zebra mussels at the raw water intake, and oxidizing hydrogen sulfide or reduced iron. A problem with pre-chlorination is that chlorine is applied to water where it contains the highest concentration of natural organic matter (NOM). NOM reacts with chlorine to form disinfection by-products (DBPs) such as trihalomethanes (THMs) and haloacetic acids (HAAs). Ideally, chlorination should be delayed until as much NOM is removed from the water as possible through treatment processes such as coagulation, sedimentation and filtration, unless this compromises pathogen inactivation as defined by CT credits.
2.1 Benefits of potentially eliminating pre-chlorination
Studies have shown that moving the point of chlorination from the plant intake to downstream of sedimentation or filtration can significantly reduce THM formation, sometimes by over 50% (e.g. Singer and Chang, 1989). The actual magnitude of the benefits will be site-specific, but overall this strategy is one of the most important and simplest strategies to implement.
2.2 Drawbacks of potentially eliminating pre-chlorination
The elimination of pre-chlorination is not straightforward if it is being used for a purpose. In cases where pre-chlorination is needed for zebra mussel control at the plant intake, eliminating pre-chlorination entirely may not be a viable option. In this case, care should be taken to ensure that chlorine doses applied at the intake are not unnecessarily high. Furthermore, strategies such as intermittent chlorination, or alternative disinfectants, can be explored.
Pre-chlorination has also been traditionally used for controlling biological slime formation in the treatment plant. In many cases such practices are not necessary, as evidenced by the great number of plants that operate successfully without any pre-chlorination. Utilities that apply pre-chlorination solely on the basis of tradition should carefully re-evaluate this practice. For plants requiring pre-chlorination to oxidize chemical contaminants such as iron, consideration can be given to alternate oxidants such as permanganate or aeration.
2.3 Consideration of CT when potentially eliminating pre-chlorination
Primary disinfection compliance is measured based on CT values, which is the residual disinfectant concentration (C) multiplied by the contact time (T). When moving a point of chlorination downstream, utilities must consider the impact of reduced contact time available for disinfection. Pathogen inactivation when defined as CT can potentially be maintained by increasing the chlorine concentration through a disinfection zone to compensate for reduced contact time (USEPA, 1999a; Ontario MOE, 2006), however, the resulting chlorine residual must not exceed maximum chlorine residual limits (4.0 mg/L) (Ontario MOE, 2006).
In addition to evaluating residual disinfectant concentrations, the hydraulic conditions of the downstream processes must be examined to determine if adequate contact time is available. For example, moving the chlorination point downstream of filtration will often mean that clearwells are relied upon for providing chlorine contact time. Improperly baffled clearwells may exhibit hydraulic short-circuiting. If clearwell contact time is required to maintain pathogen inactivation compliance then improved baffling may be needed to achieve sufficient contact time.
2.4 Implementation guidance for eliminating pre-chlorination
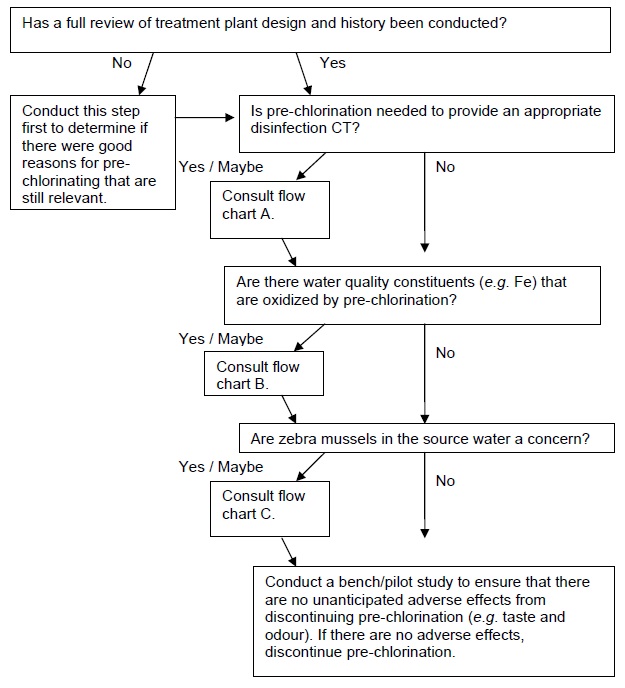
This section provides flow charts outlining the questions to be asked and steps to be taken in eliminating pre-chlorination as a DBP minimization strategy. The first important step is to identify why pre-chlorination is currently practiced, as this will influence subsequent options/actions. If pre-chlorination is used to achieve a portion of the required disinfection CT in the treatment plant, consult flow chart A. If pre-chlorination is used for oxidation (e.g. iron), consult flow chart B. If pre-chlorination is used for zebra mussel control, consult flow chart C. If pre-chlorination is used for more than one of these reasons, then each relevant flow chart should be consulted and only a solution that satisfies each application should be implemented. If there is no specific reason for pre-chlorinating that can be identified (e.g. the treatment plant was designed with pre-chlorination many years ago and has always been operated the same way), consult flow chart D.
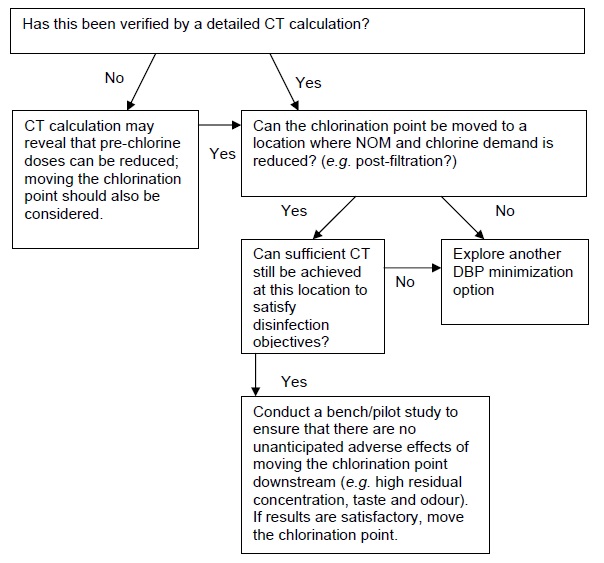
A. Pre-chlorination is needed for disinfection CT
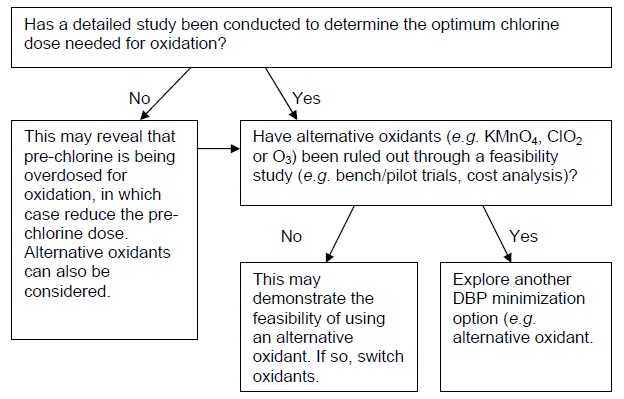
B. Pre-chlorination is needed for oxidation (e.g. Fe)
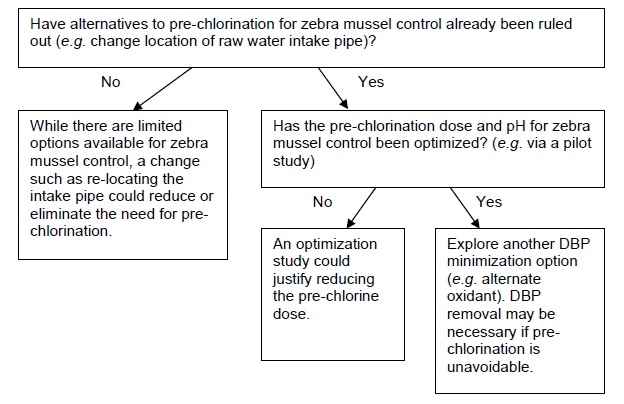
C. Pre-chlorination is for zebra mussel control
D. Pre-chlorination is practiced for no specific reason
Practice Enhanced Coagulation (3.0)
Coagulant doses are often selected by monitoring post-filter turbidity or colour. The optimum coagulant doses for removing the NOM precursors to DBPs, however, may be different from the doses for turbidity or colour removal. Enhanced coagulation refers to modification of the coagulation process to focus on the removal of the NOM. These modifications typically include adjusting the pH, changing the coagulant type or coagulant dose, and/or using a coagulant aid (e.g. polymer) in such a way that improves NOM removal. Enhanced coagulation often represents one of the simplest DBP strategies to adopt since it may require only modification of current coagulation practices.
3.1 General procedure
Enhanced coagulation usually involves conducting jar tests on a regular basis, and determining the optimum combination of coagulant type, coagulant dose, and pH, for the removal of organic DBP precursor compounds. Since it is not possible to directly measure DBP precursor compounds, total organic carbon (TOC) is used as a surrogate. Thus, jar tests are conducted to identify coagulation conditions that remove the maximum amount of TOC from the water. Since water quality changes with time, the optimum coagulant conditions will also change with time. Strictly speaking, this means that jar tests should be conducted whenever raw water quality changes so that the new optimum coagulation conditions can be identified. Many plants operate this way, with jar tests performed daily or weekly. Other plants, with more stable raw water quality, or more predictable changes in raw water quality, can learn over time which coagulation conditions optimize TOC removal, and can reduce the number of jar tests conducted. There is no simple rule to follow in terms of how often jar tests should be performed: it must be determined on a site-specific basis.
It is beyond the scope of this document to outline specific protocols for conducting jar tests to implement enhanced coagulation. A proper jar test is not trivial. It is recommended that the utility work with a consultant or a chemical supplier to set up an appropriate jar testing protocol to ensure that coagulation is optimized for TOC removal.
3.2 pH modification and source water alkalinity
Enhanced coagulation may require adjusting the pH to an optimal pH range for coagulants to be most effective for NOM removal. For alum, the optimum range is typically between pH 5-6, while for iron-based coagulants the optimum range is pH 4-5 (Kavanaugh, 1978; Semmens and Field, 1980). The influence of pH can be significant: for example, in one study, a drop of one pH unit caused a 25% increase in DBP precursor removal for the same coagulant dose (Semmens and Field, 1980). The effectiveness of pH control during coagulation can be easily explored through jar tests by applying small amounts of acid (e.g. sulfuric acid) or base (e.g. caustic) to the water samples in the jars. It is important to determine if pH reduction via the addition of acid may be cost effective when compared to an increase in coagulant dose for the same purpose.
While pH control using acids and bases may appear to increase chemical costs, in certain cases it has been found that pH modification can reduce overall chemical costs by allowing lower coagulant doses to be used to achieve equivalent levels of NOM removal (Chadik and Amy, 1983). Alkalinity must also be taken into account as high alkalinity types of waters may require a significant amount of acid or base to be added to achieve a desired pH change.
Note that the effect of pH control on removing TOC is limited to the treatment processes up to and including filtration. Following filtration, there is no need to maintain a low pH to remove TOC. In fact, the pH will likely need to be raised again to prevent distribution system corrosion.
3.3 Coagulant dose and type
Enhanced coagulation can also involve adjusting the coagulant dose or coagulant type. Organics removal, typically defined in terms of TOC, in most cases will increase with coagulant dose (Kavanaugh, 1978; Semmens and Field, 1980). The coagulant dose required for optimum organics removal is usually higher than the dose required for optimum turbidity removal (Semmens and Field, 1980), however it can be lower (Kavanaugh, 1978) or sometimes turbidity removal can be optimized at approximately the same coagulant dose (Chadik and Amy, 1983). Therefore, site-specific factors are important in balancing the removal of organics and turbidity by coagulation.
In terms of which coagulant to use, jar tests should be conducted to explore the wide range of products available. Some investigators in the past have tried to generalize which classes of coagulants perform best for TOC removal (e.g. aluminum-based or iron-based). While it has been sometimes observed that iron-based coagulants are slightly superior for waters requiring high coagulant doses, and aluminum-based coagulants are superior for waters requiring low coagulant doses (Edwards, 1997), overall, such generalizations are not useful for a single, specific water, and jar tests should be conducted.
3.4 Coagulant aids
Coagulant aids such as cationic polymers on their own are not as efficient as traditional coagulants for organics removal (Lindqvist et al., 2004), however, when used in combination with traditional coagulants, they can reduce coagulant doses that are required for optimum removal of organics and they can also improve the overall reduction of DBP formation potential. Coagulant aids can also improve the settleability of floc when high coagulant doses are used (USEPA, 1999b). As such, coagulant aids should be evaluated in a jar testing program to determine optimum coagulation conditions.
3.5 Potential secondary effects of enhanced coagulation
When considering implementing enhanced coagulation it is important to consider the potential secondary effects on water quality and downstream processes, some of which are beneficial and some of which are harmful. Examples may include increased or decreased sludge production, changes in filter run times, changes in disinfection efficiency, and others. Bench and/or pilot testing prior to full-scale implementation of enhanced coagulation may be used to identify any potential problems and develop mitigation strategies.
3.5.1 Inorganic contaminants
Enhanced coagulation can result in changes of finished water concentrations of inorganic contaminants, including manganese, iron, and aluminum. Manganese is typically removed by direct oxidation in water treatment. An oxidant transforms manganese from a dissolved state to a solid that can be removed during sedimentation and filtration (Knocke et al., 1990). The lowered pH of enhanced coagulation hinders the direct oxidation process because the oxidation rate of manganese decreases as pH decreases. However, if the manganese is completely oxidized before the coagulation process, enhanced coagulation should have no impact on the oxidation process (USEPA, 1999b). If manganese is oxidized after the coagulation process (e.g. intermediate ozonation) pH depression will affect the efficiency of the removal process. Also, manganese may be present in some ferric chloride and ferric sulfate coagulant solutions, therefore if a utility switches to using high doses of ferric coagulant, the coagulant itself may increase dissolved manganese concentrations.
Switching to an iron-based coagulant from alum or increasing the dose of an existing ferric coagulant may result in increased dissolved iron concentrations in the finished water. However, if proper coagulation pH is maintained, problems with dissolved iron are typically minimal (USEPA, 1999b).
Aluminum can pass through filters and cause problems in distribution systems. Soluble aluminum can precipitate post-filtration, leading to turbidity and customer complaints. Also, aluminum deposition in the distribution system can potentially lead to reduced hydraulic capacity (Kriewall, 1996). The minimum solubility of aluminum occurs at pH 6.2-6.5; utilities operating at a pH less than 6.0 that do not increase the pH before filtration may be impacted the most (USEPA, 1999b).
3.5.2 Corrosion control
Corrosion in the distribution system is dependent on a number of water quality factors including pH, alkalinity, aluminum, TOC, sulfate, chloride, hardness, oxygen levels, and disinfectant residual, all of which can change when enhanced coagulation is implemented. If a utility identifies or suspects a problem with corrosion of distribution system materials, Table 3.1 can be used to identify the water quality parameters that increase the corrosion rate. The first two columns list the finished water quality parameters of concern and the effect of enhanced coagulation on each. A ‘+’ indicates this parameter will increase due to enhanced coagulation and ‘-’ indicates the parameter will decrease due to enhanced coagulation. The last five columns predict how this water quality parameter change will impact the corrosion of various piping materials (e.g. either an increase ‘+’ or decrease ‘-’ in corrosion). For example, an increased sulfate concentration resulting from enhanced coagulation using alum (which is aluminum sulfate) would be expected to decrease lead corrosion but increase copper and iron corrosion.
| Water Quality Parameter | Effect on Parameter due to Enhanced Coagulation | Impact on Corrosion of: | ||||
|---|---|---|---|---|---|---|
| Lead | Copper | Iron | Lead from Brass | Concrete | ||
| TOC | - | No impact | + | - | - or No impact | + or No impact |
| Alkalinity | - | + | - | + | + | + |
| Aluminum | + or No change | + | + | Unknown impact | Unknown impact | + or - |
| pH | - or No change | + | + | + | + | + |
| Sulfate | + or No change | - | + | + | - | No impact |
| Chloride | + or No change | + | - | + | + | No impact |
3.5.3 Impact on disinfection processes
Enhanced coagulation will influence disinfection processes by changing the pH and the disinfectant demand. When considering a typical water treatment pH operating range (5.5- 9.5), decreasing pH tends to improve the disinfection performance of chlorine (USEPA 1999a, 1999b).
Enhanced coagulation also removes organic matter which exerts a chemical disinfectant demand. In this sense, enhanced coagulation can reduce the chemical disinfectant doses that are required for disinfection such that a lower disinfectant dose may be used to obtain a desired CT value.
3.5.4 Particle and pathogen removal
The optimum pH for NOM removal by enhanced coagulation is not necessarily the optimum pH for turbidity removal (Kavanaugh, 1978; USEPA, 1999b). The low pH and high coagulant dose conditions of enhanced coagulation may result in destabilization of particles and an increase in settled water turbidity (Carlson et al., 1996). In some cases, enhanced coagulation may produce floc that is lighter and more fragile. This can result in floc carryover from sedimentation tanks to filters which may result in shorter filter runs and an increase in backwash requirements (USEPA, 1999b). The use of polymers can be considered to aid particle removal or for optimizing filter operation (USEPA, 1999b).
3.5.5 Residuals handling
Enhanced coagulation may result in an increase in the quantity of residuals (sludge) produced during coagulation, sedimentation, and filtration. The increased solids will result from increased coagulant doses and also the increase in the amount TOC in the sludge (Hecht et al., 1993). To determine whether the increase will be significant, the increase in sludge quantity should be estimated and compared to the available additional capacity of the system.
3.5.6 Operation and maintenance impacts
Changing from an operational strategy that is designed to remove turbidity to one that includes TOC removal may dictate some changes in the operation and maintenance of the coagulation process. For example, greater vigilance by operators to control floc carryover from the sedimentation tanks to filters may be required. Increased coagulant doses may also increase the required sludge removal frequency (USEPA, 1999b).
3.5.7 Recycle streams
Enhanced coagulation can affect recycle streams in a treatment plant. For example, the quality of the recycle water may be improved (e.g. less organic content), which may change the recycle treatment efficiency. An increase in recycle stream volume may also result indirectly from enhanced coagulation (e.g. if filters must be backwashed more frequently), which may require expansion of recycle stream handling/treatment if there is insufficient additional capacity (USEPA, 1999b).
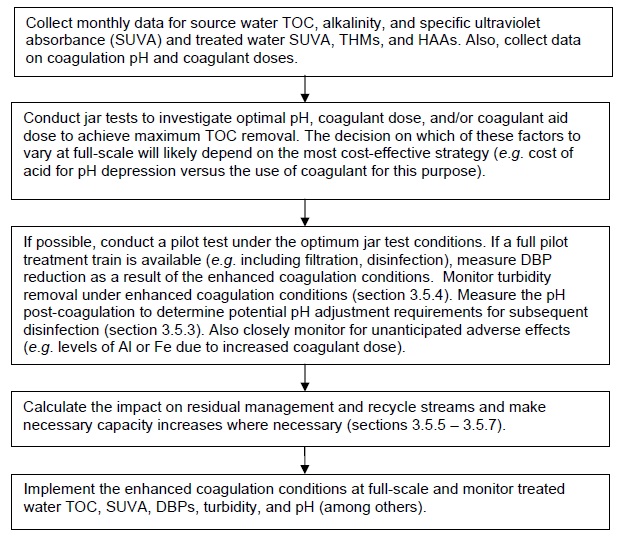
3.6 Implementation guidance for enhanced coagulation
Flow chart E below outlines the key steps.
E. Implementing enhanced coagulation for DBP minimization
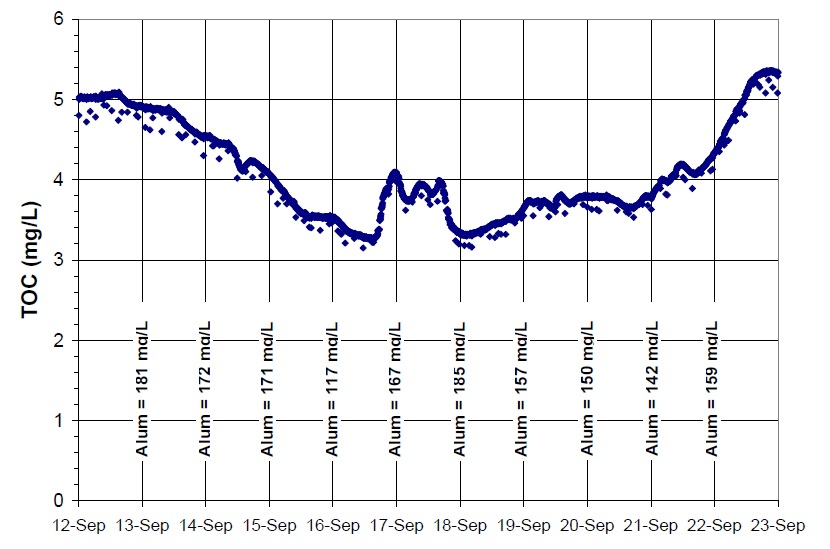
3.7 Case Study - Benefits of Online TOC monitoring
An online TOC analyzer may be useful in tracking changes associated with adjustments to coagulant dose when attempting to reduce DBP precursors. For example, coagulant dose can be increased gradually over several days to explore the impact on treated water TOC, assuming that reductions in TOC will correspond to reductions in DBP formation. From the online TOC data, a point of diminishing returns can be identified from the full-scale data, representing a possible optimum coagulant dose for those water quality conditions. An example of online TOC data is shown in Figure 3.2, taken over a period of two weeks at an Ontario plant during a period of rapid raw water quality changes.
Figure 3.2: Treated Water TOC Levels with Coagulant Dose (online TOC analyzer results)
Effectiveness of Chlorination at Different pH Levels (4.0)
Adjusting pH can help to minimize DBPs in several ways. pH dictates which form of free chlorine is present in the water, either in its strong disinfectant form (HOCL) at acidic pH (e.g. pH less than 7) or in the weak disinfectant form (OCl-) at basic pH (e.g. pH greater than 8). Adjusting the pH to a lower value can therefore allow the application of smaller chlorine doses to achieve equivalent levels of primary disinfection. In turn, the smaller chlorine doses can lead to less DBP formation. CT tables for various pH values are reported by the Ontario Ministry of Environment and can be consulted when estimating the potential reduction of chlorine dose that can be achieved by pH adjustment.
Changes to pH also affect coagulation effectiveness, as discussed in section 3.2. In general, lower pH values (e.g. 6) are better for TOC removal, which in turn leads to less DBP formation when chlorine is applied.
The pH also affects the species of DBPs that are formed. THMs and HAAs are just part of a wide range of different DBPs that have been identified. Experience has shown that decreasing the pH (e.g. from 8 to 6) will lead to lower THM formation, and indeed this has been a common THM minimization strategy in the past. However, the formation of most of the other DBPs follows an opposite trend, and increase at lower pH (Singer and Reckhow, 1999). Many of these other DBPs, while not currently regulated, are believed to be potentially toxic (Bull et al., 2006). From a public health perspective, it is therefore difficult to justify lowering pH solely to reduce THMs. A careful distinction must be made, however, between lowering the pH during chlorination to inhibit THM formation (at the expense of forming other DBPs), and lowering the pH to improve TOC removal through enhanced coagulation. If the pH is lowered during coagulation to enhance TOC removal, then overall DBP formation is likely to be lower, despite the relative shift in speciation away from THMs and towards HAAs, and other DBPs.
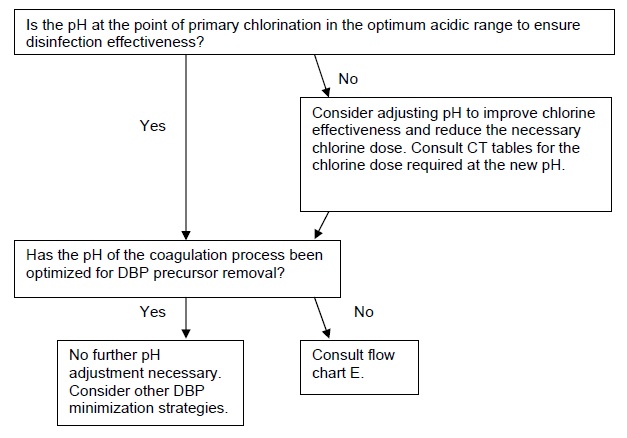
4.1 Implementation guidance for pH adjustment
Flow chart F poses questions to be considered for implementing a DBP minimization strategy based on pH adjustment.
F. Implementing pH adjustments for DBP minimization
Optimize Chlorine Dosing through Disinfection Benchmarking (5.0)
Benchmarking the level of disinfection that is supplied by a treatment plant (in terms of the applied CT) is a recommended practice to ensure that treatment is sufficient to achieve acceptable levels of microbial reduction and to simultaneously examine whether there is scope for optimizing disinfection processes to reduce DBP formation. A simple version of disinfection benchmarking is often used by utilities in which very conservative assumptions are applied without considering the full range of operating conditions that are known to have a dramatic influence on disinfection performance. For example, basic CT calculations often assume simultaneous worst-case (highest) flow rates and (lowest) temperatures. Using such data, a required chlorine dose to meet microbial inactivation regulations is calculated and then applied year-round. However, it is likely that this chlorine dose may only be required briefly, during worst-case conditions, and that for the rest of the year a lower chlorine dose may be sufficient. It is also possible that the worst-case conditions for different parameters (e.g. temperature and flow rate) would never coincide, so calculated CT requirements may be unrealistically over-conservative, resulting in unnecessary DBP formation.
5.1 Disinfection CT benchmarking
Disinfection benchmarking can be easily performed using historical plant operating data (e.g. flow rate, chlorine doses and residuals, water levels in tanks) and water quality data (e.g. temperature, pH) to determine whether there is the potential for reducing chlorine doses at certain times of the year. Tracer tests or computational fluid dynamics (CFD) modeling can also be used to provide improved estimates of the hydraulic contact times provided by unit processes. CFD modeling may be especially useful to identify zones of non-ideal mixing in unit processes which may have a disproportionate influence on contact time and hence on DBP formation. If CFD modeling or tracer analyses are not possible, baffle factors could be estimated based on assumptions about the flow characteristics in the tanks (Table 5.1).
| Baffling condition | T10/T | Baffling description |
|---|---|---|
| Unbaffled | 0.1 | None, agitated basin, very low length to width ratio, high inlet and outlet flow velocities |
| Poor | 0.3 | Single or multiple unbaffled inlets and outlets, no intra- basin baffles |
| Average | 0.5 | Baffled inlet or outlet with some intra-basin baffles |
| Superior | 0.7 | Perforated inlet baffle, serpentine or perforated intra- basin baffles, outlet weir or perforated launders |
| Perfect (plug flow) | 1.0 | Very high length to width ratio (pipeline flow), perforated inlet, outlet, and intra-basin baffles |
5.2 Maintenance of secondary chlorine residual
In many water treatment plants a single chlorine dose is applied to achieve both primary disinfection as well as to maintain a chlorine residual throughout the distribution system. In these cases, a reduction in the chlorine dose in the plant to reduce DBP formation would require ensuring the maintenance of a minimum residual of either 0.05 mg/L as free chlorine or 0.25 mg/L as combined chlorine throughout the distribution system (Ontario MOE, 2006).
In some water supply systems the chlorine residuals in the distribution system may be higher than is strictly required to achieve regulatory minimum residual. This will lead to unnecessary DBP formation in the distribution system. In addition, stagnant zones in distribution systems may also impart longer water ages to fractions of the distributed water, leading to loss of chlorine residual and increased DBP formation. Utilities should collect as much chlorine residual data in their distribution systems as possible and estimate the water age throughout the distribution system using distribution system modeling software (if possible). However, it is more common practice for an adequate secondary disinfectant residual at the extreme ends of the distribution system to be maintained by adjusting the chlorine dose at the treatment plant simply based on experience or trial and error. The flow characteristics and chlorine reactions and chemical interactions in distribution systems can be complex and there is a need in the industry for further work in this area.
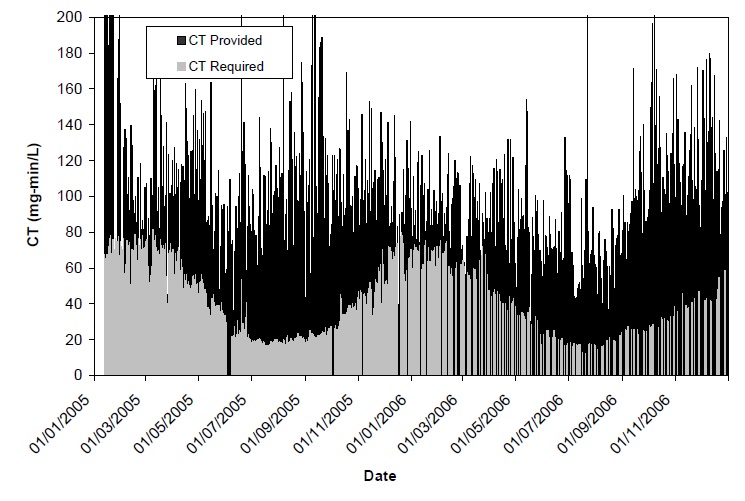
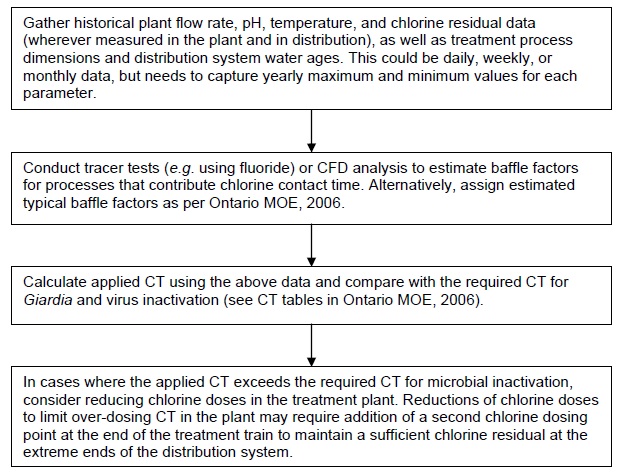
5.3 Case Study
In this case study, a review of disinfection practices was carried out by gathering daily plant operating data (flow rate, chlorine dosing, water levels in tanks, distribution system contact times) and water quality data (pH, temperature) over a full year. CT values were calculated for each day of the year and compared against the CT required for pathogen (Giardia, virus) inactivation requirements tabulated in the “Procedure for Disinfection of Drinking Water in Ontario” (Ontario MOE, 2006).
For the majority of the year, the CT being applied was in excess of the amount needed for regulatory pathogen control targets (Figure 5.1), which meant that there was likely unnecessary DBP formation during treatment and distribution, therefore optimization of the chlorination CT conditions within the treatment plant could prove beneficial. Lower chlorine doses would likely result in lower THM and HAA formation.
Figure 5.1: CT (mg•min/L) provided and required for 1.0-log Giardia inactivation
5.4 Implementation guidance for CT optimization
Flow chart G outlines the major steps for benchmarking and optimizing disinfection CT in a treatment plant.
G. Steps for benchmarking and optimizing disinfection CT
Switch to Chloramination (6.0)
Chloramines, principally monochloramine, do not form THMs and HAAs, so their use as a secondary disinfectant in place of chlorine is an effective way to reduce regulated DBPs. Chloramines are not strong enough disinfectants to replace chlorine for primary disinfection, however. In practice, small amounts of free chlorine may be present along with monochloramine, so some THM and HAA formation is expected during chloramination, however typically at an order of magnitude less than when free chlorine is used. Furthermore, chloramines are usually much more stable than free chlorine, so challenges related to maintaining a disinfectant residual at remote areas of the distribution system are often resolved.
Correct chlorine and ammonia dosing and proper chlorine:ammonia-N ratio are critical factors in the success of chloramination. If either of these are not monitored and maintained at appropriate levels, then undesired chloramines (di- and tri-chloramine) and THMs/HAAs may form or loss of disinfectant residual could occur, which may promote nitrification and bacterial re-growth. Monitoring water quality both before and after chloramination is crucial for responding quickly to changes in distribution system water quality.
6.1 Impact of chloramines on DBP formation
A switch to chloramines in the distribution system should result in a decrease in the concentrations of THMs and HAAs in tap water. In cases where most of the DBP formation occurs within the treatment plant rather than in distribution, switching to chloramines for secondary disinfection will have a less pronounced effect since the THMs and HAAs already formed at the plant will persist, and the benefit attributable to chloramination will be largely in the elimination of additional formation in the distribution system.
While chloramines do not form THMs and HAAs, there are certain other compounds that are known to be chloramination by-products. The most notable is N-nitrosodimethylamine (NDMA). Ontario has a drinking water quality standard of 9 ng/L for NDMA (Ontario MOE, 2003), while California has a 10 ng/L notification level (CEPA, 2014).
6.2 Chloramine stability
The stability of chloramines in the distribution system relative to free chlorine cannot be accurately predicted by theory alone, and is a function of the water quality characteristics, the chlorine:ammonia-N ratio, pH, and the pipe material. In particular, low chlorine:ammonia-N ratios (e.g. less than 5:1 weight ratio) and high pH (e.g. about 8.5) help to promote the formation of monochloramine and minimize dichloramine, which typically results in a more stable residual, but the exact optimum conditions are water-specific.
There are numerous cases reported where the monochloramine half-life in the distribution system was on the order of several weeks. In most cases a switch from free chlorine to monochloramine results in the elimination of any routine problems associated with maintaining a distribution system residual. There is, however, a potentially serious non-routine challenge to maintaining a chloramine residual: nitrification.
6.3 Nitrification by chloramines
Unreacted ammonia can be converted by certain microorganisms into nitrite and nitrate. This is problematic because nitrite exerts a very rapid chloramine demand, leading to loss of chloramine residual and allowing bacterial re-growth. It is therefore important to control the chlorine:ammonia-N ratio properly to minimize the potential for nitrification. The challenge is that in some respects it is beneficial to maintain an excess of ammonia to ensure that monochloramine is the principal chloramine species to avoid taste and odour problems (e.g. a chlorine:ammonia-N ratio of less than 5:1 by weight), however the resulting excess ammonia can encourage nitrification. Chloramination therefore requires careful attention to balancing the ammonia and chlorine concentrations to ensure that both problems are avoided.
It is thought by many that nitrification can only occur in warm climates. It is now known that nitrification can occur at temperatures less than 10oC, if other conditions are right such as long detention times, an excess of ammonia, and low pH. When nitrification occurs, quick solutions include converting the distribution system temporarily back to free chlorine to neutralize excess ammonia, and flushing. Addressing the problem after it occurs is undesirable, however, since treatments such as temporary free chlorination have been observed to cause deterioration in water quality, leading to high heterotrophic plate count (HPC) and coliform bacteria concentrations.
When a utility converts from chlorination to chloramination, excessive water age in storage facilities should be addressed to minimize the potential for nitrification. Operations may be modified to increase water turnover rate and fluctuate water levels more frequently in storage facilities. Storage facilities should be inspected and cleaned on a regular schedule to help limit nitrification.
6.4 Taste and odour from chloramines
The exact chlorine:ammonia-N ratio and pH to minimize the potential for taste and odours may vary from site to site, but in general it has been found that chlorine:ammonia-N weight ratios of less than 5:1 and pH of 8.5 or higher are good operating conditions.
6.5 Biofilm control by chloramines
Chloramines are weaker disinfectants than free chlorine, however research has shown that in many cases they are more effective at suppressing biofilm formation on pipe walls. The theory is that chlorine, which is more reactive than monochloramine, is neutralized at the outer layer of the biofilm and therefore does not penetrate and inactivate the organisms within the film. Furthermore, chlorine is much more reactive with cast iron pipe than monochloramine, and noticeable improvements have been found when switching from chlorine to monochloramine in cast iron distribution systems.
6.6 Corrosivity of chloramines
A more serious and widespread problem associated with chloramination is the deterioration of certain natural rubbers in plumbing. Chloramines have been shown to attack rubbers and elastomers far more aggressively than free chlorine. Many water treatment plants report having to change rubber components with more resistant elastomers that are approved for use with chloramines. It is expected that the general public may also experience more rapid deterioration of rubber plumbing components when chloramines are used, however plants that switch from free chlorine to chloramines rarely report public comments on this subject (Kirmeyer et al., 2004).
6.7 Environmental release of chloraminated water
Chloramines are reportedly more harmful to the environment than free chlorine, due partly to an inherently greater toxicity to aquatic life and to their greater stability.
The unintentional release of chloraminated water into the environment has been cited as a significant concern by many and must be one of the factors considered when evaluating a change to a chloraminated distribution system.
6.8 Sensitive subpopulations to chloramines
Dialysis patients and fish hobbyists are the two major subpopulations that are sensitive to chloramines, although other specific groups, such as industries that rely on tap water of a certain quality, will also be affected. A switch to chloramines must therefore be communicated to the public and all water customers. Methods that have been reportedly used in the past include:
- Direct notification to dialysis centers
- Direct notification to fish hobbyist stores
- Direct notification to hospitals
- Direct notification to universities and colleges
- Direct notification to research centers
- Direct notification to hydroponics growers
- Information in bills
- Newspaper notices
- Mailers to customers
- Community meetings
- TV advertisements
6.9 Regulatory issues related to chloramination
In Ontario, a 0.25 mg/L combined chlorine residual must be maintained throughout the distribution system where chloramines are used, however a 1.0 mg/L concentration is recommended as a target level to suppress nitrification potential. The maximum permissible concentration is 3.0 mg/L.
In Ontario, a combined chlorine residual measurement below the 0.25 mg/L lower limit requires an adverse water quality notice to be issued, which may only be removed if corrective action is taken consisting of raising the residual to 0.25 mg/L or higher.
Recommendations for continuous monitoring of total and free chlorine residual are given in “Procedure for Disinfection of Drinking Water in Ontario” (Ontario MOE, 2006). This document recommends that “facilities provided for the purpose of introduction, change, or adjustment of disinfectant residual in the distribution system at re-chlorination facilities or at the water treatment plant should be provided with equipment for continuous monitoring of the operation of the facilities and an alarm system.” Continuous monitoring of total chlorine residual should also be regularly checked by analyzing grab samples from the distribution system via the DPD titration method.
6.10 Implementation guidance for chloramination
Table 6.1 summarizes the benefits and drawbacks related to using chloramines as a secondary disinfectant in terms of water quality.
| Benefits | Drawbacks |
|---|---|
| Significant reduction in DBPs (major) | Need to maintain optimum chlorine:ammonia ratios to prevent taste and odour and nitrification (major) |
| Increased disinfectant stability in the distribution system (major) | Less protection in the event of intrusion (minor) |
| Better biofilm control (unknown) | Possible formation of chloramine-specific DBPs (minor) |
| Greater level of care to manage environmental releases (minor) |
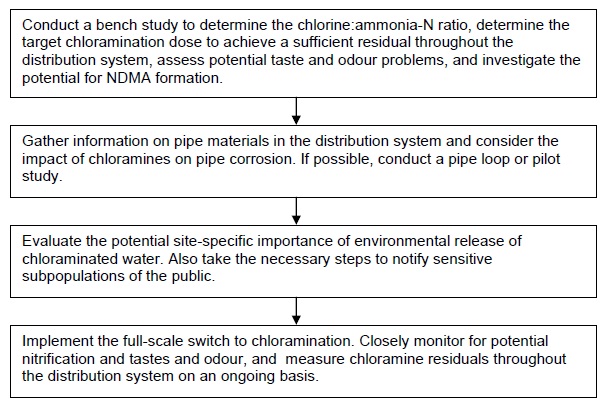
If a utility was interested in switching to chloramination, it is recommended that the following specific issues be addressed as part of an overall study:
- Bench-scale tests to determine the optimum chlorine:ammonia-N ratio and pH for monochloramine formation. In practice, optimum conditions for monochloramine formation to minimize di/trichloramine formation and nitrification potential vary with factors such as temperature, organic nitrogen type and concentration, and others. Such parameters may change continuously. However, it would be useful to conduct a single set of bench-scale tests to confirm that it is possible under controlled conditions to obtain chloraminated water with little di/trichloramine and residual ammonia, and to use the information as a benchmark if/when starting chloramination at full-scale.
- Bench-scale tests to measure potential NDMA formation from chloramination. The mechanisms and precursors for NDMA formation by chloramination are still not fully understood. Given the current Ontario drinking water quality standard of 9 ng/L for NDMA, it is prudent to do bench tests to assess NDMA formation in the chloraminated water.
Flowchart H outlines the major steps for switching from free chlorine residual to chloramines in the distribution system.
H. General steps for switching to a chloraminated distribution system
Alternative DBP Minimization Strategies (7.0)
The strategies outlined in previous sections are typically the simplest and least expensive methods for reducing DBPs in water treatment. If none of the above strategies are possible or if a more aggressive strategy is sought, alternatives that might be considered include the use of:
- UV disinfection
- GAC
- Membrane filtration
- MIEX
These options are significantly more expensive than the aforementioned strategies in terms of additional capital and operating costs. This section provides only a brief introduction to the benefits and some potential drawbacks of each of these alternatives.
7.1 UV disinfection
Ultraviolet (UV) disinfection at conventionally applied UV doses (e.g. 40-200 mJ/cm2) has been shown to not form regulated disinfection by-products (THMs or HAAs) nor increase the formation of by-products by subsequent chlorination (Malley et al., 1996; Shaw et al., 2000). UV disinfection doses are not high enough to cause significant photochemical changes to NOM or DBP formation potential. Therefore, replacing chlorination with UV disinfection for primary disinfection can reduce DBP formation within a treatment plant. Addition of a chemical disinfectant (e.g. free chlorine or chloramines) is still needed following UV disinfection to provide a secondary disinfection residual for distribution.
7.1 GAC
Granular activated carbon (GAC) is effective at removing TOC which contributes to DBP formation potential (Roberts and Summers, 1982; Hooper et al., 1996). Biologically active GAC beds, enhanced by pre-ozonation, can be even more effective for this purpose (Glaze et al., 1982). However, GAC has a limited active lifetime (e.g. typically on the order of 1-3 years) and therefore eventual breakthrough of organic matter needs to be monitored to ensure continued removal of DBP precursors (Snoeyink and Knapp, 1994).
7.2 Membrane filtration
Common membranes used for drinking water treatment are ultrafiltration systems, meaning that the membranes have nominal pore sizes in the 0.1 to 0.001 micron range. Such systems serve as a barrier to particles, bacteria, and protozoa, however the pore sizes are not small enough to remove DBPs themselves, nor are the pores small enough to directly remove the NOM that serves as the DBP precursor material. If the water is first coagulated and flocculated upstream of the ultrafiltration system, then the NOM may become bound in particles that can then be removed by ultrafiltration. This is the identical mechanism that leads to NOM reduction through conventional rapid media filtration with upstream coagulation. Studies indicate that ultrafiltration and conventional rapid media filtration often experience similar NOM removal rates.
In contrast, high pressure membrane systems such as nanofiltration and reverse osmosis with pore sizes in the nanometer range can directly remove NOM, with reductions in DBP formation potential of up to 98% reported (e.g. Taylor et al., 1987; Amy et al. 1990). Reverse osmosis has also been shown to directly remove DBPs from the water.
7.3 MIEX
Magnetic ion exchange (MIEX) is the focus of ongoing research that has so far shown it to be effective at removing dissolved organic carbon (DOC) and UV-absorbing materials which act as precursors for DBP formation (Boyer and Singer, 2005; Singer et al., 2007). One study demonstrated THM formation potential reductions by MIEX ranging from 38-77% depending on the source water, and 44-74% for HAA formation potential reduction (Singer et al., 2007).
References (8.0)
Boyer, T.H. and P.C. Singer. (2005). Bench-scale testing of a magnetic ion exchange resin for removal of disinfection by-product precursors. Water Research 39(7): 1265.
Bull, R.J., Reckhow, D.A., Rotello, V., Bull, O.M., and J. Kim. (2006). Use of Toxicological and Chemical Models to Prioritize DBP Research. American Water Works Association Research Foundation, Denver, CO.
Carlson, K.H., Gregory, D., and S. MacMillan. (1996). The efficacy of preozonation and enhanced coagulation for treating low alkalinity, high color water. Proc. AWWA Annual Conf., Toronto, ON.
CEPA (2014). NDMA and other Nitrosamines – California State Water Resources and Control Board.
Chadik, P.A. and G.L. Amy. (1983). Removing trihalomethane precursors from various natural waters by metal coagulants. J. AWWA 75(10): 532-540.
Edwards, M. (1997). Predicting DOC removal during enhanced coagulation. J. AWWA 89(5): 78-89.
Glaze, W.H. et al. (1982). Evaluation of Biological Activated Carbon for Removal of Trihalomethane Precursors. Report to USEPA, Cincinnati, OH.
Hecht, P. (1993). Effect of optimizing the removal of DBP precursor material on an existing residuals management program. AWWA/WEF Residuals Management Conf., Phoenix, AZ.
Hooper, S., Summers, R.S., and S. Hong. (1996). A systematic evaluation of the role of influent TOC and pH on GAC performance after enhanced coagulation. Proc. AWWA Water Quality Technol. Conference, Boston, MA.
Kavanaugh, M.C. (1978). Modified coagulation for improved removal of trihalomethane precursors. J. AWWA 70(11): 613-620.
Kirmeyer G., Martel K., Thompson G., Radder L., Klement W., LeChevallier M., Baribeau H., and A. Flores. (2004). Optimizing chloramine treatment, 2nd Ed. American Water Works Association Research Foundation, Denver, CO.
Knocke, W.R., Van Benschoten, J., Kearney, M., Soborski, A., and D. Reckhow. (1990). Alternative Oxidants for the Removal of Soluble Iron and Manganese. AWWARF, Denver, CO.
Kriewall, D. (1996). The impact of aluminum residual on transmission main capacity. Public Works 127(12): 28.
Lindqvist, N., Jokela, J.,and T. Tukhanen. (2004). Enhancement of coagulation by using polyelectrolytes as coagulant or flocculent aids. In Chemical Water and Wastewater Treatment VIII: Proceedings of the 11th Gothenburg Symposium, H. Hahn, E. Hoffmann, and H. Odegaard (eds.), IWA Publishing, London, UK.
Malley Jr, J.P., Shaw, J.P., and J.R. Ropp. (1996). Evaluation of By-products Produced by Treatment of Groundwaters with Ultraviolet Irradiation. AWWARF, Denver, CO.
Ontario MOE. (2003). Technical support document for Ontario drinking water standards, objectives, and guidelines.
Ontario MOE. (2006). Procedure for disinfection of drinking water in Ontario. PIBS 4448e01 (second revision).
Roberts, P.V. and R.S. Summers. (1982). Performances of granular activated carbon for total organic carbon removal. J. AWWA 74(2): 113.
Semmens, M.J. and T.K. Field. (1980). Coagulation: experiences in organics removal. J. AWWA 72(8): 476-482.
Shaw, J.P., Malley Jr, J.P., and S.A. Willoughby. (2000). Effects of UV irradiation on organic matter. J. AWWA 92(4): 157-167.
Singer, P.C. and S.D. Chang. (1989). Correlations between trihalomethanes and total organic halides formed during water treatment. J. AWWA.
Singer, P.C. and D.A. Reckhow. (1999). Chemical Oxidation. In Water Quality and Treatment: A Handbook of Community Water Supplies (fifth edition), American Water Works Association, Denver, CO, pp. 12.38-12.43.
Singer, P.C., Schneider, M., Edwards-Brandt, J., and G.C. Budd. (2007). MIEX for removal of DBP precursors: pilot-plant findings. J. AWWA 99(4): 128-139.
Snoeyink, V.L. and D.R.U. Knappe. (1994). Analysis of pilot and full scale granular activated carbon performance data. Proc. AWWA Annual Conference, New York, NY.
USEPA. (1999a). Microbial and Disinfection By-Product Rules Simultaneous Compliance Guidance Manual. EPA 815-R-99-015. Office of Water, Washington, DC.
USEPA. (1999b). Enhanced Coagulation and Enhanced Precipitative Softening Guidance Manual. EPA 815-R-99-012. Office of Water, Washington, DC.
PIBS 7152e