Technical Review of Highway Winter Service Levels on Highways 11 and 17 in Northern Ontario
This report presents a review of winter maintenance operations along Highways 11 and 17 in Northern Ontario.
Executive summary
Ontario has among the safest roads in North America, and the Ministry of Transportation (MTO) is committed to keeping Ontarians safe, particularly during the winter season. Over the past seven years, MTO has strengthened the quality of winter maintenance operations and has worked with maintenance contractors to add equipment, improve service delivery at truck climbing and passing lanes in the north as well as freeway ramps and shoulders, and adopt new technologies to improve overall service.
This report presents a review of winter maintenance operations along Highways 11 and 17 in Northern Ontario. The review includes current maintenance standards, highway information and highway maintenance performance related to the following aspects:
- snowfall intensity rates and how they compare to the ministry's "design storm"
- vehicle collision rates
- winter traffic volumes used as an indicator for determining the highway maintenance service level for a section of highway
- the number of patrol yards and winter vehicles available to deliver winter maintenance
- the time it takes contractors to achieve bare pavement after a winter storm
The review confirms that the ministry's snowfall intensity design storm is appropriate for winter weather conditions along Highways 11 and 17, 99% of the time with weather conditions exceeding the design storm only 1% of the time.
A review of collision data was performed using data from 2015 to 2019 and determined that Highways 11 and 17 in Northern Ontario have similar collision and combined fatality and injury rate ranges, as compared to sections of highways in Southern Ontario with similar winter level of service. Winter weather and driving conditions were found to have a similar impact on overall collision rates in both northern and southern Ontario. The report concludes that the current level of service on Highways 11 and 17 are generally in line with or better than provincial standards. The analysis of infrastructure and winter equipment available indicates that winter maintenance resources servicing Highways 11 and 17 are appropriate. Bare pavement times were reviewed and determined to exceed the provincial target to meet requirements 90% of the time on an average basis.
While the review confirms that current levels of service are appropriate, several opportunities have been identified to improve winter maintenance along Highways 11 and 17, as well as some research opportunities to further improve winter operations. The research opportunities identified will support the ministry's commitment towards continuous improvement of winter maintenance standards and operations.
Opportunities identified to further enhance the current level of service along Highways 11 and 17 are listed below. The implementation of several of these opportunities is already underway:
- implement opportunities for local improvements to address site specific challenges
- increase equipment levels by using target route circuit times instead of maximum circuit times to determine equipment levels
- review use of non-traditional winter maintenance equipment
- require contractors to apply anti-icing liquids in advance of storms when conditions permit
- add spare winter equipment to Highway 11 or 17 patrol yards, as required.
- expand the highway information available for maintenance operations
- increase public awareness of winter maintenance operations and safe winter driving techniques
- implement Rest Area improvements
- implement capital construction program safety improvements
The research opportunities identified by the review for improving standards and practices are listed below. Through the commitment towards continuous improvement and the use of new technologies, MTO is well positioned to further enhance winter maintenance service levels through the research opportunities:
- review the efficiency of different types of equipment
- review the effectiveness of underbody plows to remove/prevent snowpack
- review the use of unconventional winter equipment
- investigate the benefits of applying sand treated with special additives
- investigate the benefits of pre-wet salt and pre-treated salt
- investigate the benefits of a combined salt-sand application
- explore new and innovative techniques for highway maintenance in low temperature conditions
- explore option to deploy additional winter equipment during severe winter storms
- research the efficiencies of different equipment complements
As part of the review the benefit/cost considerations related to upgrading the levels of service of Highways 11 and 17 to Freeway/Urban Highway (Class 1) have been assessed. It is anticipated that upgrading will result in the need for an estimated six new patrol yards, an additional 69 winter vehicles and associated resources for an estimated capital cost of $21 million to $39 million and an annual operating cost increase of $20.2 million to $22 million (2020 dollars). The operating cost represents an 18.2% to 19.8% increase over the $111 million northern winter maintenance expenditures. Highway maintenance standards are developed to optimize the use of equipment and materials and this report concludes that upgrading the level of service will only incrementally improve winter road conditions. The report finds that upgrading the level of service will have minimal impact on the end result of achieving bare pavement after a storm event has ended.
Background
Ontario has among the safest roads in North America, and MTO is committed to keeping Ontarians safe, particularly in winter weather. Over the past seven years, MTO has strengthened the quality of snow clearing operations. MTO has worked with maintenance contractors to add equipment to improve plowing of truck climbing and passing lanes in the north, plowing and salting of freeway ramps and shoulders, and to adopt new technologies to improve overall service.
MTO is responsible for year-round highway maintenance of approximately 40,000 lane kilometres of provincial highways and 2,880 bridges representing $82 billion of assets that are maintained through the highway maintenance program. These maintenance responsibilities include winter maintenance (such as snow and ice control, incident response, and emergency repairs) and summer maintenance (such as pothole patching, vegetation management, drainage, shoulder repairs, electrical maintenance, incident response, and emergency repairs).
The province is divided into 23 highway maintenance areas (not including Highway 407 East and the Right Honourable Herb Gray Parkway in Windsor). Highway maintenance is delivered by private sector contractors through long term (7-12 years) contracts that allow the contractor to adapt and invest in maintenance equipment and assets. Highway maintenance contracts are awarded for a defined area for which the contractor is responsible for planning and managing the work and is paid an annual lump sum price with some risk-sharing on items that are difficult to estimate or outside the contractor's control. Contractors are required to meet performance-based contract requirements also known as "Outcome Targets". Contractor responsibilities include conducting highway patrols to gain awareness of road conditions and directing their own operations in accordance with the contract requirements. Amongst over 30 contract requirements, the contractors are required to deploy, carry out continuous operations and achieve the bare pavement standard within the specified time. Some of the contract requirements related to winter maintenance are listed below:
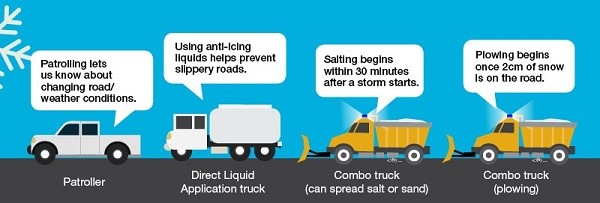
- readiness of staff, equipment and materials to respond quickly
- spreading sand/salt (within 30 minutes of start of snow/ice accumulation)
- meeting application rates for sanding and salting
- deployment of plows (upon accumulation of 2 cm of snow)
- continuous operations until bare pavement achieved
- address isolated slippery sections
- post storm clean-up (shoulders, banks, commuter parking lots)
- salt management
- documentation of their operations
- ensuring adequate staff and equipment are available to meet the contract circuit times for plowing, sanding and salting
MTO staff conduct audits of contractor's work and contractors face financial consequences for non-compliance with contract requirements. Oversight is performed on the contract requirements using various tools and techniques including the following:
- monitoring equipment and activities using GPS-based systems
- monitoring weather and road conditions using MTO's Road Weather Information System (RWIS)
- selective in-storm monitoring
- audit of documents such as contractor diaries, equipment reports, material usage, MTO communication reports and Ontario Provincial Police (OPP) reports
Non-conformances are issued for failure to meet contract requirements that are within the contractor's control. Non-conformances result in financial consequences for initial non-compliance & ongoing non-compliance until brought into compliance. Ongoing non-conformances that are not addressed by the contractor can also lead to an infraction, which can reduce the company's ability to bid on future contracts.
Over time and through continuous improvements, maintenance contracts have evolved and there are four types of highway maintenance contracts currently in use:
- Third Generation Area Maintenance Contracts (3rd Gen AMC) which were awarded from 2009 to 2013. This contract model is being phased out.
- Performance Based Maintenance Contract (PBMC) which is being used in the Kenora area and was awarded in 2015. This contract model is being phased out.
- Starting in 2017, MTO moved to Contractor Directed Maintenance Contracts (CDMC), an evolution of the 3rd Gen AMC and the PBMC which is more prescriptive on bidding requirements, includes updated risk-sharing provisions, and addresses recommendations from the 2015 Auditor General of Ontario's Special Report on Winter Maintenance, by encouraging the use of anti-icing liquids when appropriate, defining minimum patrolling requirements and using a value-based procurement process.
- In 2018, MTO developed a Ministry Directed Maintenance Contract (MDMC), in which MTO staff are responsible for highway patrolling and determining the winter operations required during a winter storm. Contractors are responsible for providing equipment and operators. At the time of this report, there are two MDMCs; one in the Carleton Place area, a sub-area of Ottawa, and one in the Toronto area responsible for a short portion of Hwy 401. Two MDMCs are planned for Northern Ontario starting in 2021 in the Thunder Bay area.
Ontario's snow clearing strategy
MTO's strategy for winter highway maintenance includes using state of the art technology, equipment and materials in the right place and at the right time. Operations are 24 hours per day, seven days per week; this differs from many North American jurisdictions that use terms like best efforts, within allowable budgets, and during normal working hours in their performance commitments. By contrast, MTO not only prescribes the minimum effort required, it measures and reports the outcome through bare pavement reporting. MTO's service commitment is to achieve the bare pavement standard after winter storms 90% of the time on an average basis. This goal has been achieved across the province since the service standard was implemented in 2003. Results are publicly reported annually on the ministry's public site.
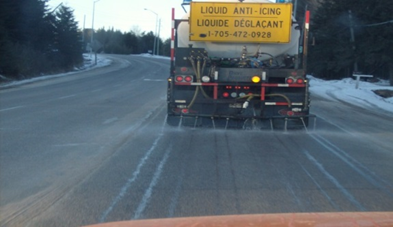
Contractor staff (or MTO patrollers in MDMC areas) continually monitor weather forecasts, weather information and road condition information using the MTO's state of the art RWIS so they are prepared for the start of a storm and remain informed about road and weather conditions during a storm. Anti-icing liquids may be applied on the pavement surface, when conditions are favourable, prior to a storm to provide the first defense against snow, frost and ice and prevent them from sticking to the pavement. Contractors are required to deploy winter maintenance equipment to spread salt/sand within 30 minutes of the start of the accumulation of snow. Snow plowing starts once accumulation has reached 2 centimetres of snow.
Snow removal involves having the plow remove as much of the excess snow as possible and then applying salt to any remaining snow and ice providing temperatures (and forecasted temperatures) are sufficient for salt to be effective. Plowing and de-icing continue until the storm is over and bare pavement is achieved; this includes allowing time for salt to interact and melt remaining snow and ice left on the roadway. When roadway surface temperatures are too low for the effective use of salt, sand is applied to improve friction on the ice and snow. Once the surface temperature of the roadway rises, salt is applied to remove snow and ice accumulations that were not removed by plowing.
Ontario's complex highway system in urban areas such as the Greater Toronto and Hamilton Area (GTHA), Ottawa and Kitchener-Waterloo areas require a coordinated approach to plowing called echelon plowing. This requires several pieces of winter maintenance equipment to plow multi-lane highways from left to right while spreading winter materials and concurrently plowing ramps. Similar echelon formations are used on multi-lane divided highways, including highways in Northern Ontario.
Winter service levels
MTO uses traffic volumes as the primary indicator to determine the winter service levels for each class of highway. This approach is consistent with most North American jurisdictions with slight exceptions for local adjustments. The higher the traffic volume, the more frequent the plowing and salting operations. There are five highway types.
- Freeways/Urban Highways carry traffic volumes of more than 10,000 vehicles per day in both Southern and Northern Ontario. Examples are Highway 401, the Queen Elizabeth Way and Highway 11 four-lane sections.
- Major Highways carry traffic volumes between 1,501 to 10,000 vehicles per day in Northern Ontario. Examples are Highways 11 two-lane sections, 17, 41, 62 and sections of Highway 7. Regardless of traffic volumes, all sections of the Trans-Canada Highway are maintained at this level as a minimum.
- Intermediate Highways carry traffic volumes between 801 to 1,500 vehicles per day in Northern Ontario. An example is Highway 35 that links Highway 401 with Peterborough, Kawartha Lakes and Algonquin Park.
- Minor Highways carry traffic volumes between 401-800 vehicles per day in Northern Ontario. An example is Highway 516 in Northwest Ontario, connecting Highway 642 near Sioux Lookout with Highway 599 north of Savant Lake.
- Local highways carry traffic volumes of fewer than 400 vehicles per day in Northern Ontario. An example is Highway 671 in Northwest Ontario, that connects the community of Grassy Narrows to Highway 17 near Kenora.
The highway types above are related to the role and function of the highway and are aligned with the functional classifications used for geometric design on highways. The highway type also helps determine the winter service level of a highway for consistent winter maintenance operations prior to, during and after a winter event on a highway. This ensures an objective, evidence-based approach that optimizes the use of equipment and materials and provides consistent user experience across the province. A consistent, evidence-based approach enables optimization of the equipment complement, patrol yards and other ancillaries and optimal use of winter materials such as salt, sand and brine. Consistent application of objective and evidence-based standards is also essential in the defence of liability claims against the Crown.
Traffic volume is important but not the sole factor for determining service levels. While ensuring consistent driver expectations, MTO makes minor local adjustments to service levels according to specific circumstances, such as whether a highway services international gateways, hospitals, schools, winter tourism, or is prone to unique local weather and geographic conditions. Designation as a TransCanada highway is another key factor that is considered when determining service levels. MTO's approach is that all sections of the TransCanada highway are designated with a minimum service level of a Major Highway even though several sections of the TransCanada do not meet the traffic volume threshold for a Major Highway designation. This also provides a consistent expectation for travellers across Highways 11 and 17.
One of the outcome performance requirements for winter highway maintenance is the amount of time it takes to achieve bare pavement after the end of a winter storm. For example, contractors are required to regain bare pavement conditions within eight hours after the end of a winter storm for all highways designated as Freeways/Urban Highways. For Major Highways, bare pavement conditions are to be regained within 16 hours after the end of a winter storm. Table 1 provides a breakdown of bare pavement standards for each type of highway. Bare pavement targets are included as part of our maintenance contract requirements and contractor performance is monitored through field-level oversight and annual provincial reporting. Regaining bare pavement after the end of a storm is dependent on the timing, material, and level of maintenance effort during the period of precipitation. It is important to note that despite the best efforts in terms of equipment and materials used by maintenance crews, it is usually not possible to maintain a bare pavement condition during most storms. MTO's publicly reported key performance indicator for winter highway maintenance is to achieve the bare pavement standard 90% of the time each winter across the province. Results are measured, compiled and publicly reported by maintenance area annually.
The standard timeframes to regain bare pavement are a result of balancing several factors including budgetary limits, staffing levels, service management, contract requirements, operational constraints related to spreading sand or salt, snow accumulation rates, public expectations, highway classifications and the need to provide consistent levels of service across the province.
Table 1 – Bare pavement standards for highway types
| Highway Type | Bare Pavement Standard |
|---|---|
| Freeway/Urban Highway | Bare pavement within eight hours of the end of a winter storm, e.g. Highway 401, Queen Elizabeth Way, Highway 11 four-lane sections |
| Major Highway | Bare pavement within 16 hours of the end of a winter storm, e.g. Highway 11 two-lane sections and 17, Trans-Canada Highway in Ontario |
| Intermediate Highway | Bare pavement within 24 hours of the end of a winter storm, e.g. Highway 35 |
| Minor Highway | Centre bare pavement within 24 hours of the end of a winter storm; fully bare pavement when conditions permit, e.g. Highway 516. Centre bare means a 2.5m strip in the middle of the road. |
| Local Highway | Snow packed driving surface within 24 hours of the end of a winter storm. Excess snow is plowed off and sand is applied where required to improve friction, e.g. Highway 671. |
The time to regain bare pavement after a storm depends on several factors. A key factor is maintenance operations, which includes plowing (after an accumulation of 2 cm of snow) and the application of salt. Traffic assists in activating the salt with the snow. Temperature is also important to facilitate the melting of snow and ice. In lower temperatures (minus 12°C and colder) salt becomes less effective and more time and winter operations are needed to achieve bare pavement. Sand may also be needed to maintain traction in very low temperatures. Best practices developed over years of experience, research, and consultation with other road authorities are used to guide decisions in the field regarding equipment deployment, choice and amount of materials and winter operations. Timely decisions and effective operations lead to regaining a bare pavement condition, often earlier than the standard or required timeframe.
Although overall performance is measured by the time to regain bare pavement, it must be noted that during storms, visibility and driving conditions can be less than ideal. Despite the best efforts of maintenance crews, there are instances where road conditions become dangerous, such as when ice forms on highways before salt can melt it or when visibility becomes poor for drivers including winter equipment operators. When highway conditions become dangerous, the OPP can decide to close the highway to ensure the safety of the travelling public and maintenance operators. Highway closures can be disruptive, especially in the north where there are limited alternatives. Decisions on highway closures are carefully considered by the OPP and are implemented only when necessary. MTO provides road and weather information through the Ontario 511 services discussed later in this report, to inform drivers and assist them in planning their journey.
MTO previously reviewed the criteria for winter maintenance service levels in 2016 in response to the 2015 Ontario Auditor General's Report and MTO's Action Plan of June 2015. This was done in conjunction with a jurisdictional scan of North American road authorities. MTO reviewed standards in other provincial and state departments of transportation to better understand how service levels are determined and how outcomes are measured. The scan determined that most other jurisdictions primarily base winter maintenance service levels on traffic volumes or highway type. Most jurisdictions use service commitments such as initial deployment commitments or time at end of storm where all routes will have been serviced (i.e. plowed or salted). Many jurisdictions measure their performance based on meeting service commitments or by number of pieces of equipment deployed. Some measure their performance based on time taken to clear or plow highways during or after the storm, rather than the time to regain bare pavement.
The jurisdictional scan confirmed that Ontario's standards are among the highest in North America as they prescribe the operational inputs similar to other jurisdictions but in addition have outcome requirements such as the bare pavement performance. Outcome requirements provide a better measure of the effectiveness of maintenance operations. Another finding was that MTO's actual salting and plowing times are either similar to or better than most jurisdictions.
MTO also continues to work towards an objective method to incorporate additional factors such as the economic importance of the highway, the availability of alternative routes and a highway's proximity to a hospital into the determination of service levels. These factors are already considered subjectively for local adjustments where warranted. Jurisdictional scans determined that Ontario's level of service on lower volume highways are either similar to or better than most jurisdictions. As discussed in more detail later in Section 5, Winter traffic volumes, Highways 11 and 17 have minimum Major Highway designation which takes into consideration the significance of these Trans-Canada highways, even though the traffic volumes at many sections do not warrant this designation.
Winter maintenance service levels include theoretical and maximum route times for winter vehicles which are assigned to specific routes. The theoretical route time is the estimated time for a winter vehicle to complete their route based on set conditions, geographical constraints, traffic signals, and operating speeds. The maximum route time is a contract requirement that the contractor is not permitted to exceed. Winter maintenance service level factors are shown in Table 2. It is important to note that service intervals may exceed route times due to time needed for reloading of winter materials, refueling of equipment etc.
Table 2 – Winter maintenance service level factors
| Highway Type | Southern Ontario (vehicles per day) | Northern Ontario (vehicles per day) | Time to Regain Bare Pavement (hours) | Theoretical Route Time (hours) | >Maximum Route Time (hours) |
|---|---|---|---|---|---|
| Freeway / Urban Highway | 10,000 - 100,000 | 10,000 – 100,000 | >8 | 1.3 | 1.6 |
| Major Highway | 2,001 – 10,000 | 1,501 – 10,000 | 16 | 1.8 | 2.2 |
| Intermediate Highway | 1,001 – 2,000 | 801 – 1,500 | 24 | 2.9 | 3.3 |
| Minor Highway | 501 – 1,000 | 401 – 800 | 24 | 4.9 | 5.5 |
| Local Highway | < 500 | < 400 | Not Applicable | 8 | 10.0 |
In comparison, the winter maintenance standards of three western provinces were examined. The agencies typically base their standards on higher snowfall accumulation (3 cm vs 2 cm in Ontario) and provide for longer response times, known as deployment times in Ontario. Only Alberta has a "bare pavement" requirement. A summary of the winter maintenance standards is listed below:
- Manitoba: Major Routes (Level 1) travel lanes are plowed within four hours after end of storm and Regional Highway Network – Surfaced (Level 2) travel lanes plowed such that surface is predominantly visible within eight hours after plowing on Level 2 roads begin.
- Saskatchewan: On Inter-provincial Routes (Level 1), snow removal is initiated as soon as practical or after 3 cm of snow has accumulated on the driving lanes and snow is plowed from the driving lanes within six hours of the end of the storm (noting additional time may be required in extreme circumstances). On Highways with Annual Average Daily Traffic (AADT) between 300 and 1,500 (Level 2) snow is plowed from the driving lanes within 12 hours of the end of the storm, with snow removal commencing when resources are available without jeopardizing service on Level 1 highways.
- Alberta: Service level guidelines provide a maximum time allowable for equipment to have commenced work from the time of a 3 cm snow accumulation. Class A highways with an AADT of greater than 15,000 vehicles have a maximum reaction time of two hours. Class B highways with an AADT of 7,000-15,000 AADT, Class C highways with an AADT of 5,000 to 7,000 AADT and Class D highways with an AADT of 2,000-5,000 AADT have a maximum reaction time of four hours. The service level guidelines also provide a maximum time to achieve good winter driving conditions, which are defined as "when snow and ice have been removed from the driving lanes and excessive loose snow has been removed from the shoulders and centerline of highway". The Maximum Time to Good Winter Driving Conditions for Class A and Class B highways is six hours and for Class C and Class D highways is eight hours.
Recent improvements to winter maintenance
MTO implemented several improvements to the Winter Maintenance program following the 2013 internal review and the April 2015 Ontario Auditor General's Special Report on winter maintenance. The measures were undertaken with extensive industry consultation and are discussed in the paragraphs below.
Contract Models:
Development of two new highway maintenance contract models that are expected to ensure a high level of performance and address sustainability for both the government and the industry.
- The CDMC model development was to more clearly define the scope of work to ensure delivery of appropriate and affordable highway maintenance services consistent with the ministry's Maintenance Quality Standards and Best Practices which have been amalgamated and updated into the new Maintenance Standard Specifications.
- The MDMC model will foster greater competition within the contracting industry by providing bidding opportunities for smaller firms. The model will also provide an opportunity for internal (ministry) training, staff retention, provide an opportunity for the ministry to perform trial projects and/or experiment with new products and equipment and will enhance the ministry's knowledgeable owner status.
Operations:
- enhanced road patrolling
- incentives for increased use of anti-icing liquids when conditions permit
- expanded network and improved reliability of RWIS along with forecasting services
- implementation of additional material risk sharing formula to encourage the appropriate use of winter materials
- enhanced salt/sand spreading capacity during seasonal transition periods (late fall and early spring) to equip contractors for potentially rapid changes in weather conditions characteristic of those periods
- providing contractors with an incentive to improve their overall performance
Equipment:
- requiring contractors to take steps to ensure that all of their equipment is ready, including the proper number of drivers, and provide the ministry with documentation and records on mechanical readiness of equipment throughout the winter season
- increased salting capacity in remote locations in the north by adding a number of standalone spreaders
- additional equipment for service level enhancements on truck climbing lanes and passing lanes
- additional equipment for service level enhancements for ramps
- providing an incentive for the retrofitting of an enhanced lighting package for winter equipment to increase visibility of winter equipment
Contractor Oversight:
- enhanced ministry oversight including 20 new inspectors and more in-storm monitoring
- annual road patroller training provided by MTO
Communications:
- winter maintenance/safe driving campaign (with OPP)
- Twitter accounts for informing the public of OPP highway closures
- modernization of Ontario 511, including a new mobile app
- Track My Plow, now on Ontario 511
- public access to real-time images from 150+ roadside weather station cameras.
- improved accuracy of road condition reporting through training and quality control checks
- forecasted driving conditions layer based on forecasted weather conditions
- access to Ontario 511 and "Track My Plow" at ONroute kiosks
- expanded network of Changeable Message Signs with winter driving messages starting on Hwy 401 in Eastern Region
- annual Bare Pavement performance reporting by contract area, with Winter Severity Index
As a result of these improvements the province is now investing significantly more funds for winter maintenance. In fiscal year 2019-20 the province invested approximately $111 million in highway maintenance services in Northern Ontario, compared to $65 million per year in the five years prior to fiscal year 2014-2015. Some of the increased costs are also attributable to inflation, increased winter material costs due to winter severity, the addition of new highway lanes and the cost of new contracts which have increased due to a market correction in bid prices.
Highway Locations Included in the Analysis
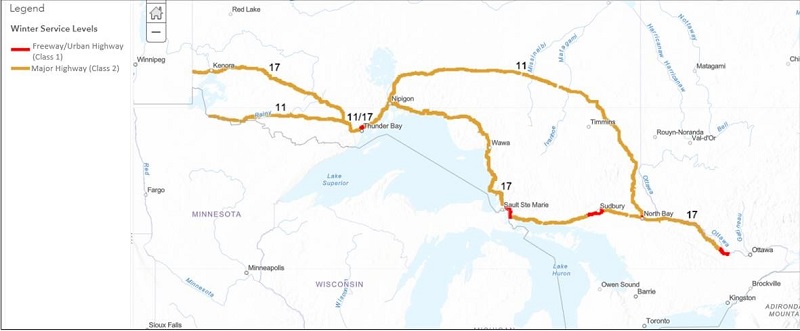
The highways included in the analysis are the sections of the TransCanada that extend from the western limits of the province to the east where freeway sections begin. The specific sections of Highways 11 and 17 included in the detailed analysis are Highway 11 from the Minnesota border easterly to North Bay and Highway 17 from the Manitoba border easterly to the junction with Highway 417, west of Ottawa. The analysis also includes the section known as Highway 11/17 in the Thunder Bay area and Highway 17A near Kenora. This represents 252 administrative segments (for highway maintenance and public reporting purposes), extending 3,274 kilometres. The sections are shown in Figure 1, including their current winter maintenance service levels.
Storm Intensity
The basis for all highway maintenance standards and best practices is the design storm snowfall intensity. Ministry staff reviewed the storm intensity information for each highway maintenance area in Ontario to determine if there are geographic variations in storm intensity along the TransCanada highways in Northern Ontario. Regional variations in climate are not specifically considered in the determination of service levels. Although local adjustments to service levels can occur, there is no objective consideration for local weather or storm intensity.
Service levels and associated equipment complements are based on a standard design snowfall rate of 2.79 cm/h (1.1 inches/h). Snowfall rates throughout the province were reviewed to determine if there are areas that highlight a need for local adjustments. Figure 2 below illustrates the snowfall rates at the 99th percentile for the highway maintenance areas in Ontario based on the report Developing Climate Severity Factors Affecting Equipment Complement of Area Maintenance Contracts (Matthews et al. 2018). The snowfall rates are based on climate data from 1980 to 2016. For the purposes of this analysis, Huntsville is separated from the northern areas as it is the one northern area that does not include a portion of the Highway 11 and 17 study area, and Ottawa is separated from the southern areas as it includes a portion of Highway 17 study area.
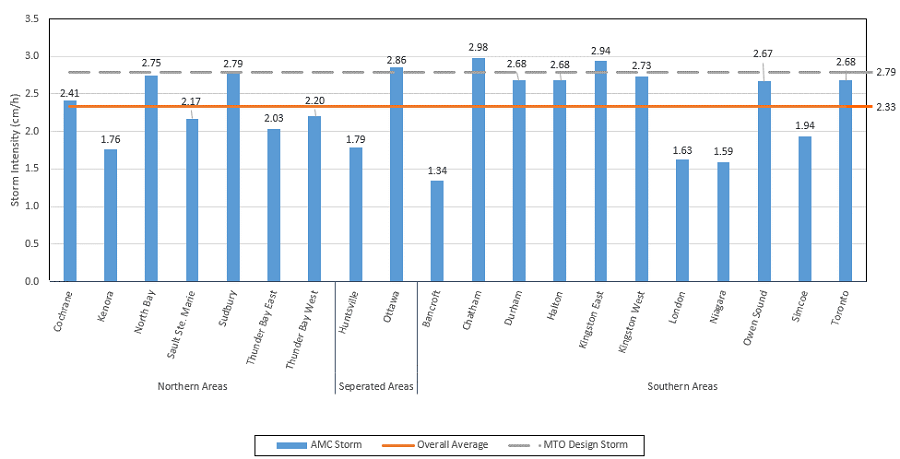
A review of the data indicates that three areas exceed the design snowfall rate of 2.79 cm/h more than 1 per cent of the time and no areas exceed the design snowfall rate greater than 2 percent of the time. Of the three areas with high snowfall intensity rates, only Ottawa covers a portion of the sections of Highways 11 and 17 in this study. The snowfall rates for the other areas in the analysis exceed the design snowfall rate less than 1 per cent of the time.
A comparison of southern highway areas and northern highway areas indicates the average 99th percentile snowfall rate for the northern areas is 2.30 cm/h, which is less than the rate for the southern areas, which is 2.35 cm/h. These snowfall rates are similar in intensity and both are below the design snowfall rate indicating that 99 per cent of snowfalls are below the design storm intensity.
In conclusion, the storm intensity rates for northern highway areas are similar to but slightly less than the rates in southern Ontario. The storm intensity rates are generally below the MTO Design Storm at least 99 per cent of the time, which indicates that the service levels and associated equipment complements are appropriate.
Fatality and injury rates
The Ontario Road Safety Annual Report (ORSAR) shows the state of road safety in Ontario for the year that it is produced. Statistics are presented on fatalities, injuries and property damage collisions and other information includes the types of vehicles involved in collisions, time and location of collisions, and conviction data. ORSAR Tables 3.11 and 4.1 provide all numbers of reported collisions occurred on provincial highways.
From a traffic information perspective, winter in Ontario is usually identified as January 1 to March 31 and December 1 to 31 in one year. But for this winter maintenance review, collisions have been examined from a winter season perspective (i.e. December 1 to 31 year one and January 1 to March 31 year two) to be able to compare one winter period to another.
The first part of this section provides a comparison of collision information between Highways 11 and 17 in Northern Ontario and southern Ontario highways using 2016 Ontario collision data. Collision information was reviewed based on three statistics:
- the monthly collision rates during winter vs the rest of the year
- the percentage of fatalities and injuries occurring during winter months
- the percentage of fatality and major injury collisions to overall collisions occurring during winter months
The collision rate comparison in this section uses the latest four years of collision data (2015 to 2019) to develop the following two statistics:
- the collision rate per million vehicle kilometres driven
- the fatality and injury rate per million vehicle kilometres driven
The findings below were observed by comparing Highways 11, 17 and 17A data to data from the Major Highway designated southern highways (i.e. Highway 3 and 6 as well as Highway 7 from Carleton Place to Perth and from New Hamburg to Shakespeare). It is important to note that collision information as a measure for comparing road sections can be influenced by other extraneous factors such as the length of the section and the presence or frequency of intersections. Additional factors related to issues comparing collision statistics of different highways is discussed in greater detail below.
Monthly collision rate during winter vs the rest of the year
The monthly collision rates were compared for Major Highway sections of Highways 11, 17 and 17A to Freeway/Urban Highway sections of Highways 11 and 17 and to Major Highway sections in southern Ontario. As the lengths (and traffic volumes) for these comparisons are very different it important to look at the ratio of collision rates and not the overall number of collisions. Comparing the ratio of winter (beginning of December to end of March) collision rates to non-winter collision rates indicates a similar ratio for both Freeway/Urban Highway and Major Highway sections of Highway 11, 17 and 17B to Major Highway southern highways. The comparisons indicate there are a similar proportion of winter collisions for Highways 11 and 17 when compared to Major Highway sections in southern Ontario.
The monthly collision information is provided below in Table 5.
| Highway | Highway Classification | Collisions Per Month Winter | Collisions Per Month Non-Winter Months | Ratio of Winter to Non-Winter Monthly Collisions |
|---|---|---|---|---|
| Highways 11 and 17 | Freeway/Urban Highway | 94 | 81 | 1.16 |
| Highways 11, 17 and 17A | Major Highway | 194 | 165 | 1.18 |
| Highways 58A and 140 | Major Highway | 3 | 1 | 3 |
| Highway 7 | Major Highway | 15 | 13 | 1.15 |
Percentage of fatalities and injuries occurring during winter months
The percentage of fatalities and injuries occurring during winter months was reviewed. Comparing the percentage of fatalities and injuries occurring during winter indicates a slightly lower percentage for Highways 11 and 17 than Major Highway sections in southern Ontario.
The fatality and injury percentages are provided below in Table 6.
| Highway | Highway Classification | Percentage of Fatalities and Injuries Occurring During Winter Months |
|---|---|---|
| Highways 11 and 17 | Freeway/Urban Highway | 35% |
| Highways 11, 17 and 17A | Major Highway | 41% |
| Highways 58A and 140 | Major Highway | 54% |
| Highway 7 | Major Highway | 46% |
Percentage of fatality and major injury collisions to overall collisions occurring during winter months
The percentage of fatality and major injury collisions to overall collisions occurring during winter months was reviewed. Comparing the percentage of fatality and major injury collisions to overall collisions (i.e. Fatal, Injury and Property Damage Only (PDO)) indicates a lower percentage of fatality and major injury collisions to overall collisions in winter for Highways 11 and 17 when compared to Major Highway sections in southern Ontario.
The fatality and major injury collision to overall collisions during winter percentages are provided below in Table 7.
| Highway | Highway Classification | Collision Rate Winter Months |
|---|---|---|
| Highways 11 and 17 | Freeway/Urban Highway | 1% |
| Highways 11, 17 and 17A | Major Highway | 3% |
| Highways 58A and 140 | Major Highway | 6% |
| Highway 7 | Major Highway | 4% |
Collision rates and fatality and injury rates per million vehicle kilometres driven
The data in Table 8 shows that both northern and southern sections of Major Highway designated provincial highways have similar high and low collision rate values for both the annual and winter categories. With the exception of the Highway 6 section (North) on Manitoulin Island (collision rate of 1.01), the maximum values for annual collision rates are relatively similar ranging from 0.60 to 0.72 collisions per Million Vehicle Kilometres (MVKM) and with the winter maximum values ranging from 0.94 to 1.14 collisions per MVKM. These collision rate ranges generally fall within expected collision rates for undivided King's Highways.
The data also shows that the relative increase (%) in winter collision rates over annual collision rates is similar in northern and southern Ontario. The annual collision rates increase by 57 to 100% in the north and by 33 to 100% in the south. Winter fatal and injury rate increases over the annual rates are more varied (-8 to 70% in the north and -3 to 218% in the south), but with fewer of these types of collisions versus property damage only collisions, it is possible that a few years of higher collision numbers can skew the average results.
The overall collision rates and combined fatal and injury collision rates are provided in Table 8.
| Highway | North / South | Total Length of Sections | Number of Sections | Average Annual Collision Rates - Min | Average Annual Collision Rates - Max | Average Winter Collision Rates - Min | Average Winter Collision Rates - Max | % Rate Change Annual vs. Winter | Average Annual Fatal & Injury Collision Rates - Min | Average Annual Fatal & Injury Collision Rates - Max | Average Winter Fatal & Injury Collision Rates - Min | Average Winter Fatal & Injury Collision Rates - Max | % Rate Change Annual vs. Winter |
|---|---|---|---|---|---|---|---|---|---|---|---|---|---|
| 6 | North | 111 | 1 | 1.01 | 1.01 | 1.60 | 1.60 | 60% | 0.10 | 0.10 | 0.15 | 0.15 | 48% |
| 7 | South | 70 | 4 | 0.12 | 0.72 | 0.23 | 1.14 | 63-100% | 0.05 | 0.18 | 0.16 | 0.27 | 12-218% |
| 17 | North | 628 | 5 | 0.48 | 0.71 | 0.75 | 1.09 | 57-60% | 0.08 | 0.12 | 0.08 | 0.19 | -8-70% |
| 3 | South | 199 | 2 | 0.57 | 0.62 | 0.79 | 0.94 | 33-50% | 0.14 | 0.15 | 0.14 | 0.21 | -3-39% |
| 11 | North | 368 | 3 | 0.45 | 0.62 | 0.83 | 0.96 | 67-100% | 0.10 | 0.12 | 0.15 | 0.19 | 43-60% |
| 6 | South | 204 | 1 | 0.60 | 0.60 | 1.02 | 1.02 | 70% | 0.11 | 0.11 | 0.16 | 0.16 | 45% |
| North | N/A | N/A | N/A | N/A | N/A | N/A | N/A | 57-100% | N/A | N/A | N/A | N/A | -8-70% |
| South | N/A | N/A | N/A | N/A | N/A | N/A | N/A | 33-100% | N/A | N/A | N/A | N/A | -3-218% |
Notes for Table 8:
All collision rates in Table 8 are presented as the number of collisions occurring for every MKVM driven on that section of highway based on four years of collision data (2015 to 2019).
Annual collision rates are based on the AADT volumes, while winter collision rates are based on the winter average daily traffic volumes.
Bolded values highlight either a minimum or maximum for that category.
A list of the highways used in the analysis above is included in Appendix D.
The impacts of winter road conditions on highway safety in Ontario can vary greatly depending on many factors such as number and severity of storms, highway geometrics (design speed, curve radii, lane and shoulder widths, etc.), composition of vehicle traffic, distance travelled per trip (fatigue or distraction effects), type of vehicle driven, tire type, drivers' skill and comfort under the prevailing weather and road conditions etc. Although a consistent four-month time period can be used to represent "winter" in Ontario, the length and severity of our winters vary greatly from year to year and geographical location. Therefore, while the winter season may just be a little longer in Northern Ontario than southern Ontario, it is likely that there may be more frequent winter weather events occurring in the north as temperatures are generally lower than in the south. While more snow and ice can lead to poorer driving conditions, human factors (i.e. driver confidence, preparedness, etc.) may also play a role.
Only provincial highways designated as Major Highway were selected to generate collision rates to allow a comparison of similar highways as other highways would have either different traffic volumes (higher or lower) and the highway geometrics would be different as well.
Additional Traffic statistics are provided in Appendix D.
Conclusions based on review of collision information
In conclusion, collision data from 2015 to 2019 shows that northern and southern Major Highway designated provincial highways have similar collision and combined fatality and injury rate ranges. The impacts of winter weather and driving conditions also have a similar effect on overall collision rates in both northern and southern Ontario.
Winter traffic volumes
Winter traffic volumes, referred to as Winter Average Daily Traffic (WADT), are an important indicator to determine the winter service levels for each type of highway, along with other factors such as topography, access, and special considerations such as the TransCanada designation. WADT is the average 24-hour, two-way traffic for the periods from January 1st to March 31st and December 1st to December 31st within a calendar year. This section presents an assessment of how the current winter traffic volumes compare with the service level traffic thresholds. Winter service level maps for the northern highways are provided in Appendix A.
A comparison of winter traffic volumes to the service level traffic thresholds was done based on 2016 WADT volumes and are shown in Appendix B. The 2016 winter traffic volumes represent the latest winter traffic volumes available at the time of writing the report. One segment (26 km) was removed from the analysis due to missing winter traffic information. Only the AADT data was available for that segment, which is 3,150, and indicates that it is most likely designated correctly as a Major Highway based solely on traffic information. Tables of WADT, theoretical service levels and actual service levels are available in Appendix C.
The review of traffic volumes identified the following:
- There are 19 segments that meet the traffic threshold for a Freeway/Urban Highway designation. All of these segments are currently serviced as a Freeway/Urban Highway except for a 1.2 km segment of Highway 11 in New Liskeard, which is an urban multi-lane undivided segment with WADT of 14,200. This segment is too short to be its own winter route and if it was serviced as its own route would provide inconsistent road conditions. While this short segment of Highway 11 is serviced as a Major Highway, Ministry staff indicate that this segment currently experiences a higher service level due to the highway configuration. This is due to the cyclical nature of plow routes and close proximity of the Haileybury patrol yard, which results in multiple winter maintenance trucks travelling through this segment to reach their specified winter maintenance routes. The trucks traveling across this segment service the highway when required. This results in this 1.2 km segment of Highway 11 being serviced close to or at the Freeway/Urban Highway service level, even though it is not currently a contract requirement or official designation. Ministry staff have not received any recent winter maintenance concerns about the service level of this segment of Highwa 11.
- There are 19 segments that do not meet the traffic volume criteria for a Freeway/Urban Highway but are being serviced to this standard. In general, these segments extend the Freeway/Urban Highway service level from nearby segments that do meet the traffic volume criteria except for the Sault Ste. Marie area, where no segments meet the traffic requirement for a Freeway/Urban Highway although all of these segments are four lane divided segments. In short, segments not meeting the Freeway/Urban Highway traffic criteria are being serviced at this level as a result of completing existing routes consistently.
- A significant proportion of the Major Highway segments have traffic volumes at the low end of the Major Highway traffic volume range and 34 Major Highway segments have traffic levels below the traffic volume threshold for a Major Highway. For example, Highway 11 from Longlac to Nipigon has a WADT that ranges from 440 to 1700.
The review of existing WADT volumes shows that with the exception of a short 1.2 km segment, all highway segments are being serviced at or above the classification determined based on traffic volumes alone. The 1.2 km segment of Highway 11 is being serviced close to or at the Freeway/Urban Highway service level due to the cyclical nature of plow routes and close proximity of the Haileybury patrol yard, which results in multiple winter maintenance trucks travelling through this segment and servicing this highway segment when required. There are 36 highway segments that do not meet the traffic threshold for a Major Highway but are being serviced at that level based on the requirement that all TransCanada highways be serviced at a minimum level of Major Highway designation. A further 19 highway segments (95.5 km), which meet a Major Highway designation based on traffic volumes are being serviced as a Freeway/Urban Highway.
Existing infrastructure
Infrastructure required to support highway maintenance services include patrol yards, winter material storage facilities, garages, field offices, winter equipment and snowplow turnaround facilities. An analysis of current infrastructure required to meet the current service level requirements (i.e. Major Highway with some sections being serviced as a Freeway/Urban Highway) was completed as part of the review. The number of winter vehicles provides an indication of the resources available to combat a winter event such as snow, freezing rain, sleet, ice, drifting snow and frost. Patrol yards and winter vehicles are also supported by loaders, snowplow turnaround areas etc. The current and theoretical levels of infrastructure to provide maintenance operations at the current service levels for the subject highways are presented below in Table 9.
| Infrastructure Type | Actual Infrastructure | Theoretical Infrastructure for Current Service Levels |
|---|---|---|
| Patrol Yards | 55 | 55 |
| Combo Units | 137 | 137 |
| Plows | 9 | 9 |
| Spreaders | 3 | 3 |
| Tow-plows | 12 | 12 |
The above analysis shows that the ministry has appropriate number of patrol yards to efficiently service highways under current service levels and highway maintenance contractors have the required equipment to deliver the services at the current levels.
Bare pavement performance
MTO has a provincial performance target to meet the bare pavement standard 90% of the time, each winter across the province. The standard for bare pavement depends on highway type and the bare pavement achievement varies depending on the severity of winter weather. Some highways with low traffic volumes remain snow packed for most of the winter. Bare Pavement Standards are outlined in Table 1 of this report.
Highway winter maintenance is a continuous operation once a winter storm starts. Equipment usage and material placement are active 24 hours/7 days per week during and following a winter storm, until bare pavement is reached. Some anti-icing treatments may occur before a forecasted storm, if weather conditions allow.
A severe or long-term winter storm may delay restoration to normal driving conditions, even with the best efforts of highway maintenance crews. Rapid drops to very cold temperatures or long periods of very cold temperatures can also delay the restoration of bare pavement.
MTO’s provincial performance target is to meet the bare pavement standard 90% of the time. Results are annually reported to public. Table 10 shows the provincial Achievement for each winter season since 2004/05.
While aggregate data for provincial achievement of the bare pavement standard is published as one of MTO’s Key Performance Indicators, the ministry also publishes this data by maintenance area for the last five years. Ontario is the only jurisdiction that publishes bare pavement accomplishments publicly, while some jurisdictions record the information as an in-storm measure to confirm effectiveness of operations. Highway maintenance contracts require contractors to meet bare pavement standards at the end of each storm which is defined as the time when accumulations stop. It is understood, however, that some weather conditions do not allow for achievement of bare pavement within the time identified by the standard despite best efforts by maintenance crews. This may be due to several factors such as extreme cold weather, interruptions in servicing due to highway closures or events beyond the care and control of the contractor.
| Winter Season | Performance Target (%) | Actual Achievement (%) |
|---|---|---|
| 2004-05 | 90 | 93 |
| 2005-06 | 90 | 96 |
| 2006-07 | 90 | 96 |
| 2007-08 | 90 | 95 |
| 2008-09 | 90 | 91 |
| 2009-10 | 90 | 96 |
| 2010-11 | 90 | 94 |
| 2011-12 | 90 | 96 |
| 2012-13 | 90 | 95 |
| 2013-14 | 90 | 92 |
| 2014-15 | 90 | 92 |
| 2015-16 | 90 | 97 |
| 2016-17 | 90 | 97 |
| 2017-18 | 90 | 97 |
| 2018-19 | 90 | 96 |
| 2019-20 | 90 | 97 |
Bare pavement performance is collected on an administrative segment basis where segments are typically a winter operation route or a portion of routes. Contractors report the time bare pavement was lost, the time the storm ended (end of accumulations) and the time bare pavement was regained. As part of routine oversight activities, MTO staff verify the accuracy of the information. Contractor supplied information is not included in calculations until accepted by MTO’s Contract Administrator. While average time to achieve bare pavement after a storm is not the program level measure, it is a valid measure to evaluate local anomalies. A comparison of average hours to regain bare pavement after a winter storm indicates that there is similar but slightly longer time to regain bare pavement between Freeway/Urban Highway and Major Highway classifications, when they are compared within the same highway section.
Table 11 provides information on bare pavement performance of Highways 11 and 17.
| Highway | Highway Classification | Average Hours to Regain Bare Pavement after End of Winter Storm – 10 Year Average | Average Hours to Regain Bare Pavement after End of Winter Storm – 5 Year Average | Average Hours to Regain Bare Pavement after End of Winter Storm – 2019-20 | Average Hours to Regain Bare Pavement after End of Winter Storm – 2018-19 | Average Hours to Regain Bare Pavement after End of Winter Storm – 2017-183 | Average Hours to Regain Bare Pavement after End of Winter Storm – 2016-17 | Average Hours to Regain Bare Pavement after End of Winter Storm – 2015-16 |
|---|---|---|---|---|---|---|---|---|
| 11 | MH2 | 6.7 | 5.4 | 4.8 | 5.6 | 7.2 | 4.4 | 4.5 |
| 17 | F/UH 1 | 2.5 | 2.2 | 1.8 | 3.5 | 3.9 | 3.8 | 2.9 |
| 17 | MH 2 | 4.8 | 3.9 | 3.7 | 3.6 | 4.8 | 4.3 | 3.1 |
| 11/17 | F/UH1 | 4.9 | 4.7 | 4.1 | 8.8 | 12.23 | 3.9 | 2.5 |
| 11/17 | MH 2 | 6.5 | 5.4 | 3.8 | 6.8 | 7.4 | 3.6 | 5.4 |
1 - F/UH = Freeway/Urban Highway
2 - MH = Major Highway
3 - The data for 2017-2018 includes the period that a contractor went into creditor protection, which may have influenced their reporting accuracy
As seen in the table above, the TransCanada sections that are designated as Major Highway on average regain bare pavement below eight hours, the standard for Freeway/Urban Highways. The analysis shows that average bare pavement time for Freeway/Urban Highway and Major Highway sections of Highways 11 and 17 are well below eight hours in most cases. A comparison of Freeway/Urban Highway to Major Highway sections of Highways 11 and 17 indicates that on average the Freeway/Urban Highway sections achieve bare pavement between 0 to 20% sooner.
Bare pavement regained time for individual events varies based on factors such as weather conditions and winter operations. For example, in Winter 2019-2020, 1,612 individual bare pavement observations were recorded for Highways 11 and 17. The distribution of bare pavement achievement observations was as follows:
- 0 – 8 hours: 88% achievement
- 8 – 12 hours: 95% achievement
- 12 – 16 hours: 97% achievement
- >16* hours: 3% of events
*Some individual winter events can take extended periods (e.g. 104.5 hours for one event on Highway 11/17 in 2019/20) to achieve bare pavement despite the best efforts of highway maintenance crews due to severe storms, highway closures (e.g. due to visibility), and/or conditions that inhibit or neutralize the effectiveness of salt (i.e. very low temperatures, low traffic volumes, and/or lack of sunlight).
A comparison between the Highway 17 and 11/17 Freeway/Urban Highway sections and the 400 series highways (i.e. Freeway/Urban Highway sections) indicates that on average, 400 series highways regain bare pavement sooner after the end of a winter storm. Based on the five-year average, Freeway/Urban Highway TransCanada highways in Northern Ontario on average regain bare pavement within 2.2 to 4.7 hours whereas Freeway/Urban Highway 400 series highways on average regain bare pavement within 2.3 hours. A more detailed analysis would be required to determine the specific reason(s) for the performance differential. Possible reasons could be the known benefits of higher traffic and warmer temperatures as well as the use of technologies such as anti-icing liquids, referred to as Direct Liquid Application (DLA).
Table 12 provides information on bare pavement performance of 400 series highways.
| Highway | Highway Classification | Average Hours to Regain Bare Pavement after Accumulation Stops 10 Year Average |
Average Hours to Regain Bare Pavement after Accumulation Stops 5 Year Average |
Average Hours to Regain Bare Pavement after Accumulation Stops 2018-19 |
Average Hours to Regain Bare Pavement after Accumulation Stops 2017-182 |
Average Hours to Regain Bare Pavement after Accumulation Stops 2016-17 |
Average Hours to Regain Bare Pavement after Accumulation Stops 2015-16 |
Average Hours to Regain Bare Pavement after Accumulation Stops 2014-15 |
|---|---|---|---|---|---|---|---|---|
| 400 | F/UH 1 | 3.4 | 3.2 | 2.1 | 2.4 | 4.8 | 3.5 | 3.6 |
| 401 | F/UH 1 | 2.3 | 1.9 | 1.5 | 2.0 | 2.3 | 1.8 | 1.8 |
| 402 | F/UH 1 | 2.2 | 1.6 | 0.7 | 2.5 | 2.1 | 0.7 | 1.9 |
| 403 | F/UH 1 | 2.0 | 1.5 | 1.2 | 1.3 | 1.9 | 1.2 | 1.9 |
| 404* | F/UH 1 | 1.5 | 1.6 | 0.8 | 1.7 | 1.8 | 1.6 | 1.6 |
| 405 | F/UH 1 | 2.4 | 1.8 | 1.7 | 2.2 | 1.8 | 1.9 | 1.5 |
| 406 | F/UH 1 | 1.7 | 1.4 | 1.0 | 0.5 | 2.0 | 1.8 | 1.8 |
| 409* | F/UH 1 | 2.3 | 1.8 | 0.5 | 1.5 | 2.3 | 1.7 | 1.9 |
| 410* | F/UH 1 | 3.0 | 2.0 | 1.9 | 2.3 | 2.8 | 1.4 | 1.8 |
| 416 | F/UH 1 | 2.5 | 2.3 | 1.8 | 2.3 | 2.2 | 2.2 | 2.6 |
| 417* | F/UH 1 | 2.3 | 2.3 | 0.8 | 1.7 | 2.3 | 3.5 | 2.4 |
| 420 | F/UH 1 | 2.3 | 1.7 | 1.7 | 2.2 | 1.8 | 1.7 | 1.5 |
| 427* | F/UH 1 | 2.3 | 1.7 | 0.6 | 1.5 | 2.2 | 1.5 | 2.0 |
| QEW | F/UH 1 | 2.0 | 1.4 | 1.2 | 1.4 | 1.6 | 1.2 | 1.9 |
| Average | N/A | 2.3 | 1.9 | 1.3 | 1.8 | 2.3 | 1.8 | 2.0 |
1 -F/UH = Freeway/Urban Highway
2 - The data for 2017-2018 includes the period that a contractor went into creditor protection, which may have influenced their reporting accuracy
3 - Includes sections of Urban Freeway Service as part of the new CDMC models which began in 2018-19
Services available to travellers and planned improvements
Ontario 511
The Ministry is committed to providing the public with information about our highways in the north during the winter season via Ontario 511 services.
Ontario 511 is a bilingual digital traveller information service designed by and for users to help people plan their routes and travel safely and efficiently across the province of Ontario.
The Ontario 511 service can be accessed via three channels:
1) internet: Ontario.ca/511.
2) Twitter: using main or regional accounts.

| Account | English | French |
|---|---|---|
| Main | @511Ontario | @Ontario511 |
| Central Region | @511ONCentral | @ON511Centre |
| West Region | @511ONWest | @ON511Ouest |
| East Region | @511ONEastern | @ON511Est |
| Northeast Region | @511ONNortheast | @ON511NordEst |
| Northwest Region | @511ONNorthwest | @ON511NordOuest |
3) telephone: dial
4) mobile app: new Ontario 511 app.
The Ontario 511 website provides near real-time highway information as well detailed information about travel hubs and services to help the public plan their travel. Some of the most popular Ontario 511 information sets include:
- cameras showing real-time images, with 77 cameras in northern Ontario
- incidents/Closures
- traffic speeds
Annually, the Ontario 511 website is visited by approximately 2.38 million users, with over 228,000 users being from northern communities.
Ontario 511 in the winter
To further assist travellers with planning their journeys during the winter, Ontario 511 provides additional information:
- road conditions reported by Area Maintenance Contractors several times per day
- weather forecasts and radar provided by Environment Canada
- forecasted Driving Conditions based on weather forecasts and pavement temperatures
- Track My Plow feature with current and past locations of winter maintenance vehicles

During winter months, Ontario 511 partners extensively with MTO’s Traffic Operations Centres and the Ministry Emergency Management and Planning Office to ensure Environment Canada weather information is monitored continuously, and weather alerts are posted on the Ontario 511 website and Twitter accounts. For example, if a storm is expected in the north, Ontario 511 will publish tweets showing the weather radar with the storm coming in and a picture of our plows out in that area of the province.
My 511
Ontario 511 also offers personalized features which helps registered users plan their travel more efficiently:
- My Cameras: Users can select and save their favourite cameras for a quick view of what's happening along their route.
- My Routes: Users can save their favourite routes allowing them to quickly enter their route and what's happening on the highway.
- Route Notifications: Users can receive text/email notifications for events and travel delays along their saved routes. Route Notifications help keep travellers informed, especially in the winter months, when highways may be closed due to weather conditions.
Ontario 511 App
Ontario's 511 app is now available to all drivers across the province, with new features to help make winter driving easier to plan. This includes the ability to view winter road conditions and use the Track My Plow feature to track the location of snowplows on provincial highways. The Ontario 511 app also provides images from over 600 cameras and includes up-to-date highway information on construction, rest areas, collisions and road closures.
Planned improvements
Ontario 511 is committed to continuously improving services to best meet the needs of users, Northern Ontarians being important users of the services.
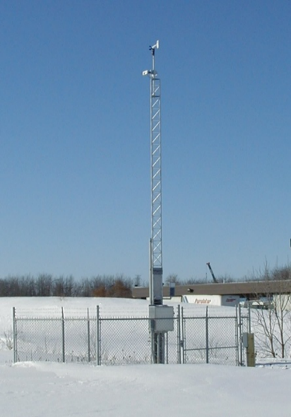
To provide Northern Ontarians with better sightlines to our highways and improve MTO awareness of current road and weather conditions, MTO is building more RWIS stations. Over the next year, MTO is installing 14 new RWIS stations in Northern Ontario including eight on Highways 11 and 17. The cameras from these stations will be added to the Ontario 511 website and the stations will be used to further improve forecasted driving information provided to 511 users. RWIS stations are also an important tool for maintenance contractors for information to make operational decisions related to winter maintenance operations. In addition to the expansion of the RWIS stations, the ministry has added 16 solar-powered "mini-RWIS" stations at remote locations in Northern Ontario where power and communications are limited to enhance weather forecasting and winter maintenance operations.
Ontario 511 is also working with the OPP and other stakeholders to help educate the public on safe winter driving and how Ontario 511 can help the public plan their journey during the winter.
Assessment: upgrading to Freeway/Urban Highway winter service level
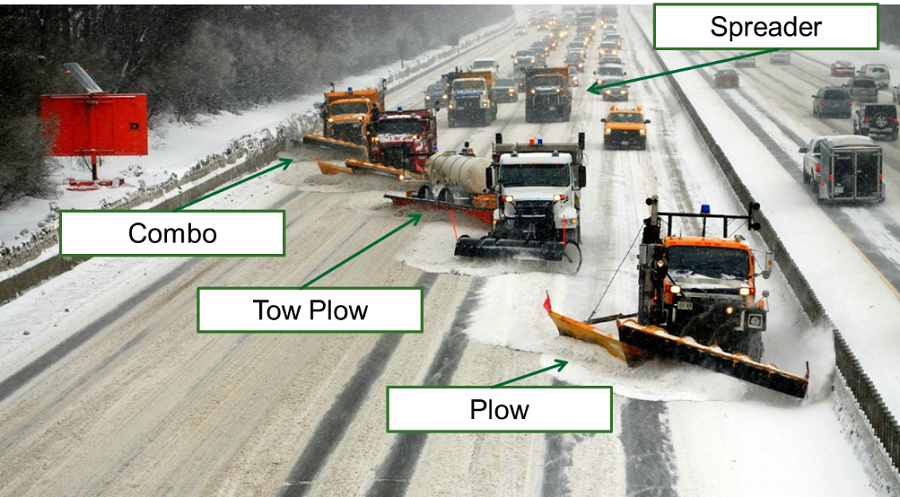
An assessment of benefits and costs related to increasing the level of service to a Freeway/Urban Highway service level has been carried out. This includes review of the inventory of existing infrastructure (i.e. patrol yards, storage facilities, garages and winter vehicles) and an assessment of infrastructure required to service at a Freeway/Urban Highway service level. The term "winter vehicles" is commonly used in the maintenance industry to define winter maintenance equipment and includes snowplows, spreaders, combination units (i.e. equipment capable of plowing and spreading winter materials), tow-plows and in some cases, graders used for winter maintenance purposes.
The determination of the number and type of winter equipment to provide a particular service level is based on route analysis. The winter equipment routes and the types of equipment required are designed following an established process that requires local knowledge and rationalization to ensure efficient use of equipment and consistent service outcomes. Alternative combinations of winter vehicles and routes are possible although the equipment identified below is anticipated to reflect an optimal or close to optimal equipment complement.
The inventory of infrastructure needs is provided in Table 3 below. A significant amount of infrastructure such as additional patrol yards, storage facilities and equipment (as well as operators) will be needed to increase the service level to a Freeway/Urban Highway across all subject highways. It is anticipated that six additional patrol yards with storage facilities and several additional snowplow turnaround locations. Further analysis is required to determine the number of additional snowplow turnaround locations although it is expected to be in the magnitude of 50 turnaround locations. It is also anticipated that an additional 69 winter vehicles supported by 115 additional operators will also be required. Winter vehicles (except for tow-plows) are generally supported by 2.25 operators per unit. Additional loaders would also be required for new patrol yards and larger loaders may be required to support the increased number of winter vehicles being loaded at existing patrol yards.
| Infrastructure Type | Existing Available | Need for Upgrade to Freeway/Urban Highway | Additional Requirement |
|---|---|---|---|
| Patrol Yards | 55 | 61 | 6 |
| Combo Units | 137 | 175 | 38 |
| Plows | 9 | 23 | 14 |
| Spreaders | 3 | 2 | -1 |
| Tow-plows | 12 | 30 | 18 |
| Spares | 24 | Optional (10%) | Optional (10%) |
The additional cost to upgrade to Freeway/Urban Highway service level includes initial construction costs for six new patrol yards with storage facilities at an estimated cost of $2,000,000 to $5,000,000 per yard for a total cost of $12,000,000 to $30,000,000. Several existing patrol yards will require upgrades to accommodate additional equipment and anti-icing liquid storage tanks which is estimated to be $100,000 per yard for a total cost of $4,000,000. Additional snowplow turnaround locations are estimated at a cost of $100,000 per turnaround location for a total cost of $5,000,000. The one-time capital cost for new infrastructure is estimated to be $21,000,000 to $39,000,000.
In addition, there would be ongoing costs for the operation and maintenance of the patrol yards and turnaround locations as well as the annual costs for the additional equipment and materials as shown in Table 4. The annual operating cost to support the increase in service level to a Freeway/Urban Highway service level is estimated to be approximately $18.1 million per year. With a 10-year amortization of capital expenditures, the annual fiscal impact is estimated at $20.2 to $22 million in 2020 dollars.
| Infrastructure Type | Additional Required for Upgrade to Freeway/Urban Highway | Estimated Annual Cost per Addition | Additional Annual Costs for Upgrade to Freeway/Urban Highway |
|---|---|---|---|
| Patrol Yards – maintenance | 6 | $50,000 | $300,000 |
| Combo Units (with operators) | 38 | $240,000 | $9,120,000 |
| Plows (with operators) | 14 | $185,000 | $2,590,000 |
| Spreaders (with operators) | -1 | $185,000 | -$185,000 |
| Tow-plows | 18 | $100,000 | $1,800,000 |
| Loaders (new or upgrades - estimated) | N/A | N/A | $500,000 |
| Salt (estimated) | N/A | N/A | $4,000,000 |
| Amortization of Capital Expenditures | N/A | N/A | $2,100,000 to $3,900,000 |
| Total | N/A | N/A | $20,225,000 to $22,025,000 |
Increasing the service level from Major Highway to Freeway/Urban Highway is anticipated to require additional winter materials. Although the exact needs are difficult to determine at this time, it is anticipated that approximately 35,000 tonnes of additional salt will be needed annually, which equates to approximately $4,000,000 per year. Increased salt usage will have environmental impacts and may further strain the salt supply market within Ontario, based on recent price increases and feedback from salt suppliers about having limited availability of salt. Further research is needed to determine an accurate estimate of the additional salt usage impacts.
The estimated annual operating cost of approximately $20.2 million to $22 million represents an 18.2 to 19.8% increase over the $111 million estimated 2019-2020 Northern Ontario highway maintenance expenditures.
Another consideration in the cost analysis is the anticipated significant increase in the amount of equipment "dead-heading" based on the physical location of patrol yards. Dead-heading is defined as the distance of travel with no operations underway that a unit must go to reach the beginning of its route. Dead-heading results in operational inefficiencies, higher than optimal equipment levels, increased travel with equipment not plowing or spreading, inefficient routes, increased fuel costs, increased generation of greenhouse gases, negative public perception (e.g. plows driving with their plows up). The construction of additional patrol yards is expected to improve maintenance operations and reduce the amount of dead heading. The analysis reviewed new patrol yard needs and the use of existing yards. Optimization of operations would also benefit from the relocation of many patrol yards, but the review determined that this may not be economically viable.
Winter traffic volumes, climatic conditions and route times all impact the time required to regain bare pavement. Highway winter level of service designation and traffic volumes are closely interlinked as traffic plays an important role in ensuring necessary interaction between salt and snow/ice for the efficient removal or snow/ice. Better winter maintenance is not delivered solely by more frequent plow and spreader activity. Best maintenance practices include sufficient time for salt to work on the snow and ice. Salt requires time to work and depending on conditions, local maintenance personnel sometimes need to delay plows and spreaders from redeploying on their routes to allow the salt to work. This prevents plowing off the previously applied salt and is consistent with best salt management practices to minimize impacts on the environment. Upgrading lower volume highway sections to a Freeway/Urban Highway designation may not provide the most effective winter maintenance operations or performance as higher traffic volumes facilitate better interaction of salt with snow/ice. Additionally, a Freeway/Urban Highway designation may still result in highway closures during periods of poor visibility or dangerous driving conditions.
Hiring operators for additional equipment would not be without its challenges. Winter maintenance staff recruitment and retention is an industry challenge in Ontario as in other jurisdictions including jurisdictions that use in-house resources. Driving winter maintenance equipment involves irregular hours, driving in poor weather, driving in poor road conditions, focused attention and managing other drivers determined to pass snowplows. To understand and develop solutions to the challenge, MTO and the Ontario Road Builders' Association (ORBA) formed an Operators Working Group and continue to work together to find solutions to ease the problem of winter maintenance staff recruitment and retention. One industry initiative involved the development of a Highway Maintenance Worker Program in a partnership with Northern College in Timmins. Other options under consideration include increasing the amount of summer work within highway maintenance Contracts to retain winter maintenance operators through the summer and adjusting the size of Area Maintenance contracts to encourage local contractors who can provide year-round work for construction personnel. The availability of winter maintenance operators is anticipated to continue to be a challenge in the years to come and may be particularly challenging in remote areas. Current challenges will be further amplified if additional staffing resources are required to accomplish service improvements and additional staffing resources may not be readily available throughout the province and especially in remote areas. Attracting staff to remote areas may require contractors to provide remote living allowances and on-site accommodation for operators, which would further add to the costs.
In conclusion, it is assessed that increasing service levels for Highways 11 and 17 to an Urban Freeway service level would be costly and less efficient and is likely to provide only incremental improvement. An additional 69 pieces of winter equipment will be required with increased dead-heading and an additional 115 operators will be required which will further exacerbate the current operator shortage. The capital cost is anticipated to be approximately $21 million to $39 million to increase the level of service and the estimated annual operating cost would be approximately $20.2 million to $22 million, which represents an 18.2 to 19.8% increase to the approximately $111 million 2019-20 Northern Ontario maintenance expenditure.
Opportunities for improvement
Following extensive industry consultation, jurisdictional review and review of best practices, the ministry has recently developed two new contract models to help to ensure sustainable delivery of the maintenance program. These new models, the CDMC and MDMC models, have been in use since 2017 and 2018 respectively and their performance feedback so far has been very promising.
As the existing maintenance contracts come up for re-tender, the ministry has been adopting either the CDMC or MDMC model for new procurements. As part of the procurement process, the ministry has been redesigning maintenance routes, where possible, using theoretical route circuit times, which provides an opportunity to reduce route time and enhance the in-storm service in very heavy snowfalls. New procurements also provide an opportunity to employ technologies such as the use of anti-icing liquids that have been used primarily in the south but have since evolved as a viable approach in the north, although limited opportunities are expected due to the colder climate. Anti-icing liquids are a useful maintenance tool but require specific weather conditions to be effective.
Several MTO initiatives and programs are also underway to support travellers on Northern Ontario highways. MTO continues to expand the RWIS to better inform drivers, assist maintenance personnel with operational decisions including the use of anti-icing liquids, and to schedule optimal operations. MTO also continues to invest in the improvement of northern highway rest areas to provide drivers and commercial operators a safe place to stop during winter season.
The review of Highways 11 and 17 winter level of service has identified several opportunities for improvements. Several improvements are already underway:
- Implement local improvements to address site specific challenges.
- The review identified the benefit of local engagement and the need to implement local improvements to address site specific challenges. MTO continues to monitor and deliver site specific improvements based on stakeholder feedback and concerns. An example of ongoing work is discussed below.
- A working group comprising MTO, OPP and local municipalities was formed to enhance safety on Highway 11 in the Temagami area. The working group has identified operational safety improvements and public education opportunities. Currently, MTO is working with Area Maintenance Contractors to implement the use of DLA on the Highway 11 corridor between North Bay and Cochrane.
- Increase equipment levels by using target route circuit times instead of maximum circuit times to determine equipment levels.
- The review confirmed the benefits of using theoretical route times to determine equipment needs. Currently, the maximum route time is set as the requirement for the majority of contracts. The ministry has been moving towards using theoretical route times, where practical, in new contracts. Using theoretical routes to determine actual routes and equipment complements is expected to enhance winter maintenance. For example, the maximum route time for Major Highways is 2.2 hours, while the theoretical route time is 1.8 hours.
- Use of non-traditional winter maintenance equipment.
- Non-traditional winter maintenance equipment may provide benefit in addressing issues that are more prevalent in Northern Ontario. Where appropriate, MTO and contractors continue to work together to explore opportunities to supplement traditional winter maintenance equipment with alternative equipment configurations, such as larger capacity trucks that may be beneficial where route segments are limited due to the material carrying capacity of traditional trucks.
- Require contractors to apply anti-icing liquids when conditions permit.
- Requiring the use of anti-icing liquids on Highways 11 and 17 would incorporate technology that has been used as a pre-treatment on high-volume 400 series highways in Southern Ontario. The use of anti-icing liquids before storms under certain conditions can delay the accumulation of initial snowfall, prevent snow from binding to the road surface and forming ice. Thought to be limited to warmer temperatures, advancements in the technology now permit its use in colder climates. The technology is being used in the Sudbury CDMC and the Huntsville CDMC with some success.
- Add spare winter equipment to Highways 11 or 17 patrol yards, as required.
- A spare winter vehicle improves reliability in the event of a winter vehicle breakdown during a storm event. All new procurements by the Ministry now include contract requirement for spares representing 10% of the equipment complement. The ministry continues to work with contractors to ensure adequate spares are available at all patrol yards.
- Expand the highway information available for maintenance operations.
- RWIS stations provide critical road condition and weather information that supports the timely and effective delivery of winter maintenance operations. MTO continues to expand its network of RWIS stations. The new stations will improve the ministry's ability to respond appropriately to changing winter weather conditions and enhance winter maintenance services.
- Similarly, cameras are an important tool that provide useful visual information of the road conditions to support the planning of winter operations. MTO continues to expand the installation of highway cameras and cameras at patrol yards in Northern Ontario.
- Increase public awareness of winter maintenance operations and safe winter driving techniques.
- Increased public awareness of winter maintenance operations can improve public safety by providing an understanding of how winter operations work and reminding drivers to practice good winter driving techniques.
- MTO continues to explore and implement alternatives such as changeable message signs with messaging controlled remotely by regional Traffic Operations Centres to provide real-time information to travellers, such as poor conditions, highway closures etc.
- Partnerships with local broadcasters may provide an alternative channel to provide travellers with public safety messages regarding upcoming winter weather as well as road and weather conditions.
- Implement Rest Areas Improvements.
- Rest areas play a key role in supporting the safe movement of goods across the province. The Ministry has been implementing a coordinated approach towards rest areas improvements.
- The expansion and improvement of several rest areas in Ontario is currently underway. In Northern Ontario a multi-year plan is being developed to improve existing rest areas and develop new sites to fill gaps in Northern Ontario.
- Implement Capital Construction Program Safety Improvements.
- The Ministry's maintenance function continues to provide input into the construction program for capital improvements that improve safety.
- Typical improvements include safety enhancements such as improving highway geometrics and guiderail improvements, rock and tree removal to enhance the clear zone, snow drifting prevention measures, enhancing snow storage areas, installation of electronic signs, and improved pavement markings including the use of more durable recessed pavement markings.
Research opportunities to improve standards and best practices
Continual improvement is necessary to maintain a strong maintenance program and MTO's reputation of having some of the highest standards in North America. Changes to standards, best practices, materials and technologies need to be supported by research including research into new technologies, equipment and techniques. Opportunities listed below require further research and have the potential to improve winter maintenance in Northern Ontario including Highways 11 and 17.
- Review the efficiency of different types of equipment.
- Based on feedback from the field, there is some evidence that tow-plow trailers are less effective in heavy, wet snow along highway sections with long, steep grades and winter traffic volumes at or above 5000 WADT.
- A research analysis is planned to examine options for tow-plow trailers improvements such as minimum engine requirements for the main unit, alternative blade configurations (e.g. segmented blades) etc.
- Review the effectiveness of underbody plows to remove/prevent snowpack.
- Underbody plows may be able to remove snowpack more effectively. Compared to standard plows, underbody plows can exert better downward pressure, thereby removing snowpack more efficiently.
- These types of plow could prevent and remove snowpack.
- Snowpack on highways can be difficult to remove with regular plows and low temperatures can prevent salt from melting snowpack. Snowpack reduces traction compared to bare pavement.
- Snowpack can occur in Northern Ontario as low temperatures often prevent salt from successfully removing it. Depending on conditions, salt is less effective in melting snow or ice at or below certain temperatures.
- Further research is needed to assess the amount of snowpack occurring on Highways 11 and 17 as well as the effectiveness of underbody plows for preventing/removing snowpack.
- Review the use of unconventional winter equipment.
- The ministry purchased a Raiko icebreaker equipment in 2017. The Raiko is a snow/ice pack breaker that attaches to the front of a plow truck. It has since been used to remove snow/ice pack from the pavement surface when salt becomes ineffective. When temperatures suddenly and significantly drop following a heavy snow event it is often very difficult to remove snow and ice with conventional methods such as salt and ice blades. This addition has made some noteworthy improvement in achieving bare pavement conditions in some cases. Upon completion of further trials a decision will be made whether this technology should be implemented more widely.
- Investigate the benefits of applying sand treated with liquid calcium or magnesium.
- Sand can be an effective treatment for Major Highway sections under certain conditions, such as extreme cold weather. Pre-wet sand may be more effective than dry sand in retaining traction on Major Highway sections by increasing the amount of sand that remains on the road during spreading, and from wind and traffic.
- MTO has an ongoing pre-wet sand trial in Owen Sound. Depending on the results of this trial, this technology could be expanded to Major Highway sections on Highways 11 and 17.
- Investigate the benefits of pre-wet salt and pre-treated salt.
- Experience shows that pre-wet salt and pre-treated salt may be effective in reducing the amount of salt that bounces off the pavement during application. This would ensure that more salt remains on roadways to melt snow and ice.
- MTO is conducting trials using these materials. The results of this trial may identify potential benefits of using of these materials on Highways 11 and 17.
- Investigate the benefits of a combined salt-sand application, known as "sweet mix".
- Current practices prescribe either salt or sand application depending on conditions. Sweet mixes may provide the de-icing benefits of salt and the benefits of improved traction from sand before salt has fully melted ice and snow.
- MTO plans to conduct trials using these materials. The results of this trial may identify potential benefits of using of these materials on Highways 11 and 17.
- Explore new and innovative techniques for highway maintenance in lower temperature conditions.
- MTO plans to conduct a jurisdictional scan of the latest techniques used in other jurisdictions for winter maintenance in very cold temperature conditions. Supplementing our regular monitoring process of new innovations, a formal review will ensure that MTO's program remains at the cutting edge of highway maintenance techniques.
- The ministry has also been experimenting with fine graded salt for the past two winters. The supplier of fine graded salt is an out of province supplier, which improves the competition and supply of winter salt. The finer graded salt activates more quickly and helps achieve bare pavement on highways during lower temperatures.
- Deploy additional winter equipment during severe winter storms when possible.
- MTO plans to explore the benefits and contractual implications of requiring service providers to deploy more winter equipment during severe storm events where snowfall rates reach a predetermined threshold.
- During high-intensity snowfalls, road conditions deteriorate faster than under normal- or low-intensity snowfalls. Equipment allotted for passing lanes or truck climbing lanes could be diverted to supplement winter maintenance efforts on the travelled lanes during severe winter storms.
- Research the efficiencies of different equipment complements.
- MTO plans to conduct research analysis of the efficiencies of combination units versus separate plow and spreader complements. The research would incorporate a review of costs, dead-heading time, reloading time and impacts related to the availability of operators.
- MTO also plans to conduct research analysis of the opportunities for larger spreaders (e.g. quad axle trucks similar to those used by Highway 407).
Next steps
MTO has already started implementing opportunities for improvement to further enhance the delivery of winter maintenance on Highways 11 and 17. Details of ongoing and upcoming improvements is included at Appendix E.
In conjunction with improvement opportunities, MTO is also progressing research work that will enable the ministry to leverage research results to deliver more effective and efficient winter maintenance services.
MTO will also continue to review our standards, processes and techniques for continuing improvement in the delivery of winter maintenance.
References
- Matthews, L., Zhao, Y. and Andrey, J. (2018). Developing Climate Severity Factors Affecting Equipment Complement of Area Maintenance Contracts. Highway Infrastructure Innovation Funding Program.
Appendix A
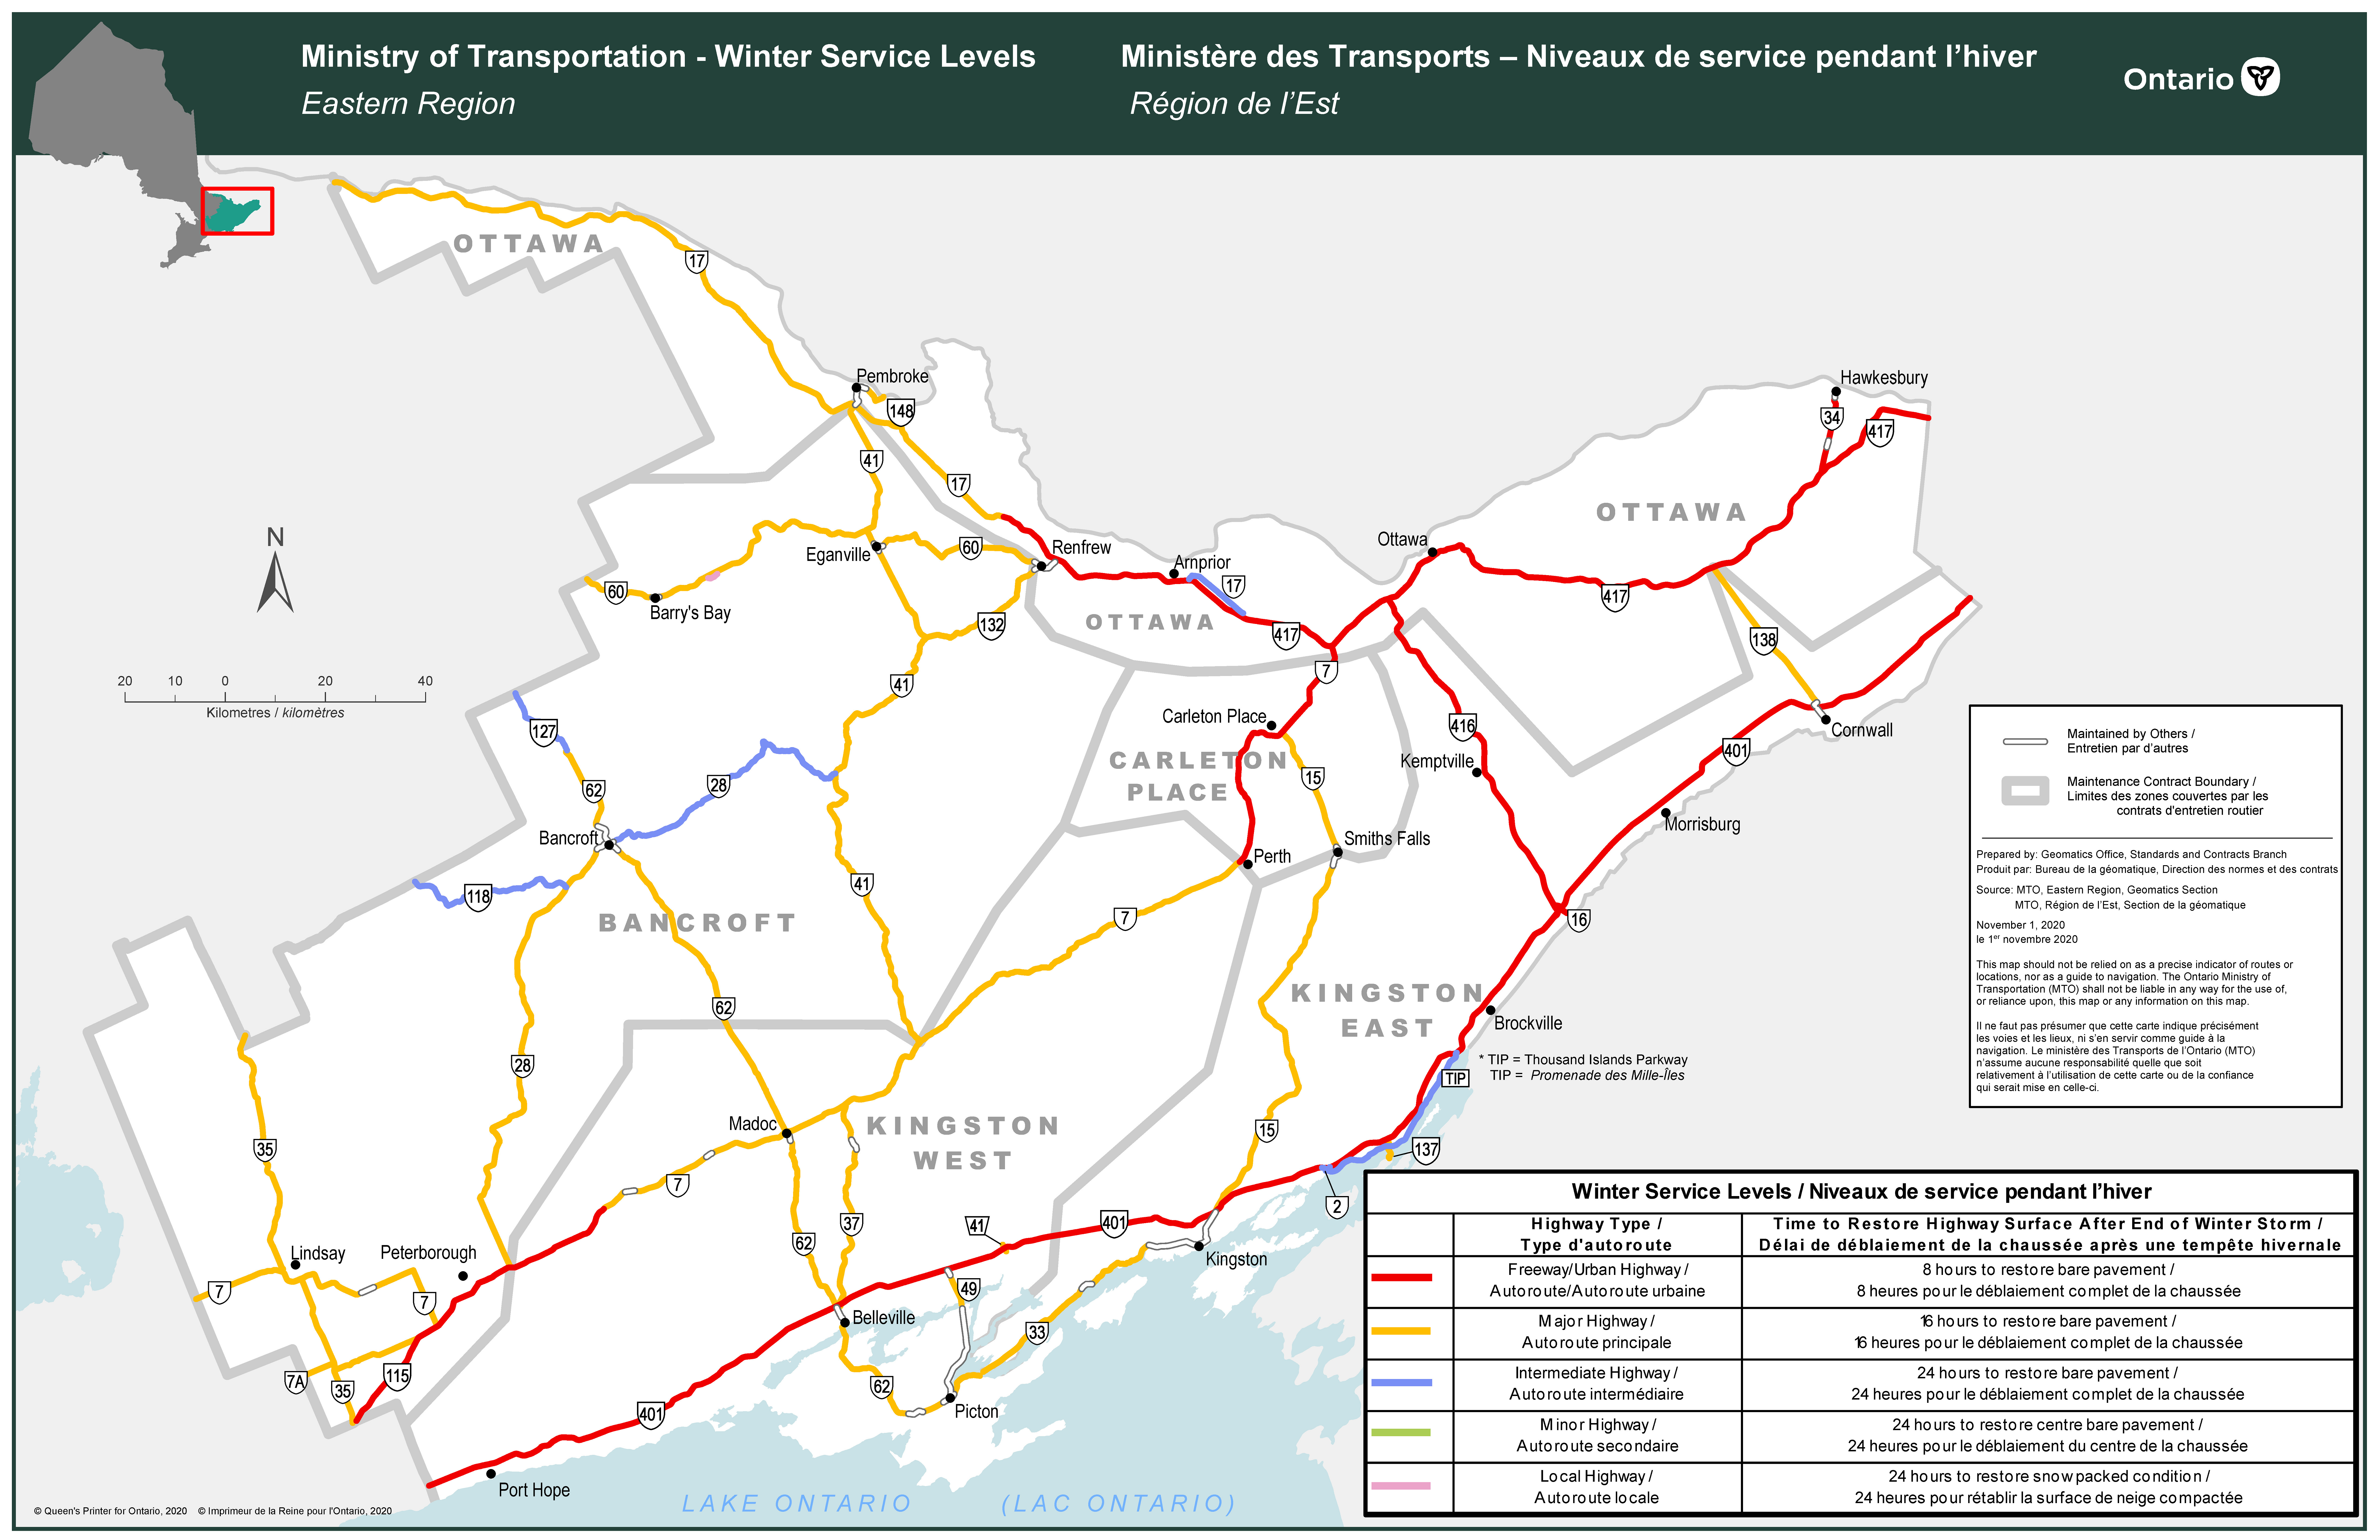
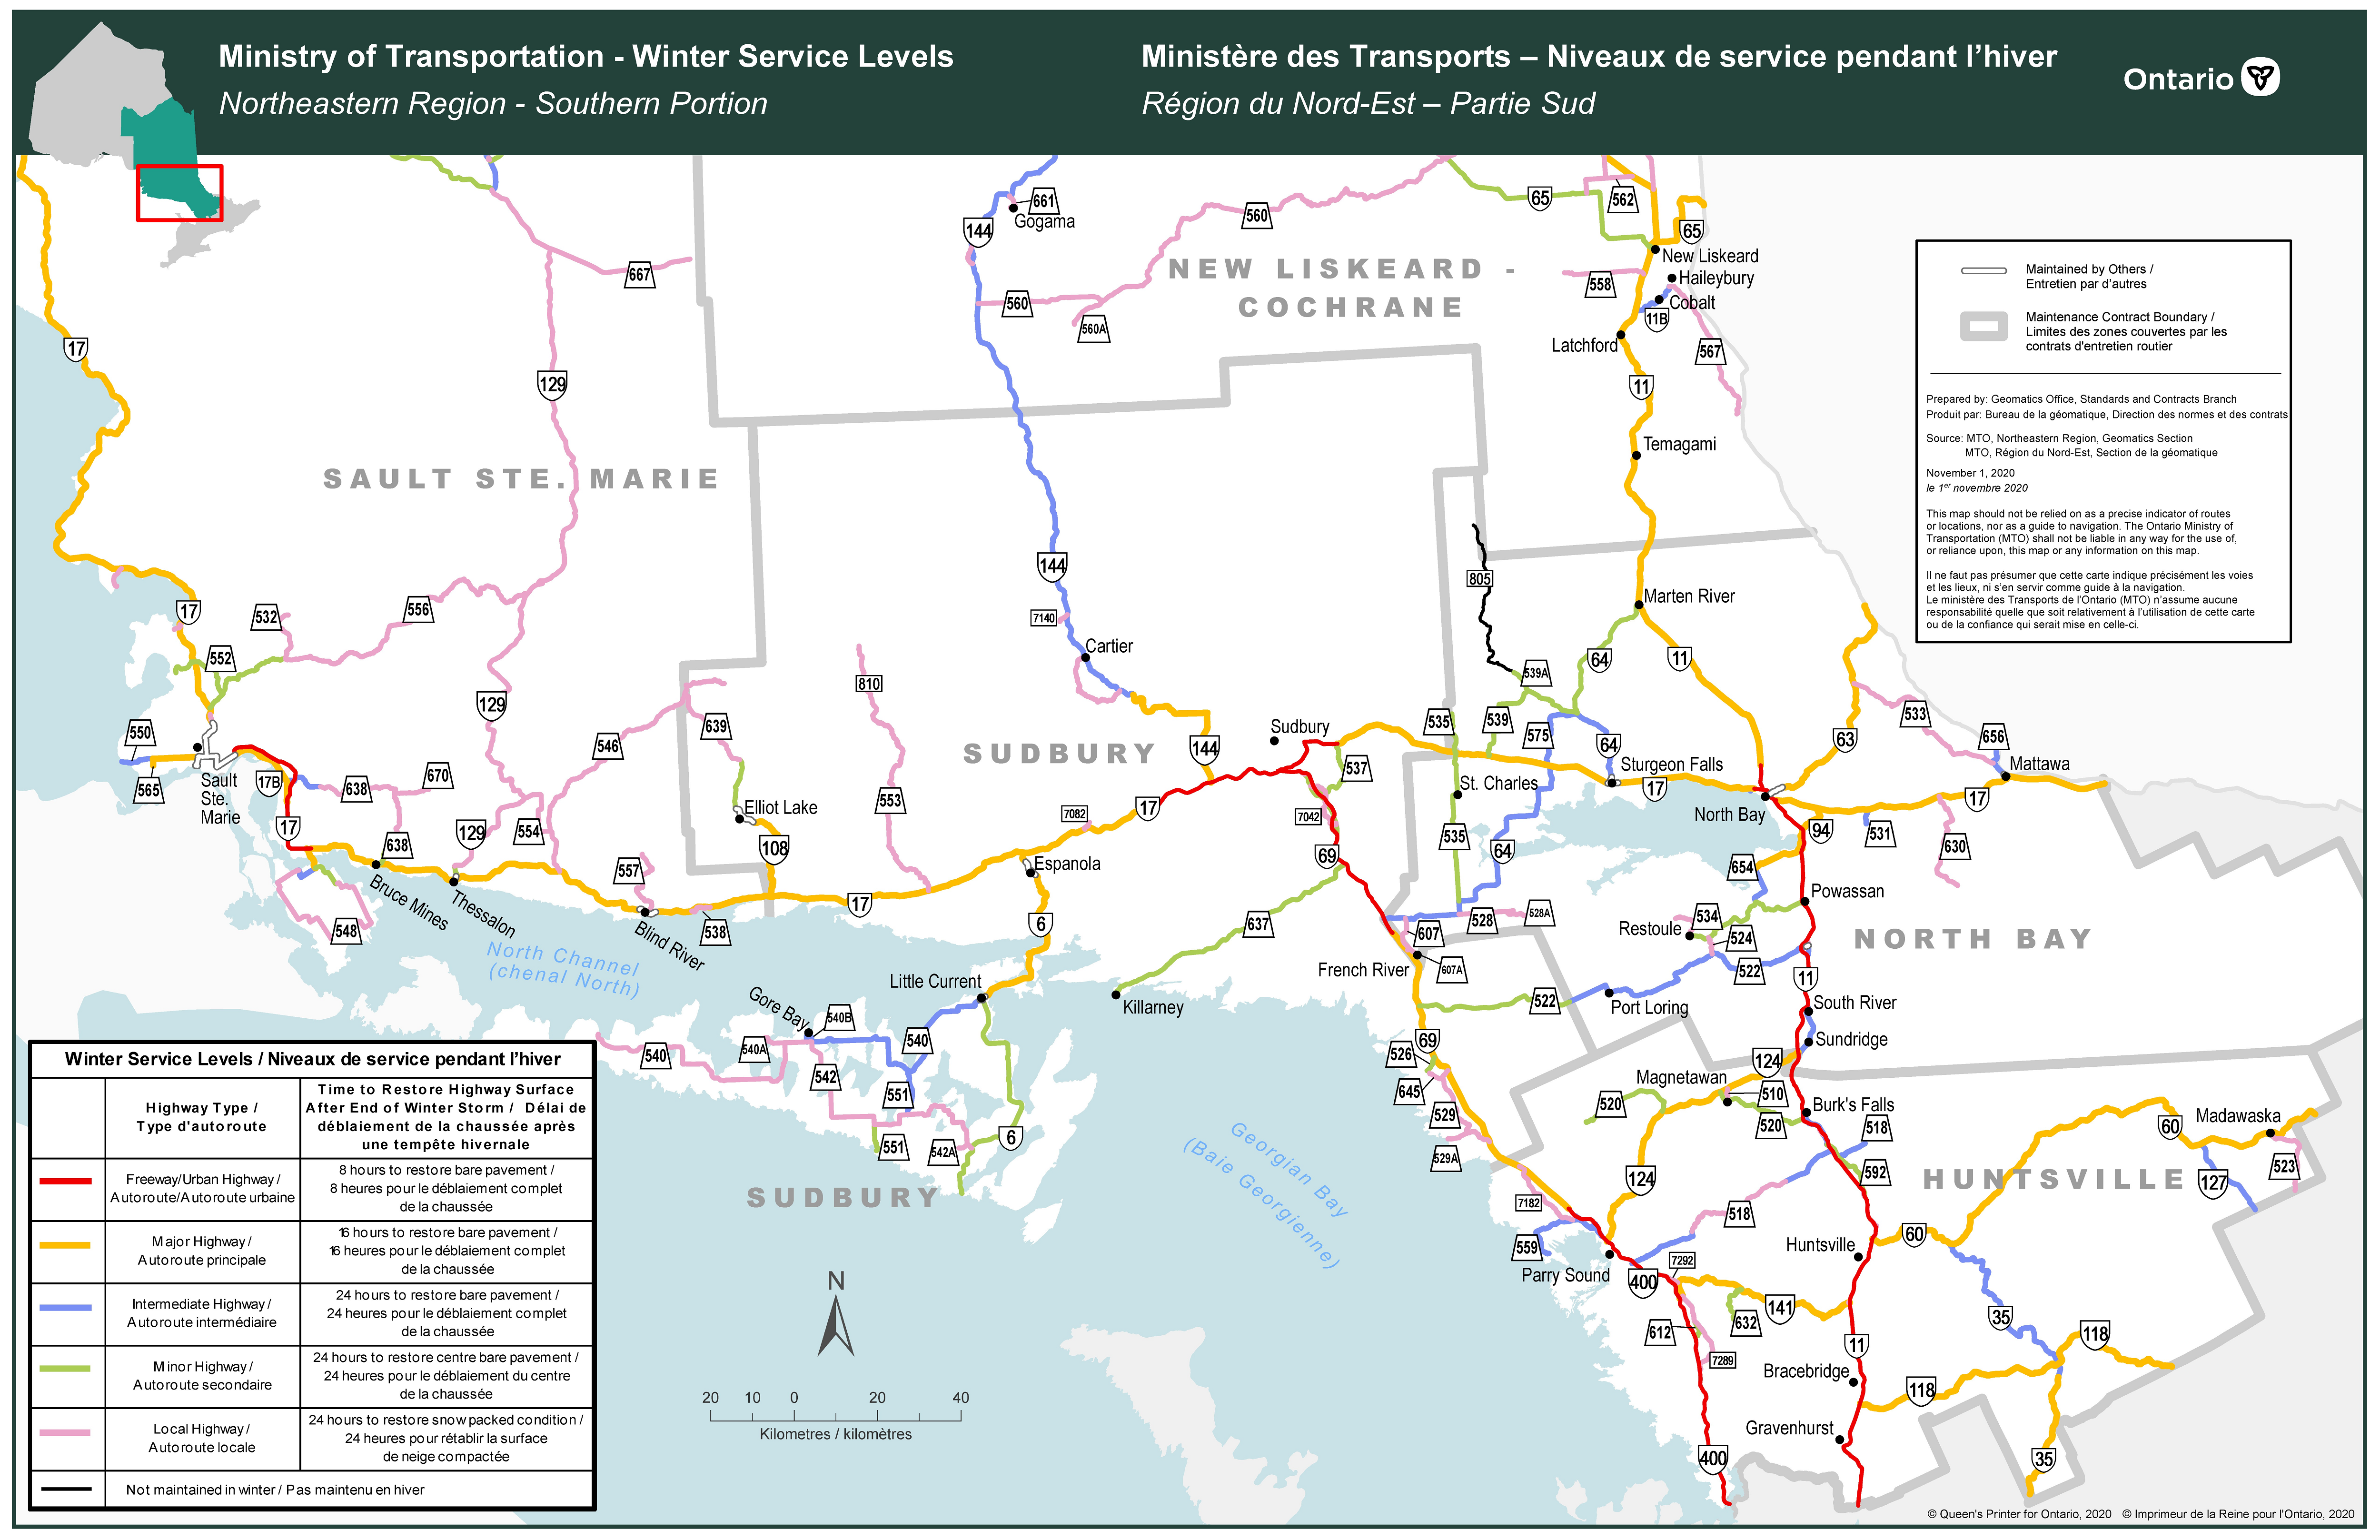
Appendix B
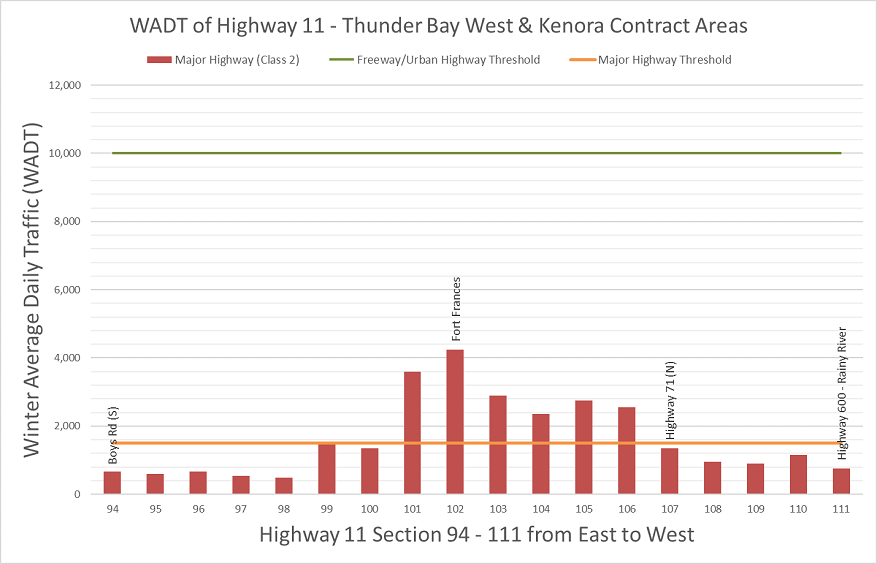
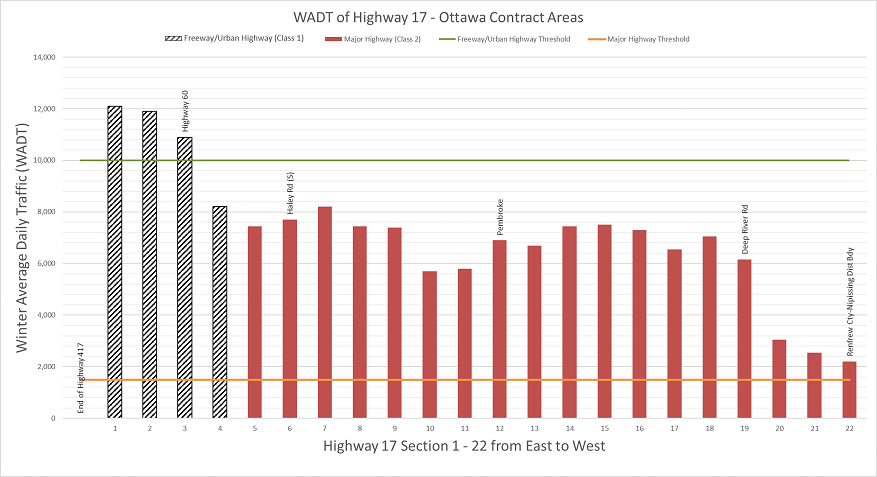
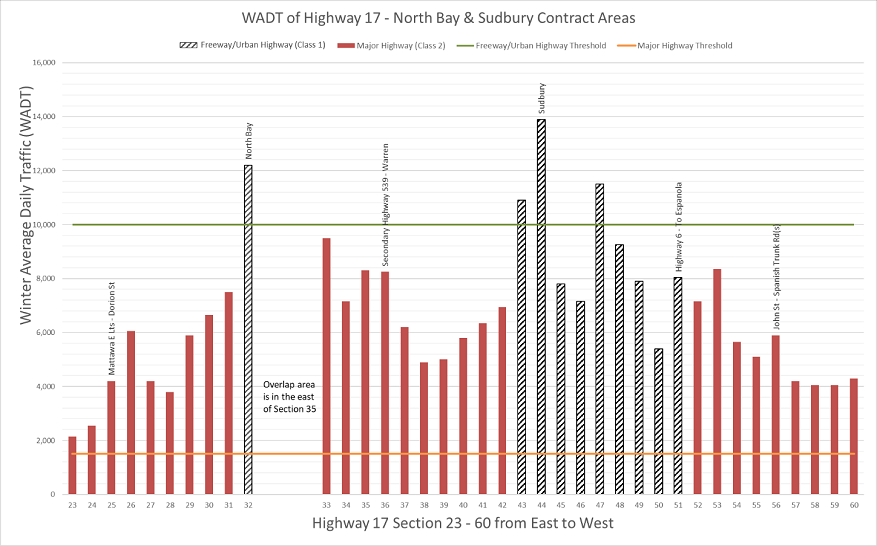
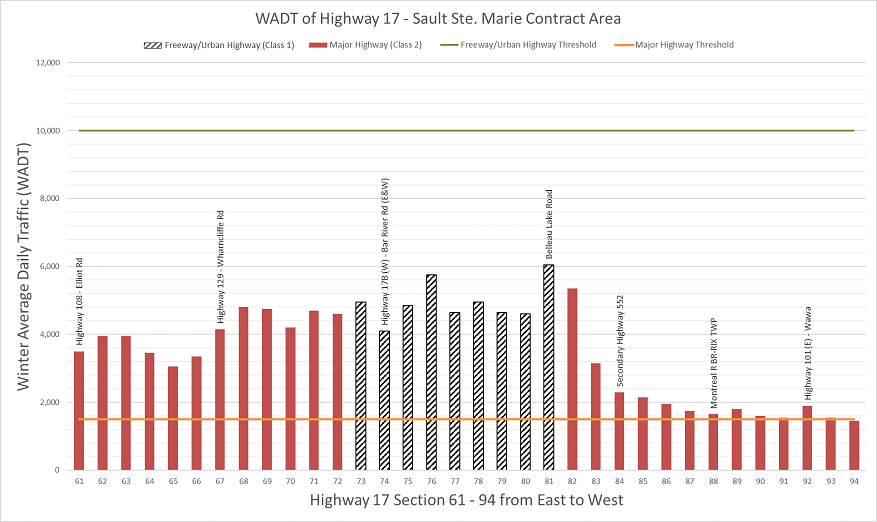
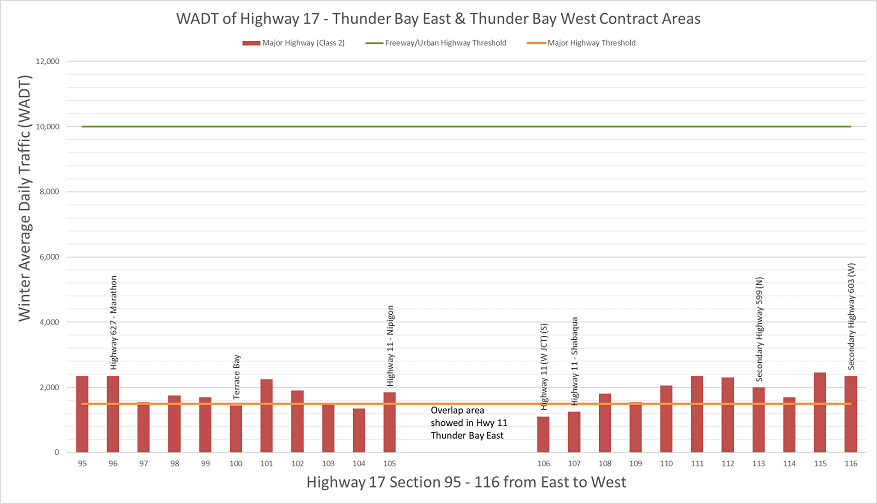
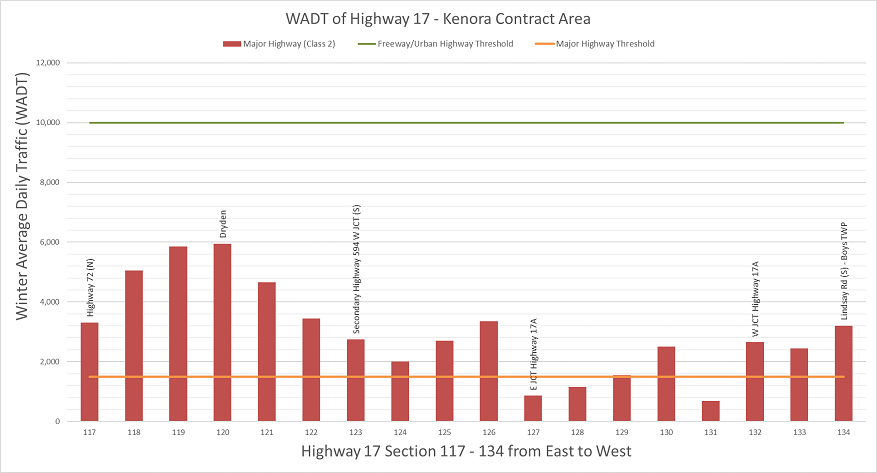
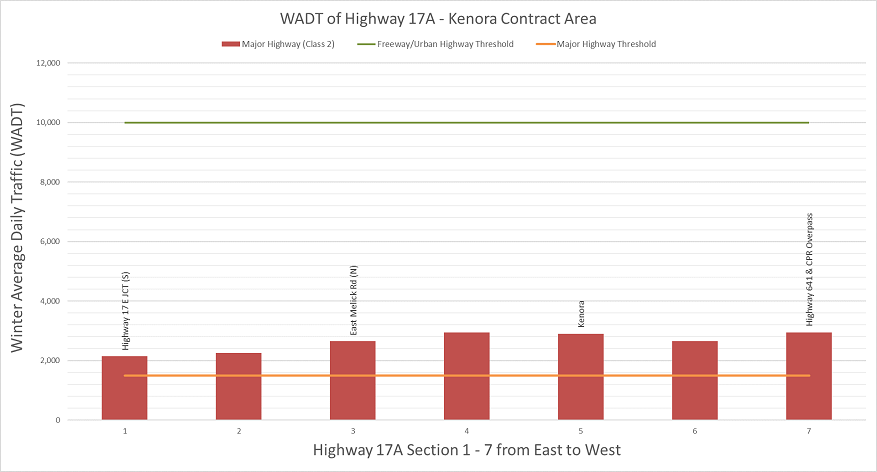
Appendix C
Highway 11 Segment WADT, Theoretical LOS and Actual LOS
Table 1:
| Highway | Contract area | Section number | Section identification | WADT | Theoretical LOS based on WADT | Actual LOS | Class adjustment |
|---|---|---|---|---|---|---|---|
| 11 | North Bay | 1 | S JCT HWY 17-IC | 23,900 | 1 | 1 | - |
| 11 | North Bay | 2 | SEYMOUR ST | 24,100 | 1 | 1 | - |
| 11 | North Bay | 3 | HWY 17B(FISHER ST)W-NORTHGATE SQ ENT (E) | 21,300 | 1 | 1 | - |
| 11 | North Bay | 4 | HWY 63(TROUT LK RD) E-CASSELLS ST (W) | 24,500 | 1 | 1 | - |
| 11 | North Bay | 5 | O'BRIEN ST | 19,200 | 1 | 1 | - |
| 11 | North Bay | 6 | N JCT HWYS 17/11B (ALGONQUIN AV) | 26,500 | 1 | 1 | - |
| 11 | North Bay | 7 | SHERRIFF AV (E) | 21,200 | 1 | 1 | - |
| 11 | North Bay | 8 | AIRPORT RD (E) MCKEOWN AV (W) | 7,200 | 2 | 1 | +1 |
| 11 | North Bay | 9 | CEDAR HEIGHTS RD | 6,200 | 2 | 2 | - |
| 11 | North Bay | 10 | COOK'S MILL RD (W) ROY DR (E) | 3,250 | 2 | 2 | - |
| 11 | North Bay | 11 | PARKWOODVILLA ENT (W) | 2,600 | 2 | 2 | - |
| 11 | North Bay | 12 | HWY 64(W) | 2,900 | 2 | 2 | - |
| 11 | North Bay | 13 | LAKESHORE DR (W) | 3,800 | 2 | 2 | - |
| 11 | New Liskeard | 14 | LATCHFORD S LTS | 4,250 | 2 | 2 | - |
| 11 | New Liskeard | 15 | S JCT HWY 11B (E) | 5,250 | 2 | 2 | - |
| 11 | New Liskeard | 16 | SEC HWY 558 | 4,200 | 2 | 2 | - |
| 11 | New Liskeard | 17 | S JCT HWY 65 IC – WHITEWOOD AVE (E) | 7,250 | 2 | 2 | - |
| 11 | New Liskeard | 18 | N JCT HWY 65 AND HWY 11 | 14,200 | 1 | 2 | -1 |
| 11 | New Liskeard | 19 | ROLAND RD (E) | 6,100 | 2 | 2 | - |
| 11 | New Liskeard | 20 | S JCT SEC HWY 569(N)HILLIARDTOWN RD (E) | 5,950 | 2 | 2 | - |
| 11 | New Liskeard | 21 | SEC HWY 562(W)GRAVEL RD (E) | 4,450 | 2 | 2 | - |
| 11 | New Liskeard | 22 | SEC HWY 571 (W) | 4,150 | 2 | 2 | - |
| 11 | New Liskeard | 23 | N JCT SEC HWY 569 (E)(TO SEC HWY 624) | 4,850 | 2 | 2 | - |
| 11 | New Liskeard | 24 | SEC HWY 560 (W) 9TH ST (E) | 3,800 | 2 | 2 | - |
| 11 | New Liskeard | 25 | HWY 112 (E) | 2,100 | 2 | 2 | - |
| 11 | New Liskeard | 26 | HWY 66 | 3,700 | 2 | 2 | - |
| 11 | New Liskeard | 27 | SEC HWY 568 (E) | 3,600 | 2 | 2 | - |
| 11 | New Liskeard | 28 | SEC HWY 570 (E) | 2,550 | 2 | 2 | - |
| 11 | New Liskeard | 29 | TIMISKAMING-COCHRANE DIST BDY | 2,900 | 2 | 2 | - |
| 11 | New Liskeard | 30 | SEC HWY 572 (E) | 2,750 | 2 | 2 | - |
| 11 | New Liskeard | 31 | E JCT HWY 101-4TH AVE | 4,100 | 2 | 2 | - |
| 11 | New Liskeard | 32 | W JCT HWY 101 (W) | 2,050 | 2 | 2 | - |
| 11 | New Liskeard | 33 | SHILLINGTON RD – OLD JCT HWY 577 | 1,950 | 2 | 2 | - |
| 11 | New Liskeard | 34 | MUNICIPAL RD (W) | 2,550 | 2 | 2 | - |
| 11 | New Liskeard | 35 | N JCT HWY 67 (E) CEMETERY RD (W) | 1,800 | 2 | 2 | - |
| 11 | New Liskeard | 36 | NELLIE LK RD-BARLINGHOFF RD-OLD HWY 578 | 2,500 | 2 | 2 | - |
| 11 | New Liskeard | 37 | WICKLOW R BR (S) | 2,600 | 2 | 2 | - |
| 11 | New Liskeard | 38 | SEC HWYS 579 & 652 (THIRD AV-COCHRANE) | 2,150 | 2 | 2 | - |
| 11 | New Liskeard | 39 | SEC HWY 636 | 2,400 | 2 | 2 | - |
| 11 | New Liskeard | 40 | SEC HWY 668 | 2,800 | 2 | 2 | - |
| 11 | New Liskeard | 41 | SEC HWY 655 | N/A | N/A | N/A | N/A |
| 11 | New Liskeard | 42 | SEC HWY 634 | 3,000 | 2 | 2 | - |
| 11 | New Liskeard | 43 | GROUNDHOG R BR | 2,900 | 2 | 2 | - |
| 11 | New Liskeard | 44 | SEC HWY 581-MOONBEAM (N) BEAUVIS RD (S) | 3,850 | 2 | 2 | - |
| 11 | New Liskeard | 45 | KAPUSKASING W LTS END OF NON ASSUMED | 2,200 | 2 | 2 | - |
| 11 | New Liskeard | 46 | BERNARD ST (N) | 1,900 | 2 | 2 | - |
| 11 | New Liskeard | 47 | DEVITT TWP RD C6-7 | 2,200 | 2 | 2 | - |
| 11 | New Liskeard | 48 | MATTAWISHKWIA R BR | 3,050 | 2 | 2 | - |
| 11 | New Liskeard | 49 | 15TH S (S) END OF NON ASSUMED | 2,950 | 2 | 2 | - |
| 11 | New Liskeard | 50 | 17.200KM W OF NINTH ST (E) | 2,750 | 2 | 2 | - |
| 11 | New Liskeard | 51 | SEC HWY 663 (TO CALSTOCK STA) | 1,350 | 3 | 2 | +1 |
| 11 | New Liskeard | 52 | SEC HWY 631 | 1,150 | 3 | 2 | +1 |
| 11 | Thunder Bay East | 53 | CLAVET TWP W BDY | 900 | 4 | 2 | +2 |
| 11 | Thunder Bay East | 54 | SEC HWY 625 (S) – (TO CARAMAT) | 1,050 | 3 | 2 | +1 |
| 11 | Thunder Bay East | 55 | DALEY TWP – LONGLACE LTS | 1,200 | 3 | 2 | +1 |
| 11 | Thunder Bay East | 56 | CNR OH – E ABUT | 1,700 | 2 | 2 | - |
| 11 | Thunder Bay East | 57 | MACLEOD PROV PARK ENT (S) | 1,550 | 2 | 2 | - |
| 11 | Thunder Bay East | 58 | SEC HWY 584 (N) – TO GERALDTON HARDROCK DR (S) | 1,300 | 3 | 2 | +1 |
| 11 | Thunder Bay East | 59 | GOLDFIELD RD (S) | 1,250 | 3 | 2 | +1 |
| 11 | Thunder Bay East | 60 | NOBLE AVE (N) | 1,100 | 3 | 2 | +1 |
| 11 | Thunder Bay East | 61 | HWY 580 – LEITCH RD (N) | 1,100 | 3 | 2 | +1 |
| 11 | Thunder Bay East | 62 | LOUISE AVE (E&W) | 440 | 5 | 2 | +3 |
| 11 | Thunder Bay East | 63 | KITTO-KILKENNY TWP BDY | 1,250 | 3 | 2 | +1 |
| 11 | Thunder Bay East | 64 | ROYAL WINDSOR RD (W) | 1,450 | 3 | 2 | +1 |
| 11 | Thunder Bay East | 65 | HOGARTH RD (W) – LEDGER TWP | 1,100 | 3 | 2 | +1 |
| 11 | Thunder Bay East | 66 | HWY 17 – NIPIGON | 3,850 | 2 | 2 | - |
| 11 | Thunder Bay East | 67 | WB PASSING LANE STARTS | 3,500 | 2 | 2 | - |
| 11 | Thunder Bay East | 68 | FIRST ST (S) – W JCT NIPIGON RD | 4,550 | 2 | 2 | - |
| 11 | Thunder Bay East | 69 | SEC HWY 585 – CAMERON FALLS RD (N) | 2,600 | 2 | 2 | - |
| 11 | Thunder Bay East | 70 | SEC HWY 628 (E) – TO RED ROCK | 2,900 | 2 | 2 | - |
| 11 | Thunder Bay East | 71 | HWY 582 (S JCT) – HURKETT RD (E) – BLACK STURGEON RD (W) | 3,000 | 2 | 2 | - |
| 11 | Thunder Bay East | 72 | 7.400 KM S OF HWY 582 (S JCT) – HURKETT RD (E) – BLACK STURGEON RD (W) | 2,700 | 2 | 2 | - |
| 11 | Thunder Bay East | 73 | CPROH – DORION TWP RDL2 – OUIMET | 3,150 | 2 | 2 | - |
| 11 | Thunder Bay East | 74 | SEC HWY 587 – PASS LAKE RD (E) | 3,350 | 2 | 2 | - |
| 11 | Thunder Bay East | 75 | LAKESHORE DR € | 4,250 | 2 | 2 | - |
| 11 | Thunder Bay East | 76 | MACKENZIE STATION RD/LAKESHORE DR (WESTCONNECTION) HWY 7242 | 4,750 | 2 | 2 | - |
| 11 | Thunder Bay East | 77 | SEC HWY 527 (W) /SPRUCE RIVER RD (E) | 5,500 | 2 | 1 | +1 |
| 11 | Thunder Bay East | 78 | HWYS 11B/17B-HODDER AVE (E) /COPENHAGEN RD (W) | 6,400 | 2 | 1 | +1 |
| 11 | Thunder Bay East | 79 | THUNDER-ATIKOK TO THUNDER-SUP N | 10,500 | 1 | 1 | - |
| 11 | Thunder Bay East | 80 | HWY 102 (W)/ RED RIVER RD (E) - THUNDER BAY | 14,500 | 1 | 1 | - |
| 11 | Thunder Bay East | 81 | THUNDER-SUP N TO THUNDER-ATIKOK | 15,400 | 1 | 1 | - |
| 11 | Thunder Bay East | 82 | OLIVER RD (E&W) – THUNDER BAY | 19,700 | 1 | 1 | - |
| 11 | Thunder Bay East | 83 | HWY 61 (S) /HARBOUR EXP (E) | 5,750 | 2 | 2 | - |
| 11 | Thunder Bay East | 84 | MAPLEWARD RD | 3,150 | 2 | 2 | - |
| 11 | Thunder Bay East | 85 | TWIN CITY CROSS ROAD | 2,650 | 2 | 2 | - |
| 11 | Thunder Bay East | 86 | HWY 130 (S) – VIBERT RD (N) | 5,950 | 2 | 2 | - |
| 11 | Thunder Bay East | 87 | SEC HWY 588 (S) | 3,500 | 2 | 2 | - |
| 11 | Thunder Bay East | 88 | OLIVER RD (N) – TO MURILLO | 4,250 | 2 | 2 | - |
| 11 | Thunder Bay East | 89 | SEC HWY 590 (S) | 1,850 | 2 | 2 | - |
| 11 | Thunder Bay East | 90 | HWY 102 (N) – SISTONEN'S CORNER | 2,850 | 2 | 2 | - |
| 11 | Thunder Bay East | 91 | FINMARK RD (N) | 2,800 | 2 | 2 | - |
| 11 | Thunder Bay East | 92 | HWY 17 – SHABAQUA | 940 | 4 | 2 | +2 |
| 11 | Thunder Bay East | 93 | SEC HWY 586 (S) | 740 | 4 | 2 | +2 |
| 11 | Thunder Bay E/W | 94 | BOYES RD (S) | 660 | 4 | 2 | +2 |
| 11 | Thunder Bay West | 95 | SEC HWY 633 – KAWENE RD (N) – TO QUETICO CENTRE | 590 | 4 | 2 | +2 |
| 11 | Thunder Bay West | 96 | SEC HWY 623 – SAPAWE RD (N) | 660 | 4 | 2 | +2 |
| 11 | Thunder Bay West | 97 | HWY 11B – TO ATIKOKAN (N) | 550 | 4 | 2 | +2 |
| 11 | Kenora | 98 | SEINE R BR (EAST EXPANSION JOINT) | 490 | 5 | 2 | +3 |
| 11 | Kenora | 99 | SEC HWY 502 – MANITOU RD (N) | 1,500 | 2 | 2 | - |
| 11 | Kenora | 100 | WINDY POINT BR | 1,350 | 3 | 2 | +h1 |
| 11 | Kenora | 101 | FIVE MILE DOCK RD (S) – RAINY LAKE TO HWY 7048 | 3,600 | 2 | 2 | - |
| 11 | Kenora | 102 | OAKWOOD RD (S)(FORT FRANCES W LTS) – END OF N | 4,250 | 2 | 2 | - |
| 11 | Kenora | 103 | E JCT SEC HWY 611 (S) | 2,900 | 2 | 2 | - |
| 11 | Kenora | 104 | SEC HWY 613 – DEVLIN | 2,350 | 2 | 2 | - |
| 11 | Kenora | 105 | W JCT SEC HWY 602 (S) – EMO | 2,750 | 2 | 2 | - |
| 11 | Kenora | 106 | EMO WEST LIMIT SIGN | 2,550 | 2 | 2 | - |
| 11 | Kenora | 107 | W JCT HWY 71 (N) – DOBIE TWP | 1,350 | 3 | 2 | +1 |
| 11 | Kenora | 108 | SEC HWY 617 (N) – BOUCHERVILLE RD (S) | 950 | 4 | 2 | +2 |
| 11 | Kenora | 109 | SEC HWY 621 (TO MORSON) (N) – SLEEMAN | 910 | 4 | 2 | +2 |
| 11 | Kenora | 110 | ATWOOD – WORTHINGTON RD #1 (N&S) | 1,150 | 3 | 2 | +1 |
| 11 | Kenora | 111 | SEC HWY 600 (N) | 760 | 4 | 2 | +2 |
Highway 17 Segment WADT, Theoretical LOS and Actual LOS
Table 2:
| Highway | Contract area | Section number | Section identification | WADT | Theoretical LOS based on WADT | Actual LOS | Class adjustment |
|---|---|---|---|---|---|---|---|
| 17 | Ottawa | 1 | CTY RD508-CALABOGIE RD (S) CTY RD54 – MCLEAN DR (N) | 12,100 | 1 | 1 | - |
| 17 | Ottawa | 2 | RENFREW RD 63-ANDERSON RD (S) MILLER RD (N) | 11,900 | 1 | 1 | - |
| 17 | Ottawa | 3 | HWY 60-O'BRIEN RD (S) | 10,900 | 1 | 1 | - |
| 17 | Ottawa | 4 | REN. RD 4-STORYLAND RD (N) PINNACLE RD (S) | 8,200 | 2 | 1 | |
| 17 | Ottawa | 5 | CTY RD 653 – CHENAUX (N) CTY RD 61-GODFREY RD (S) | 7,450 | 2 | 2 | - |
| 17 | Ottawa | 6 | HALEY RD (S) | 7,700 | 2 | 2 | - |
| 17 | Ottawa | 7 | RENFREW RD 21-FORESTERS FALLS RD (N) | 8,200 | 2 | 2 | - |
| 17 | Ottawa | 8 | COWLEY ST | 7,450 | 2 | 2 | - |
| 17 | Ottawa | 9 | CORNERVIEW RD (N) RENFREW RD 12-MOUNTAIN RD (S) | 7,400 | 2 | 2 | - |
| 17 | Ottawa | 10 | RENFREW RD 40-GREENWOOD RD (N) | 5,700 | 2 | 2 | - |
| 17 | Ottawa | 11 | RENFREW RD 24-WHITE WATER RD | 5,800 | 2 | 2 | - |
| 17 | Ottawa | 12 | HWY 41 (S) HWY 41-PAUL MARTIN DR (N) | 6,900 | 2 | 2 | - |
| 17 | Ottawa | 13 | RENFREW CTY RD 58 – ROUND LAKE ROAD | 6,700 | 2 | 2 | - |
| 17 | Ottawa | 14 | RENFREW RD 42-FOREST LEA RD | 7,450 | 2 | 2 | - |
| 17 | Ottawa | 15 | RENFREW RD 26-DORAN RD | 7,500 | 2 | 2 | - |
| 17 | Ottawa | 16 | RENFREW RD 37-MURPHY RD | 7,300 | 2 | 2 | - |
| 17 | Ottawa | 17 | PETAWAWA BUCHANAN BDY | 6,550 | 2 | 2 | - |
| 17 | Ottawa | 18 | ALBERT ST-CHALK RIVER | 7,050 | 2 | 2 | - |
| 17 | Ottawa | 19 | DEEP RIVER RD | 6,150 | 2 | 2 | - |
| 17 | Ottawa | 20 | DEEP RIVER N LTS-ROLPH TWP S BDY | 3,050 | 2 | 2 | - |
| 17 | Ottawa | 21 | SEC HWY 635-ROLPHTON | 2,550 | 2 | 2 | - |
| 17 | Ottawa | 22 | CPR SUBWAY-STONECLIFFE | 2,200 | 2 | 2 | - |
| 17 | North Bay | 23 | CPR OVERHEAD-DEUX RIVERS | 2,150 | 2 | 2 | - |
| 17 | North Bay | 24 | RENFREW CTY-NIPISSING DIST BDY | 2,550 | 2 | 2 | - |
| 17 | North Bay | 25 | MATTAWA E LTS-DORION ST | 4,200 | 2 | 2 | - |
| 17 | North Bay | 26 | SEC HWY 533-MAIN ST-MATTAWA | 6,050 | 2 | 2 | - |
| 17 | North Bay | 27 | MATTAWA W LTS-WEST ST | 4,200 | 2 | 2 | - |
| 17 | North Bay | 28 | SEC HWY 630-EAU CLAIRE RD (S) | 3,800 | 2 | 2 | - |
| 17 | North Bay | 29 | SEC HWY 531-BONFIELD RD | 5,900 | 2 | 2 | - |
| 17 | North Bay | 30 | HWY 94 (S) E JCT CENTENNIAL CRES (N) | 6,650 | 2 | 2 | - |
| 17 | North Bay | 31 | W JCT CENTENNIAL CR (N) | 7,500 | 2 | 2 | - |
| 17 | North Bay | 32 | N JCT HWYS 11/11B-ALGONQUIN AV-NORTH BAY | 12,200 | 1 | 1 | - |
| 17 | North Bay | 33 | GORMANVILLE RD | 9,500 | 2 | 2 | - |
| 17 | North Bay | 34 | HWY 17B-COMMANDA TWP | 7,150 | 2 | 2 | - |
| 17 | North Bay | 35 | CNR NIPISSING IND RES #10 | 8,300 | 2 | 2 | - |
| 17 | North Bay | 36 | STURGEON FALLS W LTS END OF NON ASSUMED | 8,250 | 2 | 2 | - |
| 17 | North Bay | 37 | THISBEAULT RD-SPRINGER TWP | 6,200 | 2 | 2 | - |
| 17 | North Bay | 38 | HWY 64-CALDWELL TWP | 4,900 | 2 | 2 | - |
| 17 | North Bay | 39 | SEC HWY 539-WARREN | 5,000 | 2 | 2 | - |
| 17 | Sudbury | 40 | SEC HWY 535-HAGAR | 5,800 | 2 | 2 | - |
| 17 | Sudbury | 41 | MARKSTAY RD-MAIN ST (N) NEPEWASSI LK RD (S) | 6,350 | 2 | 2 | - |
| 17 | Sudbury | 42 | JOUDREY DR | 6,950 | 2 | 2 | - |
| 17 | Sudbury | 43 | SEC HWY 537-NICKEL CENTRE | 10,900 | 1 | 1 | - |
| 17 | Sudbury | 44 | REG RD 90-GARSON CONISTON RD (N) | 13,900 | 1 | 1 | - |
| 17 | Sudbury | 45 | E JCT SUDBURY REG RD 55 | 7,800 | 2 | 1 | +1 |
| 17 | Sudbury | 46 | HWY 69 IC OP (E & WBL) | 7,150 | 2 | 1 | +1 |
| 17 | Sudbury | 47 | SUDBURY RD 80-LONG LAKE RD | 11,500 | 1 | 1 | - |
| 17 | Sudbury | 48 | FIELDING RD (N) KANTOLA RD (S) | 9,250 | 2 | 1 | +1 |
| 17 | Sudbury | 49 | SUDBURY RD 55 IC UP | 7,900 | 2 | 1 | +1 |
| 17 | Sudbury | 50 | HWY 144 UP IC | 5,400 | 2 | 1 | +1 |
| 17 | Sudbury | 51 | W JCT SUDBURY REG RD 44 | 8,050 | 2 | 1 | +1 |
| 17 | Sudbury | 52 | FAIRBANKS LAKE RD (N) DEN/LOU RD (S) | 7,150 | 2 | 2 | - |
| 17 | Sudbury | 53 | SMITH ST (S) HWY 7082 (N) | 8,350 | 2 | 2 | - |
| 17 | Sudbury | 54 | HWY 6 (TO ESPANOLA) | 5,650 | 2 | 2 | - |
| 17 | Sudbury | 55 | WEBWOOD E LTS | 5,100 | 2 | 2 | - |
| 17 | Sudbury | 56 | AUX SABLE R BR | 5,900 | 2 | 2 | - |
| 17 | Sudbury | 57 | SEC HWY 553-IMPERIAL ST-MASSEY | 4,200 | 2 | 2 | - |
| 17 | Sudbury | 58 | MASSEY W LTS | 4,050 | 2 | 2 | - |
| 17 | Sudbury | 59 | JOHN ST-SPANISH TRUNK RD (S) | 4,050 | 2 | 2 | - |
| 17 | Sudbury | 60 | IMPERIAL RD-CUTLER | 4,300 | 2 | 2 | - |
| 17 | Sault Ste. Marie | 61 | HWY 108-ELLIOT LAKE RD | 3,500 | 2 | 2 | - |
| 17 | Sault Ste. Marie | 62 | E JCT SEC HWY 538 | 3,950 | 2 | 2 | - |
| 17 | Sault Ste. Marie | 63 | W JCT HWY 538 (S) | 3,950 | 2 | 2 | - |
| 17 | Sault Ste. Marie | 64 | BLIND RIVER W LTS END OF NON ASSUMED | 3,450 | 2 | 2 | - |
| 17 | Sault Ste. Marie | 65 | DEAN LAKE RD | 3,050 | 2 | 2 | - |
| 17 | Sault Ste. Marie | 66 | SEC HWY 546 | 3,350 | 2 | 2 | - |
| 17 | Sault Ste. Marie | 67 | HWY 129-WHARNCLIFFE RD | 4,150 | 2 | 2 | - |
| 17 | Sault Ste. Marie | 68 | LAKE ST (S) | 4,800 | 2 | 2 | - |
| 17 | Sault Ste. Marie | 69 | BRUCE MINES E LTS-PLUMMER ADD'L TWP SIGN | 4,750 | 2 | 2 | - |
| 17 | Sault Ste. Marie | 70 | E JCT SEC HWY 638-RICHARDSON ST-BRUCE MINES | 4,200 | 2 | 2 | - |
| 17 | Sault Ste. Marie | 71 | BRUCE MINES W LTS | 4,700 | 2 | 2 | - |
| 17 | Sault Ste. Marie | 72 | GORDON LAKE RD-JOHNSON TWP | 4,600 | 2 | 2 | - |
| 17 | Sault Ste. Marie | 73 | SEC HWY 548 (S) | 4,950 | 2 | 2 | - |
| 17 | Sault Ste. Marie | 74 | HWY 17B (W) – BAR RIVER RD (E&W) | 4,100 | 2 | 1 | +1 |
| 17 | Sault Ste. Marie | 75 | EAST JCT HWY 638/17 | 4,850 | 2 | 1 | +1 |
| 17 | Sault Ste. Marie | 76 | LOWER ECHO RIVER | 5,750 | 2 | 1 | +1 |
| 17 | Sault Ste. Marie | 77 | ECHO BAY RIVER ROAD UP | 4,650 | 2 | 1 | +1 |
| 17 | Sault Ste. Marie | 78 | NOONDAY RD (N) | 4,950 | 2 | 1 | +1 |
| 17 | Sault Ste. Marie | 79 | GARDEN RIVER BR | 4,650 | 2 | 1 | +1 |
| 17 | Sault Ste. Marie | 80 | SYRETTE LAKE ROAD | 4,600 | 2 | 1 | +1 |
| 17 | Sault Ste. Marie | 81 | BELLEAU LAKE ROAD | 6,050 | 2 | 1 | +1 |
| 17 | Sault Ste. Marie | 82 | SAULT STE. MTO ALOGOMA-MAINTOU | 5,350 | 2 | 2 | - |
| 17 | Sault Ste. Marie | 83 | SEC HWY 556-HEYDEN (E) | 3,150 | 2 | 2 | - |
| 17 | Sault Ste. Marie | 84 | SEC HWY 552 | 2,300 | 2 | 2 | - |
| 17 | Sault Ste. Marie | 85 | HARMONY R BR-HAVILLAND TWIP-ALOGOMA DIST | 2,150 | 2 | 2 | - |
| 17 | Sault Ste. Marie | 86 | SEC HWY 563-BATCHAWANA | 1,950 | 2 | 2 | - |
| 17 | Sault Ste. Marie | 87 | PANCAKE BAY PROV. PARK ENT | 1,750 | 2 | 2 | - |
| 17 | Sault Ste. Marie | 88 | MONTREAL R BR-RIX TWP | 1,650 | 2 | 2 | - |
| 17 | Sault Ste. Marie | 89 | AGAWA BAY RD-LAKE SUPERIOR PROV. PARK | 1,800 | 2 | 2 | - |
| 17 | Sault Ste. Marie | 90 | 0.175KM N OF LAKE SUPERIOR PROV. PARK N LTS | 1,600 | 2 | 2 | - |
| 17 | Sault Ste. Marie | 91 | MISSION R-RABAZO TWP (W) | 1,550 | 2 | 2 | - |
| 17 | Sault Ste. Marie | 92 | HWY101(E) – WAWA | 1,900 | 2 | 2 | - |
| 17 | Sault Ste. Marie | 93 | SEC HWY 631-ELGIN ST | 1,550 | 2 | 2 | - |
| 17 | Sault Ste. Marie | 94 | SEC HWY 631-ELGIN ST | 1,450 | 3 | 2 | +1 |
| 17 | Thunder Bay East | 95 | SEC HWY 614 (TO MANITOUWADGE) | 2,350 | 2 | 2 | - |
| 17 | Thunder Bay East | 96 | HWY 627 – TO HERON BAY-PUKASKWA PARK | 2,350 | 2 | 2 | - |
| 17 | Thunder Bay East | 97 | PENINUSLA RD (FORMER HWY 626 TO MARATHON) (S) | 1,550 | 2 | 2 | - |
| 17 | Thunder Bay East | 98 | JACKFISH RD (S) – SYINE TWP | 1,750 | 2 | 2 | - |
| 17 | Thunder Bay East | 99 | 1.1KM W OF SAWMILL CREEK CULV | 1,700 | 2 | 2 | - |
| 17 | Thunder Bay East | 100 | CPR OH E ABUT – TERRACE BAY | 1,450 | 3 | 2 | +1 |
| 17 | Thunder Bay East | 101 | AGUASABON RIVER BR- E ABUTMENT | 2,250 | 2 | 2 | - |
| 17 | Thunder Bay East | 102 | QUEBEC ST – SCHREIBER (S) | 1,900 | 2 | 2 | - |
| 17 | Thunder Bay East | 103 | CPR OH SELIM | 1,500 | 2 | 2 | - |
| 17 | Thunder Bay East | 104 | ROSSPORT RD (W JCT) (S)-LAHONTAN TWP (7047) | 1,350 | 3 | 2 | +1 |
| 17 | Thunder Bay East | 105 | LITTLE GRAVEL RIVER BR | 1,850 | 2 | 2 | - |
| 17 | Thunder Bay West | 106 | HWY 11 (W JCT) (S) | 1,100 | 3 | 2 | +1 |
| 17 | Thunder Bay West | 107 | 0.720KM N OF WBPL ENDS | 1,250 | 3 | 2 | +1 |
| 17 | Thunder Bay West | 108 | INWOOD PARK ENT (S) | 1,800 | 2 | 2 | - |
| 17 | Thunder Bay West | 109 | COMMUNITY HALL RD (N) -UPSALA TWP | 1,550 | 2 | 2 | - |
| 17 | Thunder Bay West | 110 | CPR OH-SHEBA | 2,050 | 2 | 2 | - |
| 17 | Thunder Bay West | 111 | THUNDER BAY-KENORA DIST BDY | 2,350 | 2 | 2 | - |
| 17 | Thunder Bay West | 112 | GULLIVER RIVER BR | 2,300 | 2 | 2 | - |
| 17 | Thunder Bay West | 113 | SEC HWY 599 (N) | 2,000 | 2 | 2 | - |
| 17 | Thunder Bay West | 114 | DAVY LAKE RD (S)-HUMPHRY RD (N)-IGNACE TWP | 1,700 | 2 | 2 | - |
| 17 | Thunder Bay West | 115 | MAMEIGWESS LAKE RD (N)-BRADSHAW TWP | 2,450 | 2 | 2 | - |
| 17 | Thunder Bay West | 116 | SEC HWY 603 (W)-SANDY PT RD-BORUPS CORS (S) | 2,350 | 2 | 2 | - |
Table 3:
| Highway | Contract area | Section number | Section identification | WADT | Theoretical LOS based on WADT | Actual LOS | Class adjustment |
|---|---|---|---|---|---|---|---|
| 17 | Kenora | 117 | HWY 72 (N) | 3,300 | 2 | 2 | - |
| 17 | Kenora | 118 | THUNDER LAKE RD | 5,050 | 2 | 2 | - |
| 17 | Kenora | 119 | EJCT SEC HWY 601 (S) -RICE LAKE LOOP | 5,850 | 2 | 2 | - |
| 17 | Kenora | 120 | DRYDEN W LTS END OF NON ASSUMED | 5,950 | 2 | 2 | - |
| 17 | Kenora | 121 | SEC HWY 665-RICHAN RD (N) | 4,650 | 2 | 2 | - |
| 17 | Kenora | 122 | SEC HWY 605- ETON RUGBY RD (N) | 3,450 | 2 | 2 | - |
| 17 | Kenora | 123 | SEC HWY 594 W JCT (S) – TO EAGLE RIVER | 2,750 | 2 | 2 | - |
| 17 | Kenora | 124 | HWY 105-RED LAKE RD (N) | 2,000 | 2 | 2 | - |
| 17 | Kenora | 125 | SEC HWY 647 (N) -TO BLUE LAKE PROV PARK | 2,700 | 2 | 2 | - |
| 17 | Kenora | 126 | HWY 71 (S) – LONBOW CORS -KIRKUP TWP | 3,350 | 2 | 2 | - |
| 17 | Kenora | 127 | E JCT HWY 17A- KENORA BY-PASS | 860 | 4 | 2 | +2 |
| 17 | Kenora | 128 | 0.03KM N OG LONGBOW LK RD ICS (017 766) | 1,150 | 3 | 2 | +1 |
| 17 | Kenora | 129 | FORMER TOWN OF KEEWATIN W LTS-END OF NA | 1,550 | 2 | 2 | - |
| 17 | Kenora | 130 | SEC HWY 641-LACLU RD | 2,500 | 2 | 2 | - |
| 17 | Kenora | 131 | END OF EB RAMP MERGE LANE | 680 | 4 | 2 | +2 |
| 17 | Kenora | 132 | W JCT HWY 17A-KENORA BYPASS | 2,650 | 2 | 2 | - |
| 17 | Kenora | 133 | W JCT OF START OF EB RAMP LANE | 2,450 | 2 | 2 | - |
| 17 | Kenora | 134 | LINDSAY RD (S) – BOYS TWP | 3,200 | 2 | 2 | - |
Table 4:
| Highway | Contract area | Section number | Section identification | WADT | Theoretical LOS based on WADT | Actual LOS | Class adjustment |
|---|---|---|---|---|---|---|---|
| 17A | Kenora | 1 | HWY 17 E JCT (S) | 2,150 | 2 | 2 | - |
| 17A | Kenora | 2 | SEC HWY 671(N)-TO STRECKER RD & GRASSY NARROWS | 2,250 | 2 | 2 | - |
| 17A | Kenora | 3 | EAST MELICK RD (N)-FORMER HWY 659 | 2,650 | 2 | 2 | - |
| 17A | Kenora | 4 | SEC HWY 658-REDDITT RD (N)-TO OPP & MTO PAT | 2,950 | 2 | 2 | - |
| 17A | Kenora | 5 | WINNIPEF R BR (EAST BRANCH) | 2,900 | 2 | 2 | - |
| 17A | Kenora | 6 | SEC HWY 596 (N)-TO MINAKI- DARLINGTON DR (S) | 2,650 | 2 | 2 | - |
| 17A | Kenora | 7 | HWY 641 & CPR OVERPASS | 2,950 | 2 | 2 | - |
Appendix D
Highways 11 and 17 Northeastern and Northwestern Regions - Class of Collision, Person Killed and Injured by Class of Highway (over all year) – 2016
| Highway classification | Class of Collision - Fatal | Class of Collision - Personal Injury | Class of Collision - Property Damage | Collision total | Persons killed | Persons injured |
|---|---|---|---|---|---|---|
| Freeway/Urban Highway | 5 | 173 | 860 | 1038 | 5 | 227 |
| Major Highway | 16 | 380 | 1733 | 2129 | 21 | 552 |
Highways 11 and 17 Northeastern and Northwestern Regions - Class of Collision, Person killed and injured by Class of Highway (winter only) – 2016
| Highway classification | Class of Collision - Fatal | Class of Collision - Personal Injury | Class of Collision - Property Damage | Collision total | Persons killed | Persons injured |
|---|---|---|---|---|---|---|
| Freeway/Urban Highway | 3 | 67 | 400 | 470 | 3 | 80 |
| Major Highway | 8 | 154 | 809 | 971 | 10 | 225 |
Southern Major Highway Highways Class of Collision, Person Killed and Injured (over all year) – 2016
| Highway classification | Class of Collision - Fatal | Class of Collision - Personal Injury | Class of Collision - Property Damage | Collision total | Persons killed | Persons injured |
|---|---|---|---|---|---|---|
| 140 and 58A | 1 | 8 | 18 | 27 | 1 | 25 |
| 7* | 2 | 36 | 112 | 150 | 2 | 52 |
* Highway 7 from Carleton Place to Perth and New Hamburg to Shakespeare
Southern Major Highway Highways Class of Collision, Person Killed and Injured (winter only) – 2016
| Highway classification | Class of Collision - Fatal | Class of Collision - Personal Injury | Class of Collision - Property Damage | Collision total | Persons killed | Persons injured |
|---|---|---|---|---|---|---|
| 140 and 58A | 0 | 5 | 12 | 17 | 0 | 14 |
| 7* | 2 | 14 | 57 | 73 | 2 | 23 |
* Highway 7 from Carleton Place to Perth and New Hamburg to Shakespeare
List of highway sections used in the collision rate calculations
| Hwy | From description | To description |
|---|---|---|
| 3a | ROSE HILL RD END OF NA | TORONTO-LONDON MTO DIST BDY |
| 3b | TORONTO-LONDON MTO DIST BDY | HWY4-TALBOTVILLE ROYAL- START OF NA |
| 6-a | FORMER FERGUS N LTS END OF NON-ASSUMED | Tobermory (discontinuity) |
| 6-b | SOUTH BAYMOUTH-FERRY DOCKS | HWY 17 - HWY END |
| 7-a | N JCT HWY 25-MAIN ST | HALTON HILLS-MILTON TOWNLINE RD |
| 7-b | HALTON HILLS-MILTON TOWNLINE RD | GUELPH E LTS - START OF NA |
| 7-c | PERTH RD 101 | LONDON-OWEN SOUND MTO DIST BDRY |
| 7-d | LONDON-OWEN SOUND MTO DIST BDRY | 0.1 KM W OF HWY 4-END OF HWY |
| 11-a | CEDAR HEIGHTS RD | SUDBURY-NEW LISKEARD MTO DIST BDY |
| 11-b | SUDBURY-NEW LISKEARD MTO DIST BDY | N JCT HWY 65 AND HWY 11 |
| 11-c | ROLAND RD(E) | SEC HWYS 579 & 652(THIRD AV-COCHRANE) |
| 17-a | HWY 144 UP IC | BLIND RIVER E LTS - START OF NA |
| 17-b | BLIND RIVER W LTS END OF NON ASSUMED | S.S MARIE E LTS - START OF NA |
| 17-c | INWOOD PARK ENT (S) | HWY 72 (N) |
| 17-d | SEC HWY 665 - RICHAN RD (N) | TWP OF JAFFRAY-MELICK-START OF NA |
| 17-e | FORMER TOWN OF KEEWATIN W LTS- END OF NA | ONTARIO/MANITOBA PROV BDY-HWY END |
Appendix E
| Improvement | Actions | Status |
|---|---|---|
| 1. Implement opportunities for local improvements to address site specific challenges |
17 A Review Highway 17A near Kenora was reviewed and considered to have an appropriate amount of winter equipment as there is an overlap of multiple winter equipment routes and selected use of an additional grader. |
Complete |
|
1. Implement opportunities for local improvements to address site specific challenges |
Highway 11 (New Liskeard) A 1.2 km segment of Highway 11 in New Liskeard meets traffic volumes for Freeway/Urban Highway. Regional staff are aware and have site specific provisions in place that reflect the unique conditions. This segment is being serviced close to or at the Freeway/Urban Highway service level due to the close proximity of the Haileybury patrol yard, which results in winter equipment travelling through servicing this highway segment when required. |
Complete |
|
1. Implement opportunities for local improvements to address site specific challenges |
Raiko trial After further trials, the next step will be to consider purchasing more Raiko units for other locations that have snow/ice pack concerns. |
Ongoing |
|
1. Implement opportunities for local improvements to address site specific challenges |
Seasonal Collision Rate Analysis to identify Anomalies Expected completion of initial analysis Summer 2021. |
Ongoing (Summer 2021 completion) |
| 2. Increase equipment levels by using target route circuit times instead of maximum circuit times to determine equipment levels in new procurements |
Route design An updated process for consistent calculation of route times was implemented in 2018 and has been used in the development of routes for CDMC and MDMC contracts tendered since then. As a result of the updated process, route times are typically closer to theoretical route times of the designated highway type. As new contracts are awarded equipment levels will increase – i.e. Huntsville CDMC resulted in 8 additional winter equipment, North Bay CDMC will add an additional equipment when the contract begins in 2022. Thunder Bay, Kakabeka and Marathon area contracts will have 16 additional winter equipment in 2021. Most remaining Northern Ontario maintenance contracts that use maximum route times are scheduled to be retendered with new contracts starting between 2021 and 2024. Thunder Bay West route design review The Thunder Bay West contract is scheduled for renewal in 2024. During the upcoming winter season circuit times will be collected for additional analysis and compared to the theoretical design to identify whether further improvements are required in advance of the contract renewal. |
Ongoing since 2018 |
| 3. Review use of non-traditional winter maintenance equipment. |
Non-traditional winter maintenance equipment The Kenora and Thunder Bay East Contractor has gradually been adding underbody plows to the fleet to improve snowpack and ice pack removal. Contract renewals now include equipment specifications for underbody plows and larger capacity trucks on designated routes. Underbody plows are also being used in Huntsville CDMC and Sudbury AMC. |
Ongoing |
| 4. Require contractors to apply anti-icing liquids when conditions permit | As the new Thunder Bay East contract is renewed to a CDMC it includes additional areas requiring application when conditions permit. The two new northern MDMCs and the North Bay CDMC which starts in 2021 are planned to include broadcast application on all sections of Hwy 11 and 17 within their limits when opportunities arise. | Implementation in 2021 |
|
4. Require contractors to apply anti-icing liquids when conditions permit |
The ministry has initiated a study to quantify the costs and benefits of the expanded use. | Completion in Summer 2021 |
| 5. Add spare winter equipment, as required | As contracts are renewed the Ministry now has prescriptive contract requirement for spares representing 10% of equipment complement. | Ongoing |
| 6. Expand the highway information available for maintenance operations | The RWIS expansion design-build project is 60% complete. Construction is ongoing with completion expected in March 2021. | Summer 2021 |
|
6. Expand the highway information available for maintenance operations |
The acquisition and start of polling and forecasting services of 16 mini RWIS stations will be in place for the upcoming winter season. | Complete |
|
6. Expand the highway information available for maintenance operations |
Maintenance cameras The ministry added maintenance cameras to the 17A & 658, and 11/17 & Red River Rd intersections in the summer of 2020. Northeast Region installed cameras at patrol yard to provide visibility to the highway. MTO has installed more than 75 cameras which include 18 highway cameras and remaining at various patrol yards |
2018 - 2020 |
| 7. Increase public awareness of winter maintenance operations and safe winter driving techniques |
Changeable message signs Northeast region currently has a project to renew variable message signs. This includes two sites on Highway 17 which will be replaced. Construction will be ongoing in the two years. |
2020-2022 |
|
7. Increase public awareness of winter maintenance operations and safe winter driving techniques |
Northwest Region OPP Outreach In January 2020 Northwest Region had a discussion with the OPP about creating safety messaging to address a concern about safety around operating plow and spreading equipment. Several snowplow collisions occurred in the province in 2019/20, with several near misses continuing to be experienced by snowplow drivers. The region plans to work with the local OPP detachment this fall to remind motorists to exercise caution and patience around operating winter equipment. |
Fall 2020 |
|
7. Increase public awareness of winter maintenance operations and safe winter driving techniques |
Contractor social media Review of Contractor Social Media Guidelines and development of standard public awareness products for their use. Communications products development and social media policies under review. |
Winter 2020/21 |
| 8. Implement rest area improvements |
Highway 17/Ontario Manitoba Border – facility upgrades are underway including safety lighting and interior improvements. The work will be advertised this fall with spring 2021 delivery. Highway 17/Argon Lake – facility upgrades with all-season washrooms and additional truck parking. The work will be advertised this fall with spring 2021 delivery. Highway 17/ Manitouwadge (Junction Highway 614/17) – partnership with the municipality of Manitouwadge. The Township facility will be upgraded with all-season washrooms, new entrance, lighting, and parking. This site will also serve as a pickup location for Northland Bus Service. Anticipated completion is fall 2020. Three rest areas will have entrance improvements completed this year. Terrace Bay rest area is scheduled for delivery for the 2021 fall. This is a large scale project that includes property acquisition. Field investigations and property acquisition is starting this fall. Engineering is in the process of acquiring a service provider for detail design. Nine rest areas across the Northwestern Region will have new or additional solar lighting installed. In addition to the solar light upgrades at rest stops, we recently awarded grid power work for Klotz Lake and Leonard Lake rest stops. This will improve area lighting and more reliable outhouse lights and fans. Improvements were also completed to the Batchewana Rest Area, north of Sault Ste. Marie, and the Watershed Rest Area on Highway 144, that include year-round operation at both locations. Improvements are planned for the Ryland Rest Area on Highway 11 to allow year-round operation. Construction is expected to be completed in 2021. Ryland and Driftwood rest areas in Northeast region will be upgraded to year round rest facilities. Ryland is expected to be completed in 2021. |
Ongoing |
| 9. Implement capital construction program safety improvements |
Capital construction improvements occur annually with several safety improvements completed in 2020 at various locations including:
|
Ongoing |