Stage III: Create Performance Measures
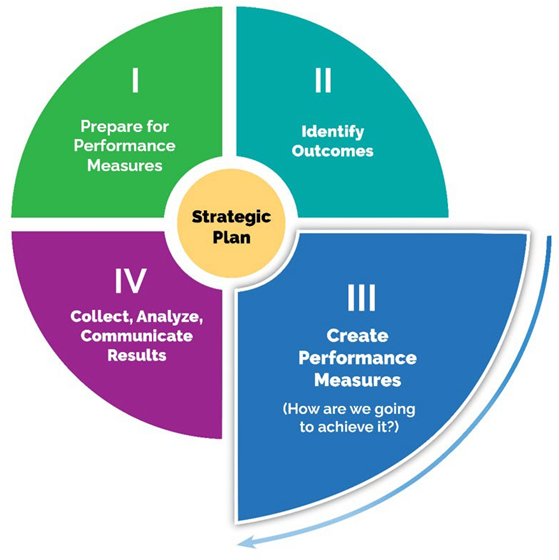
This resource focus is on only creating measures for outputs and outcomes. Stage III is divided into two parts:
- Part A describes more about performance measures
- Part B explains the four-step process to creating performance measures
Part A: about performance measures
What are performance measures?
Performance measures provide the information necessary to make strategic decisions about what an organization does and how it performs. They are quantitative and/or qualitative measures that are used to help organizations understand, assess, manage and improve what they are doing. Performance measures can provide an organization with important information on the results it obtains, i.e. by delivering a program or project.
The results from measuring performance provide a reliable basis for assessing achievement or change over time. If measured regularly, the data collected can be used to determine whether the initiative is on track. If it is not on track, then use the data collected to adjust activities based on what has been learned.
Performance measures are also important for telling the story of the initiatives. They are created to help answer questions you and others may have, such as the following:
- What activities were undertaken?
- How much was achieved?
- Were the initiative's goals accomplished?
Some additional examples of performance measures and data sources uses in core economic development activities can be found in Appendix 5: Examples of Performance Measures and Data Source for Business Attraction.
Quantitative and qualitative measures
Performance measures are described as quantitative or qualitative based on the data needed to calculate the results.
Quantitative measures are measures that use numerical data. They are expressed as numbers, ratios or percentages, such as the increase in the number of members that participated in a workshop this year over the previous year. Increase in production per acre, farmgate receipts, exports, expansion, and job numbers are typical quantitative measures.
Qualitative measures are based on judgements, opinions and perceptions. These are expressed as non-numerical values. Qualitative measures are usually reported in the form of a narrative or story that explains the changes that resulted, in whole or in part, because of an initiative. These changes can include changes in behavior or institutional changes and are often written as a comparison between two situations. They can also be expressed numerically. For example, calculate the percentage of people (numerical value) who were very satisfied with a workshop (opinion) as an indicator for the quality of the workshop.
Both types of measures will help to measure the progress of an initiative towards change. Data can come from a variety of sources including interviews, surveys, observations, reports or other written documents. There is more information on collecting data in Stage IV.
Measuring outputs and outcomes in the logic model
By measuring these two elements, it can create a unique view of the performance of an initiative that shows what inputs or resources are available and how they are being used. This will help assess the associated activities, the level of participation and the outcomes. This will give a complete picture of how a project is doing and provide evidence of its effectiveness and the resulting value.
If confident in the data, use input and output or outcome data together in ratios to report efficiency and effectiveness. For example, what resources (inputs) are used to deliver a workshop (output) helps to measure efficiency. How the workshop (output) helps the participants to adopt a new practice (outcome) helps to measure effectiveness. By using more than one measure, it will help offset any perceived or actual weakness of one of the measures or any problems with attribution. The point of performance measurement is to help reduce the uncertainty about the effect an initiative is having.
Not everything in the outputs and outcomes of the logic model needs to be measured. Sample outputs and outcome measures for different types of organizational initiatives, such as those in education, research and advocacy are provided in Appendix 2.
Part B: how to create performance measures
The four-step approach to creating performance measures:
- Brainstorm a list of potential measures.
- Assess the quality of each measure.
- Create a shortlist of measures and put them into order of priority.
- Define and document the requirements for each recommended measure.
Step 1: brainstorm a list of potential measures
Start with one output or outcome. List what can be recorded or counted that would provide evidence of change. If unable to think of a measure ask, if the outcome
was occurring, what would be different and how would one know? Performance measures help answer questions about outputs and outcomes – generally outputs are easier to measure than outcomes.
It is not enough to define outcomes; they must also be measurable. Measures are used to assess whether outcomes are being achieved and what kinds of changes have occurred. What you measure is determined after identifying the outcomes that the initiative seeks to achieve.
Measures can be numbers, facts, opinions, or perceptions that help identify progress towards change. Another way to think about measures is to begin a sentence with the following phrases:
- The percentage of …
- The number and type …
- The extent to which …
- The before and after comparison of …
- The degree of change between …
For examples of performance measures in economic development, please refer to Appendix 6: Sample List of Indicators/Measures.
Step 2: assess the quality of each measure
One way to make sure that you have a good, solid measure is to use the SMART criteria for measures:
Specific – Be clear about what is being measured. The measure captures the essence of the specific output or outcome it represents, and the results can be attributed, at least in part, to the actions of an initiative.
Measurable – The measure has criteria that can be used for measuring and tracking, such as reliable data that are currently collected, readily available and relatively easy to report. Establish baselines for the measure so that you can monitor the changes.
Affordable – The data used for the measure should be affordable and within the budget of the program or project to purchase.
Reliable – The measure is based on reliable data that can be easily verified. The measure and its data compare the same things over time and the methods for analyzing and summarizing the results are clear and objective.
Timely – The data for the measure should be available when needed – on a quarterly, annual or two-year basis.
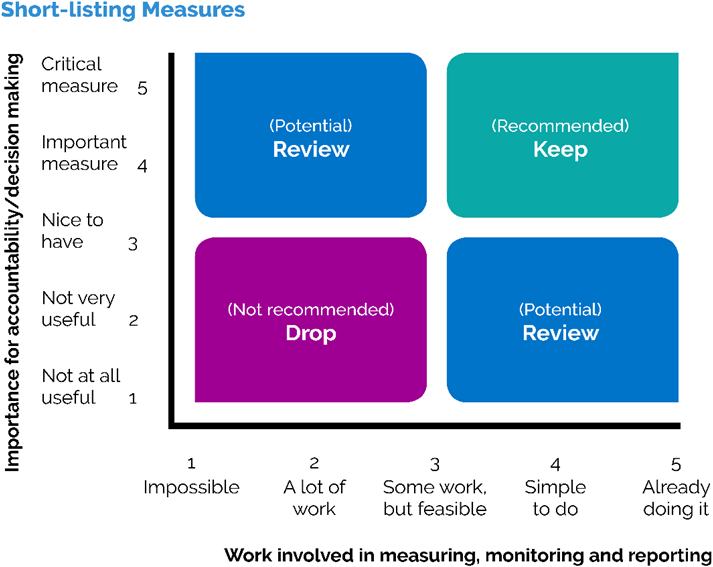
Step 3: create a shortlist
When creating a shortlist, the first criterion is the importance of the measure for accountability and decision making. The second criterion is the amount of work and number of resources required to monitor and to report the measure. A practical way of achieving this is by plotting these criteria on a graph with 2 axis and ranking them out of 1-5. For importance, 1 is “not useful at all” and 5 is “critical measure”; for work involved 1 is “impossible” and 5 is “already doing it.”
By combining scores for both criteria, one will be able to identify and recommend the measures that score the highest. Highest scoring measures are important for measuring accountability and, at the same time, do not require a massive effort.
See the illustration below and Appendix 7: Shortlist Measures Template for additional information on shortlisting measures.
Step 4: define and document the requirements for each measure
In this step, document the details or targets for each of the measures. This is a critical step. It ensures that you understand what is required to maintain consistency when collecting data and analyzing the results. A good performance measure methodology will also indicate whether the measures are feasible.
For each measure developed, consider including information for each of the following elements:
Rationale for using the measure – Why use this measure? How does it demonstrate that an initiative is making progress towards the outcome?
Responsibility for data – Who will make sure that the data are collected and reported on, and who will do the collecting and communicating to stakeholders?
Sources of data and availability – What is the source of your data? How frequently are the data available – monthly, quarterly, annually? How reliable are these data?
Analysis and calculation – Who will analyze the data, and how will they make the necessary calculations?
Baselines – What is the starting point for the data used for this measure?
Targets or trends – How will one know if an initiative is successful? What is the target that the measure must reach?
Appendix 8: Template for Performance Measure Methodology for one measure/outcome can help you document the answers to these questions and other details about each measure.
However, the limitation here is that the participants are only reporting their intent to make the changes. They are not reporting on the changes they have made because of the course. Therefore, you can only be reasonably certain that they will adopt new technologies or practices.
But if you ask the same group the same question a year or two after the training, and a number of them report that they adopted the technologies or practices then you have solid outcome data that you can report and communicate.
Baselines and targets for each measure
Performance measures must be set with baselines and targets. A performance measure is only useful if the result is comparable to something.
A baseline is the starting point for assessing changes in performance and for establishing objectives or targets for future performance. Baselines are established with either existing data or after completing a cycle or two of measurement.
A target is a clearly stated objective or planned (desired) outcome, which may include outputs and/or outcomes to be achieved within a stated time. The actual result will then be compared to the target, which is what is hoped will happen.
Benchmarking is the process of comparing organizational practices and performance over a time period against a predetermined starting point. Later, compare the results of the program with similar programs from similar-sized or oriented organizations.
How to set targets
Five points to remember when setting targets:
- Look at the baseline information as a starting point.
- Search for evidence, history or experience with this type of program and target population within the organization.
- Research the experience of other organizations that have run similar programs or projects. Look for information about comparable programs or initiatives.
- Decide how much change or improvement is realistic to expect.
- Set a date, if possible, for the target to be reached.
Whenever setting a target for an outcome or an output be specific about what must change, when to expect the change to have taken place, and how much change to expect on the ground. Also note who will be involved in making the change take place.
A performance measurement summary
Consider creating a performance measurement summary. In a one-page table, list outputs or outcomes and performance measures for each of them. Show the baselines and targets for the measures and who is responsible for each one. The summary will illustrate the story to tell colleagues and managers about an initiative and show them how your project is making a difference.
An example of setting a baseline and targets based on a previous year's performance:
In 2019, the program ran eight workshops in total. In 2020, the baseline will be a minimum of eight workshops and a target of 10 workshops.
In 2019, 150 people attended the workshops. In 2020, the target for attendance is a 10 per cent increase over the 150 participants of 2019.
In 2019, the workshops had a 90 per cent satisfaction rating from the participants. In 2020, the target is to maintain that satisfaction rating.
In 2015, as a result of the knowledge gained from the workshop in 2015, 60 per cent of participants reported using the knowledge gained to expand their business.
The following questions can help quickly identify and explain to others what is being done in the performance measurement process. Answering “yes” to all these questions, will prepare for moving on to the next stage.
A template to use in the creation of performance measures summary can be found in Appendix 9: Performance Measures Summary Template.
Stage III: diagnostic questions
- Have performance measures been selected?
- Have performance measures been prioritized so that there is a manageable number of measures?
- Have choices been communicated to stakeholders?
A full list of diagnostic questions from all four stages can be found in Appendix 2: Diagnostic Questions.