Stage IV: Collect, Analyze Data and Communicate the Results
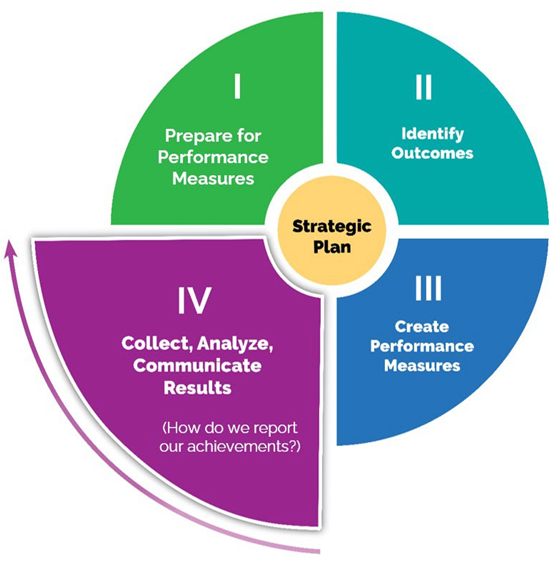
This stage discusses how a well-developed performance measurement framework allows one to tell a convincing story about the results of a strategy, backed by quantitative and qualitative evidence.
There are three parts to Stage IV:
- Part 1: determine effective ways to collect and analyze data
- Part 2: decide how to report and communicate results
- Part 3: decide how to use the information gathered to improve a strategy/initiative
Before you release the performance results of your initiative, you need to sit down with your team and ask a few questions.
- Who will you send the report to?
- Why is it important that these people receive the report?
- What information will be in the report?
- Will there be updates after the first report?
- How will it be delivered?
Part 1: collect data
Data are the raw material for calculating results for performance measures. Data are the simple facts, observations, statistics, number, and records that relate to an initiative or project.
Determine the data needed for each measure. Data may already be available within the organization or can be obtained from other sources.
Review data collected by your organization
Data collected by the organization will probably be available in documents such as reports, budgets, logbooks, minutes of meetings, media releases and backgrounders, annual reports, and financial statements. Data collected, analyzed, and reported for other initiatives can be valuable, but may need repackaging.
Review data collected by other organizations
Data collected by other organizations can be a less expensive option. The drawback to using someone else’s data is that there is no way to influence how frequently information is collected and reported. There are several sources of data:
- national (i.e. Statistics Canada)
- provincial (i.e. Ontario Ministry of Agriculture, Food and Rural Affairs)
- municipal (i.e. MPAC)
- federal, provincial, and municipal studies
- evaluations of similar programs or projects from other organizations
Before you use someone else’s data, ensure that the sources are reliable and credible. If some of the data wanted is not readily available through other sources, then decide to find them using observation, surveys, interviews, or focus groups.
Observation
Observation is another way to gather information. Direct observation entails observing the procedures and work being done on site or the reactions to the work that has been done. Indirect observation allows gathering of information from secondary sources. If one attends a meeting, they are directly observing it. If one does not attend the meeting but reviews the minutes of it or a participant’s notes, then they are indirectly observing it.
Surveys and questionnaires
Surveys and questionnaires allow samples to be taken of opinions, perceptions or level of satisfaction of a representative group of your members, program participants or general public. One can design the survey or questionnaire to collect the information that will be useful for one or more measures. Surveys and questionnaires provide an inexpensive way to ask questions and gather data for several measures at a time.
Interviews
Interviews allow gathering of information about an initiative through discussions with participants, stakeholders or the general public. Interviews may include a variety of open-ended and close-ended questions. Close-ended questions can be answered with a yes or no. Interviews can be conversational to collect a wide range of information by asking open-ended questions or guided by asking specific questions. One can use a fixed-response interview where the people interviewed are asked the same questions and provided the same set of alternatives as answers.
Focus groups
A focus group is usually a formal group discussion that is guided by a facilitator who has a set of questions. The ideal focus group is small as this helps keep the conversation flowing. Using a focus group allows collecting data while gaining some insight into topics that can only be gleaned by watching and listening to members of a group interact.
The sources of information used to gather data will depend on several variables including what is timely, credible, available, and cost-effective as well as which sources provide the most useful information to measure given outcomes.
Do not rush to buy a data information system
There is no need to rush out and buy a data information and management system or some other software program. The spreadsheet and word processing software available on your computer is probably enough to collect the data and report the results for most initiatives. Wait until you are comfortable with the performance measurement process in general and your performance measurement framework, before making an investment in a data information system.
Analyze data
The data you collect may include numbers, facts, observations, statistics, and records. By analyzing data, you transform the raw data into something meaningful for board directors, members of your organization, stakeholders, or the general public to review and consider.
When analyzing data, consider the baselines (the starting point for assessing changes in performance and for establishing objectives or targets for future performance) and targets (a clearly stated objective or planned/desired outcome) that were established in Stage 3. The actual results should be analyzed compared to these values, which is what is hoped will happen, compared to what happened. Present the data in ways that make it easy for the audience to understand the implications of what they are reading. This will also help them make decisions based, at least in part, on the data. Data analysis is the first step in reporting.
Look for patterns
When analyzing data, start by looking for patterns, trends and/or relationships. Sometimes patterns and trends emerge by themselves from the numbers or the responses to interviews. Other times you may have to create graphs, charts or tables to find the trends or patterns. Still other times, you may have to work out percentages, averages or make other mathematical calculations to find the patterns or trends. If a statistician is accessible to the team or someone in the organization who is comfortable working with statistics, this may be the opportunity for them to shine.
Convert quantitative data into graphs or charts
When analyzing quantitative data, convert them into graphs or charts, or apply statistical operations that demonstrate the importance of relationships between the numbers. For example, every month you might plot the number of hits on a website over the course of the year to see if a trend emerges in relation to social media posts/marketing campaigns/trade show attendance, etc.
Explain qualitative data
it can help tell the story behind the numbers. In contrast, when analyzing and reporting on qualitative data, write a paragraph or two to describe what happened, what the findings were and the reason – this is important. A combination of quantitative and qualitative data often creates a better picture.
Note interesting results
While analyzing the data, note any significant or interesting results good and bad. For example, this could be an exception in what was expected based on past results. Compare the results with the targets chosen for the measure and with the benchmarks. What one is doing is comparing the actual results with the intended or hoped for results.
Part 2: communicating results
A performance measurement framework allows you to communicate a convincing story about the results of an initiative, that is backed by both quantitative and qualitative evidence. It is important to consider how, why and when you will communicate both before and after implementing an initiative. Before implementing the initiative communicate:
- what is expected to be achieved with the initiative
- where it will make a difference, and what the desired outcomes are
- what steps will be taken as part of the plan to achieve these outcomes
- how one will know that the organization is on track to achieve the desired outcomes
After you implement your initiative communicate:
- what is being achieved
- where a difference is being made, and what the outcomes are
- what steps were taken to achieve these outcomes
If the story you create is well written, well-reasoned and backed by credible evidence and plausible assumptions, it will produce a strong case that the initiative is worthwhile for the following reasons:
- stakeholders will understand the desired outcomes and why they matter
- they will feel confident that the initiative is well managed because its progress is being carefully monitored
- they will be able to see the change the initiative achieved
- it may result in new partnerships and resources – success breeds success
- they will see the return on investment
Communicating successes
Reporting and communicating are intertwined. The report is an excellent way to let people know about achievements and to build trust in activities. Keeping stakeholders informed of progress will help to secure future support and strengthen stakeholder partnerships. There are many ways to reach targeted audiences. Use all communication channels.
- Think beyond the organization’s website. Are there associations and partners who might be willing to post the report or provide a link to the report from their websites?
- Use various media channels. This might include social media such as LinkedIn, Facebook and Twitter as well as local and regional newspapers, radio and television stations.
- Talk about success. Encourage senior management and board directors to include information in their speeches about the report and its successes.
- Attend public and stakeholder events. Talk to those attending about progress and make the report or a highlights document available.
As you work your way through the questions below you will be able to identify what information should be communicated to which of your stakeholder groups. This information will also help to determine what types of reports are needed to be written and the stories to be told.
As mentioned in Stage I, there are two important questions that should be asked early in the process. By Stage IV the team should know:
- Who will write the report or reports?
- Who will make sure that the information required for the reports is available?
Who will receive the information?
The team should make a list of all audiences both internal and external. The stakeholders may be part of the external audience along with members of the organization, funders and interested members of the public.
Internal audiences
Internal audiences include team colleagues, the executives, the board of Directors and Council. Include some of the key information in a high-level executive summary or management dashboard of key measures. Or put some of the information in a PowerPoint or Keynote presentation for the next meeting of the board of directors or staff members.
Also write a shorter internal report for staff that includes the important data and measures so that they can track the performance of the initiative frequently and closely. Structure these reports so that the organization can use them for follow-up or when staff is working on the next multi-year strategic plan.
External audiences
There is a range of possibilities for external reporting. This information could be released as a general press release. Incorporate the results into the organization’s public annual report, if they have one. It can also be used to write articles for the organization’s newsletter or for a trade magazine. One can also incorporate the information on the organization’s website or as a presentation at an event or workshop that the organization is holding. The important point to remember is to know the audience and to know what they should learn from the report – whatever form it comes in.
What information will they receive and why?
Once the performance measurement framework is up and running, information will come in regularly throughout the lifespan of the initiative. Although the team may be keenly interested in all of it, other audiences may not be. They may only want to know the information that most interests them.
Effective reports are tailored to provide the information at the level of detail that is suitable for the audience. For example, only some of the organization’s board directors may know about the initiative. If you present the report at a board meeting then you will have to describe the initiative and results of the performance measurement framework in detail, providing additional supporting information, if necessary. The directors may all be interested in whether the initiative will meet its outcomes and, if not how that will affect the organization. The directors will use the report they receive to make decisions.
Consider each of these factors when thinking about what information to give to each of the audiences and the reason to do so.
- What does this audience know about the initiative?
- How will this audience use the information?
- What should this audience learn to know and understand?
- What outcomes does our organization want from sharing information?
How and when will they receive it?
Decide on how to present the information – in a written report, a brochure, a section in the annual report or a special report to the board – and when it will be presented.
If the decision is to present the results at the annual general meeting, share the early results or a draft of the report with the board and senior executives as well as with the managers, staff and others who have worked on the program and on the review. It will help to create interest in the performance measurement process, and it will give them a heads up about what is coming.
Structuring the report
Dashboards
The information provided below is primarily intended for use in the writing of a report on the performance measurement process and the initiative. But much of what follows can also be used when writing reports for different audiences. For example, articles for newsletters or an organization’s website are structured differently.
Start with the background
Tell the readers briefly about the organization and the initiative and describe what is trying to be achieved. The level of detail will depend on how much the intended
readers already know. Tell them or remind them about the goals or outcomes of the initiative and how they relate to the organization’s vision, mission or strategy.
Describe the performance measurement process
In this section, explain the reason for the performance measurement process and briefly outline what was involved and the resources used. Also include the measures and data chosen and methodologies used. This is optional depending on how much the audience needs to know or is familiar with performance measurement.
Report the results and explain the context
When writing your report, note the results and describe their context.
Explain the context by comparing and contrasting results with the anticipated results or outcomes or with benchmarks or targets. If the initiative runs over several years, compare the results captured this year with those of previous years.
If your results are mixed, explain the reasons for the shortfalls and describe what action has been taken to improve the results or what plans are in the works. It is not essential to go into detail here about the plans, as they can be explained more fully later in the report when describing next steps.
Creating context begins while analyzing the data. Gather much of the context for the report by discussing the results with people closely associated with the initiative, for example board directors, managers, staff or volunteers.
Do not be afraid of presenting a real and unbiased picture of progress. By talking about results that are less than stellar and your plans for improving them you increase the credibility of your report, initiative and organization.
Graphs, charts and tables
Make strategic use of graphs, charts and tables to tell the story. Usually, graphs, charts and tables provide information to monitor progress and help with the decisions to be made. Be sure to explain their context and what they are showing.
- Do not assume the readers will know what a chart is showing simply by looking at it. Without explanation, they may interpret the results incorrectly.
- Talk about the relationship between the activities, outputs and outcomes and how the first two contributed to the outcomes.
- Discuss the difference between the planned outcomes and the actual results.
- Interpret the results by talking about what they mean.
- Include the factors that may have affected or influenced the results.
- Comment on an unexpected or unintended positive or negative consequence of the initiative.
- Identify limitations to using or interpreting presented data, e.g. data has been gathered, but it cannot conclude whether the outcome or output was successful without additional information.
Describe the next steps
Once the project has been described and the results presented, outline what action will be taken to improve the results or to capitalize on them. Demonstrate use of the information collected from the performance measurement process to make improvements going forward.
Offer recommendations to improve results or describe what has already been done. This is also the place to include any action that is required from your readers or audience.
Acknowledgements
In this section acknowledge the work of those who are involved in the initiative and team members on the performance measurement review. Also give credit to any partners who contributed to the results and acknowledge any relationships outside your organization.
Now that the report has been written, describing the project and the performance measurement process in some detail, use blocks of it to present the information to different audiences.
Part 3: using the Information
The benefits of the performance measurement process start to surface when working with the team and leaders of an organization to make decisions about the future of an initiative. The results of the process should provide a reliable base of information to use when formulating new plans to help achieve its outcomes.
The results of a performance measurement process provide much needed information for decision makers but do not replace the need for leadership, financial data, common sense, and good management or knowledge of a program.
What to look for in the results
The performance report should invite questions and generate discussion about continuous improvement. As performance measurement results will not provide ready-made answers about what should be done, ask the following questions about the initiative. Performance measurement results should provide answers for:
- What is or is not working?
- What opportunities are there to improve the initiative's performance?
- What challenges need to be investigated?
- What should be the focus of attention at this point?
- What decisions can be made based on the new information?
- What is likely to happen if changes occur or not?
Later, as more information is gathered over time and longer-term trends become available, ask the same or similar questions about your initiative.
Learn from and consider the reasons the initiative has met/not met some of its targets or outcomes, for example:
- Were the appropriate resources, time or staff devoted to it?
- Did the priorities in the organization change and did this affect the initiative?
- Did the available staff have the knowledge, skills and experience to do their jobs effectively?
- Were the processes outdated or difficult to understand or follow?
- Were expectations or outcomes unrealistic given the time, staff and resources available for the program or project?
This is also the time to discuss all the possible changes to make to improve the results. Make a list and examine each of the possibilities before making decisions. Before starting, decide what works and leave it alone for the time being. Then consider the following points:
- Look at what needs to change in order to improve the results.
- Look at what activities, outputs and outcomes can be altered or realigned.
- Make a list of the activities, practices or strategies that may be dropped.
- Write down possible new outcomes, outputs or activities.
- Write down the issues that came up during the performance measurement process that may need further discussion.
Whatever decisions are made about the future of the initiative; do not forget to communicate achievements and successes to stakeholders, staff, members of the organization and general public.
Stage IV: diagnostic questions
- Has an organized method of collecting information been agreed upon?
- Have the requirements for data collection, analysis, and reporting for each of your measures been documented?
- Have baselines or targets for your measures been established?
- Has it been defined how and when reporting will take place and decided who will receive the results?
- Is there an agreed upon method of communicating results to stakeholder?
A full list of diagnostic questions from all four stages can be found in Appendix 2: Diagnostic Questions.