2017 Minister’s Report on Toxics Reduction
Get information on toxic substances used, created, contained in product and released in Ontario, and learn about our progress implementing the Toxics Reduction Program.
Executive summary
The 2017 Minister’s Annual Report is the fifth report since Ontario’s Toxics Reduction Act was implemented. The 2017 report provides an update on Ontario’s progress to implement the toxics reduction program and changes made to the program over the last year. This includes the latest analysis on the amount of toxic substances used, created, contained in product, and released.
In 2016, a total of 1,046 facilities, representing a variety of sectors prescribed under the Toxics Reduction Act, reported to the Toxics Reduction Program. About 40% of these facilities intend to implement at least one option for reducing at least one substance. The information and analysis in this report comes from facilities’ 2011-2015 plan summaries and 2012-2016 annual reports (all data submitted to the ministry as of September 20, 2017).
Toxic substances prescribed under the Toxics Reduction Act are the same 347 substances reported under Environment and Climate Change Canada’s National Pollutant Release Inventory (NRPI), with the addition of acetone. Facilities in Ontario that report to the Toxics Reduction Program reported on 248 (or 71%) of these substances in 2016.
The 2017 report shows a year-over-year decrease in the amount of toxics substances used and created at these facilities as well as a decrease in levels of toxic substances contained in the products they make. Also, toxic substances released to air, land and water are at an all-time low since 2012.
Substances used, created and contained in products between 2015 and 2016
Across all regulated facilities between 2015 and 2016 there was a:
- 6% decrease in use of toxic substances
- 2% decrease in creation of toxic substances
- 9% decrease in the amount of toxic substances contained in products
Across facilities that identified a toxic substance reduction option that they intend to implement between 2015 and 2016, there was a:
- 7% decrease in use of toxic substances
- 5% decrease in creation of toxic substances
- 9% decrease in the amount of toxic substances contained in products
Substances released to air, land and water between 2015 and 2016:
- decreased by 2% across all regulated facilities
- decreased by 5% across facilities that intend to implement toxic substance reduction plans
Substances of interest
The 2017 report also provides information about prescribed substances linked with cancer (also known as carcinogens) and updates about other ministry initiatives to protect the environment and human health from harmful effects of toxic substances.
The Toxics Reduction Program is helping industry prevent the release of carcinogens to the environment. The report shows that across all regulated facilities there has been a 3% decrease between 2015 and 2016 in the levels of carcinogens being released to the environment.
The 2017 report also provides updates on recent actions with regard to the aquatic environment of the Great Lakes and Ontario’s inland waters. This includes designating two substances prescribed under the Toxics Reduction Act as chemicals of concern under the Canada-Ontario Agreement on Great Lakes Water Quality and Ecosystem Health, polycyclic aromatic hydrocarbons and lead, as well as research and monitoring of microplastics, and the federal government’s action to phase in a nationwide ban on plastic microbeads in personal care products.
Program updates
Changes to Ontario Regulation 455/09
We changed when facilities have to review their toxic reduction plans. This will help align the first two plan reviews with the release of the NRPI gazette notice to ensure facilities plan for and report on current and relevant toxic substances. After 2023, facilities will be required to review their toxic reduction plans every five years. The ministry will continue to monitor and evaluate the effectiveness of the plan review timing. Additional information about these amendments can be found on the environmental registry.
Changes to the Toxics Reduction Program’s reporting system
A variety of factors may influence a facility’s ability to implement toxics reduction options. Some factors may be specific to a facility or common within a sector. Facilities’ explanations about why options may not be implemented include:
- implementing an option may not result in substantial enough reduction to justify associated costs or return on investment
- options associated with other regulatory programs and industry initiatives are being implemented or have been implemented
- the substance occurs naturally in feedstock and cannot be reduced
- the substance is essential in the manufacturing process and becomes a product or component of the product
- the substance is an unintended or unavoidable by-product created during the manufacturing process
- lack of time and/or resources
- there are no safer alternative substances or processes to be considered
Recently released updates to the Toxics Reduction Program’s reporting system, Single Window, change how facilities report explanations on implementation by providing a list of possible reasons to select. These changes will provide the ministry with more consistent responses to better understand the challenges facilities encounter with regard to implementation and inform program improvements to encourage facilities to implement reduction options.
Enhancements to the toxics reduction environment map
The toxics reduction environment map has undergone significant enhancements since last year providing a new look and feel. The enhancements include increased capabilities to search, filter information, and visualize data for toxic substances in Ontario by location, substance, and year.
Compliance activities
Ontario uses a graduated compliance approach to ensure facilities are complying with the reporting, planning and public posting requirements of the Toxics Reduction Act and regulation. Compliance rates show that 95% of the expected facilities were or became compliant with the requirements under the act and regulation for the 2014 reporting year. Compliance activities are underway for the 2015 reporting year, reviewing data that was reported by June 1, 2016.
Facilities’ progress
Annual reports provided by facilities track year-over-year toxics use, creation, amounts contained in product (the reporting requirements that are specific to Ontario’s Toxics Reduction Act), as well as the amounts released, disposed and recycled at the facility (the reporting requirements under the NRPI program). They also track progress made on implementing toxic substance reduction plans. The ministry analyzes data trends and considers possible reasons for the trends identified. The ministry recognizes that trends can be affected by a variety of variables, including fluctuations in production levels and facility size, process modifications, changes in calculation methods and general updates to submitted data.
Changes to the substances thresholds by the NRPI program can also affect the data trends in the Toxics Reduction Program. Changes for the 2016 reporting year were announced through the Canada Gazette (February 27, 2016), including lowering the reporting threshold for one substance, namely cobalt (and its compounds). As a result, additional facilities are now required to report and prepare toxic substance reduction plans for cobalt (and its compounds) due to the lower threshold. Furthermore, Environment and Climate Change Canada removed 21 substances from the NRPI. Environment and Climate Change Canada determined that these 21 substances were not of health or environmental concern in Canada, and not released in significant quantities by facilities in Canada. Of these 21 substances, only three have been reported in Ontario (i.e., C. I. basic red 1, dimethyl phenol, and tetracycline hydrochloride). Facilities are no longer required to report or prepare toxic substance reduction plans with respect to substances removed from the NRPI list of prescribed substances.
Decreases in reported amounts of substances may also be attributed to complementary ministry programs whose goals are also to minimize environmental releases and other changes in the regulatory environment.
Substances used, created and contained in product
Graph 1 shows the total amounts used, created, contained in product and released, for all prescribed substances, across all regulated facilities. Between 2015 and 2016, there was a 6% (approximately 628,466 tonnes) decrease in use and a 2% (approximately 634,910 tonnes) decrease in creation. These values contribute to a decreasing trend since 2014 and continue to be below amounts reported in 2012.
Between 2015 and 2016, there was the 9% decrease (approximately 784,263 tonnes) in the total amount contained in product for all prescribed substances, across all regulated facilities. This is an all-time-low since 2012.
These products are either finished goods (products that are fully manufactured and intended to be sold to an end user) or intermediate goods (partly finished products that are used in the production of other goods) that are sold or further processed in Ontario, or exported globally.
The majority of finished goods are produced by the petroleum products and coal manufacturing sector, including gasoline, aviation fuel, diesel and other fuels. The majority of intermediate goods are produced by the chemical manufacturing and metal manufacturing sectors, including industrial chemicals and parts used by the automotive, construction and energy industries.
By reducing the amount of toxic substances used in products across all sectors, facilities under the toxic reduction program are providing increased options in the marketplace and supply chain.
Notably, total releases (to air, land and water) are very small in comparison to the substances used, created and contained in product and have remained relatively stable since 2012. The following subsection regarding substances released to air, land and water will examine this trend more closely.
Graph 1: Total use, creation, contained in product, and releases for all facilities (2012-2016)
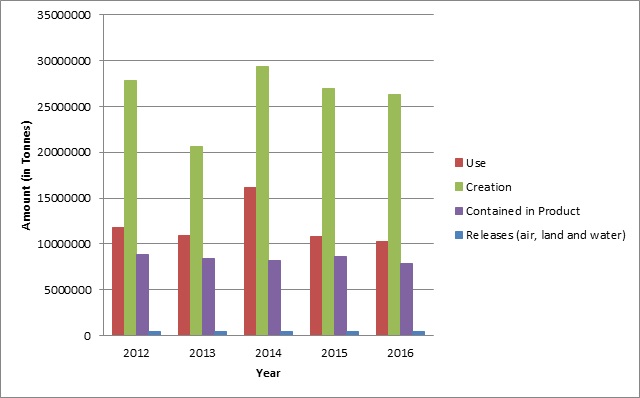
The total amount of toxic substances used for all facilities in 2012 was 11,744,238 tonnes, 10,965,273 tonnes in 2013, 16,216,010 tonnes in 2014, 10,870,239 tonnes in 2015 and 10,241,773 tonnes in 2016.
The total amount of toxic substances created for all facilities in 2012 was 27,788,689 tonnes, 20,641,909 tonnes in 2013, 29,411,605 tonnes in 2014, 26,949,221 tonnes in 2015 and 26,314,311 tonnes in 2016.
The total amount of toxic substances contained in product for all facilities in 2012 was 8,809,167 tonnes, 8,415,042 tonnes in 2013, 8,207,272 tonnes in 2014, 8,610,353 tonnes in 2015 and 7,826,090 tonnes in 2016.
The total amount of toxic substances released to air, land and water for all facilities in 2012 was 415,485 tonnes, 447,052 tonnes in 2013, 434,052 tonnes in 2014, 435,108 tonnes in 2015 and 425,628 tonnes in 2016.
Data results show that certain substances contributed more significantly than others to increases and decreases in totals between 2015 and 2016. These substances are listed in Tables 1 and 2 below.
Facilities largely attribute the change in use, creation and contained in product to rising and falling production levels. Other factors such as changes to quantification methodologies and implementation of actions outside of the toxic substance reduction plan have also had an impact.
Table 1: Substances that significantly decreased between 2015 and 2016, impacting the total amounts used, created and contained in product
| Use | Creation | Contained in product |
|---|---|---|
| manganese (and its compounds) | carbon monoxide | manganese |
| butane (all isomers) | hexane | toluene |
| xylene (all isomers) | total particulate matter | n-hexane |
| heptane | toluene | xylene (all isomers) |
| copper (and its compounds) | pentane (all isomers) | benzene |
| n-hexane | n-hexane | propylene |
| toluene | n/a | n/a |
Table 2: Substances that significantly increased between 2015 and 2016, impacting the total amounts used, created and contained in product
| Use | Creation | Contained in product |
|---|---|---|
| hexane | butene (all isomers) | ethylene |
| propane | octane (all isomers) | sulphuric acid |
| Pentane (all isomers) | ammonia (total) | ammonia (total) |
| n/a | ethylene | zinc (and its compounds) |
Focusing on those facilities that intend to reduce toxic substances by implementing a reduction option, Graph 2 below shows that, between 2015 and 2016, use has decreased by 7% (approximately 69,642 tonnes), creation has decreased by 5% (approximately 51,086 tonnes), and contained in product has decreased by 9% (approximately 55,172 tonnes). Some of these facilities have indicated that reductions are a result of implementing plans, and others have cited other reasons including decreases in production.
Graph 2: Total use, creation, and contained in product only for facilities intending to reduce (2012-2016)
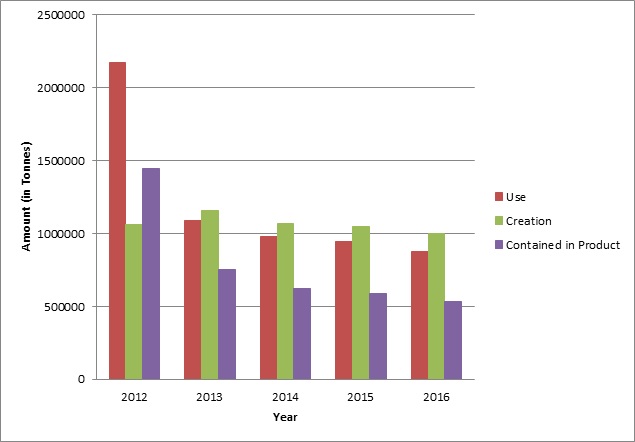
The total amount of toxic substances used for facilities intending to reduce in 2012 was 2,172,669 tonnes, 1,092,017 tonnes in 2013, 977,887 tonnes in 2014, 945,932 tonnes in 2015 and 876,291 tonnes in 2016.
The total amount of toxic substances created for facilities intending to reduce in 2012 was 1,063,284 tonnes, 1,161,219 tonnes in 2013, 1,067,170 tonnes in 2014, 1,050,611 tonnes in 2015 and 999,525 tonnes in 2016.
The total amount of toxic substances contained in product for facilities intending to reduce in 2012 was 1,448,013 tonnes, 752,739 tonnes in 2013, 620,413 tonnes in 2014, 589,195 tonnes in 2015 and 534,023 tonnes in 2016.
Substances released to air, land and water
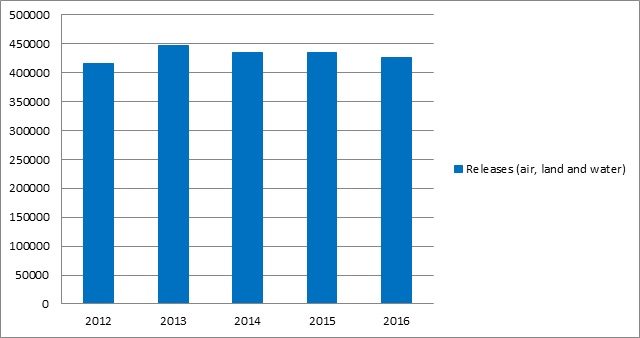
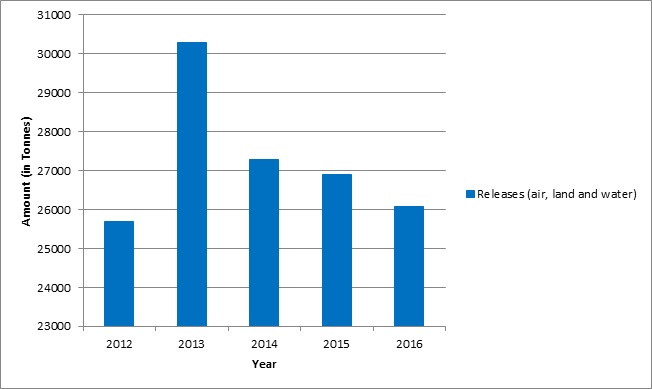
Graph 3 below shows that amounts of substances released to air, land and water have remained relatively stable since 2012. Although there was a 2% (9,481 tonnes) decrease between 2015 and 2016, the total amount of releases in 2016 is 2% (10,142 tonnes) over levels reported in 2012. Since 2012, these releases are comprised consistently of six substances that rank as the top releases by volume: sulphur dioxide, carbon monoxide, nitrogen oxides, total particulate matter, particulate matter ≤10 microns, and particulate matter ≤2.5 microns. The relatively stable values with respect to total releases could reflect a variety of variables, including fluctuations in production levels, process modifications, changes in calculation methods, and general updates to submitted data.
Graph 3: Total releases (air, land and water) for all facilities (2012-2016)
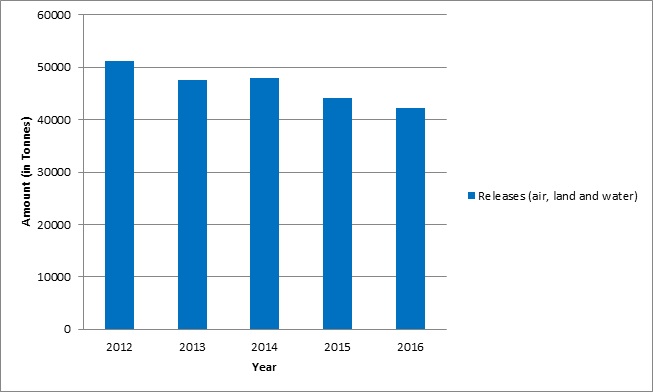
Looking more closely at facilities that intend to reduce toxic substances, Graph 4 below shows the total releases to air, land and water between 2012 and 2016. Facilities have reduced releases by 18% (approximately 9,086 tonnes) between 2012 and 2016. Most recently, between 2015 and 2016, total releases have decreased by 5% (approximately 2,050 tonnes).
Graph 4: Total releases (air, land and water) for substances that facilities intend to reduce (2012-2016)
Substances of interest
Prescribed substances linked with cancer
The Toxics Reduction Program helps facilities reduce the release of substances linked with cancer. However, it is important to note that exposure to carcinogens also comes from many other sources.
Twenty-nine of the 348 substances prescribed under the Toxics Reduction Act are known or probable carcinogens (substances linked with cancer) according to the International Agency for Research on Cancer. A list of these substances is included below.
Prescribed substances linked with cancer:
- 1,3-butadiene
- 2,3,7,8-tetrachlorodibenzo-p-dioxin
- 2-mercaptobenzothiazole
- acrylamide
- arsenic (and its compounds)
- asbestos (friable form only)
- benzene
- benzo(a)pyrene
- benzyl chloride
- biphenyl
- cadmium (and its compounds)
- dibenz(a,j)acridine
- dibenzo(a,h)anthracene
- dichloromethane
- ethylene oxide
- formaldehyde
- hexavalent chromium (and its compounds)
- hydrazine (and its salts)
- lead (and its compounds)
- N,N-dimethylformamide
- nickel (and its compounds)
- p,p'-methylenebis(2-chloroaniline
- PM10 – particulate matter ≤ 10 microns
- PM2.5 – particulate matter ≤ 2.5 microns
- creosote
- sulphuric acid
- tetrachloroethylene
- trichloroethylene
- vinyl chloride
Graph 5 below shows that, between 2015 and 2016, facilities have decreased total releases of these substances by 3% (approximately 811 tonnes). The ministry recognizes that this downward trend may be the result of a variety of variables, including fluctuations in production levels and facility size, process modifications, changes in measurement and calculation methods and general updates to submitted data. The spike in 2013 reflects a one-time outlier that can be attributed to a deficiency in the sampling methodology for sulphuric acid due to a specific combination of weather factors.
Graph 5: Total releases (air, land and water) for substances linked to cancer (2012-2016)
Local information about industrial releases of substances linked with cancer is available through the toxics reduction environment map. Specifically, the toxics reduction environment map shows the location of relevant facilities and links to plan summaries and annual reporting information for these substances.
In addition, the ministry is providing additional information about substances through profiles. These substance profiles are accessible through the toxics reduction environment map. Substance profiles include information about natural and human-caused sources, human health impacts (including cancer), and other actions the ministry is taking to manage these substances and limit exposure. Currently, substance profiles have been created for ten substances including the following six substances linked with cancer: 2,3,7,8-tetrachlorodibenzo-p-dioxin, acrylamide, arsenic, formaldehyde, hexavalent chromium, and PM2.5 (particulate matter that is less than 2.5 micrometers in diameter). According to Public Health Ontario and Cancer Care Ontario’s report on the environmental burden of cancer, these six substances are associated with 10 or more cases of cancer per year in Ontario.
Caring for Ontario’s Great Lakes and inland waters
The Canada-Ontario Agreement on Great Lakes Water Quality and Ecosystem Health (Canada-Ontario Agreement) is an agreement between the governments of Canada and Ontario to promote a healthy, prosperous and sustainable Great Lakes Basin ecosystem for current and future generations. The Canada-Ontario Agreement is also the principal mechanism through which Ontario and Canada coordinate their work to address their respective and shared commitments to protect the Great Lakes under the Canada-United States Great Lakes Water Quality Agreement.
Since the signing of the first Canada-Ontario Agreement in 1971, there have been eight agreements. Each Canada-Ontario Agreement focuses on addressing issues in the Great Lakes Basin and meeting specific commitments under the Canada-United States Great Lakes Water Quality Agreement.
The 1994 Canada-Ontario Agreement identified a group of chemicals in the Great Lakes Basin that were of concern and outlined actions to reduce and prevent releases. These chemicals were grouped into two categories, Tier 1 and Tier 2.
Tier 1 chemicals are:
- persistent, bioaccumulative, toxic and of immediate environmental concern to the Great Lakes Basin
- known to have a long history of concerns related to human and environmental health
- included in many local, national and international risk management and monitoring programs
Tier 2 chemicals have:
- the potential to impair and cause widespread impacts in the Great Lakes Basin ecosystem
- less information available about their persistence and toxicity in the environment and their impacts on human health
Under all subsequent Canada-Ontario Agreements, the Canadian government and the Ontario government have worked collaboratively, and with other partners, to reduce the release and levels of Tier 1 and 2 chemicals in the Great Lakes Basin.
The current Canada-Ontario Agreement, which is in effect from December 18, 2014 to December 17, 2019, includes a focus on past and ongoing sources of pollution. Specifically, through the Harmful Pollutants Annex of the Canada-Ontario Agreement, Ontario and Canada have agreed to designating chemicals of concern for further action with regard to their release to the Great Lakes Basin. An early commitment of this agreement was to carry out a review of the status of Tier 1 and Tier 2 chemicals updating information related to their use, release and concentrations in ambient air, surface water, sediment, fish and Herring Gull eggs as well as a summary of current and past risk management actions, research, monitoring and surveillance to identify any chemicals that required further action.
The list of chemicals of concern agreed to in the current Canada-Ontario Agreement is based on the list of chemicals of mutual concern under the Canada-United States Great Lakes Water Quality Agreement plus two additional substances as a result of this review. On May 31, 2016, the governments of Canada and the United States announced the designation of the first set of chemicals of mutual concern under the Great Lakes Water Quality Agreement. See the list of chemicals on the Canada-United States Collaboration for Great Lakes Water Quality website.
In addition to these chemicals of mutual concern, Ontario designated two more substances as chemicals of concern under the Canada-Ontario Agreement, polycyclic aromatic hydrocarbons and lead. Both substances are also prescribed under the Toxics Reduction Act.
Designation of chemicals of concern is an important commitment of the Canada-Ontario Agreement, and allows both parties to initiate actions to further reduce the presence of these substances in the Great Lakes.
In addition, Ontario has been a leading jurisdiction in the research and monitoring of microplastics in the Great Lakes, streams and wastewater treatment effluents since 2014. Microplastics are an emerging environmental pollutant around the world and are present in Ontario’s lakes and streams. Microplastics are particles of plastic less than five millimeters in size. There are many types and sources of microplastics, including microbeads (personal care products), fragments (breakdown of plastic litter and debris, cuttings and trimmings from building materials and commercial plastics operations), lines and fibres (clothing, carpeting, textile), foam (food containers, packaging and building materials), film (wrappers, bags, sheeting), and preproduction materials (pellets and powders).
Following Ontario’s movement towards managing microbeads, the federal government initiated Canada-wide action on microbeads, resulting in the phasing in of a nationwide ban on plastic microbeads in personal care products beginning January 1, 2018. Action on plastic microbeads is an important first step in addressing the broader problem of microplastics accumulating in our lakes and rivers. There are a range of solutions that will need to be applied to reduce microplastics in the environment over the longer term. This is why the ministry is considering approaches to address the issue of plastic pollution in our Great Lakes and inland waters.