2018–2021 minister’s reports on toxics reduction
Read the 2018–2021 minister’s reports on toxics reduction, and learn about the 2017–2020 reported data to the toxics reduction program.
Overview
The 2018, 2019, 2020 and 2021 minister’s reports on toxics reduction highlight Ontario’s progress to reduce toxic substances in our air, land, and water during the reporting years of 2017, 2018, 2019 and 2020 respectively. This includes the analysis on the amount of toxic substances used, created, contained in products and released in Ontario. The Toxics Reduction Act, 2009 was repealed and associated regulations revoked on December 31, 2021, ending all reporting requirements for the regulated community. 2020 was the last reporting year.
Annual reports provided by facilities allowed us to track year-over-year toxics use and creation, as well as the amounts of toxics contained in products (reporting requirements that are specific to Ontario’s Toxics Reduction Act, 2009). They also helped us track the amounts released, disposed and recycled at the facility (reporting requirements under the National Pollutant Release Inventory program).
Program analysis in 2018 determined that the toxics reduction program had not achieved meaningful reductions. Results using program data from 2012 to 2016 indicated that implementing a toxics reduction option from their toxic substance reduction plans yielded an overall reduction of only 0.04% of substances used, created and released for all facilities. As further analysis shows, the number of facilities implementing an option to reduce amounts used, created, contained in products, and released is low (especially compared to the total number of facilities that report under the Toxics Reduction Act, 2009) and has continued to decline over the last three years of the program.
2018 minister’s report on toxics reduction
The 2018 report is based on reported data from the year 2017.
In 2017, a total of 1,088 facilities, representing a variety of sectors prescribed under the Toxics Reduction Act, 2009 reported to the toxics reduction program. Facilities were required to submit data for the 2017 reporting year to the ministry by June 1, 2018.
Toxic substances prescribed under the Toxics Reduction Act, 2009 are the same substances reported under Environment and Climate Change Canada’s National Pollutant Release Inventory, with the addition of acetone. In 2017, facilities in Ontario that reported to the toxics reduction program reported on 232 substances.
The 2017 data shows a decrease in the amount of toxic substances used and created at these facilities as well as a decrease in the amount of toxic substances contained in products compared to 2016. Also, toxic substances released to air, land and water decreased in 2017 compared to 2016. For further analysis, see trends over the 2012-2020 reporting years.
2019 minister’s report on toxics reduction
The 2019 report is based on reported data from the year 2018.
In 2018, legislative and regulatory changes were made that ended the requirements for facilities to develop new and review existing toxic substance reduction plans and to report on new substances (see the program changes section for more information).
In 2018, a total of 1,023 facilities, representing a variety of sectors prescribed under the Toxics Reduction Act, 2009 reported to the toxics reduction program. Facilities were required to submit data for the 2018 reporting year to the ministry by June 1, 2019.
In 2018, facilities in Ontario that reported to the toxics reduction program reported on 214 substances reported under Environment and Climate Change Canada’s National Pollutant Release Inventory.
Compared to the previous year, the 2018 data shows a decrease in the amount of toxic substances used at these facilities and an increase in the amount of toxic substances created. The data also showed an increase in toxic substances contained in products. Also, toxic substances released to air, land, and water decreased compared to 2017. For further analysis, see trends over the 2012-2020 reporting years.
2020 minister’s report on toxics reduction
The 2020 report is based on reported data from the year 2019.
In 2019, a total of 979 facilities, representing a variety of sectors prescribed under the Toxics Reduction Act, 2009 reported to the toxics reduction program. Facilities were required to submit data for the 2019 reporting year to the ministry by July 31, 2020 instead of the usual June 1 compliance date, as the National Pollutant Release Inventory reporting deadline was changed by Environment and Climate Change Canada, with which Ontario aligns, due to the pandemic.
In 2019, facilities in Ontario that reported to the toxics reduction program reported on 209 substances reported under Environment and Climate Change Canada’s National Pollutant Release Inventory.
2019 is also the year when all toxics reduction planning and new reporting ended for acetone (see section on removing acetone reporting requirements). Further information on these changes is available in the 2018-2019 program changes subsection.
Compared to the previous year, the 2019 data shows a decrease in the amount of toxic substances used and created at these facilities as well as a decrease in the amount of toxic substances contained in products and released to air, land and water. For further analysis, see trends over the 2012-2020 reporting years.
2021 minister’s report on toxics reduction
The 2021 report is based on reported data from the year 2020.
In 2020, a total of 883 facilities, representing a variety of sectors prescribed under the Toxics Reduction Act, 2009 reported to the toxics reduction program. Facilities were required to submit data for the 2020 reporting year to the ministry by September 30, 2021 instead of the usual June 1 compliance date, as the National Pollutant Release Inventory reporting deadline was changed by Environment and Climate Change Canada, with which Ontario aligns, due to the pandemic.
In 2020, facilities in Ontario that reported to the toxics reduction program reported on 201 substances reported under Environment and Climate Change Canada’s National Pollutant Release Inventory.
Compared to the previous year, the 2020 data shows a decrease in the amount of toxic substances used and created at these facilities as well as a decrease in the amount of toxics substances contained in products and released to air, land and water. For further analysis, see trends over the 2012-2020 reporting years.
Program changes
Toxics reduction program changes
In 2018, as part of the Ontario Open for Business Action Plan, we consulted on:
- a proposal to repeal the Toxics Reduction Act, 2009 on December 31, 2021
- a proposal to reduce regulatory burden until December 31, 2021 under Ontario Regulation 455/09
Repeal of the Toxics Reduction Act, 2009 on December 31, 2021
Following these consultations, we decided to repeal the Toxics Reduction Act, 2009 and revoke associated regulations on December 31, 2021.
Repealing the Toxics Reduction Act, 2009 on December 31, 2021 eliminated duplication and overlap with the federal government’s Chemicals Management Plan program under the Canadian Environmental Protection Act, 1999, while preserving annual reporting of toxic substances to maintain Ontarians’ right to know until December 31, 2021. Repealing the Toxics Reduction Act, 2009 in 2021 was coordinated with the federal government’s approach to managing toxic substances, namely when the federal Chemicals Management Plan program under the Canadian Environmental Protection Act anticipated finalizing its assessment of chemicals. Our approach to repeal the Toxics Reduction Act, 2009 and associated regulations, and to defer to the federal Chemicals Management Plan program, maintained balance between a healthy environment and a healthy economy.
In addition, analysis in 2018 using program data from 2012 to 2016 determined that the toxics reduction program has not achieved meaningful reductions. Results indicated that implementing a reduction option from their toxic substance reduction plans yielded an overall reduction of only 0.04% of substances used, created and released for all facilities.
Reduction of regulatory burden from 2018 until December 31, 2021
To further avoid unnecessary duplication and reduce burden for the 2018 calendar year until December 31, 2021, regulatory amendments were also made so that all Ontario facilities no longer needed to:
- prepare new plans
- review existing plans
- report on new substances
Voluntary implementation of toxics substance reduction plans
When the program was active, regulated facilities were able to choose whether they implemented toxic substance reduction plans, whereas the federal government can request facilities implement both voluntary and mandatory actions, when necessary.
Changes to acetone reporting
In 2019, we consulted on a proposal to end acetone reporting in Ontario, to reduce burden for businesses and further align Ontario with the federal government and other Canadian jurisdictions that have not required acetone release reporting since 1998. Following these consultations, we decided to end acetone reporting in Ontario on January 1, 2020.
Ontario’s air standard for acetone under Ontario Regulation 419/05: Air Pollution – Local Air Quality continues to ensure that facilities do not release concentrations of acetone into the air that are harmful to human health.
Trends over the 2012-2020 reporting years
Substances used, created, contained in products, and released
The purpose of the Toxics Reduction Act, 2009 was:
- to prevent pollution and protect human health and the environment by reducing the use and creation of toxic substances
- to inform Ontarians about toxic substances
Regulated facilities with toxic substance reduction plans were required to submit annual reports on the amounts of all prescribed toxic substances used, created, contained in products and released (to air, land and water). They were also required to submit summaries of their toxic substance reduction plans, which included a description of the toxic substances used or created at the facility, a description of any toxics reduction options to be implemented and the estimated reductions of toxics substances, as well as anticipated timelines for achieving reductions.
The information and analysis presented in this report is based on all facilities’ 2011-2020 plan summaries and 2012-2020 annual reports. All analysis was based on 2012-2020 data submitted to the ministry as of January 6, 2022 (this includes facilities’ corrected and updated historical data). Graphs 1 and 2 below show the total amount of prescribed toxic substances used, created, contained in products and released (to air, land and water), across all regulated facilities.
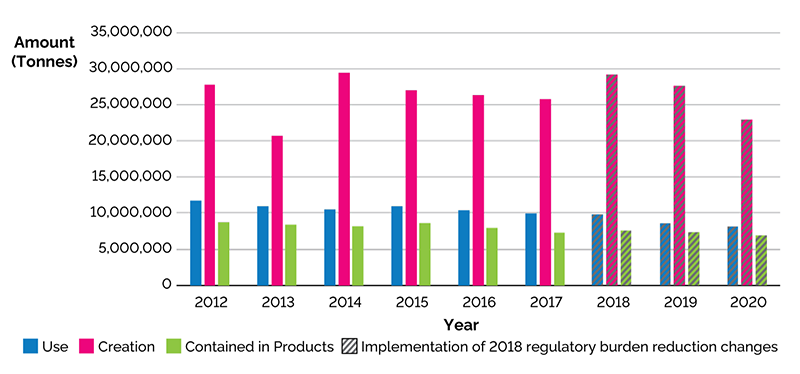
Graph 1: Total use, creation, contained in products for all facilities (2012-2020)
Substances used (2012-2020)
The total amount of toxic substances used for all facilities in 2012 was 11,698,270 tonnes, 10,967,500 tonnes in 2013, 10,505,948 tonnes in 2014, 10,895,392 tonnes in 2015, 10,323,789 tonnes in 2016, 9,926,676 tonnes in 2017, 9,662,158 tonnes in 2018, 8,475,399 tonnes in 2019, and 8,063,581 tonnes in 2020.
Substances created (2012-2020)
The total amount of toxic substances created for all facilities in 2012 was 27,788,367 tonnes, 20,641,445 tonnes in 2013, 29,433,864 tonnes in 2014, 26,974,239 tonnes in 2015, 26,314,831 tonnes in 2016, 25,813,228 tonnes in 2017, 28,930,093 tonnes in 2018, 27,449,275 tonnes in 2019, and 22,811,624 tonnes in 2020.
Substances contained in products (2012-2020)
The total amount of toxic substances contained in products for all facilities in 2012 was 8,761,105 tonnes, 8,412,098 tonnes in 2013, 8,216,834 tonnes in 2014, 8,630,352 tonnes in 2015, 7,891,838 tonnes in 2016, 7,330,332 tonnes in 2017, 7,554,953 tonnes in 2018, 7,239,804 tonnes in 2019, and 6,849,064 tonnes in 2020.
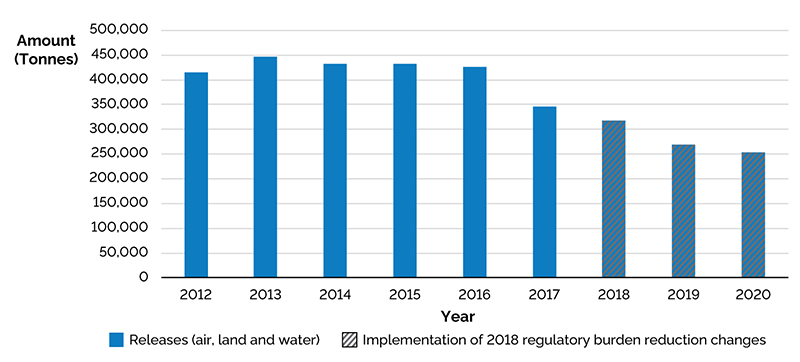
Graph 2: Total releases (air, land and water) for all facilities (2012-2020)
Substances released to air, land and water (2012-2020)
The total amount of toxic substances released to air, land and water for all facilities in 2012 was 415,658 tonnes, 446,150 tonnes in 2013, 432,105 tonnes in 2014, 432,791 tonnes in 2015, 426,376 tonnes in 2016, 345,946 tonnes in 2017, 317,457 tonnes in 2018, 268,489 tonnes in 2019, and 254,001 tonnes in 2020.
Variables and considerations for interpreting trends
The ministry notes possible variables that impacted trends and analysis, including:
- fluctuations in production levels and facility size (including impacts of the COVID‑19 pandemic)
- process modifications at the facility
- changes in calculation methods and general updates to submitted data
- changes to substances reported for National Pollutant Release Inventory. (For example, changes for the 2018 reporting year included addition of 8 substances, modification of how certain substances are captured or to reporting thresholds, and removal of 26 substances. Changes for the 2020 reporting year included addition of 3 substances, modification of how certain substances are captured or to reporting requirements, and removal of 5 substances)
Decreases in the reported amounts of substances were not necessarily due to a facility voluntarily implementing toxics reduction options from their plans. For analysis regarding the implementation of reduction options, please see section about the number of facilities implementing an option to reduce amounts used, created, released.
Decreases in reported amounts of substances may also be attributed to complementary ministry programs whose goals are also to minimize environmental releases, and to other changes in the regulatory environment.
Other considerations for interpreting year-over-year differences include the impact of the 2018 regulatory changes to end all new toxic substance reporting and planning. These regulatory changes make comparing data from 2018 and before with data from after 2018 challenging. This is because any new reporting and planning activity that would have been previously reported under the Toxics Reduction Act, 2009 could not be reflected in substance totals after 2018. For this reason, data for years 2018, 2019 and 2020 are called out in the previous graphs.
In addition, the number of facilities reporting under the Toxics Reduction Act, 2009 has decreased year-over-year as previously captured facilities fell out of the program for various reasons, including facility closure, further impacting the total reported amounts of substances.
These variables mean that overall fluctuations (decreases and increases) reported in the total amount of toxic substances used, created, contained in products and released over time by all facilities in Ontario may not reflect the effectiveness of the program.
Number of facilities implementing an option to reduce toxic substances used, created, contained in products, and released
Under the program, it was voluntary for a facility to implement an option for toxics reduction, as identified in a plan. The ministry determined the amount of toxic substance reductions attributed directly to the implementation of reduction options as opposed to other factors impacting overall trends (such as fluctuations in production levels and facility size as mentioned). Results using program data from 2012 to 2016 indicated that implementing a toxics reduction option from their toxic substance reduction plans yielded an overall reduction of only 0.04% of substances used, created and released for all facilities.
Under the Toxics Reduction Act, 2009, facilities were required to indicate their intent to implement an option to reduce at least one toxic substance, even if facilities have multiple toxic substances. Between reporting years 2017 and 2020, the number of facilities indicating their intent to implement an option for reducing at least one toxic substance decreased. As noted above, this decrease in the number of facilities may be a driver for the decreases in substance reporting seen in 2018-2020 due to repeal and regulatory changes. Of those facilities, fewer reported toxic substance reductions that were attributed directly to implementing those reduction options.
- In 2017, 366 facilities out of 1,088 total facilities reporting under the program indicated an intent to implement an option that would potentially reduce amounts of toxic substances; and of those, 57 reported reductions that were attributed directly to implementing those reduction options.
- In 2018, 337 facilities out of 1,023 total facilities reporting under the program indicated an intent to implement an option that would potentially reduce amounts of toxic substances; and of those, 40 reported reductions that were attributed directly to implementing those reduction options.
- In 2019, 318 facilities out of 979 total facilities reporting under the program indicated an intent to implement an option that would potentially reduce amounts of toxic substances; and of those, 31 reported reductions that were attributed directly to implementing those reduction options.
- In 2020, 288 facilities out of 883 total facilities reporting under the program indicated an intent to implement an option that would potentially reduce amounts of toxic substances; and of those, 22 reported reductions that were attributed directly to implementing those reduction options.
Open data and toxics environment map
The ministry provides information submitted by facilities on the Ontario Data Catalogue. This data is also provided through the toxics reduction environment map. The dataset and Toxics Reduction Environment Map have been updated to include information for reporting years 2017, 2018, 2019 and 2020. Ontarians can visit the province’s toxics reduction environment map to search by geographic location, company name, toxic substance or sector to find more information on facilities intending to implement options to reduce toxics.