2020-21 First Quarter Finances
August 2020
The First Quarter Finances report contains information about Ontario’s 2020–21 fiscal outlook as of June 30, 2020.
Highlights
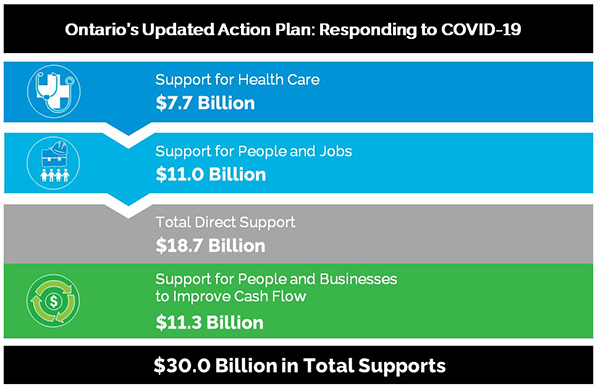
- To protect the health and economic well-being of the people of Ontario, the government continues to invest in the fight against the COVID‑19 outbreak, including providing support to families, businesses, jobs, municipalities, long-term care homes and those on the front lines of the pandemic. This brings the government’s current total COVID‑19 response action plan to a projected $30 billion, up from $17 billion.
- The COVID‑19 pandemic has resulted in significant and unprecedented impacts on economies around the world. Ontario’s real gross domestic product (GDP) declined 2.0 per cent in the first quarter of 2020, largely reflecting the pandemic’s economic impacts over a two-week period at the end of March. Private-sector economists are now, on average, forecasting that Ontario’s real GDP will decline by 6.6 per cent in 2020.
- Between February and May, Ontario’s employment declined by nearly 1.2 million net jobs and the unemployment rate rose to 13.6 per cent, the highest rate on record. In June and July, Ontario’s employment increased by 528,600 jobs and the unemployment rate decreased to 11.3 per cent.
- As of the 2020–21 First Quarter Finances, the government is projecting a deficit of $38.5 billion in 2020–21, representing an increase of $18.0 billion from the outlook presented in the March 2020 Economic and Fiscal Update. The increased deficit is the result of a decline in government revenues stemming from the significant negative economic impacts of COVID‑19 and the government’s actions to protect the health and jobs of the people of Ontario.
- Revenues in 2020–21 are projected to be $150.6 billion, $5.7 billion lower than forecast in the March 2020 Economic and Fiscal Update. The lower revenue forecast largely reflects the adverse impact of COVID‑19 on the provincial economy, partially offset by higher transfers from the federal government.
- Program expenses are projected to be $13.1 billion higher than the March 2020 Economic and Fiscal Update, primarily due to additional temporary supports for the pandemic recovery period and the safe restart and reopening of the province.
- Despite the Province’s funding requirement increasing by $17.0 billion relative to the March 2020 Economic and Fiscal Update, interest on debt (IOD) is projected to be $741 million lower. This reduction in IOD reflects lower interest rates.
Introduction
The 2020–21 First Quarter Finances provides an update to Ontario’s Action Plan: Responding to COVID‑19 (March 2020 Economic and Fiscal Update) which outlined the Province’s initial response to the unprecedented global health and economic crisis caused by the global pandemic. Introduced in the early stages of the outbreak, the March 2020 Economic and Fiscal Update made Ontario the first jurisdiction in Canada to release a fiscal plan that reflected the potential impacts of COVID‑19 . Despite great uncertainty, this update provided hospitals, schools, municipalities and other partners who rely on government funding clarity on what to expect for the year to come.
Released on March 25, 2020, the Update was based on economic projections available as of March 18, 2020, as Ontario, and the entire global economy, was entering a period of unprecedented uncertainty, risk, and volatility. While acknowledging that this remains a unique and unpredictable time, the 2020–21 First Quarter Finances delivers on the government’s commitment to transparency and accountability as responsible managers of the public’s finances.
The 2020–21 First Quarter Finances updates the economic outlook with the most current available private-sector forecasts. It also reports on the additional actions the government has taken in response to COVID‑19 since the March 2020 Economic and Fiscal Update. These actions have had a substantial impact on the government’s fiscal plan, and were in part possible due to the fiscal flexibility intentionally built in to the March 2020 Economic and Fiscal Update. The 2020–21 First Quarter Finances also outlines how the government remains positioned to support health, people and jobs as the public health and economic situation continues to unfold.
Action plan update
Since the beginning of the pandemic, the Ontario government has promised to do whatever is necessary to respond to COVID‑19 .
"The message from Premier Doug Ford and our government has been crystal clear: we will ensure the necessary resources are in place to protect the health of our people and our economy in this province. In working with our partners and other levels of government, that is exactly what we intend to do."
Rod Phillips, Minister of Finance,
March 2020 Economic and Fiscal Update
Ontario’s Action Plan: Responding to COVID‑19 included:
- $3.3 billion in additional resources for health care;
- $3.7 billion to support people and jobs, with measures to provide relief to seniors, parents, students and workers; and
- $10 billion made available to improve cash flows for people and businesses through tax and other deferrals to provide relief during this challenging economic time.
Taken together, Ontario’s Action Plan made $17 billion available to support health care, people and businesses. It was a plan with built-in flexibility given the global economic uncertainty, including a commitment to continue to ensure that the necessary health resources were in place to protect people and additional supports would be available as the crisis continued to unfold.
Since March 25, 2020, the government has announced additional initiatives in the fight against COVID‑19 , and is adding further flexibility into its plans to ensure the government has the resources to respond should the need arise, bringing the latest COVID‑19 response to a projected $30 billion.
As part of implementing Ontario’s Action Plan, since March the government has further allocated funding to support health care through key initiatives and investments including:
- Adding funding of $610 million for the purchase of personal protective equipment and other critical supplies, building on an initial personal protective equipment investment of $75 million;
- $53 million to ensure vulnerable people continue to have access to prescription medication during the pandemic;
- $50 million to the Ontario Together Fund to help businesses provide innovative solutions or retool their operations to manufacture essential medical supplies and equipment to help stop the spread of COVID‑19;
- $26 million in expanded mental health supports for people of all ages, including health care workers and first responders; and
- $15 million to support the design and implementation of the new Ontario Health Data Platform. This data platform provides recognized researchers and health system partners with access to anonymized health data that will allow them to better detect, plan and respond to COVID‑19 .
Key updates since the initial Action Plan include:
- An historic agreement achieved with the federal government to support the safe restart and reopening of the province. The Safe Restart Agreement will help ensure a strong and safe recovery as Ontario reopens following the plan outlined in A Framework to Reopen our Province;
- As part of the Safe Restart Agreement, Ontario, in partnership with the federal government, is providing up to $4 billion to help municipalities and transit agencies continue to deliver the critical services that the people of Ontario rely on every day;
- Making over $900 million available in urgent relief for Ontario small businesses and commercial landlords in partnership with the federal government, through the Canada Emergency Commercial Rent Assistance program;
- A one-time top-up of $4.3 billion to the dedicated COVID‑19 Health Contingency Fund and $3.0 billion in one-time funding for direct supports to people and jobs as the province’s economic recovery unfolds; and
- Extending the interest and penalty-free period for businesses to make payments for the majority of provincially administered taxes by one month, to October 1, 2020, increasing the potential cash flow available to Ontario businesses by $1.3 billion to an estimated $7.5 billion over the six month period between April to October.
The 2020–21 First Quarter Finances also outlines progress made on the government’s plan to fight the COVID‑19 pandemic. The Province has increased testing for COVID‑19 to an average of 25,000 per day, and expanded contact tracing has allowed public health to consistently exceed the target of reaching over 90 per cent of cases within 24 hours. The average number of daily cases was 81 from August 3 to August 10, the lowest daily average week since mid-March. These positive trends, made possible by the government’s investments, have allowed the province to move forward with reopening the economy and start recovery.
There are signs that Ontario’s economy has begun to recover. In June and July, Ontario’s employment increased by 528,600 net jobs and the unemployment rate decreased to 11.3 per cent, down from the peak of 13.6 per cent in May 2020. Home resales, manufacturing and retail sales have all increased since May after two consecutive months of decline.
Despite these positive signs, significant risk and uncertainty still remains. Many countries, including the United States, continue to face high numbers of infections and significant economic disruptions, which could impact Ontario’s economy. Heightened economic uncertainty could weigh on decisions to get businesses back up and running and people back to work.
That is why the Province continues to take a prudent approach to managing the pandemic, which is also reflected in the approach to its finances. The foundation of Ontario’s response to the economic impacts of COVID‑19 is an understanding that the most successful economic policy is to first address the health risks. A determined, steady approach in the fight against COVID‑19 will allow economic activity to resume and create more stability and certainty over the long term. Ultimately, this is the responsible approach for the health of the people of Ontario, the province’s economy, as well as the government’s finances.
Ontario’s response to COVID‑19 will continue to be informed by conversations and real-world expertise from the Province’s partners in business, labour and community organizations. Since March, the Ontario Jobs and Recovery Committee has established 56 Ministerial Advisory Councils. In addition to over 1,000 online submissions, the government has received input through over 240 consultations hosted by the Ministerial Advisory Councils and MPPs.
The government remains committed to releasing a multi-year provincial budget no later than November 15, 2020. This responsible approach will allow the Province to continue assessing the volatile and uncertain economic situation and putting forward a longer-term outlook based on the most recent and reliable data in the fall.
Over the coming months, the Province will continue to partner with other levels of government and the private-sector to support Ontario’s economic recovery and help restore long term prosperity for the benefit of every family, every worker and every community in Ontario.
Section A: Ontario’s 2020–21 fiscal outlook
The Province’s 2020–21 deficit is projected to be $38.5 billion — an increase of $18.0 billion from the outlook published in the March 2020 Economic and Fiscal Update. The economic impacts of the COVID‑19 pandemic have been significant and unprecedented. As a result, the 2020–21 First Quarter Finances project that revenues will be lower than initially forecasted while program expenses will be higher. Interest on debt is now projected to be lower due to lower than forecast interest rates.
Revenues in 2020–21 are projected to be $150.6 billion, $5.7 billion lower than forecast in the March 2020 Economic and Fiscal Update. The lower revenue forecast largely reflects the adverse impact of COVID‑19 on the provincial economy, partially offset by higher transfers from the federal government.
Program expense is projected to be $174.2 billion, $13.1 billion higher than the March 2020 Economic and Fiscal Update forecast, primarily due to additional supports put in place for the people of Ontario since March in response to unprecedented economic and health impacts of COVID‑19 . This includes funding to support the economic recovery, additional investments for municipalities and public transit, and support for frontline workers with temporary pandemic pay. The program expense outlook also includes a one-time top-up to the dedicated COVID‑19 Health Contingency Fund, the standard Contingency Fund and funding for direct supports to people and jobs as the province’s economic recovery unfolds.
The net debt-to-GDP ratio is now projected to be 47.1 per cent in 2020–21, 5.4 percentage points higher than the 41.7 per cent forecast in the March 2020 Economic and Fiscal Update. The net debt-to-GDP ratio increased as a result of the higher deficit and lower nominal GDP forecast relative to the March 2020 Economic and Fiscal Update.
The 2020–21 outlook also maintains a $2.5 billion reserve to protect the fiscal outlook against unforeseen adverse changes in the Province’s revenue and expense forecasts for the remainder of the fiscal year.
| Item | March 2020 Update | Current Outlook1 | In-Year Change |
|---|---|---|---|
| Revenue | 156,266 | 150,612 | (5,654) |
| Expense — Programs | 161,077 | 174,192 | 13,115 |
| Expense — Interest on Debt | 13,199 | 12,458 | (741) |
| Total Expense | 174,276 | 186,651 | 12,374 |
| Surplus/(Deficit) Before Reserve | (18,010) | (36,038) | (18,028) |
| Reserve | 2,500 | 2,500 | – |
| Surplus/(Deficit) | (20,510) | (38,538) | (18,028) |
[1] Current outlook primarily reflects government decisions and information available as of June 30, 2020.
Note: Numbers may not add due to rounding.
Revenue
Revenues in 2020–21 are projected to be $150.6 billion, $5.7 billion lower than forecast in the March 2020 Economic and Fiscal Update.
The forecast for Total Taxation Revenue has decreased by $10.8 billion compared to the March 2020 Economic and Fiscal Update. This is based on an economic outlook scenario closely aligned with the average of current private-sector forecasts. Furthermore, it takes into account the taxation revenue experience of past economic downturns. This results in a 10.0 per cent decrease in projected taxation revenues, corresponding to a 7.3 percentage point decline in the nominal GDP outlook. Put in a different way, each percentage point change in nominal GDP is associated with an approximately $1.5 billion change in the taxation revenue forecast, roughly double the amount that would normally be associated with a one percentage point change in GDP.
Key changes in the taxation revenue outlook compared to the March 2020 Economic and Fiscal Update include:
- Corporations Tax revenue is lower by $5.2 billion (34.5 per cent) due to a larger projected decline in corporate profits;
- Sales Tax revenue is lower by $4.2 billion (14.3 per cent) due to a projected decline in household consumption spending;
- Personal Income Tax and Ontario Health Premium combined are lower by $497 million (1.2 per cent) mainly due to lower projected compensation of employees, partially offset by the impact of Canada Emergency Response Benefit (CERB) payments that are deemed taxable by the federal government;
- Gasoline and Fuel Taxes combined are lower by $448 million (12.8 per cent) due to lower projected volumes purchased;
- Employer Health Tax is lower by $387 million (5.7 per cent) due to lower projected compensation of employees; and
- All Other Taxes Combined are lower by $75 million mainly due to decreased revenues projected from the Land Transfer Tax.
Government of Canada Transfers have increased by $6.2 billion since the March 2020 Economic and Fiscal Update, mainly due to funding under the Federal Safe Restart Agreement of $5.1 billion
Net income from Government Business Enterprises is projected to be lower by $209 million, due to an updated Ontario Lottery and Gaming Corporation outlook, reflecting revised expectations for reopening of casinos and recent trends in lottery sales.
Other Non-Tax Revenue is lower by $898 million mainly due to updated sales and rental revenue projections from government business organizations, notably Metrolinx, and lower revenues from Fees, Licences and Permits due to a range of activities that were impacted by the COVID‑19 pandemic.
| Item | 2020–21 |
|---|---|
| March 2020 Economic and Fiscal Update Revenue Outlook | 156,266 |
| Revenue Changes since the March 2020 Economic and Fiscal Update — Corporations Tax | (5,229) |
| Revenue Changes since the March 2020 Economic and Fiscal Update — Sales Tax | (4,154) |
| Revenue Changes since the March 2020 Economic and Fiscal Update — Personal Income Tax and Ontario Health Premium | (497) |
| Revenue Changes since the March 2020 Economic and Fiscal Update — Gasoline and Fuel Tax | (448) |
| Revenue Changes since the March 2020 Economic and Fiscal Update — Employer Health Tax | (387) |
| Revenue Changes since the March 2020 Economic and Fiscal Update — All Other Taxes | (75) |
| Total Taxation Revenue | (10,791) |
| Government of Canada Transfers | 6,244 |
| Government Business Enterprises | (209) |
| Other Non-Tax Revenue | (898) |
| Total Revenue Changes since the March 2020 Economic and Fiscal Update | (5,654) |
Note: Numbers may not add due to rounding.
There are further upside and downside risks that could materially affect the 2020–21 revenue outlook. These include changes to the economic growth outlook, information on tax assessments and revenue collections from Ontario-administered taxes. The government will monitor these economic and revenue developments and will provide further details in future fiscal updates.
Expense
Total expense, including interest on debt, is projected to be $186.7 billion, $12.4 billion higher than the March 2020 Economic and Fiscal Update projection, primarily due to additional supports put in place for the people of Ontario since March in response to unprecedented economic and health impacts from COVID‑19 . This includes funding to support health care and the economic recovery, as well as additional support for frontline workers with temporary pandemic pay, partially offset by a decrease in interest on debt expense due to lower interest rates.
| Program Expense Changes since the March 2020 Economic and Fiscal Update: | 2020–21 |
|---|---|
| Safe Restart Agreement (Municipal and Transit) — Federal Contribution | 1,777 |
| Safe Restart Agreement (Municipal and Transit) — Provincial Contribution | 2,223 |
| Total Safe Restart Agreement (Municipal and Transit) | 4,000 |
| Provincial Contributions from Contingencies and Current Fiscal Framework | (1,594) |
| Net Program Expense Increase for Safe Restart Agreement – Municipal and Transit1 | 2,406 |
| Temporary Pandemic Pay — Federal Contribution | 1,129 |
| Temporary Pandemic Pay — Provincial Contribution | 424 |
| Total Temporary Pandemic Pay | 1,553 |
| Provincial Contributions from Contingencies and Current Fiscal Framework | (424) |
| Net Program Expense Increase for Temporary Pandemic Pay2 | 1,129 |
| Support for Health — Purchase of Personal Protective Equipment, and Other Critical Supplies | 610 |
| Support for Health — Temporary Pandemic Pay3 | 424 |
| Support for Health — Safe Restart Agreement – Municipal Support - Public Health4 | 100 |
| Support for Health — Access to Prescription Medication – Ontario Drug Programs and Trillium Benefit5 | 53 |
| Support for Health — Ontario Together Fund | 50 |
| Support for Health — Ontario Health Data Platform | 15 |
| Support for Health — Municipal Transit Agencies Enhanced Cleaning | 15 |
| Support for Health — Mental Health and Addictions Services | 14 |
| Support for Health — Virtual Mental Health Supports, Including Services to Support Frontline Health Care Workers | 12 |
| Support for Health — Other Technical Adjustments6 | 247 |
| Support for Health — Top-Up of COVID‑19 Health Contingency Fund7 | 4,344 |
| Total Support for Health | 5,883 |
| Support for People and Jobs — Safe Restart Agreement – Municipal and Transit Support8 | 1,494 |
| Support for People and Jobs — Temporary Immediate Relief for Industrial and Commercial Electricity Consumers9 | 340 |
| Support for People and Jobs — Canada Emergency Commercial Rent Assistance Program10 | 241 |
| Support for People and Jobs — Off-Peak Time-of-Use Electricity Rate to May 31st11 | 176 |
| Support for People and Jobs — Expanding the Risk Management Program12 | 50 |
| Support for People and Jobs — Agri-Food Supply Chain Strategy | 25 |
| Support for People and Jobs — Financial Support for Indigenous Small- and Medium-Sized Enterprises | 10 |
| Support for People and Jobs — Connecting Links Program | 10 |
| Support for People and Jobs — COVID‑19 Energy Assistance Program – Small Business | 8 |
| Support for People and Jobs — Digital Main Street Platform | 8 |
| Support for People and Jobs — Support Food Rescue Organizations | 5 |
| Support for People and Jobs — Other Technical Adjustments13 | 144 |
| Support for People and Jobs — Top-Up of Support for People and Jobs Fund14 | 3,000 |
| Total Support for People and Jobs | 5,510 |
| Top-Up of Standard Contingency Fund | 2,236 |
| Drawdown of the Standard Contingency Fund to Offset Spending | (815) |
| Drawdown of the COVID‑19 Health Contingency Fund to Offset Spending | (894) |
| Drawdown of the Support for People and Jobs Fund | (1,881) |
| Spending Accommodated Through Current Fiscal Framework15 | (459) |
| Total Net Program Expense Changes Since the March 2020 Economic and Fiscal Update | 13,115 |
| Interest on Debt Change | (741) |
| Total Expense Changes Since the March 2020 Economic and Fiscal Update | 12,374 |
[1], [2], [3], [5], [7], [9], [10], [12], [14] Full or partial funding attributed to increase in Ontario’s Updated Action Plan. Expense change not offset by any funding made available as part of Ontario’s Action Plan: Responding to COVID‑19 announced on March 25, 2020.
[4] Funding for local public health units of $100 million was announced as part of the March 2020 Economic and Fiscal Update.
[6], [13] Other technical adjustments includes inter- and intra-ministry transfers for initiatives announced as part of the March 2020 Economic and Fiscal Update.
[8] Municipal and Transit Support includes $148 million for the Social Services Relief Fund as part of the March 2020 Economic and Fiscal Update.
[11] Off-Peak Time-of-Use Electricity Rate includes $120 million to temporarily lower electricity prices to May 7, 2020 as part of the March 2020 Economic and Fiscal Update.
[15] Includes inter- and intra-ministry transfers for initiatives announced as part of the March 2020 Economic and Fiscal Update.
Note: Numbers may not add due to rounding.
Program expense update
The outlook for program expense in 2020–21 is projected to be $174.2 billion, an increase of approximately $13.1 billion compared to the March 2020 Economic and Fiscal Update.
Key changes to program expense projections include:
- Temporary Pandemic Pay: Supporting stability in key sectors during the pandemic by providing a temporary pay increase of $4 per hour for more than 375,000 eligible workers for work performed from April 24, 2020 to August 13, 2020. Together with the federal government, Ontario will invest over $1.5 billion in temporary pandemic pay;
- Funding for Municipalities and Transit: Ontario, in partnership with the federal government, has announced up to $4 billion in one-time assistance for municipalities and transit systems, under the Safe Restart Agreement; and
- Additional prudence totalling almost $9.6 billion has been allocated to the standard Contingency Fund, the COVID‑19 Health Contingency Fund and the Support for People and Jobs Fund to ensure that additional resources are available during the fight against COVID‑19 .
As Ontario undertakes a stage-by-stage approach to restarting the economy, protecting people’s health remains the government’s top priority and an essential aspect of the province’s economic recovery. Since releasing the Action Plan, the government has committed even more resources to bolster health care and support frontline workers. Key investments and initiatives include:
- Funding of $610 million for the purchase of personal protective equipment and other critical supplies;
- $424 million provincial contribution to keep vulnerable people in Ontario safe and to recognize the efforts of eligible frontline health care workers with temporary pandemic pay;
- $53 million to ensure vulnerable people continue to have access to prescription medication during the pandemic;
- $50 million to the Ontario Together Fund to help businesses provide innovative solutions or retool their operations to manufacture essential medical supplies and equipment to help stop the spread of COVID‑19;
- $15 million to support the design and implementation of the new Ontario Health Data Platform. This data platform provides recognized researchers and health system partners with access to anonymized health data that will allow them to better detect, plan and respond to COVID‑19;
- $15 million in provincial support for 110 municipalities across the province towards the enhanced cleaning of transit systems;
- $14 million in funding to provide additional community-based mental health and addictions services for people in Ontario with mental health needs;
- $12 million to provide virtual mental health supports, including services to support frontline health care workers; and
- To ensure that the resources are in place to support the health of the people of Ontario, the COVID‑19 Health Contingency Fund has been increased by $4.3 billion.
Since releasing the Action Plan, the government has committed even more resources to support people and protect jobs through the crisis and in the long term. Key new investments and initiatives since the Action Plan include:
- Up to $4 billion for municipalities and transit systems to provide one-time assistance, in partnership with the federal government, to help local governments address budget shortfalls related to COVID‑19 and maintain the critical services people rely on every day;
- $340 million to provide temporary immediate relief for industrial and commercial electricity consumers that do not participate in the Regulated Price Plan by deferring a portion of Global Adjustment charges, which is expected to be recovered over a 12-month period beginning in January 2021;
- $241 million in funding committed by the Ontario Government to partner with the federal government in order to make available over $900 million in urgent relief to small businesses and their landlords through a new program, Canada Emergency Commercial Rent Assistance;
- An increase of $56 million for a total of $176 million, to provide to May 31, 2020 the off-peak price of electricity for 24 hours a day for residential, farm and small business time-of-use customers;
- $50 million to increase the government’s contribution to the Risk Management Program for a total contribution of $150 million annually. This funding supports farmers with unforeseen challenges such as fluctuations in market prices or production costs;
- $25 million to ensure Ontario’s food supply chain remains strong and ready to recover, including up to $15 million to enhance health and safety measures on farms and in food processing facilities, and up to $10 million in emergency assistance for beef and hog farmers;
- $10 million to provide financial support for Indigenous small- and medium-sized enterprises experiencing reduced or no revenue due to COVID‑19;
- $10 million for the Connecting Links program, for a total investment of $40 million in 2020–21, to support municipalities by helping them build, repair or replace municipal roads and bridges that connect two ends of a provincial highway through a community or to a border crossing;
- $8 million for the COVID‑19 Energy Assistance Program for Small Business to provide support to businesses struggling with bill payments as a result of the outbreak;
- $8 million to help small businesses reach more customers through the Digital Main Street platform. This program, in partnership with the federal government, will help up to 22,900 Ontario businesses create and enhance their online presence and generate jobs for more than 1,400 students;
- $5 million to support food rescue organizations to purchase critical infrastructure to ensure food is safely redistributed to those in need and help prevent nutritious food from ending up in landfills; and
- The Support for People and Jobs Fund has been increased by $3 billion to ensure that Ontario has the resources to continue responding to the needs of the people of Ontario through the economic reopening and recovery phases.
The standard Contingency Fund has been increased by $2.2 billion to protect the health and safety of the people of Ontario during the COVID‑19 outbreak.
Interest on debt expense update
Interest on debt (IOD) expense is projected to be $12.5 billion, a savings of $741 million relative to the forecast of $13.2 billion in the March 2020 Economic and Fiscal Update. Despite a $17.0 billion increase in the funding requirement since then, the IOD forecast has decreased because interest rates have remained substantially lower than expected at that time and are projected to remain lower over the balance of the fiscal year.
Fiscal prudence
The Fiscal Sustainability, Transparency and Accountability Act, 2019, requires Ontario’s fiscal plan to incorporate prudence in the form of a reserve to protect the fiscal outlook against unforeseen adverse changes in the Province’s revenue and expense, including those resulting from changes in Ontario’s economic performance. In the March 2020 Economic and Fiscal Update, the government included additional prudence above historic levels, which provides greater fiscal flexibility to respond to changing global circumstances. The reserve remains set at $2.5 billion in 2020–21. This level of the reserve is the highest for a plan year since the Province first established reserves in fiscal plans in 1996.
Building on the March 2020 Economic and Fiscal Update, as part of the 2020–21 First Quarter Finances the government has included one-time top-ups to the various dedicated contingency funds for any emerging needs to support the Province’s ongoing efforts against the pandemic. After accounting for the draws from these funds reported in the 2020–21 First Quarter Finances, the net position of the dedicated COVID‑19 Health Contingency Fund is projected to be $4.5 billion and the Support for People and Jobs Fund is currently projected at $3.1 billion in 2020–21. Standard Contingency Funds are also maintained to help mitigate expense risks — for example, in cases where health and safety may be compromised — that may otherwise adversely affect Ontario’s fiscal performance. The remaining standard Contingency Fund is currently projected at $2.7 billion for 2020–21. Any unused contingency funds at year end will go towards reducing the Province’s net debt position.
The COVID‑19 pandemic has reinforced the government’s commitment to managing the Province’s finances in a responsible and sustainable manner. This is reflected in the government’s approach to provide targeted time-limited funding to address the extraordinary needs of the health care system and to support people and jobs during this unprecedented global pandemic.
Section B: Ontario’s recent economic performance and outlook
Recent performance
The COVID‑19 pandemic has resulted in significant and unprecedented impacts on economies around the world. In the United States, Ontario’s largest trading partner, real gross domestic product (GDP) declined 9.5 per cent in the second quarter of 2020 after declining 1.3 per cent in the first quarter of 2020.
Ontario’s real GDP declined 2.0 per cent in the first quarter of 2020, largely reflecting the pandemic’s economic impact over the two-week period at the end of March. Household consumption spending (-2.0 per cent), exports (-3.1 per cent) and machinery and equipment investment (-2.5 per cent) all declined in the quarter.
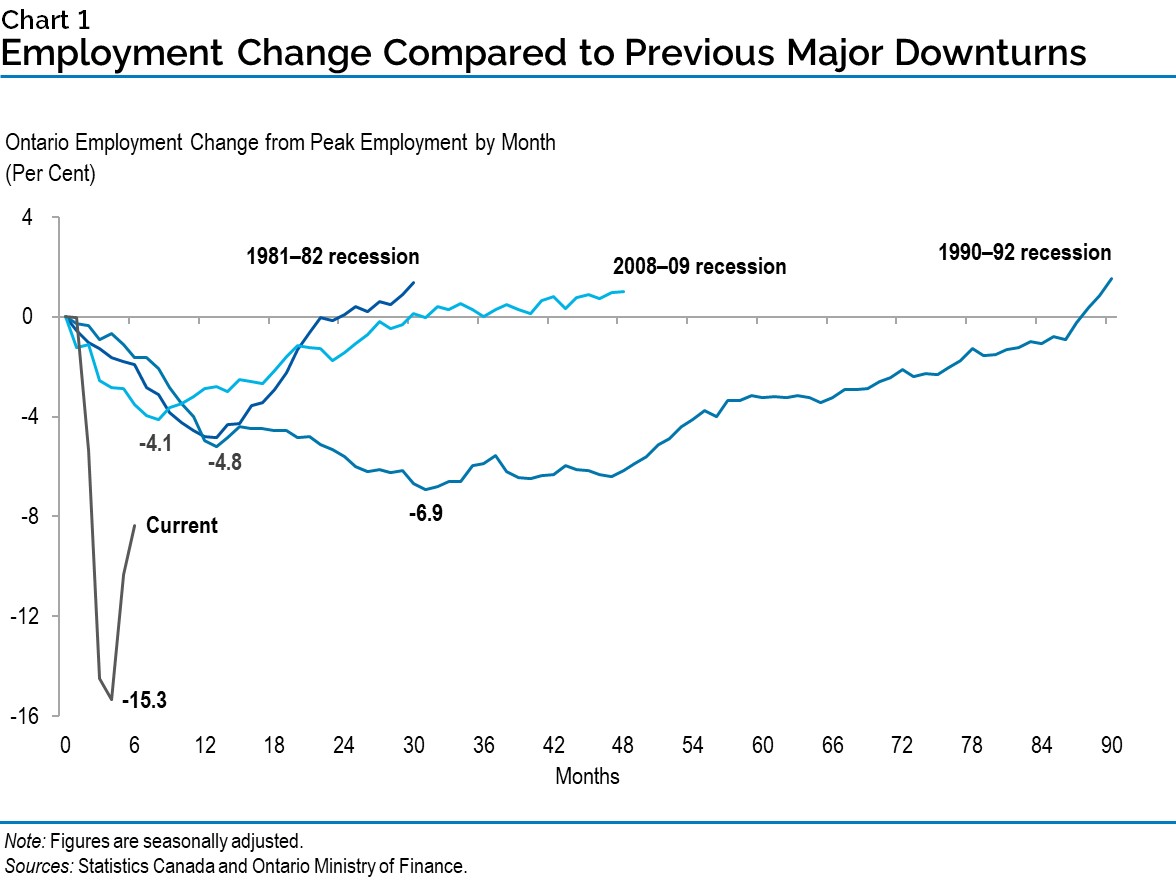
Between February and May, Ontario’s employment declined by nearly 1.2 million net jobs (-15.3 per cent) and the unemployment rate rose to 13.6 per cent. The employment decline from February to May was significantly larger than the declines recorded in past recessions due to the unprecedented shutdown in economic activity. Several key monthly consumer and business economic indicators, including retail sales, manufacturing sales and home resales, also declined sharply in March and April.
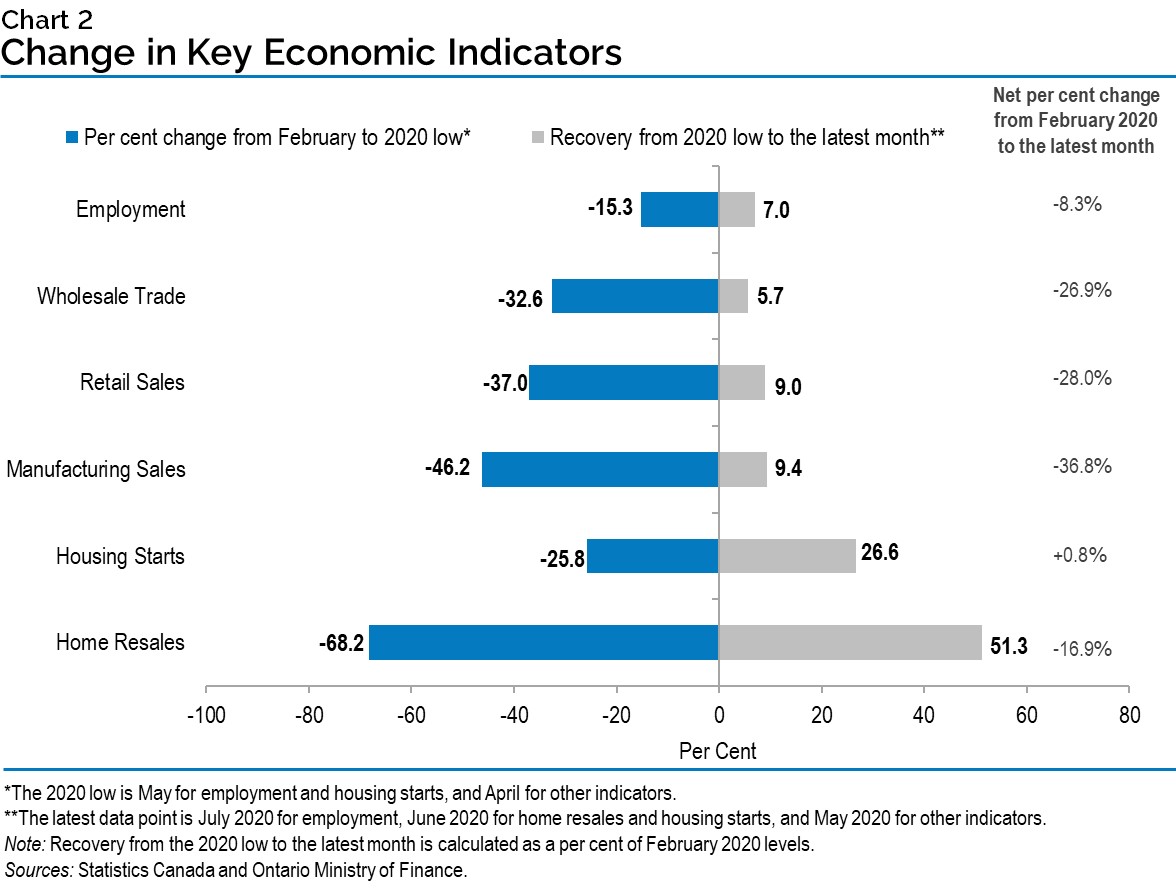
Despite unprecedented risk and uncertainty associated with the global pandemic, recent signs suggest that economic activity has started to recover. In June and July, Ontario’s employment increased by 528,600 net jobs and the unemployment rate decreased to 11.3 per cent. Despite these gains, employment in July was 627,900, or 8.3 per cent below the February 2020 level. Home resales in the province rose 56.6 per cent in May and 67.0 per cent in June, after declining for two consecutive months. Ontario manufacturing sales increased 17.5 per cent in May, while retail sales rose 14.2 per cent, after both had declined for two consecutive months.
Economic outlook
The COVID‑19 outbreak has negatively impacted the near-term global and Ontario economic growth outlook. The International Monetary Fund currently projects that global real GDP will decline by 4.9 per cent in 2020, a significant revision to the 3.3 per cent increase projected in January 2020. Global economic growth is projected to resume in the second half of 2020 and into 2021, with real GDP projected to rise by 5.4 per cent in 2021. Private-sector forecasters, on average, project U.S. real GDP to decline 5.5 per cent in 2020 before increasing by 4.0 per cent in 2021.
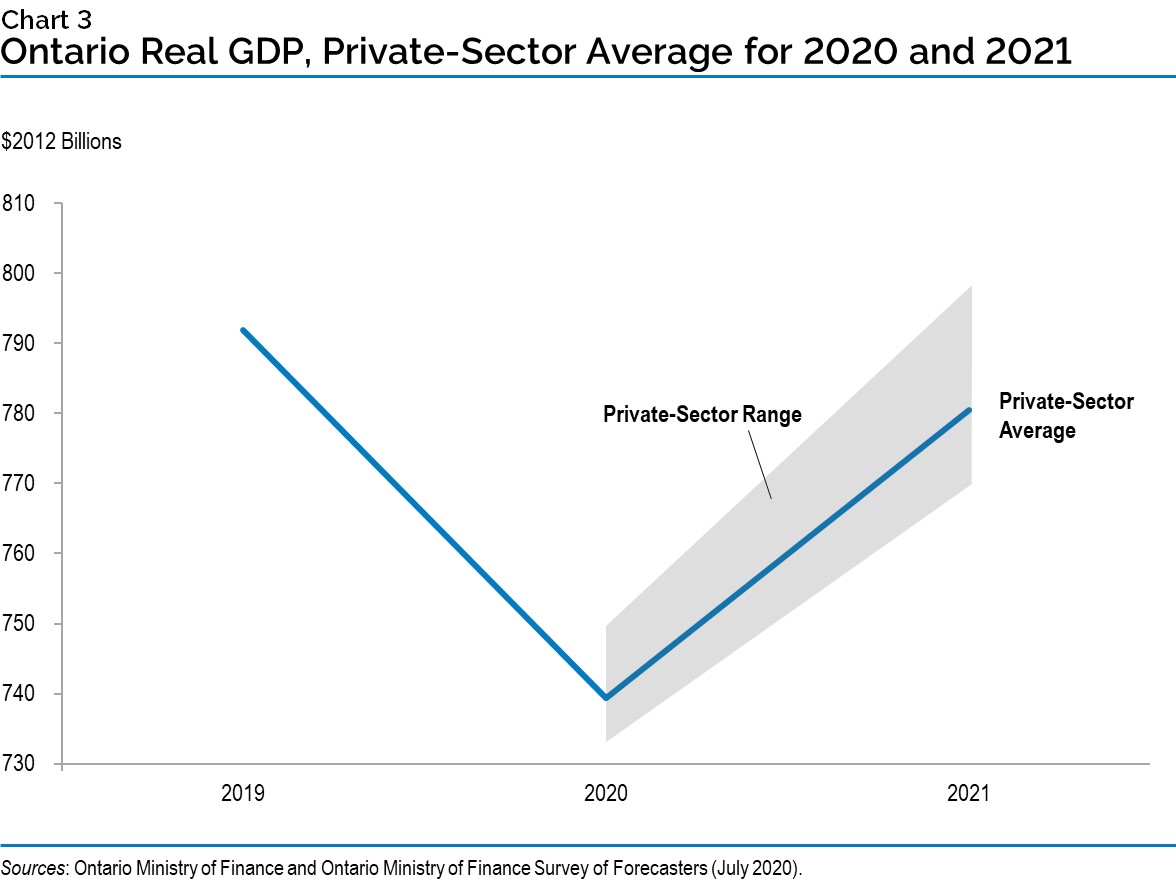
Private-sector forecasters, on average, project that Ontario real GDP will decline by 6.6 per cent in 2020. This would be the largest annual real GDP decline on record.
| Item | 2020 | 2021 |
|---|---|---|
| BMO Capital Markets (July) | (6.0) | 6.0 |
| Central 1 Credit Union (June) | (7.4) | 5.0 |
| CIBC Capital Markets (June) | (7.4) | 5.9 |
| The Conference Board of Canada (July) | (7.6) | 7.0 |
| Desjardins Group (June) | (5.5) | 5.0 |
| Laurentian Bank Securities (July) | (7.2) | 6.5 |
| National Bank of Canada (July) | (7.5) | 5.3 |
| Quantitative Economic Decisions Inc. (July) | (6.9) | 4.5 |
| Royal Bank of Canada (June) | (5.8) | 4.2 |
| Scotiabank (June) | (7.0) | 6.6 |
| Stokes Economics (July) | (6.2) | 4.6 |
| TD Bank Group (June) | (6.2) | 5.1 |
| University of Toronto (July) | (5.4) | 6.5 |
| Private-Sector Survey Average | (6.6) | 5.6 |
| Ontario’s Planning Assumption | (6.7) | 5.5 |
Sources: Ontario Ministry of Finance Survey of Forecasters (July 31, 2020) and Ontario Ministry of Finance.
Consistent with the real GDP scenario based on current private-sector forecasts, other key components of the economic outlook have been revised as part of updating the 2020–21 fiscal outlook. The net operating surplus of corporations is projected to decline 14.1 per cent in 2020. Compensation of employees is projected to decrease 2.5 per cent in 2020. Household consumption spending is projected to decrease by 6.0 per cent in 2020.
The following table provides details of the Ontario Ministry of Finance’s current economic scenario for the 2020 to 2021 period and the corresponding planning assumptions included in the March 2020 Economic and Fiscal Update.
| Item | 2019a | 2020p | 2021p |
|---|---|---|---|
| Real Gross Domestic Product | 1.7 | (6.7) | 5.5 |
| Nominal Gross Domestic Product | 3.9 | (5.3) | 7.1 |
| Compensation of Employees | 4.2 | (2.5) | 5.5 |
| Net Operating Surplus - Corporations | 2.6 | (14.1) | 9.3 |
| Nominal Household Consumption | 3.6 | (6.0) | 8.3 |
a = actual; e = estimate; p = Ontario Ministry of Finance planning projection
| Item | 2019e | 2020p | 2021p |
|---|---|---|---|
| Real Gross Domestic Product | 1.6 | 0.0 | 2.0 |
| Nominal Gross Domestic Product | 3.9 | 2.0 | 4.0 |
| Compensation of Employees | 4.1 | 2.7 | 4.3 |
| Net Operating Surplus - Corporations | 2.7 | (2.4) | 8.3 |
| Nominal Household Consumption | 3.6 | 2.4 | 4.1 |
Continued economic uncertainty and risk
Significant uncertainty around the economic forecast remains, mainly related to the impacts of the COVID‑19 pandemic in Ontario, Canada and globally, including the following factors:
- The pace of recovery cannot be predicted with certainty, even as public health restrictions are eased, and Ontario’s economy reopens;
- Many countries, including the United States, continue to face high numbers of infections and significant economic disruptions, which could impact Ontario’s economy through exports, supply chains and business and consumer confidence;
- Heightened economic uncertainty could weigh on consumer and business confidence, and investment and hiring decisions. Additionally, economic activity could continue to be supressed below normal levels due to ongoing public health concerns; and
- Other jurisdictions have experienced resurgences in COVID‑19 infection rates, as public health measures have been relaxed and economic activity expanded. The risk of resurgent infections further heightens economic uncertainty and could impact the pace of recovery.
As shown in the next chart, the current range of private-sector forecasts for 2020 and 2021 Ontario real GDP growth is unusually wide, reflecting the high level of uncertainty.
Section C: Details of Ontario’s finances
| Item | 2020–21 March 2020 Update |
2020–21 Current Outlook |
2020–21 In-Year Change |
|---|---|---|---|
| Taxation Revenue — Personal Income Tax | 37,316 | 36,901 | (415) |
| Taxation Revenue — Sales Tax | 29,078 | 24,924 | (4,154) |
| Taxation Revenue — Corporations Tax | 15,170 | 9,941 | (5,229) |
| Taxation Revenue — Education Property Tax | 6,270 | 6,270 | – |
| Taxation Revenue — Employer Health Tax | 6,823 | 6,436 | (387) |
| Taxation Revenue — Ontario Health Premium | 4,089 | 4,007 | (82) |
| Taxation Revenue — Gasoline Tax | 2,733 | 2,379 | (354) |
| Taxation Revenue — Land Transfer Tax | 3,029 | 2,964 | (65) |
| Taxation Revenue — Tobacco Tax | 1,108 | 1,108 | – |
| Taxation Revenue — Fuel Tax | 766 | 672 | (94) |
| Taxation Revenue — Beer, Wine and Spirits Taxes | 585 | 585 | – |
| Taxation Revenue — Ontario Portion of the Federal Cannabis Excise Duty | 155 | 145 | (10) |
| Taxation Revenue — Electricity Payments in Lieu of Taxes | 505 | 505 | – |
| Taxation Revenue — Other Taxes | 561 | 561 | – |
| Taxation Revenue — Total | 108,189 | 97,398 | (10,791) |
| Government of Canada — Canada Health Transfer | 16,252 | 16,252 | – |
| Government of Canada — Canada Social Transfer | 5,832 | 5,832 | – |
| Government of Canada — Equalization | – | – | – |
| Government of Canada — Infrastructure Programs | 1,013 | 1,013 | – |
| Government of Canada — Labour Market Programs | 1,092 | 1,091 | (1) |
| Government of Canada — Social Housing Agreement | 331 | 331 | – |
| Government of Canada — Other Federal Payments | 1,418 | 7,663 | 6,245 |
| Government of Canada — Direct Transfers to Broader Public-Sector Organizations | 407 | 407 | – |
| Government of Canada — Total | 26,345 | 32,589 | 6,244 |
| Income from Government Business Enterprises — Ontario Lottery and Gaming Corporation | 809 | 600 | (209) |
| Income from Government Business Enterprises — Liquor Control Board of Ontario | 2,394 | 2,394 | – |
| Income from Government Business Enterprises — Ontario Cannabis Store | 80 | 80 | – |
| Income from Government Business Enterprises — Ontario Power Generation Inc./Hydro One Ltd. | 862 | 862 | – |
| Income from Government Business Enterprises — Total | 4,145 | 3,936 | (209) |
| Other Non-Tax Revenue — Reimbursements | 1,029 | 960 | (69) |
| Other Non-Tax Revenue — Vehicle and Driver Registration Fees | 2,072 | 2,061 | (11) |
| Other Non-Tax Revenue — Power Supply Contract Recoveries | 94 | 94 | – |
| Other Non-Tax Revenue — Sales and Rentals | 1,621 | 1,045 | (576) |
| Other Non-Tax Revenue — Other Fees and Licences | 1,284 | 1,105 | (179) |
| Other Non-Tax Revenue — Net Reduction of Power Purchase Contracts | 28 | 28 | – |
| Other Non-Tax Revenue — Royalties | 276 | 279 | 3 |
| Other Non-Tax Revenue — Fees, Donations and Other Revenues from Hospitals, School Boards and Colleges | 9,740 | 9,740 | – |
| Other Non-Tax Revenue — Miscellaneous Other Non-Tax Revenue | 1,443 | 1,377 | (66) |
| Other Non-Tax Revenue — Total | 17,587 | 16,689 | (898) |
| Total Revenue | 156,266 | 150,612 | (5,654) |
| Note: Numbers may not add due to rounding. |
| Ministry Expense | 2020–21 March 2020 Update |
2020–21 Current Outlook |
2020–21 In-Year Change |
|---|---|---|---|
| Agriculture, Food and Rural Affairs (Base) | 314.8 | 314.8 | – |
| Agriculture, Food and Rural Affairs — Federal–Provincial Infrastructure Programs | 104.0 | 104.0 | – |
| Agriculture, Food and Rural Affairs — Municipal Infrastructure Program Investments2 | 10.0 | 10.0 | – |
| Agriculture, Food and Rural Affairs — Demand-Driven Risk Management and Time-Limited Programs | 359.6 | 435.1 | 75.5 |
| Agriculture, Food and Rural Affairs (Total) | 788.4 | 863.9 | 75.5 |
| Attorney General (Total) | 1,682.2 | 1,682.2 | – |
| Board of Internal Economy (Total) | 280.8 | 280.8 | – |
| Children, Community and Social Services (Total) | 17,697.2 | 17,762.4 | 65.2 |
| Colleges and Universities (Base) | 9,392.7 | 9,392.7 | – |
| Colleges and Universities — Student Financial Assistance | 1,274.4 | 1,274.4 | – |
| Colleges and Universities3 (Total) | 10,667.1 | 10,667.1 | – |
| Economic Development, Job Creation and Trade (Base) | 368.8 | 368.8 | – |
| Economic Development, Job Creation and Trade — Time-Limited Investments | 209.0 | 266.7 | 57.7 |
| Economic Development, Job Creation and Trade (Total) | 577.8 | 635.5 | 57.7 |
| Education (Base) | 30,272.4 | 30,272.4 | – |
| Education — Teachers’ Pension Plan4 | 1,620.7 | 1,620.7 | – |
| Education (Total) | 31,893.2 | 31,893.2 | – |
| Energy, Northern Development and Mines (Base) | 1,049.4 | 1,049.4 | – |
| Energy, Northern Development and Mines — Electricity Cost Relief Programs | 5,602.6 | 6,135.6 | 533.0 |
| Energy, Northern Development and Mines (Total) | 6,652.0 | 7,185.0 | 533.0 |
| Environment, Conservation and Parks (Total) | 656.9 | 661.4 | 4.5 |
| Executive Offices (Total) | 37.5 | 37.5 | – |
| Finance (Base) | 862.0 | 862.0 | – |
| Finance — Time-Limited Investments | – | 316.2 | 316.2 |
| Finance — Investment Management Corporation of Ontario5 | 161.1 | 161.1 | – |
| Finance — Ontario Municipal Partnership Fund | 501.9 | 501.9 | – |
| Finance — Power Supply Contract Costs | 94.1 | 94.1 | – |
| Finance — COVID‑19 Response: Support for People and Jobs Fund | 1,965.6 | 3,084.2 | 1,118.6 |
| Finance (Total) | 3,584.6 | 5,019.4 | 1,434.8 |
| Francophone Affairs (Total) | 6.1 | 6.1 | – |
| Government and Consumer Services (Base) | 641.1 | 641.1 | – |
| Government and Consumer Services — Realty | 1,024.4 | 1,024.4 | – |
| Government and Consumer Services (Total) | 1,665.6 | 1,665.6 | – |
| Health (Base) | 63,215.3 | 67,781.1 | 4,565.7 |
| Health — Safe Restart Agreement | – | 100.0 | 100.0 |
| Health (Total) | 63,215.3 | 67,881.1 | 4,665.7 |
| Heritage, Sport, Tourism and Culture Industries (Base) | 946.9 | 946.9 | – |
| Heritage, Sport, Tourism and Culture Industries — Ontario Cultural Media Tax Credits | 704.3 | 704.3 | – |
| Heritage, Sport, Tourism and Culture Industries6 (Total) | 1,651.3 | 1,651.3 | – |
| Indigenous Affairs (Base) | 82.2 | 82.2 | – |
| Indigenous Affairs — One-Time Investments including Settlements | – | 14.0 | 14.0 |
| Indigenous Affairs (Total) | 82.2 | 96.2 | 14.0 |
| Infrastructure (Base) | 221.8 | 221.8 | – |
| Infrastructure — Federal–Provincial Infrastructure Programs | 310.5 | 310.5 | – |
| Infrastructure — Waterfront Toronto Revitalization (Port Lands Flood Protection) | 128.4 | 128.4 | – |
| Infrastructure — Municipal Infrastructure Program Investments7 | 202.0 | 202.0 | – |
| Infrastructure (Total) | 862.6 | 862.6 | – |
| Labour, Training and Skills Development (Base) | 244.3 | 244.3 | – |
| Labour, Training and Skills Development — Ontario Apprenticeship Training Tax Credit8 | 21.5 | 21.5 | – |
| Labour, Training and Skills Development — Demand-Driven Employment and Training Programs | 1,027.7 | 1,027.7 | – |
| Labour, Training and Skills Development9 (Total) | 1,293.4 | 1,293.4 | – |
| Long-Term Care (Total) | 4,628.4 | 4,846.4 | 218.0 |
| Municipal Affairs and Housing (Base) | 481.7 | 481.7 | – |
| Municipal Affairs and Housing — Safe Restart Agreement | – | 1,900.0 | 1,900.0 |
| Municipal Affairs and Housing — Time-Limited Investments | 226.2 | 226.2 | – |
| Municipal Affairs and Housing — Social Housing Agreement – Payments to Service Managers | 315.2 | 315.2 | – |
| Municipal Affairs and Housing (Total) | 1,023.1 | 2,923.1 | 1,900.0 |
| Natural Resources and Forestry (Base) | 551.3 | 551.3 | – |
| Natural Resources and Forestry — Emergency Forest Firefighting | 100.0 | 100.0 | – |
| Natural Resources and Forestry (Total) | 651.3 | 651.3 | – |
| Seniors and Accessibility (Base) | 58.2 | 58.2 | – |
| Seniors and Accessibility — Time-Limited Investments | – | 28.4 | 28.4 |
| Seniors and Accessibility (Total) | 58.2 | 86.6 | 28.4 |
| Solicitor General (Total) | 2,849.5 | 2,849.5 | – |
| Transportation (Base) | 4,944.6 | 4,970.1 | 25.5 |
| Transportation — Safe Restart Agreement | – | 2,000.0 | 2,000.0 |
| Transportation — Federal–Provincial Infrastructure Programs | 640.0 | 640.0 | – |
| Transportation (Total) | 5,584.6 | 7,610.2 | 2,025.5 |
| Treasury Board Secretariat (Base) | 298.9 | 298.9 | – |
| Treasury Board Secretariat — Temporary Pandemic Pay | – | 671.8 | 671.8 |
| Treasury Board Secretariat — Employee and Pensioner Benefits10 | 1,389.0 | 1,389.0 | – |
| Treasury Board Secretariat — Operating Contingency Fund | 1,155.0 | 2,576.1 | 1,421.1 |
| Treasury Board Secretariat — Capital Contingency Fund | 145.0 | 145.0 | – |
| Treasury Board Secretariat (Total) | 2,987.9 | 5,080.8 | 2,092.9 |
| Interest on Debt11 | 13,199.3 | 12,458.3 | (741.0) |
| Total Expense | 174,276.4 | 186,650.6 | 12,374.2 |
[1], [3], [6], [9] Numbers reflect current ministry structure.
[2], [7] Municipal infrastructure program funding transferring from the Ministry of Agriculture, Food and Rural Affairs to the Ministry of Infrastructure in 2020–21.
[4], [10] Numbers reflect the pension expense that was calculated based on recommendations of the Independent Financial Commission of Inquiry, as described in Note 19 to the Consolidated Financial Statements in Public Accounts of Ontario 2017–2018.
[5] Based on the requirements of Public Sector Accounting Standards, the Province consolidated the Investment Management Corporation of Ontario into the Ministry of Finance.
[8] Eliminated for eligible apprenticeship programs that commenced on or after November 15, 2017.
[11] Interest on debt is net of interest capitalized during construction of tangible capital assets of $234 million in 2020–21.
Note: Numbers may not add due to rounding.
| Sector | 2020–21 Current Outlook Investment in Capital Assets1 |
2020–21 Current Outlook Transfers and Other Infrastructure Expenditures2 |
2020–21 Current Outlook Total Infrastructure Expenditures |
|---|---|---|---|
| Transportation — Transit | 3,738 | 1,095 | 4,833 |
| Transportation — Provincial Highways | 2,452 | 155 | 2,607 |
| Transportation — Other Transportation, Property and Planning | 131 | 82 | 213 |
| Health — Hospitals | 2,061 | 3 | 2,064 |
| Health — Other Health | 74 | 169 | 243 |
| Education | 2,241 | 10 | 2,251 |
| Postsecondary Education — Colleges and Other | 472 | 62 | 534 |
| Postsecondary Education — Universities | – | 100 | 100 |
| Social | 23 | 140 | 163 |
| Justice | 519 | 96 | 615 |
| Other Sectors3 | 989 | 1,039 | 2,028 |
| Total Infrastructure Expenditures | 12,701 | 2,951 | 15,652 |
| Less: Other Partner Funding4 | 2,136 | – | 2,136 |
| Total5 | 10,566 | 2,951 | 13,516 |
[1] Includes $234 million in interest capitalized during construction.
[2] Includes transfers to municipalities, universities and non-consolidated agencies.
[3] Includes government administration, natural resources and the culture and tourism industries.
[4] Other Partner Funding refers to third-party investments primarily in hospitals, colleges and schools.
[5] Includes Federal/Municipal contributions to provincial infrastructure investments.
Note: Numbers may not add due to rounding.
| Item | 2016–17 | 2017–18 | Actual 2018–19 |
Interim3 2019–20 |
Current Outlook 2020–21 |
|---|---|---|---|---|---|
| Revenue | 140,734 | 150,594 | 153,700 | 156,731 | 150,612 |
| Expense — Programs | 131,460 | 142,363 | 148,751 | 153,115 | 174,192 |
| Expense — Interest on Debt4 | 11,709 | 11,903 | 12,384 | 12,599 | 12,458 |
| Total Expense | 143,169 | 154,266 | 161,135 | 165,714 | 186,651 |
| Reserve | – | – | – | 200 | 2,500 |
| Surplus/(Deficit) | (2,435) | (3,672) | (7,435) | (9,184) | (38,538) |
| Net Debt | 314,077 | 323,834 | 338,496 | 355,160 | 397,203 |
| Accumulated Deficit | 205,939 | 209,023 | 216,642 | 225,626 | 261,664 |
| Gross Domestic Product (GDP) at Market Prices | 790,749 | 826,945 | 857,384 | 891,066 | 843,840 |
| Primary Household Income | 520,486 | 543,084 | 567,086 | 590,678 | 570,595 |
| Population — July (000s)5 | 13,875 | 14,073 | 14,319 | 14,567 | 14,831 |
| Net Debt Per Capita (dollars) | 22,636 | 23,012 | 23,640 | 24,382 | 26,782 |
| Household Income Per Capita (dollars) | 37,511 | 38,592 | 39,605 | 40,550 | 38,473 |
| Net Debt as a Per Cent of Revenue | 223.2% | 215.0% | 220.2% | 226.6% | 263.7% |
| Interest on Debt as a Per Cent of Revenue | 8.3% | 7.9% | 8.1% | 8.0% | 8.3% |
| Net Debt as a Per Cent of GDP | 39.7% | 39.2% | 39.5% | 39.9% | 47.1% |
| Accumulated Deficit as a Per Cent of GDP | 26.0% | 25.3% | 25.3% | 25.3% | 31.0% |
[1] Amounts reflect a change in pension expense that was calculated based on recommendations of the Independent Financial Commission of Inquiry, as described in Note 19 to the Consolidated Financial Statements, in Public Accounts of Ontario 2017–2018. Amounts for net debt and accumulated deficit also reflect this change.
[2] Revenues and expenses have been restated to reflect the following fiscally neutral changes: i) revised presentation of education property taxes to be included in the taxation revenues; ii) reclassification of certain Government Business Enterprises to other government organizations; iii) reclassification of a number of tax measures that provide a financial benefit through the tax system to be reported as expenses; and iv) change in presentation of third-party revenue for hospitals, school boards and colleges to be reported as revenue.
[3] Interim represents the March 2020 Economic and Fiscal Update projection for the 2019–20 fiscal year.
[4] Interest on debt is net of interest capitalized during construction of tangible capital assets of $159 million in 2016–17, $157 million in 2017–18, $175 million in 2018–19, $476 million in 2019–20 and $234 million in 2020–21.
[5] Population figures are for July 1 of the fiscal year indicated (i.e. for 2016–17, the population on July 1, 2016 is shown).
Note: Numbers may not add due to rounding.
Sources: Statistics Canada, Ontario Ministry of Finance and Treasury Board Secretariat.
Section D: Ontario’s 2020–21 borrowing program
The Province’s 2020–21 funding requirements are projected to increase by $17.0 billion relative to the March 2020 Economic and Fiscal Update, with a resulting increase in long-term public borrowing of $8.5 billion.
| Item | 2020–21 March 2020 Update |
2020–21 Current Outlook |
2020–21 In-Year Change |
|---|---|---|---|
| Deficit/(Surplus) | 20.5 | 38.5 | 18.0 |
| Investment in Capital Assets | 10.4 | 10.4 | – |
| Non-Cash Adjustments | (9.2) | (9.2) | – |
| Loans to Infrastructure Ontario | 0.3 | (0.0) | (0.3) |
| Other Net Loans/Investments | 1.2 | 0.5 | (0.7) |
| Debt Maturities/Redemptions | 26.6 | 26.6 | – |
| Total Funding Requirement | 49.7 | 66.7 | 17.0 |
| Decrease/(Increase) in Short-Term Borrowing | (2.0) | (7.0) | (5.0) |
| Increase/(Decrease) in Cash and Cash Equivalents | – | – | – |
| Pre-Borrowing from 2019–20 | (4.1) | (7.6) | (3.5) |
| Total Long-Term Public Borrowing | 43.6 | 52.1 | 8.5 |
Note: Numbers may not add due to rounding.
Source: Ontario Financing Authority.
Ontario sold a record $21.9 billion in long-term debt in the first quarter of this fiscal year, with an average term of over 10 years. This has ensured that the Province’s solvency has been safeguarded with adequate liquidity to meet any unforeseen economic or public health circumstances.
As of August 12, 2020, the Province has completed $23.6 billion in long term borrowing. Approximately 76 per cent of this year’s borrowing has been completed in Canadian dollars, which included a $3.6 billion re-opening of the 10-year benchmark bond on April 14, 2020, the largest domestic provincial new issue ever launched. The remainder was issued in U.S. dollars, Pounds sterling and Euros.
2020–21 Long-term borrowing
| Item | ($ Billions) |
|---|---|
| Canadian Dollar Issues | 17.9 |
| Foreign Currency Issues | 5.8 |
| Total | 23.6 |
Note: Numbers may not add due to rounding.
Source: Ontario Financing Authority.
The Bank of Canada’s introduction of its Provincial Money Market Purchase (PMMP) program and the Provincial Bond Purchase Program (PBPP) have helped infuse liquidity into the Canadian provincial debt markets.
These two Bank of Canada facilities were introduced after the Province determined its borrowing program in the March 2020 Economic and Fiscal Update. By keeping the publicly auctioned amounts of Treasury Bills unchanged from the plan released in March, the Province is now able to raise an additional $5 billion in short term borrowing by having the Bank of Canada purchase Ontario Treasury Bills under the PMMP facility.
Unlike the PMMP, the PBPP facility does not make primary market purchases of provincial bonds. However, it is expected the amount of secondary market purchases of Ontario bonds under that program will be far in excess of the $8.5 billion increase in the Province’s Long Term Public Borrowing requirement since the March 2020 Economic and Fiscal Update.
Ministry of Finance
For general inquiries regarding the 2020–21 First Quarter Finances, please call:
Toll-free English and French inquiries:
Teletypewriter
© Queen’s Printer for Ontario, 2020
Chart descriptions
Graphic: Ontario’s Updated Action Plan: Responding to covid 19
- Support for Health Care $7.7 Billion plus
- Support for People and Jobs $11.0 Billion
- Total Direct Support $18.7 Billion
- Support for People and Businesses to Improve Cash Flow $11.3 Billion
- $30.0 Billion in Total Supports
Chart 1: Employment change compared to previous major downturns
The line chart shows the cumulative percentage change in employment from peak employment by month during COVID‑19 and for the previous three recessions in 1981–82, 1990–92 and 2008–09. During the current downturn, employment hit a low point of -15.3 per cent from peak employment in month 4 (May 2020) and increased to -8.3 per cent in month 6 (July 2020). During the 1981–82 recession, employment hit a low point of -4.8 per cent from peak employment in month 13 and returned to peak employment in month 24. During the 1990–92 recession, employment hit a low point of -6.9 per cent from peak employment in month 31 and returned to peak employment in month 88. During the 2008–09 recession, employment hit a low point of -4.1 per cent from peak employment in month 8 and returned to peak employment in month 30.
Chart 2: Change in key economic indicators
The horizontal bar chart shows per cent change for key economic indicators, including employment, wholesale trade, retail sales, manufacturing sales, housing starts and home resales. A per cent change from February to the 2020 low is reported for each indicator, with the 2020 low being May for employment and housing starts and April for all the other indicators. Also shown for each indicator is the per cent change from the 2020 low to the latest month, with July 2020 being the latest month for employment, June 2020 for Home Resales and housing starts and May 2020 for all the other indicators.
The per cent change from February to the 2020 low are as follows: employment (-15.3 per cent), wholesale trade (-32.6 per cent), retail sales (-37.0 per cent), manufacturing sales (-46.2 per cent), housing starts (-25.8 per cent) and home resales (-68.2 per cent).
The per cent change from the 2020 low to the latest month are as follows: employment (+7.0 per cent), wholesale trade (+5.7 per cent), retail sales (+9.0 per cent), manufacturing sales (+9.4 per cent), housing starts (+26.6 per cent) and home resales (+51.3 per cent).
Chart 3: Ontario real GDP, private-sector average for 2020-21
The chart shows the level of Ontario real GDP (2012 dollars) in 2019 and projected levels for 2020 and 2021 by private-sector forecasters. Ontario real GDP was $792 billion and is projected, on average, to decline to $744 billion in 2020 before rising to $782 billion in 2021. There is a wide range for the 2020 and 2021 forecasts. Real GDP is not expected to surpass 2019 levels in 2020 by any forecaster while some forecasters project the level to surpass the 2019 level in 2021 and some to remain below the 2019 level.
Footnotes
- footnote[1] Back to paragraph The 2020–21 First Quarter Finances’ figures referenced are the amount allocated and not the amount of spending to date.
- footnote[2] Back to paragraph Including in-kind federal spending, the agreement will provide Ontarians with over $7 billion in support.
- footnote[3] Back to paragraph U.S. projection is from the Blue Chip Economic Indicators’ July 2020 publication.
- footnote[4] Back to paragraph Real Gross Domestic Product data by province is available from Statistics Canada commencing in 1981.