2020-21 Third Quarter Finances
February 2021
The Third Quarter Finances report contains information about Ontario’s 2020–21 fiscal outlook as of December 31, 2020 as well as updates to February 5, 2021.
Highlights
- The government continues the fight against the COVID‑19 pandemic by making $2.6 billion in additional investments since the 2020 Budget to protect and support people’s health and economic well-being.
- The COVID‑19 pandemic has resulted in unprecedented impacts on economies around the world. Recent key economic indicators show that a significant economic rebound has occurred since last spring, but the global economy has not fully recovered to its pre-pandemic level. The government continues to support people and employers through this challenging period.
- Ontario’s real gross domestic product (GDP) increased 9.4 per cent in the third quarter of 2020, following two consecutive quarterly declines. Real GDP in the quarter was 5.7 per cent below the 2019 Q4 level.
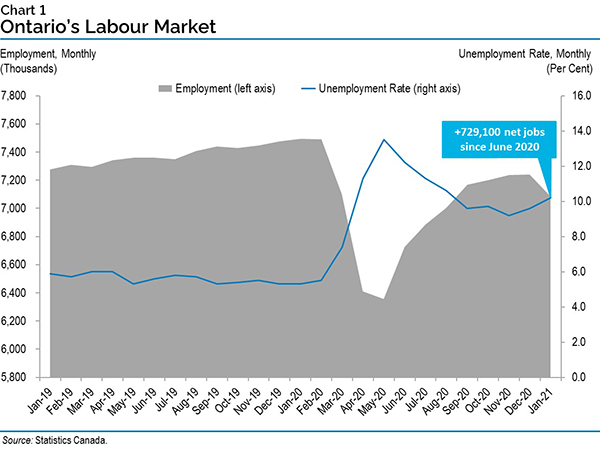
- Between May 2020 and January 2021, Ontario employment has risen by 729,100 net jobs, but remained 405,600 (−5.4 per cent) below its pre-pandemic level.
- As of the 2020–21 Third Quarter Finances, the government is projecting a deficit of $38.5 billion in 2020–21, unchanged from the outlook presented in the 2020 Budget.
- Revenues in 2020–21 are projected to be $151.7 billion, $0.6 billion higher than forecast in the 2020 Budget. The higher revenue forecast largely reflects stronger taxation revenues, attributable to a smaller economic decline in 2020 than the prudent planning assumptions in the 2020 Budget. The forecasts for Government of Canada transfers and net income from Government Business Enterprises are also higher, while other non-tax revenue is lower.
- Program expenses are projected to be $2.6 billion higher than forecast in the 2020 Budget, largely due to investments in hospitals, long-term care homes, and business support, primarily offset from existing contingencies.
- Since the 2020 Budget, the government has fully allocated all of the time-limited pandemic response funding and extraordinary contingencies of $13.3 billion in 2020–21. In light of this, and to help mitigate expense risks for the remainder of 2020–21, the standard Contingency Fund has been allocated an additional $2.1 billion for 2020–21, given the uncertain and unprecedented impact of the global pandemic.
- Interest on debt is projected to remain unchanged from the $12.5 billion forecast in the 2020 Budget.
- As of February 5, 2021, the Province has borrowed $55.2 billion, completing its long-term borrowing program for 2020–21 and pre-borrowing $1.5 billion for 2021–22.
- Additional details on the Province’s projected fiscal performance for 2020–21 will be provided in the 2021 Budget.
Introduction
The government is delivering on its commitment to transparency and accountability with the release of the 2020–21 Third Quarter Finances.
As committed in the 2020 Budget, Ontario’s Action Plan: Protect, Support, Recover, released last fall, the government’s top priority remains protecting and supporting people’s health and well-being throughout the pandemic. The government’s public health actions are not just necessary to stop the spread of COVID‑19 — controlling the virus is also the most sensible economic policy.
This report shows that Ontario’s strong fiscal foundation and responsible, forward-looking planning has allowed the government to continue to make $2.6 billion in additional critical investments since the 2020 Budget to ensure that people’s health is protected and the people of Ontario remain resilient during and after the pandemic.
The government understands that the current levels of spending are not sustainable in the long term but are necessary today to defeat the virus.
Defeating the COVID‑19 virus will allow the Province to embark on economic and fiscal recovery. The government will provide an update on next steps in the 2021 Budget, to be released by March 31, 2021.
Section A: Ontario’s 2020–21 fiscal outlook
The Province’s 2020–21 deficit is projected to be $38.5 billion — unchanged from the outlook published in the 2020 Budget.
Revenues in 2020–21 are projected to be $151.7 billion, $0.6 billion higher than forecast in the 2020 Budget. The increased revenue forecast reflects higher taxation revenues, Government of Canada transfers and net income from Government Business Enterprises, partially offset by lower other non‑tax revenue.
Program expense is projected to be $177.2 billion, $2.6 billion higher than the 2020 Budget, largely due to investment in hospitals, long-term care homes and supports for businesses, primarily offset from existing contingencies. Since the 2020 Budget, the government has fully allocated all of the time-limited pandemic response funding and extraordinary contingencies of $13.3 billion in 2020–21. In light of this, and in order to ensure continued fiscal flexibility to combat the pandemic and support the people of Ontario, the government has increased existing contingencies by $2.1 billion for the remainder of 2020–21, given the uncertain and unprecedented impact of the global pandemic.
The net debt-to-GDP ratio is projected to be 47.1 per cent in 2020–21, 0.1 percentage point higher than the 47.0 per cent forecast in the 2020 Budget. The net debt-to-GDP ratio increased slightly as a result of an increased investment in capital assets.
The 2020 Budget included a $2.5 billion reserve in 2020–21 to protect the fiscal outlook against any unforeseen adverse changes in the Province’s revenue and expense forecasts. With the release of the 2020–21 Third Quarter Finances, the reserve has been reduced to $0.5 billion, which could be used to address any unforeseen events that could arise before year-end.
| Item | March 2020 Economic and Fiscal Update | 2020 Budget | Current Outlook1 | Change since 2020 Budget |
|---|---|---|---|---|
| Revenue | 156,266 | 151,074 | 151,686 | 612 |
| Expense — Programs | 161,077 | 174,586 | 177,198 | 2,612 |
| Expense — Interest on Debt | 13,199 | 12,456 | 12,456 | – |
| Total Expense | 174,276 | 187,042 | 189,654 | 2,612 |
| Surplus/(Deficit) Before Reserve | (18,010) | (35,968) | (37,968) | (2,000) |
| Reserve | 2,500 | 2,500 | 500 | (2,000) |
| Surplus/(Deficit) | (20,510) | (38,468) | (38,468) | – |
[1] Current outlook primarily reflects information available as of December 31, 2020 as well as updates to February 5, 2021.
Note: Numbers may not add due to rounding.
Sources: Ontario Treasury Board Secretariat and Ministry of Finance.
Revenue
Revenues in 2020–21 are projected to be $151.7 billion, $0.6 billion higher than forecast in the 2020 Budget.
The forecast for Total Taxation Revenue has increased by $1.5 billion compared to the 2020 Budget. Key changes in the taxation revenue outlook compared to the 2020 Budget include:
- Corporations Tax revenue increased by $1.5 billion (15.0 per cent), mainly due to higher amounts from processing 2019 tax returns;
- Sales Tax revenue increased by $1.1 billion (4.5 per cent), mainly reflecting the strong rebound in household consumption spending during the second half of 2020;
- Employer Health Tax increased by $95 million (1.5 per cent), mainly due to the strong rebound in employment and hours worked during the second half of 2020;
- Gasoline and Fuel Taxes combined declined by $220 million (7.2 per cent), due to lower projected volumes purchased;
- Personal Income Tax revenue decreased by $1.0 billion (2.8 per cent), mainly due to lower amounts from processing tax assessments for 2019 and prior years; and
- All Other Taxes combined increased by $48 million mainly due to higher projected revenues from Electricity Payments-in-Lieu of Taxes and Land Transfer Tax, partially offset by lower projected revenues from Education Property Tax and the Ontario Health Premium.
Projected Government of Canada Transfers increased by $0.4 billion since the 2020 Budget, mainly due to increased federal funding of $420 million under the Workforce Development Agreements.
Net income from Government Business Enterprises are $0.3 billion higher, due to increased forecasts for earnings from the Ontario Lottery and Gaming Corporation, Liquor Control Board of Ontario, Ontario Power Generation and Hydro One Ltd.
Other Non-Tax Revenues combined are projected to decrease by $1.6 billion largely due to lower third-party revenues from hospitals, school boards and colleges and lower revenue from other consolidated government agencies.
| Item | 2020–21 |
|---|---|
| March 2020 Economic and Fiscal Update Revenue Outlook | 156,266 |
| Revenue Changes in the 2020–21 First Quarter Finances | (5,654) |
| Revenue Changes in the 2020 Budget | 462 |
| 2020 Budget Total Revenue Outlook | 151,074 |
| Revenue Changes Since the 2020 Budget — Taxation Revenue — Corporations Tax | 1,494 |
| Revenue Changes Since the 2020 Budget — Taxation Revenue — Sales Tax | 1,118 |
| Revenue Changes Since the 2020 Budget — Taxation Revenue — Employer Health Tax | 95 |
| Revenue Changes Since the 2020 Budget — Taxation Revenue — Gasoline and Fuel Tax | (220) |
| Revenue Changes Since the 2020 Budget — Taxation Revenue — Personal Income Tax | (1,025) |
| Revenue Changes Since the 2020 Budget — Taxation Revenue — All Other Taxes | 48 |
| Revenue Changes Since the 2020 Budget — Total Taxation Revenue | 1,510 |
| Revenue Changes Since the 2020 Budget — Government of Canada Transfers | 385 |
| Revenue Changes Since the 2020 Budget — Government Business Enterprises | 306 |
| Revenue Changes Since the 2020 Budget — Other Non-Tax Revenue | (1,589) |
| Total Revenue Changes Since the 2020 Budget | 612 |
| 2020–21 Third Quarter Finances Revenue Outlook | 151,686 |
Note: Numbers may not add due to rounding.
Source: Ontario Ministry of Finance.
There are further risks that could materially affect the 2020–21 revenue outlook. These include changes to the economic growth outlook, revenue collections from Ontario-administered taxes and the earnings of government business enterprises. The government will monitor these developments and will provide further details in future fiscal updates.
Expense
Total expense, including interest on debt, is projected to be $189.7 billion, $2.6 billion higher than the 2020 Budget projection, primarily due to investments to protect the people of Ontario from COVID‑19 and support economic recovery. These investments include support for hospitals and long-term care homes, and additional supports for businesses that have been impacted by COVID‑19 lockdowns.
| Item | 2020–21 |
|---|---|
| March 2020 Economic and Fiscal Update Expense Outlook | 174,276 |
| Expense Changes in the 2020–21 First Quarter Finances | 12,374 |
| Expense Changes in the 2020 Budget | 391 |
| 2020 Budget Total Expense Outlook | 187,042 |
| Program Expense Changes Since the 2020 Budget — Supports to Protect (Additional Allocations Since 2020 Budget) — Additional Funding for Hospitals | 869 |
| Program Expense Changes Since the 2020 Budget — Supports to Protect (Additional Allocations Since 2020 Budget) — More Purchases of Personal Protective Equipment (PPE) | 609 |
| Program Expense Changes Since the 2020 Budget — Supports to Protect (Additional Allocations Since 2020 Budget) — Continued Long-Term Care Sector Response to COVID‑19 | 398 |
| Program Expense Changes Since the 2020 Budget — Supports to Protect (Additional Allocations Since 2020 Budget) — Medical and Laboratory Equipment | 155 |
| Program Expense Changes Since the 2020 Budget — Supports to Protect (Additional Allocations Since 2020 Budget) — OHIP Funding and Assessment Centres | 148 |
| Program Expense Changes Since the 2020 Budget — Supports to Protect (Additional Allocations Since 2020 Budget) — Vaccine Administration | 135 |
| Program Expense Changes Since the 2020 Budget — Supports to Protect (Additional Allocations Since 2020 Budget) — Additional Critical Care Beds | 125 |
| Program Expense Changes Since the 2020 Budget — Supports to Protect (Additional Allocations Since 2020 Budget) — COVID‑19 Testing Centres | 118 |
| Program Expense Changes Since the 2020 Budget — Supports to Protect (Additional Allocations Since 2020 Budget) — Telemedicine/Virtual Care Utilization | 78 |
| Program Expense Changes Since the 2020 Budget — Supports to Protect (Additional Allocations Since 2020 Budget) — Additional COVID‑19 Mental Health and Addictions Supports | 45 |
| Program Expense Changes Since the 2020 Budget — Supports to Protect (Additional Allocations Since 2020 Budget) — Safe Re-opening of the Courts | 19 |
| Program Expense Changes Since the 2020 Budget — Supports to Protect (Additional Allocations Since 2020 Budget) — Hiring More Occupational Health and Safety Inspectors | 7 |
| Program Expense Changes Since the 2020 Budget — Supports to Protect (Additional Allocations Since 2020 Budget) — New Specialized Care Centre in the Greater Toronto Area | 6 |
| Program Expense Changes Since the 2020 Budget — Supports to Protect (Additional Allocations Since 2020 Budget) — Consolidations (financial results of third party entities)1 | (520) |
| Program Expense Changes Since the 2020 Budget — Supports to Protect (Additional Allocations Since 2020 Budget) — All Other Changes | (188) |
| Program Expense Changes Since the 2020 Budget — Total Supports to Protect | 2,004 |
| Program Expense Changes Since the 2020 Budget — Support for People, Jobs and Recovery (Additional Allocations Since 2020 Budget) — Ontario Small Business Support Grant | 1,400 |
| Program Expense Changes Since the 2020 Budget — Support for People, Jobs and Recovery (Additional Allocations Since 2020 Budget) — Additional Support for Businesses — Property Taxes and Energy Bills | 300 |
| Program Expense Changes Since the 2020 Budget — Support for People, Jobs and Recovery (Additional Allocations Since 2020 Budget) — Safe Restart Agreement — Child Care | 235 |
| Program Expense Changes Since the 2020 Budget — Support for People, Jobs and Recovery (Additional Allocations Since 2020 Budget) — Expand Support for Learners | 110 |
| Program Expense Changes Since the 2020 Budget — Support for People, Jobs and Recovery (Additional Allocations Since 2020 Budget) — Off-Peak Time-of-Use Electricity Rate — January 1, 2021 to February 9, 2021 | 105 |
| Program Expense Changes Since the 2020 Budget — Support for People, Jobs and Recovery (Additional Allocations Since 2020 Budget) — Isolation Centres | 42 |
| Program Expense Changes Since the 2020 Budget — Support for People, Jobs and Recovery (Additional Allocations Since 2020 Budget) — Additional Funding for the Alcohol and Gaming Commission of Ontario | 32 |
| Program Expense Changes Since the 2020 Budget — Support for People, Jobs and Recovery (Additional Allocations Since 2020 Budget) — All Other Changes | 10 |
| Program Expense Changes Since the 2020 Budget — Total Support for People, Jobs and Recovery | 2,234 |
| Program Expense Changes Since the 2020 Budget — Other Changes — Employment and Training Supports | 420 |
| Program Expense Changes Since the 2020 Budget — Other Changes — Procurement of Personal Protective Equipment and Critical Supplies and Equipment | 387 |
| Program Expense Changes Since the 2020 Budget — Other Changes — Safe Return to Class Fund — Phase II | 381 |
| Program Expense Changes Since the 2020 Budget — Other Changes — Statutory Obligations Under the Crown Liability and Proceedings Act, 2019 | 26 |
| Program Expense Changes Since the 2020 Budget — Other Changes — Ontario-Federal Sport Participation Bilateral Agreement | 8 |
| Program Expense Changes Since the 2020 Budget — Other Changes — Enhancing Digital Services | 3 |
| Program Expense Changes Since the 2020 Budget — Other Changes — Implementation Delays of Infrastructure Programs and Projects | (269) |
| Program Expense Changes Since the 2020 Budget — Other Changes — Lower-than-Projected Social Assistance Expenditure | (427) |
| Program Expense Changes Since the 2020 Budget — Other Changes — All Other Changes | (483) |
| Program Expense Changes Since the 2020 Budget — Total Other Changes | 46 |
| Program Expense Changes Since the 2020 Budget — Drawdown of the Standard Contingency Fund to Offset New Spending | (1,120) |
| Program Expense Changes Since the 2020 Budget — Drawdown of the COVID‑19 Health Contingency Fund to Offset New Spending | (598) |
| Program Expense Changes Since the 2020 Budget — Drawdown of the Support for People and Jobs Fund to Offset New Spending | (2,050) |
| Program Expense Changes Since the 2020 Budget — Top-up of the Standard Contingency Fund for the Remainder of 2020–21 | 2,097 |
| Total Net Program Expense Changes Since the 2020 Budget | 2,612 |
| Interest on Debt Change Since the 2020 Budget | – |
| Total Expense Changes Since the 2020 Budget | 2,612 |
| 2020–21 Third Quarter Finances Expense Outlook | 189,654 |
[1] Accounting adjustments tied primarily to grants provided for infrastructure projects and other related investments.
Note: Numbers may not add due to rounding.
Sources: Ontario Treasury Board Secretariat and Ministry of Finance.
Program expense update
The outlook for program expense in 2020–21 is projected to be $177.2 billion, an increase of approximately $2.6 billion compared to the 2020 Budget.
Key changes to program expense projections to support the government’s urgent response to COVID‑19 include:
- $869 million in additional investments for the hospital sector for supplies and equipment related to addressing the surge in COVID‑19 cases, including testing, swabs, saliva tubes and test kits, bringing the total increase in funding to hospitals since 2019–20 to $3.4 billion;
- $609 million to support the procurement of additional personal protective equipment and critical supplies and equipment and continued support for essential supply chain operations in the health care sector;
- $398 million to respond to the impact of COVID‑19 in the long-term care sector, including through continued prevention and containment measures, funding to support implementation of testing guidelines, and support for operators who have been impacted by the changes in occupancy numbers due to COVID‑19;
- $155 million to support managing the COVID‑19 pandemic with investments in critical medical and laboratory equipment;
- $148 million to provide health care support for uninsured patients and operate COVID‑19 Assessment Centres;
- $135 million for administration of the Province’s COVID‑19 vaccination program. The government’s vaccine rollout is underway since launching in December. Based on available supply as of February 4, more than 350,000 doses have been administered with more than 80,000 people fully vaccinated;
- $125 million in COVID‑19 investments in the hospital sector through the planned addition of more than 500 critical care beds to address urgent operating pressures and build capacity in the health care system to respond to a resurgence in cases of COVID‑19;
- $118 million in testing, laboratory services as well as purchasing and distribution of medical equipment;
- $78 million investment to support an increase in demand for Telemedicine services during COVID‑19. Through this investment, providers will be able to leverage a variety of virtual care technologies that best meet the needs of their patients while helping to reduce the spread of COVID‑19;
- $45 million investment to support a comprehensive cross-ministry plan to address mental health and addictions supports related to COVID‑19, which has exacerbated mental health issues due to self-isolation and job losses. The investments will support building healthier and safer communities, including increasing service provision, providing tools and resources, developing and implementing training, and providing housing supports;
- $19 million to support the safe re-opening of the courts;
- $7 million to launch a recruitment campaign, increase frontline health and safety inspectors by 98, and help ensure workplaces are doing their part to prevent the spread of COVID‑19; and
- $6 million to support the opening of a new Specialized Care Centre to provide care for long-term care residents in the Greater Toronto Area who must be temporarily relocated due to the challenging situation in their long-term care home as a result of COVID‑19.
Key changes to program expense projections to support families, workers and employers and build the foundation for a strong recovery fuelled by economic growth include:
- $1.4 billion to launch the Ontario Small Business Support Grant to support small businesses that are required to close or significantly restrict services under the provincewide shutdown effective December 26, 2020, with one-time grants of up to $20,000;
- $300 million in additional support made available, for a total of $600 million, for property tax and energy bill relief to eligible businesses that were required to close or significantly restrict services due to enhanced public health measures;
- $235 million in additional supports to keep children and staff safe in child care and early years settings;
- $110 million to provide a one-time payment of $200 per eligible student aged 13 through Grade 12 to help offset added costs of COVID‑19 such as technology for online learning and educational supplies;
- $105 million in additional support to provide the off-peak price of electricity for 24 hours a day for eligible residential, farm and small business customers from January 1, 2021 to February 9, 2021;
- $42 million in funding as part of the Province’s High Priority Communities Strategy to help people in some of the hardest hit neighborhoods self-isolate and keep their families and communities safe. In addition to providing individuals with a safe place to isolate, COVID‑19 isolation centres will also provide a range of wraparound supports and services, including meals, security, transportation and links to health and social services; and
- $32 million to ensure the continued safe operations of the Alcohol and Gaming Commission of Ontario, as a result of reduced recoveries from the horseracing, cannabis and gaming sectors due to the closure of non-essential businesses.
Other changes to program expense include:
- $420 million in additional supports for employment and training initiatives, reflecting an increase in funding from the federal Workforce Development Agreement;
- $387 million for the procurement of personal protective equipment and critical supplies and equipment to support frontline staff in the education and public sectors through the pandemic;
- $381 million in additional funding to provide further supports to better protect students, staff and families as part of Ontario’s plan to safely reopen schools;
- $26 million in expenses related to statutory obligations under the Crown Liability and Proceedings Act, 2019;
- $8 million in federal transfer funding through the Ontario-Federal Sport Participation Bilateral Agreement to support Ontario’s sport sector, which has been impacted by COVID‑19;
- $3 million for enhancing digital services. The Province is continuing to invest in digital services, making it easier to renew more services on line. These investments are consistent with moving Ontario Onwards, and will help in making Ontario the leading digital jurisdiction in the world;
- A reduction in planned spending of $269 million for infrastructure programs due to revised implementation timelines for a number of projects; and
- Lower than projected social assistance expenditure of $427 million due to the roll out of the Canada Emergency Response Benefit, enhanced Employment Insurance and Canada Recovery Benefit programs by the federal government in response to the COVID‑19 pandemic.
Changes to program expense have been offset by $1.1 billion against the standard Contingency Fund, $598 million against the COVID‑19 Health Contingency Fund and $2.1 billion against the Support for People and Jobs Fund. Additionally, to help mitigate expense risks for the remainder of 2020–21, the standard Contingency Fund has been allocated an additional $2.1 billion.
Interest on debt expense update
Interest on debt expense is projected to be $12.5 billion, consistent with the forecast in the 2020 Budget.
Fiscal prudence
To protect the health of the people of Ontario and support families, businesses and jobs during the pandemic, the Province made available time-limited pandemic response funding and extraordinary contingencies of $13.3 billion in 2020–21 as part of 2020 Budget. This funding is tracked under the categories of COVID‑19 health sector response and the Support for People and Jobs Fund. As of February 5, 2021, the balances in these funds have been fully allocated as part of the government’s effort to combat the COVID‑19 pandemic and support the recovery of the Province.
| Item | Current Outlook 2020–21 |
|---|---|
| Time-limited Funding and Extraordinary Contingencies — One-time COVID‑19 Health Sector Expense | 3,052 |
| Time-limited Funding and Extraordinary Contingencies — COVID‑19 Health Contingency Fund | 5,294 |
| Time-limited Funding and Extraordinary Contingencies — Subtotal: COVID‑19 Health Sector Response | 8,346 |
| Time-limited Funding and Extraordinary Contingencies — Support for People and Jobs Fund | 4,966 |
| Total Time-limited Funding and Extraordinary Contingencies | 13,312 |
| Remaining Balances1 — COVID‑19 Health Contingency Fund | – |
| Remaining Balances2 — Support for People and Jobs Fund | – |
| Total Remaining Balances | – |
[1], [2] As of February 5, 2021, net of new projected drawdowns in the 2020–21 Third Quarter Finances.
Note: Numbers may not add due to rounding.
Sources: Ontario Treasury Board Secretariat and Ministry of Finance.
The Fiscal Sustainability, Transparency and Accountability Act, 2019 requires Ontario’s fiscal plan to incorporate prudence in the form of a reserve to protect the fiscal outlook against unforeseen adverse changes in the Province’s revenue and expense, including those resulting from changes in Ontario’s economic performance. With the release of the 2020–21 Third Quarter Finances, the reserve, included as part of the 2020 Budget, has been reduced to $0.5 billion. Additionally, the standard Contingency Fund is maintained to help mitigate expense risks — for example, in cases where health and safety may be compromised, and which may otherwise adversely affect Ontario’s fiscal performance. The remaining standard Contingency Fund at the time of the 2020 Budget was $3.0 billion, with $1.9 billion remaining after draws in the 2020–21 Third Quarter Finances.
In light of the government fully allocating all of the time-limited pandemic response funding and extraordinary contingencies of $13.3 billion in 2020–21, and in order to ensure continued fiscal flexibility to combat the pandemic and support the people of Ontario, the government has increased existing contingencies by $2.1 billion for the remainder of 2020–21, given the uncertain and unprecedented impact of the global pandemic. Any unused contingency funds at year end will go towards reducing the Province’s net debt position.
Section B: Ontario’s recent economic performance and outlook
Recent economic performance
The COVID‑19 pandemic led to unprecedented economic contractions around the world. All G7 countries, including Canada, posted sharp real GDP declines in the first half of 2020 before rebounding in the third quarter.
Ontario real GDP rebounded by 9.4 per cent in the third quarter of 2020, following declines of 1.8 per cent and 12.2 per cent in the first and second quarters, respectively. Third quarter growth was supported by higher consumer spending, business investment and exports. Real GDP in the quarter was still 5.7 per cent below the level in the fourth quarter of 2019.
Between February and May, Ontario employment declined by 1,134,700 (−15.1 per cent). Since June, employment rebounded by 729,100 net jobs and as of January was 405,600 (−5.4 per cent) below the February 2020 level. As of January 2021, the unemployment rate was 10.2 per cent, down from a high of 13.5 per cent in May.
In addition, many other key economic indicators showed signs of recovery. Retail sales and wholesale trade have risen above their pre-pandemic levels.
Economic outlook
The introduction of COVID‑19 vaccines has supported expectations for global economic recovery. The International Monetary Fund (IMF) projects global real GDP to decline by 3.5 per cent in 2020 and increase by 5.5 per cent in 2021 and 4.2 per cent in 2022. In the U.S., real GDP declined by 3.5 per cent in 2020, and is projected to rise by 5.1 per cent in 2021 and 2.5 per cent in 2022.
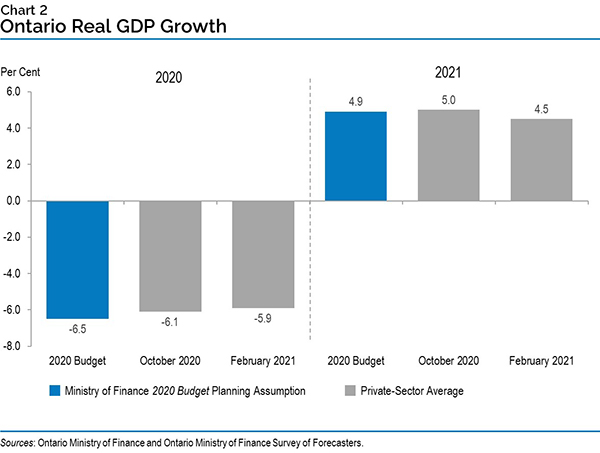
Private-sector forecasters, on average, project Ontario real GDP to decline by 5.9 per cent in 2020, an improvement compared to an average decline of 6.1 per cent in October 2020. The current private-sector average is also higher than the prudent 6.5 per cent decrease projected in the 2020 Budget.
Private-sector forecasters, on average, project real GDP to rise by 4.5 per cent in 2021, easing from an average of 5.0 per cent in October 2020 and slower than the 4.9 per cent increase projected in the 2020 Budget.
The future path of the COVID‑19 pandemic represents the most significant risk to the economic outlook in Ontario and globally over the rest of 2020–21. Other key risks include the overall pace and composition of global and U.S. economic growth.
Section C: Details of Ontario’s finances
| Item | 2020–21 Budget Plan |
2020–21 Current Outlook |
2020–21 In-Year Change |
|---|---|---|---|
| Taxation Revenue — Personal Income Tax | 36,901 | 35,876 | (1,025) |
| Taxation Revenue — Sales Tax | 24,879 | 25,997 | 1,118 |
| Taxation Revenue — Corporations Tax | 9,941 | 11,435 | 1,494 |
| Taxation Revenue — Education Property Tax | 6,060 | 6,000 | (60) |
| Taxation Revenue — Employer Health Tax | 6,346 | 6,441 | 95 |
| Taxation Revenue — Ontario Health Premium | 4,007 | 3,958 | (49) |
| Taxation Revenue — Gasoline Tax | 2,379 | 2,120 | (259) |
| Taxation Revenue — Land Transfer Tax | 3,384 | 3,438 | 54 |
| Taxation Revenue — Tobacco Tax | 1,108 | 1,103 | (5) |
| Taxation Revenue — Fuel Tax | 672 | 711 | 39 |
| Taxation Revenue — Beer, Wine and Spirits Taxes | 593 | 615 | 22 |
| Taxation Revenue — Electricity Payments in Lieu of Taxes | 486 | 557 | 71 |
| Taxation Revenue — Ontario Portion of the Federal Cannabis Excise Duty | 145 | 140 | (5) |
| Taxation Revenue — Other Taxes | 561 | 581 | 20 |
| Taxation Revenue — Total | 97,462 | 98,972 | 1,510 |
| Government of Canada — Canada Health Transfer | 16,252 | 16,208 | (44) |
| Government of Canada — Canada Social Transfer | 5,832 | 5,815 | (17) |
| Government of Canada — Equalization | – | – | – |
| Government of Canada — Infrastructure Programs | 1,013 | 1,023 | 10 |
| Government of Canada — Labour Market Programs | 1,091 | 1,521 | 430 |
| Government of Canada — Social Housing Agreement | 331 | 331 | – |
| Government of Canada — Other Federal Payments | 8,434 | 8,452 | 18 |
| Government of Canada — Direct Transfers to Broader Public-Sector Organizations | 407 | 395 | (12) |
| Government of Canada — Total | 33,360 | 33,745 | 385 |
| Income from Government Business Enterprises — Liquor Control Board of Ontario | 2,377 | 2,452 | 75 |
| Income from Government Business Enterprises — Ontario Power Generation Inc./Hydro One Ltd. | 893 | 1,034 | 141 |
| Income from Government Business Enterprises — Ontario Lottery and Gaming Corporation | 200 | 300 | 100 |
| Income from Government Business Enterprises — Ontario Cannabis Store | 80 | 70 | (10) |
| Income from Government Business Enterprises — Total | 3,550 | 3,856 | 306 |
| Other Non-Tax Revenue — Fees, Donations and Other Revenues from Hospitals, School Boards and Colleges | 9,740 | 8,353 | (1,387) |
| Other Non-Tax Revenue — Vehicle and Driver Registration Fees | 2,061 | 2,065 | 4 |
| Other Non-Tax Revenue — Miscellaneous Other Non-Tax Revenue | 1,377 | 1,241 | (136) |
| Other Non-Tax Revenue — Other Fees and Licences | 1,105 | 1,042 | (63) |
| Other Non-Tax Revenue — Sales and Rentals | 1,045 | 754 | (291) |
| Other Non-Tax Revenue — Reimbursements | 961 | 1,174 | 213 |
| Other Non-Tax Revenue — Royalties | 278 | 342 | 64 |
| Other Non-Tax Revenue — Power Supply Contract Recoveries | 107 | 114 | 7 |
| Other Non-Tax Revenue — Net Reduction of Power Purchase Contracts | 28 | 28 | – |
| Other Non-Tax Revenue — Total | 16,702 | 15,113 | (1,589) |
| Total Revenue | 151,074 | 151,686 | 612 |
Note: Numbers may not add due to rounding.
Source: Ontario Ministry of Finance.
| Ministry Expense | 2020–21 Budget Plan |
2020–21 Current Outlook |
2020–21 In-Year Change |
|---|---|---|---|
| Agriculture, Food and Rural Affairs (Base) | 313.8 | 301.9 | (11.8) |
| Agriculture, Food and Rural Affairs — Federal–Provincial Infrastructure Programs2 | 104.0 | – | (104.0) |
| Agriculture, Food and Rural Affairs — Municipal Infrastructure Program Investments3 | 10.0 | – | (10.0) |
| Agriculture, Food and Rural Affairs — Demand-Driven Risk Management and Time-Limited Programs | 442.6 | 469.4 | 26.8 |
| Agriculture, Food and Rural Affairs (Total) | 870.4 | 771.4 | (99.0) |
| Attorney General (Base) | 1,682.2 | 1,819.6 | 137.4 |
| Attorney General — Statutory Appropriations — Crown Liability and Proceedings Act, 2019 | – | 25.8 | 25.8 |
| Attorney General (Total) | 1,682.2 | 1,845.4 | 163.2 |
| Board of Internal Economy (Total) | 280.8 | 279.6 | (1.2) |
| Children, Community and Social Services (Total) | 17,927.5 | 17,717.9 | (209.5) |
| Colleges and Universities (Base) | 9,394.7 | 9,375.6 | (19.1) |
| Colleges and Universities — Student Financial Assistance | 1,274.4 | 895.3 | (379.1) |
| Colleges and Universities (Total) | 10,669.1 | 10,270.9 | (398.2) |
| Economic Development, Job Creation and Trade (Base) | 362.9 | 357.2 | (5.8) |
| Economic Development, Job Creation and Trade — Time-Limited Investments | 356.2 | 1,766.9 | 1,410.7 |
| Economic Development, Job Creation and Trade (Total) | 719.2 | 2,124.1 | 1,404.9 |
| Education (Base) | 31,038.2 | 31,122.8 | 84.6 |
| Education — Teachers’ Pension Plan4 | 1,620.7 | 1,620.7 | – |
| Education (Total) | 32,658.9 | 32,743.6 | 84.6 |
| Energy, Northern Development and Mines (Base) | 1,047.0 | 1,034.4 | (12.6) |
| Energy, Northern Development and Mines — Electricity Cost Relief Programs | 6,209.0 | 6,511.6 | 302.6 |
| Energy, Northern Development and Mines (Total) | 7,256.0 | 7,546.0 | 290.0 |
| Environment, Conservation and Parks (Base) | 669.1 | 649.2 | (19.9) |
| Environment, Conservation and Parks — Time-Limited Investments | – | 0.1 | 0.1 |
| Environment, Conservation and Parks (Total) | 669.1 | 649.4 | (19.8) |
| Executive Offices (Base) | 37.5 | 38.6 | 1.1 |
| Executive Offices — Time-Limited Assistance | 2.0 | 2.0 | – |
| Executive Offices (Total) | 39.5 | 40.6 | 1.1 |
| Finance (Base) | 862.0 | 806.4 | (55.6) |
| Finance — Time-Limited Investments | 616.2 | 576.2 | (40.0) |
| Finance — Investment Management Corporation of Ontario5 | 161.1 | 141.3 | (19.8) |
| Finance — Ontario Municipal Partnership Fund | 501.9 | 501.9 | – |
| Finance — Power Supply Contract Costs | 107.0 | 114.2 | 7.1 |
| Finance — COVID‑19 Response: Support for People and Jobs Fund | 2,050.0 | – | (2,050.0) |
| Finance (Total) | 4,298.2 | 2,139.9 | (2,158.3) |
| Francophone Affairs (Total) | 7.1 | 6.6 | (0.5) |
| Government and Consumer Services (Base) | 641.1 | 665.9 | 24.8 |
| Government and Consumer Services — Time-Limited Investments | – | 386.7 | 386.7 |
| Government and Consumer Services — Realty | 1,025.9 | 1,081.9 | 56.0 |
| Government and Consumer Services (Total) | 1,667.0 | 2,134.6 | 467.5 |
| Health (Total)6 | 60,110.5 | 60,532.9 | 422.4 |
| COVID‑19 Response Including COVID‑19 Health Contingency Fund7 | 8,346.0 | 8,346.0 | – |
| Heritage, Sport, Tourism and Culture Industries (Base) | 1,031.8 | 969.4 | (62.4) |
| Heritage, Sport, Tourism and Culture Industries — Ontario Cultural Media Tax Credits | 515.2 | 511.5 | (3.7) |
| Heritage, Sport, Tourism and Culture Industries — Ontario Cultural Media Tax Credits — Amounts Related to Prior Years | – | 64.6 | 64.6 |
| Heritage, Sport, Tourism and Culture Industries (Total) | 1,547.0 | 1,545.6 | (1.4) |
| Indigenous Affairs (Base) | 82.2 | 94.9 | 12.7 |
| Indigenous Affairs — One-Time Investments, Including Settlements | 14.0 | 167.9 | 153.9 |
| Indigenous Affairs (Total) | 96.2 | 262.8 | 166.6 |
| Infrastructure (Base) | 213.3 | 155.6 | (57.7) |
| Infrastructure — Federal–Provincial Infrastructure Programs8 | 310.5 | 234.6 | (75.8) |
| Infrastructure — Waterfront Toronto Revitalization (Port Lands Flood Protection) | 128.4 | 103.4 | (25.0) |
| Infrastructure — Municipal Infrastructure Program Investments9 | 202.0 | 198.0 | (3.9) |
| Infrastructure (Total) | 854.1 | 691.6 | (162.5) |
| Labour, Training and Skills Development (Base) | 127.7 | 134.8 | 7.1 |
| Labour, Training and Skills Development — Training Tax Credits (Co-operative Education and Apprenticeship Training)10 | 82.3 | 97.7 | 15.4 |
| Labour, Training and Skills Development — Demand-Driven Employment and Training Programs | 1,050.9 | 1,470.9 | 420.0 |
| Labour, Training and Skills Development (Total) | 1,260.9 | 1,703.4 | 442.5 |
| Long-Term Care (Total) | 4,535.8 | 5,436.3 | 900.5 |
| Municipal Affairs and Housing (Base) | 481.7 | 479.5 | (2.2) |
| Municipal Affairs and Housing — Safe Restart Agreement | 1,900.0 | 1,900.0 | – |
| Municipal Affairs and Housing — Time-Limited Investments | 255.8 | 299.6 | 43.8 |
| Municipal Affairs and Housing — Social Housing Agreement — Payments to Service Managers | 315.2 | 315.2 | – |
| Municipal Affairs and Housing (Total) | 2,952.7 | 2,994.3 | 41.6 |
| Natural Resources and Forestry (Base) | 556.6 | 558.2 | 1.6 |
| Natural Resources and Forestry — Emergency Forest Firefighting | 100.0 | 120.5 | 20.5 |
| Natural Resources and Forestry (Total) | 656.5 | 678.7 | 22.2 |
| Seniors and Accessibility (Base) | 58.2 | 78.7 | 20.5 |
| Seniors and Accessibility — Time-Limited Investments | 129.0 | 126.4 | (2.6) |
| Seniors and Accessibility (Total) | 187.2 | 205.1 | 17.9 |
| Solicitor General (Total) | 2,874.4 | 2,970.4 | 96.1 |
| Transportation (Base) | 4,972.6 | 5,048.3 | 75.7 |
| Transportation — Safe Restart Agreement | 2,000.0 | 2,000.0 | – |
| Transportation — Federal–Provincial Infrastructure Programs | 640.0 | 754.5 | 114.5 |
| Transportation (Total) | 7,612.6 | 7,802.8 | 190.2 |
| Treasury Board Secretariat (Base) | 406.8 | 380.8 | (26.0) |
| Treasury Board Secretariat — Employee and Pensioner Benefits11 | 1,389.0 | 1,389.0 | – |
| Treasury Board Secretariat — Operating Contingency Fund | 2,912.0 | 3,893.2 | 981.1 |
| Treasury Board Secretariat — Capital Contingency Fund | 99.3 | 95.2 | (4.1) |
| Treasury Board Secretariat (Total) | 4,807.2 | 5,758.2 | 951.0 |
| Interest on Debt12 | 12,456.0 | 12,456.0 | – |
| Total Expense | 187,042.0 | 189,654.0 | 2,612.0 |
[1] Numbers reflect current ministry structure.
[2], [3], [8], [9] $114 million Municipal and Federal-Provincial Infrastructure Program funding transferring from the Ministry of Agriculture, Food and Rural Affairs to the Ministry of Infrastructure in 2020–21.
[4], [11] Numbers reflect the pension expense that was calculated based on recommendations of the Independent Financial Commission of Inquiry, as described in Note 19 to the Consolidated Financial Statements in Public Accounts of Ontario 2017–2018.
[5] Based on the requirements of Public Sector Accounting Standards, the Province consolidated the Investment Management Corporation of Ontario into the Ministry of Finance.
[6] Includes accounting adjustments tied primarily to grants provided for infrastructure projects and other related investments.
[7] For presentation purposes in the 2020–21 Third Quarter Finances, all one-time COVID‑19 related spending has been included separately instead of within the Ministry of Health and Ministry of Long-Term Care. This funding includes a one-time COVID‑19 Health Sector expense of $3.1 billion and the COVID‑19 Health Contingency Fund of $5.3 billion in 2020–21. This change in presentation does not impact ministry allocations, which reflect ministry structure(s) presented in the 2020–21 Expenditure Estimates.
[10] The Co-operative Education Tax Credit remains in effect. The Apprenticeship Training Tax Credit is eliminated for eligible apprenticeship programs that commenced on or after November 15, 2017. Current Outlook includes tax credit amounts related to prior years.
[12] Interest on debt is net of interest capitalized during construction of tangible capital assets of $234 million in 2020–21.
Note: Numbers may not add due to rounding.
Sources: Ontario Treasury Board Secretariat and Ministry of Finance.
| Sector | 2020–21 Current Outlook — Investment in Capital Assets1, 2 |
2020–21 Current Outlook — Transfers and Other Infrastructure Expenditures3 |
2020–21 Current Outlook — Total Infrastructure Expenditures |
|---|---|---|---|
| Transportation — Transit | 4,210 | 1,224 | 5,434 |
| Transportation — Provincial Highways | 2,834 | 78 | 2,912 |
| Transportation — Other Transportation, Property and Planning | 160 | 68 | 228 |
| Health — Hospitals | 2,668 | 3 | 2,671 |
| Health — Other Health | 53 | 213 | 266 |
| Education | 2,241 | – | 2,241 |
| Postsecondary Education — Colleges and Other | 835 | 64 | 899 |
| Postsecondary Education — Universities | – | 90 | 90 |
| Social | 23 | 245 | 267 |
| Justice | 367 | 124 | 492 |
| Other Sectors4 | 983 | 762 | 1,746 |
| Total Infrastructure Expenditures | 14,375 | 2,871 | 17,247 |
| Less: Other Partner Funding5 | 2,294 | – | 2,294 |
| Total6 | 12,081 | 2,871 | 14,952 |
[1] Includes $234 million in interest capitalized during construction.
[2] Includes provincial investment in capital assets of $11.9 billion.
[3] Includes transfers to municipalities, universities and non-consolidated agencies.
[4] Includes government administration, natural resources and the culture and tourism industries.
[5] Other Partner Funding refers to third-party investments, primarily in hospitals, colleges and schools.
[6] Includes Federal/Municipal contributions to provincial infrastructure investments.
Note: Numbers may not add due to rounding.
Source: Ontario Treasury Board Secretariat.
| Item | 2016–17 | 2017–18 | 2018–19 | Actual 2019–20 |
Current Outlook 2020–21 |
|---|---|---|---|---|---|
| Revenue | 140,734 | 150,594 | 153,700 | 156,096 | 151,686 |
| Expense — Programs | 131,460 | 142,363 | 148,751 | 152,273 | 177,198 |
| Expense — Interest on Debt3 | 11,709 | 11,903 | 12,384 | 12,495 | 12,456 |
| Total Expense | 143,169 | 154,266 | 161,135 | 164,768 | 189,654 |
| Reserve | – | – | – | – | 500 |
| Surplus/(Deficit) | (2,435) | (3,672) | (7,435) | (8,672) | (38,468) |
| Net Debt | 314,077 | 323,834 | 338,496 | 353,332 | 399,463 |
| Accumulated Deficit | 205,939 | 209,023 | 216,642 | 225,764 | 264,232 |
| Gross Domestic Product (GDP) at Market Prices | 790,749 | 824,979 | 859,079 | 891,811 | 848,997 |
| Primary Household Income | 520,486 | 541,501 | 567,492 | 591,527 | 587,067 |
| Population — July (000s)4 | 13,875 | 14,070 | 14,309 | 14,545 | 14,734 |
| Net Debt Per Capita (dollars) | 22,636 | 23,016 | 23,657 | 24,293 | 27,112 |
| Household Income Per Capita (dollars) | 37,511 | 38,486 | 39,661 | 40,670 | 39,844 |
| Net Debt as a Per Cent of Revenue | 223.2% | 215.0% | 220.2% | 226.4% | 263.3% |
| Interest on Debt as a Per Cent of Revenue | 8.3% | 7.9% | 8.1% | 8.0% | 8.2% |
| Net Debt as a Per Cent of GDP | 39.7% | 39.3% | 39.4% | 39.6% | 47.1% |
| Accumulated Deficit as a Per Cent of GDP | 26.0% | 25.3% | 25.2% | 25.3% | 31.1% |
[1] Amounts reflect a change in pension expense that was calculated based on recommendations of the Independent Financial Commission of Inquiry, as described in Note 19 to the Consolidated Financial Statements, in Public Accounts of Ontario 2017–2018. Amounts for net debt and accumulated deficit also reflect this change.
[2] Revenues and expenses have been restated to reflect the following fiscally neutral changes: i) revised presentation of education property taxes to be included in the taxation revenues; ii) reclassification of certain Government Business Enterprises to other government organizations; iii) reclassification of a number of tax measures that provide a financial benefit through the tax system to be reported as expenses; and iv) change in presentation of third-party revenue for hospitals, school boards and colleges to be reported as revenue.
[3] Interest on debt is net of interest capitalized during construction of tangible capital assets of $159 million in 2016–17, $157 million in 2017–18, $175 million in 2018–19, $245 million in 2019–20 and $234 million in 2020–21.
[4] Population figures are for July 1st of the fiscal year indicated (i.e. for 2016–17, the population on July 1, 2016 is shown).
Note: Numbers may not add due to rounding.
Sources: Statistics Canada, Ontario Treasury Board Secretariat and Ministry of Finance.
Section D: Ontario’s 2020–21 borrowing program
| Item | 2020–21 2020 Budget |
2020–21 Current Outlook |
2020–21 In-Year Change |
|---|---|---|---|
| Deficit/(Surplus) | 38.5 | 38.5 | – |
| Investment in Capital Assets | 10.6 | 11.9 | 1.4 |
| Non-Cash Adjustments | (9.2) | (9.2) | – |
| Loans to Infrastructure Ontario | – | – | – |
| Other Net Loans/Investments | 0.6 | – | (0.6) |
| Debt Maturities/Redemptions | 26.7 | 26.7 | – |
| Total Funding Requirement | 67.0 | 67.8 | 0.8 |
| Decrease/(Increase) in Short-Term Borrowing | (5.7) | (5.1) | 0.6 |
| Increase/(Decrease) in Cash and Cash Equivalents | (1.4) | (1.4) | – |
| Pre-Borrowing from 2019–20 | (7.6) | (7.6) | – |
| Pre-Borrowing in 2020–21 for 2021–22 | – | 1.5 | 1.5 |
| Total Long-Term Public Borrowing | 52.3 | 55.2 | 2.9 |
Note: Numbers may not add due to rounding.
Source: Ontario Financing Authority.
The Province’s funding requirements for 2020–21 are projected to increase by $0.8 billion compared to the forecast in the 2020 Budget, reflecting an increase of $1.4 billion in investment in capital assets offset by a $0.6 billion reduction in net loans and investments. The Province’s long-term borrowing program for 2020–21 is forecast to increase by $2.9 billion, reflecting $1.5 billion in pre-borrowing currently completed for 2021–22, and $1.4 billion to fund the increase in capital investments. Short-term borrowing for the fiscal year is projected to decrease by $0.6 billion to offset the change in net loans and investments. Subject to market conditions, the Province will continue to engage in pre-borrowing for 2021–22.
Approximately 66 per cent of this year’s borrowing has been completed in Canadian dollars, with the remainder issued in U.S. dollars, Euros and Pounds sterling. The Province has launched a number of large bond issues in 2020–21 to enable it to complete the borrowing program. These included the largest issues ever launched by a province in the Canadian domestic bond market, the Euro denominated bond market, the Pound sterling bond market, and the second-largest issue in the U.S. dollar bond market. On January 28, 2021, the Province issued its second Green Bond in fiscal 2020–21, and ninth Green Bond overall. This issue was for $1.25 billion, and follows a $1.5 billion Green Bond launched in October 2020. These are the two largest Canadian dollar Green Bond issues ever launched, and Ontario remains the leader in this market with $8.0 billion issued and $7.5 billion outstanding. Nine projects were selected to receive funding from the most recent Green Bond. This includes five Clean Transportation projects, three Energy Efficiency and Conservation projects and one project under the Climate Adaptation and Resilience framework category.
2020–21 Long-term borrowing
| Item | ($ Billions) |
|---|---|
| Canadian Dollar Issues | 36.5 |
| Foreign Currency Issues | 18.8 |
| Total | 55.2 |
Note: Numbers may not add due to rounding.
Source: Ontario Financing Authority.
Ministry of Finance
For general inquiries regarding the 2020–21 Third Quarter Finances, please call:
Toll-free English and French inquiries:
Teletypewriter
© Queen’s Printer for Ontario, 2021
Chart descriptions
Chart 1: Ontario’s Labour Market
The chart shows Ontario’s monthly employment level as a shaded area and unemployment rate as a line from January 2019 to January 2021. The unemployment rate trended down from 5.9 per cent in January 2019 to 5.5 per cent in February 2020 before increasing to 13.5 per cent in May 2020, and has since declined to 9.2 per cent in November 2020 before increasing to 10.2 per cent in January 2021. Employment had increased steadily from about 7.3 million in January 2019 to about 7.5 million in February 2020, before declining to about 6.4 million in May 2020. In December 2020, employment increased to about 7.2 million, before declining to 7.1 million in January 2021. There is a call-out box that states "+729,100 net jobs since June 2020".
Chart 2: Ontario Real GDP Growth
This bar chart shows the 2020 Budget planning assumption and private-sector average forecasts for Ontario real GDP growth in 2020 and 2021. In the 2020 Budget, the Ministry of Finance projected Ontario’s real GDP to decline by 6.5 per cent in 2020 and rise by 4.9 per cent in 2021. In October 2020 the private-sector average forecast was for real GDP to decline by 6.1 per cent in 2020 and increase by 5.0 per cent in 2021. In February 2021, the average private-sector forecast for real GDP growth is 4.5 per cent in 2021, down from the average of 5.0 per cent at the time of the 2020 Budget.