It is important that infrastructure investments are based on strong evidence, because this ensures that Ontarians get the maximum benefit out of their infrastructure dollars. The IJPA requires the government by 2019 to describe the state of its assets, what it needs over the next 10 years and its strategy to meet those needs. The Government of Ontario is well on the way to meeting these requirements.

Assessing what Ontario has

In line with the IJPA’s requirements, the government has developed a provincial Asset Inventory of Ontario’s owned and consolidatedfootnote 18 infrastructure assets. Developing a detailed asset inventory is a necessary and important step toward improving asset management across the government and implementing evidence-based infrastructure planning more generally. The inventory includes the age, value and condition of Ontario’s assets. It also responds to the 2015 Ontario Auditor General’s Report,footnote 19 which highlighted the need for the government to have a reliable estimate of the condition of provincial assets to use in making funding-priority decisions.

The Province owns or consolidates nearly 40 per cent of public infrastructure stock in Ontario — with a replacement value of $209 billion.footnote 20 The Technical Appendix includes a detailed Asset Inventory, organized by sector, including: health, education, tourism and culture, government’s general real-estate, transportation, transit, postsecondary education and natural resources and forestry. A summary of these sector profiles is provided in the subsequent figure.

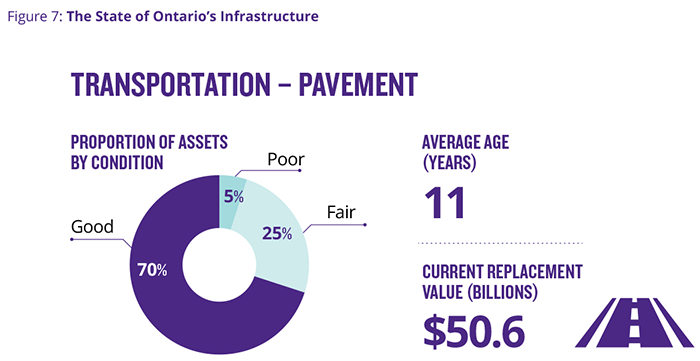
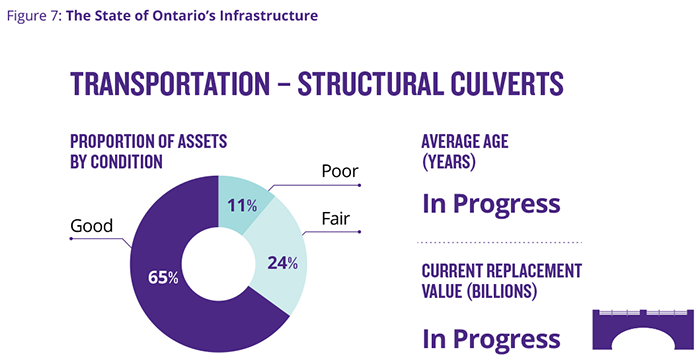
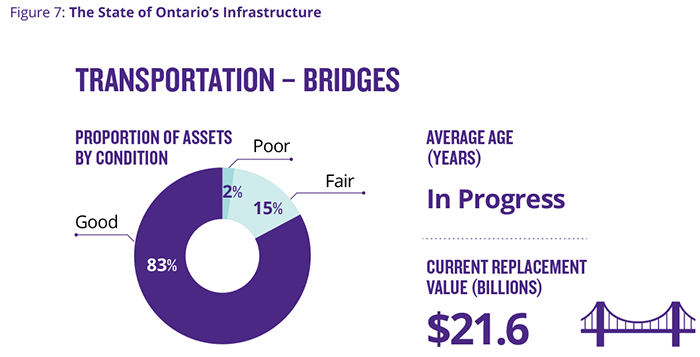
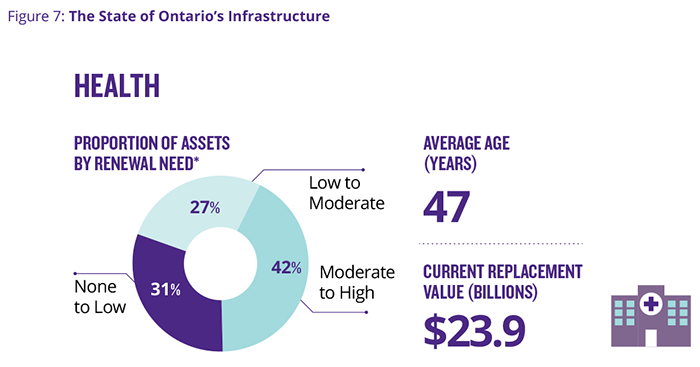
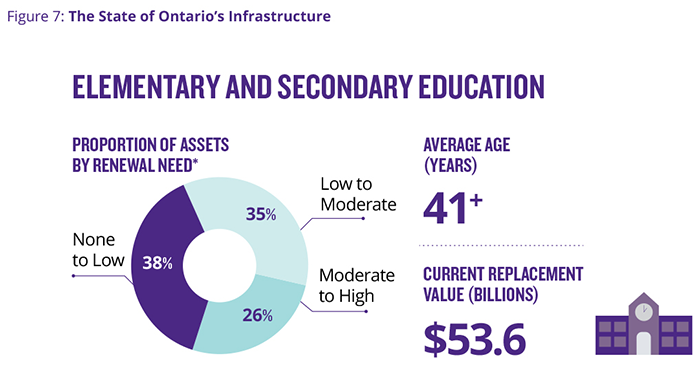
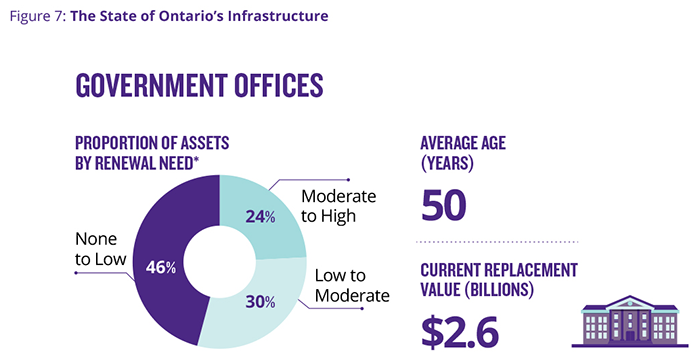
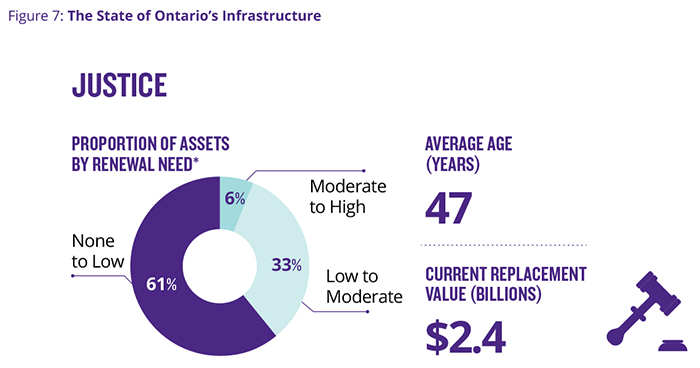
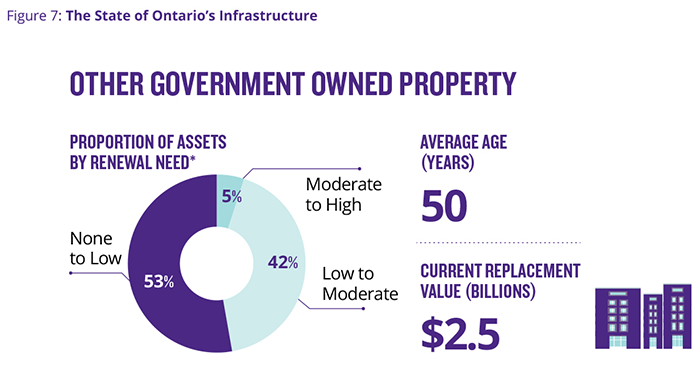
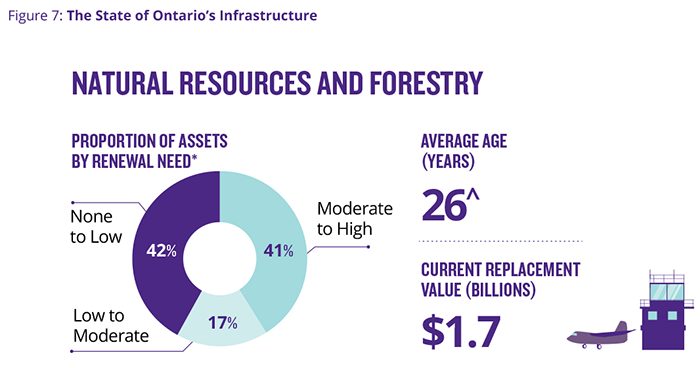
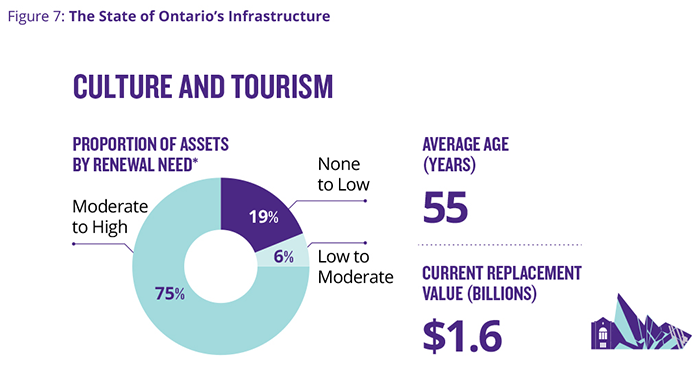
The sector profiles summarize the replacement value and average age and condition of assets. It should be noted that a moderate to high renewal need does not deem an asset to be unsafe or unfit to meet its functional needs. Also, while there are facility, bridge or pavement condition indices for most sectors, these indices are not necessarily comparable across sectors due to methodological differences.

The development of the asset inventory is a significant achievement, due to the size and scope of Ontario’s infrastructure portfolio. Ontario is a leader in this field.

This infographic highlights Ontario’s asset inventory portfolio across sectors. Each sector is categorized with a value according to its age, proportions of assets by condition or renewal need and the replacement value. For transportation - pavements, they have an average age of 11 years. 70 per cent of the pavements are in good condition, 25 per cent are in fair condition and 5 per cent in poor condition. The current replacement value is $50.6 billion dollars.


This infographic highlights Ontario’s asset inventory portfolio across sectors. Each sector is categorized with a value according to its age, proportions of assets by condition or renewal need and the replacement value. For transportation - structural culverts, the proportions that are in good condition are 65 per cent, while 24 per cent are in fair condition and 11 per cent are in poor condition.


This infographic highlights Ontario’s asset inventory portfolio across sectors. Each sector is categorized with a value according to its age, proportions of assets by condition or renewal need and the replacement value. For transportation - bridges, the proportions that are in good condition are 83 per cent, while 15 per cent are in fair condition and 2 per cent are in poor condition. The current replacement value is $21.6 billion dollars.


This infographic highlights Ontario’s asset inventory portfolio across sectors. Each sector is categorized with a value according to its age, proportions of assets by condition or renewal need and the replacement value. Health sector assets have an average age of 47 years. 31 per cent of assets have none to low renewal needs within the next 3 years, 27 per cent of assets have low to moderate renewal needs within the next 3 years, and 42 per cent have moderate to high renewal needs within the next 3 years. The current replacement value is $23.9 billion dollars.


This infographic highlights Ontario’s asset inventory portfolio across sectors. Each sector is categorized with a value according to its age, proportions of assets by condition or renewal need and the replacement value. Elementary and secondary education sector assets have an average age of 41 years. 38 per cent of assets have none to low renewal needs within the next 3 years, 35 per cent of assets have low to moderate renewal needs within the next 3 years, and 26 per cent have moderate to high renewal needs within the next 3 years. The current replacement value is $53.6 billion dollars.


This infographic highlights Ontario’s asset inventory portfolio across sectors. Each sector is categorized with a value according to its age, proportions of assets by condition or renewal need and the replacement value. Government offices have an average age of 50 years. 46 per cent of assets have none to low renewal needs within the next 3 years, 30 per cent of assets have low to moderate renewal needs within the next 3 years, and 24 per cent have moderate to high renewal needs within the next 3 years. The current replacement value is $2.6 billion dollars.


This infographic highlights Ontario’s asset inventory portfolio across sectors. Each sector is categorized with a value according to its age, proportions of assets by condition or renewal need and the replacement value. Justice assets have an average age of 47 years. 61 per cent of assets have none to low renewal needs within the next 3 years, 33 per cent of assets have low to moderate renewal needs within the next 3 years, and 6 per cent have moderate to high renewal needs within the next 3 years. The current replacement value is $2.4 billion dollars.


This infographic highlights Ontario’s asset inventory portfolio across sectors. Each sector is categorized with a value according to its age, proportions of assets by condition or renewal need and the replacement value. Other government-owned properties have an average age of 50 years. 53 per cent of assets have none to low renewal needs within the next 3 years, 42 per cent of assets have low to moderate renewal needs within the next 3 years, and 5 per cent have moderate to high renewal needs within the next 3 years. The current replacement value is $2.5 billion dollars.


This infographic highlights Ontario’s asset inventory portfolio across sectors. Each sector is categorized with a value according to its age, proportions of assets by condition or renewal need and the replacement value. Natural resources and forestry sector assets have an average age of 26 years. 42 per cent of assets have none to low renewal needs within the next 3 years, 17 per cent of assets have low to moderate renewal needs within the next 3 years, and 41 per cent have moderate to high renewal needs within the next 3 years. The current replacement value is $1.7 billion dollars.


This infographic highlights Ontario’s asset inventory portfolio across sectors. Each sector is categorized with a value according to its age, proportions of assets by condition or renewal need and the replacement value. Culture and tourism sector assets have an average age of 55 years. 19 per cent of assets have none to low renewal needs within the next 3 years, 6 per cent of assets have low to moderate renewal needs within the next 3 years, and 75 per cent have moderate to high renewal needs within the next 3 years. The current replacement value is $1.6 billion dollars.


Knowing what Ontario needs

The government needs strong evidence to ensure the right infrastructure is built in the right place at the right time in communities across Ontario. In recognition of this, the government uses and is continuing to develop a variety of tools to support evidence-based decision making for Ontario’s infrastructure planning. These tools and analyses will ensure that the Province meets the requirements for evidence-based decision making by May 2019, as required by the IJPA.

The Stable State model is one of these tools. It estimates how much investment the government needs to make to keep the current stock of infrastructure constant on a per-capita basis, using an appropriate mix of rehabilitation, replacement and expansion for demographic growth.

This model provides a much more robust estimate of the infrastructure renewal backlog than the government has ever had before, and is part of the government’s efforts to continually improve evidence-based decision making. Using the Stable State model, it can estimate both its current infrastructure renewal needs, as well as its future (20 years) renewal needs, according to different expenditure scenarios. For example, according to the model, as a result of the Province’s 13-year capital plan that started in 2014–15, the provincial infrastructure renewal backlog will decline to less than four per cent of the replacement value of all provincial infrastructure in ten years, from about eight per cent today.

This model contributes to the government’s understanding of long-term infrastructure needs, as well as to its understanding of the future fiscal implications of the investment decisions that it is making today. More detailed information on the Stable State model can be found in the Technical Appendix.

Developing a strategy to meet the Ontario’s needs

The government has made significant strides in asset data collection and analysis. Its next steps will be to expand the data collection and analysis related to infrastructure capacity, demand and utilization, and to strengthen Ontario’s infrastructure-planning and priority-setting process.

The government will be undertaking research to better understand the capacity of the current infrastructure that is in place. It will also be working to get a better understanding of the current and projected demand for services that the infrastructure delivers. This will help determine current and future utilization levels.

Understanding capacity, demand and utilization will help the government develop a strategy to meet Ontario’s infrastructure needs, based on the gap between capacity and demand. The strategy to close that gap could involve, among other actions, investing in new capacity, getting more out of existing capacity by using it more efficiently, or managing demand. Implementing this strategy could include actions such as improving and standardizing business cases and implementing asset management standards. The government will be working with all ministries across government and with municipalities to develop and implement this strategy. More information on developing the strategy is in the Technical Appendix.


Footnotes

  • footnote[18] Back to paragraph Consolidated assets are those that are owned by consolidated entities, such as school boards, hospital corporations and agencies of the Province.
  • footnote[19] Back to paragraph From Office of the Auditor General of Ontario.
  • footnote[20] Back to paragraph Analysis conducted by the Ministry of Infrastructure based on data from Statistics Canada and capital ministries.
  • footnote[21] Back to paragraph Transfer Payment Partner (TPPs) assets, including municipal assets and universities, are not consolidated onto the financial statements of the Province and are not included in the $209 billion. More-detailed information on the current replacement value can be found in the Technical Appendix.