Housing needs in Ontario
People across Ontario are struggling to find housing that meets their needs and their budget. Home prices in many cities have risen faster than incomes. Lengthy approvals and high costs have slowed the building of new housing and rentals. These challenges have made housing unaffordable for many people.
While most Ontario households live in acceptable housing — housing which is affordable, does not require major repairs, and is not overcrowded — the proportion of people experiencing challenges accessing acceptable housing has grown over the past decade. These challenges relate to both affordability and supply:
- affordability challenges, as house prices and rents have risen much faster than household incomes, creating a widening affordability gap
- housing need is more prevalent among some of Ontario’s most vulnerable groups
- insufficient supply, as substantial new rental construction is needed to keep up with population growth and demand
- aging social and affordable housing stock, as a large proportion of the most affordable housing, especially rental and government-subsidized housing, is 40 years old or more and at risk of loss due to poor condition
Housing affordability in Ontario
While the proportion of households experiencing suitability and adequacy issues has remained relatively stable over the past 10 years, the proportion who do not live in housing that is affordable has increased. Rents and house prices have increased rapidly over this period (Chart 3) but incomes have not risen at the same rate.
Income growth has been modest since 2000, especially for renters. Adjusted for inflation, median Ontario renter household income has increased 3.1%, while owner income has risen 11.6% (Ontario Ministry of Finance). While incomes have risen faster in the Toronto area, this area has also experienced higher price and rent growth.
Chart 3: Resale price growth in Ontario, 2008-2018
This chart shows year-over-year resale price growth trends for Ontario over the period from 2008 to 2018 based on Canadian Real Estate Association sales data for all resale house types. Price growth fell to -11.8% in December 2008, then rose rapidly to a high of +21.9% in February 2010. From 2011 to 2015, price growth remained low but relatively stable, ranging from +0.5% to +12.4%. Price growth increased steadily throughout 2016 and reached a peak in March 2017 at +28.5% before quickly falling to near zero for most of the remainder of 2017. Price growth fell again in 2018 to a low of -13.5% in March 2018, and returned to positive growth in June 2018.
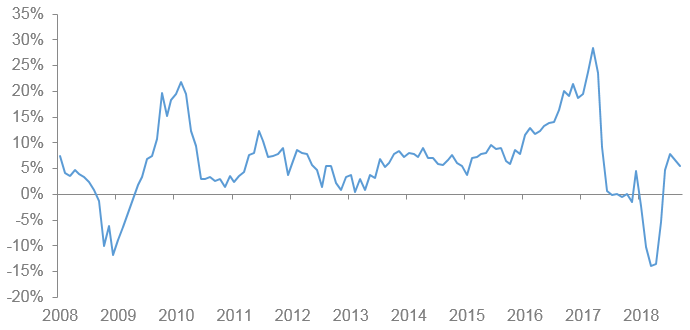
Source: Canadian Real Estate Association
Rental housing has traditionally provided the more affordable housing option in Ontario, especially in urban areas. However, rent growth has also accelerated recently (Chart 4) as the increase in rental supply has not kept pace with population growth and the increased need for housing. Vacancy rates, at 1.8% in 2018, have improved 0.2 percentage points from 2017, but are still at the second-lowest level since 2001. Only a small portion of new housing is rental construction.
Chart 4: Purpose-built apartments annual rent growth, Ontario, 2002–2018
This chart shows year-over-year growth in average market rents for purpose-built apartments in Ontario, based on Canada Mortgage and Housing Corporation Rental Market Survey data. 2002: 2.8%; 2003: 1.3%; 2004: 0.7%; 2005: 0.8%; 2006: 1.4%; 2007: 1.7%; 2008: 1.9%; 2009: 2.0%; 2010: 1.8%; 2011: 1.8%; 2012: 2.8%; 2013: 2.7%; 2014: 2.1%; 2015: 3.0%; 2016: 3.0%; 2017: 3.8%; 2018: 4.9%.
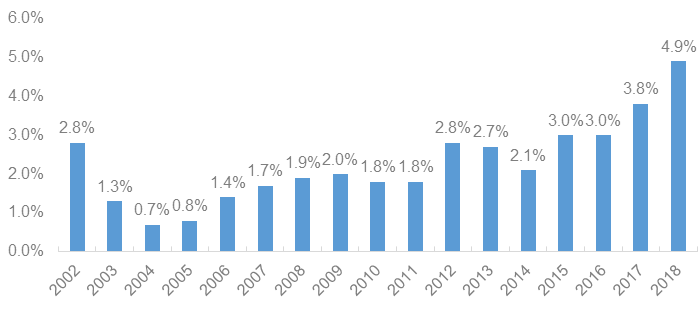
Source: Canada Mortgage and Housing Corporation
Creating sufficient new rental housing stock
New market rental housing
Rental housing construction in Ontario has lagged behind demand, contributing to tight market conditions and the need for more new rental supply, especially in the Toronto area. Since 2000, only 6.1% of all housing completions in Ontario have been purpose-built rental, compared to 14.9% for the previous decade (1990-1999).
Condominium developments are providing most of the new rental supply. Since 2000, 28.9% of housing completions have been condominium units, and about one-third of condominium units are rented in major Ontario centres. These condominium units usually have higher average monthly rents. In the Toronto area, condominium apartments have average monthly rents 63% higher than purpose-built apartments.
Community housing
No new housing has been constructed through social housing programs in Ontario since 1995, although social housing providers may have built additional housing under affordable housing programs. As community housing providers’ operating agreements expire, mortgages mature and buildings age, the social housing stock is slowly diminishing while demand continues to increase.
In 2017, 219,930 households were waiting for social housing units; however, only 13,858 households from the waitlists were housed in that same year (Ministry of Municipal Affairs and Housing, 2018 Social Housing Waitlist Survey).
Preserving existing rental housing stock
Market rental housing
Most of Ontario’s purpose-built rental supply is now 40 years old or more — 85% of all purpose-built units were built in 1980 or earlier (Chart 5). This aging stock is a much more affordable segment of the market rental sector, with a noticeable jump in average rent for units built since 2000 (Chart 6).
Community housing
Many of the housing system’s older units are at risk due to poor condition, especially in the community housing sector. While 6% of Ontario households report that their dwelling required major repairs in 2016, this figure was 8.7% for renter households, and 11.1% among renter households in subsidized housing (Statistics Canada, Census of Population 2016). In each case these rates are significantly higher for units built in 1980 or earlier.
In addition to the risk of losing this supply due to poor condition, much of Ontario’s community housing stock may be at risk as it may be converted to market-rate rentals after provider operating agreements expire. It is estimated that 83,000 units — about one-third of the total stock — will be affected, with operating agreements / mortgages for 50% of these units due to expire by 2020 and the remainder due to expire by 2033 (Auditor General of Ontario, Annual Report 2017).
Chart 5: Ontario purpose-built rental units by year of construction
This chart shows the proportion of purpose-built rental units in Ontario, grouped by year of construction. Pre-1961: 23%; 1961-1970: 33%; 1971-1980: 30%; 1981-1990: 7%; 1991-2000: 2%; 2001-2010: 3%; 2011+: 3%.
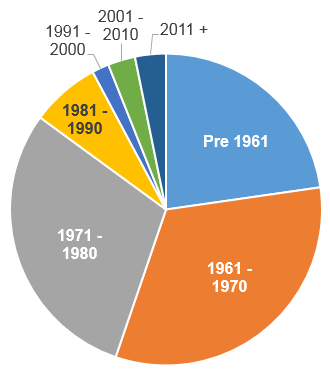
Source: Canada Mortgage and Housing Corporation
Chart 6: Ontario average market rent by year of construction
This chart shows average market rents for purpose-built rental units, grouped by year of construction. Pre-1961: $1,025; 1961-1970: $1,180; 1971-1980: $1,135; 1981-1990: $1,113; 1991-2000: $1,078; 2001-2010: $1,537; 2011+: $1,666.
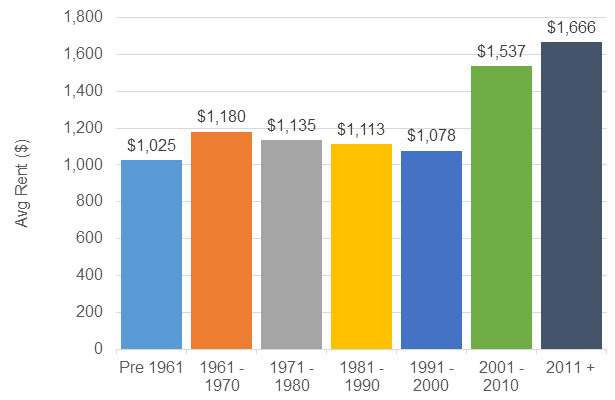
Source: Canada Mortgage and Housing Corporation
Incidence of housing need in Ontario: core housing need and low-income measure
Two different measures of poverty and housing need, Core Housing Need (CHN) and the Low-Income Measure, after tax (LIM-AT), each suggest about 15% of people in Ontario fall below the threshold for each measure, with about 750,000 households in CHN and 1.9 million people below the LIM-AT.
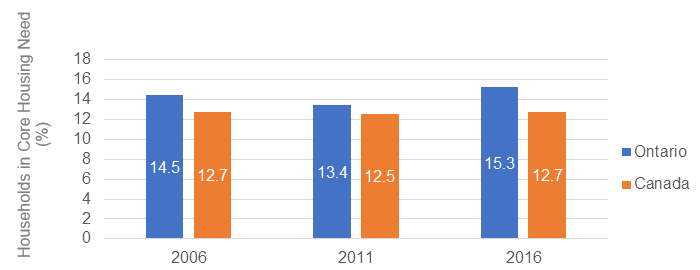
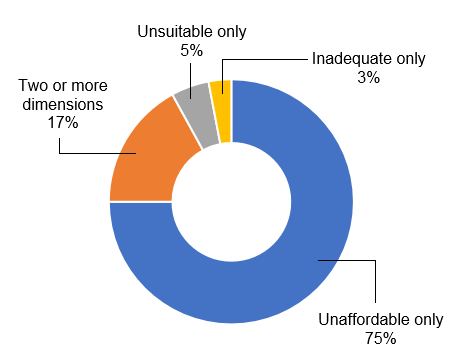
As of 2016, Ontario households experienced the highest rate of CHN among the provinces, with 15.3% of all households in CHN (Chart 7). This rate has risen nearly a full point over the past decade (from 14.5% in 2006), while Canada’s overall rate has remained steady at 12.7%. The most common reason for a household to be in CHN is affordability challenges: 75% of CHN in Ontario is due to unaffordability alone (Chart 8).
Chart 7: Incidence of core housing need, Ontario and Canada, 2006-2016
This chart compares the percentage of households in Core Housing Need for Ontario and Canada from 2006–2016. Ontario: 2006, 14.5%; 2011, 13.4%; 2016, 15.3%. Canada: 2006, 12.7%; 2011, 12.5%; 2016, 12.7%.
Source: Statistics Canada
Chart 8: Ontario 2016 core housing need by housing standards
This chart shows the proportion of Ontario households that were in Core Housing Need in 2016 due to each of the three underlying housing standards/dimensions. Unsuitable housing only: 5%; inadequate housing only: 3%; unaffordable housing only: 75%; two or more dimensions: 17%.
Source: Statistics Canada
Core housing need measures whether a household experiences problems relating to affordability (‘affordable’ is defined as paying less than 30% of income on shelter costs), suitability (enough space for the composition of the household) or adequacy (housing in good repair).
Deep core housing need is similar except it captures those paying 50% or more of income on shelter costs.
Low-income measure, after tax refers to a fixed percentage (50%) of median adjusted after-tax income of private households. When the unadjusted after-tax income of the household pertaining to a person falls below the threshold, the person is considered to be in low-income according to LIM-AT.
When these indicators of housing need are analyzed by certain subsets of the population, there are differences in how need is distributed, and the factors contributing to need are more significant (Table 2 and Chart 9).
Table 2: Housing standards for Ontario households by selected demographic groups
| Indicator | All Ontarians | Seniors | Indigenous | Immigrants |
|---|---|---|---|---|
| Households in core housing need | 748,310 | 217,305 | 32,260 | 336,875 |
| % Households in core housing need | 15.3 | 17.0 | 19.0 | 20.1 |
| % Households below affordability standard | 24.6 | 24.9 | 25.6 | 33.3 |
| % Households below suitability standard | 5.9 | 1.9 | 5.7 | 11.0 |
| % Households below adequacy standard | 6.0 | 4.5 | 11.7 | 5.1 |
| % Households in deep core housing need | 6.4 | 5.7 | 7.2 | 8.3 |
Source: Canada Mortgage and Housing Corporation
Seniors
Senior-led households have slightly elevated levels of need overall (17%) compared to all Ontario households (15.3%), but lower levels of unsuitability and inadequacy. Shelter costs for senior-led households are 31% lower than the overall average, so the affordability problems that this group experiences can be generally attributed to lower incomes.
An estimated 75,000 seniors currently live in social housing, approximately 30% of all social housing tenants, with another estimated 50,000 on social housing wait lists. As this population continues to increase, more accessibility supports will be needed for seniors to age in place.
Indigenous households (off-reserve)
Indigenous-led households living off-reserve experience significantly higher rates of Core Housing Need and deep core housing need. These households experience nearly twice the average rate of adequacy problems (11.7% vs. 6.0% overall). Nearly one-quarter (23.7%) of Indigenous individuals in Ontario were living below the low-income measure threshold in 2016.
Immigrants and refugees
The pattern of need for immigrant households is different from other households. The rate of adequacy problems is better than average, however they experience more issues with suitability (11.0% vs. 5.9% overall), indicating that many immigrant households cannot find housing with enough space for the number of occupants.
Over 450,000 refugees live in Ontario (about 12% of all Ontario immigrants and 3.4% of the Ontario population). Refugees live on significantly lower incomes on average than the population as a whole, with a median income 29% lower than the overall median. Nearly 30% are living below the low-income measure threshold.
Chart 9: Proportion of population in low-income after tax (LIM-AT) for selected demographics, Ontario 2016
This chart shows the proportion of the population falling below the Low-Income After Tax measure by demographic group for 2016. All Ontarians: 14.4%; seniors: 12.1%; Indigenous: 23.7%; immigrants: 17.8%; refugees: 29.4%; visible minority: 21.3%; women: 15%.
All Ontarians
Seniors
Indigenous
Immigrants
Refugees
Visible Minority
Women
Source: Statistics Canada
Visible minorities
Visible minorities comprise 29% of Ontario’s population and live on 26% less median income than the population as a whole. One-fifth (21.3%) live below the low-income measure threshold.
Women
Women in Ontario live on 28% lower median income than men overall, but experience only slightly higher rates of low-income (15% vs. 13.8%). One area of concern is lone-parent households. Women make up the vast majority of this group, which has a particular challenge of sufficient space. This is linked to the affordability challenges of single-income households.
Ontarians experiencing mental illness or substance dependence
While information on the housing situation of Ontarians experiencing mental illness or substance dependence is not available, these issues affect a large segment of the population. In 2017, 7.4% of Ontarians rated their perceived mental health as “fair” or “poor”; 8.5% reported a mood disorder, and 17.9% reported heavy drinking (Statistics Canada, Canadian Community Health Survey 2017). Mental health and substance dependence issues may contribute to difficulty accessing stable housing, and in some cases households will require housing with supports.