Schedules
Schedule 1
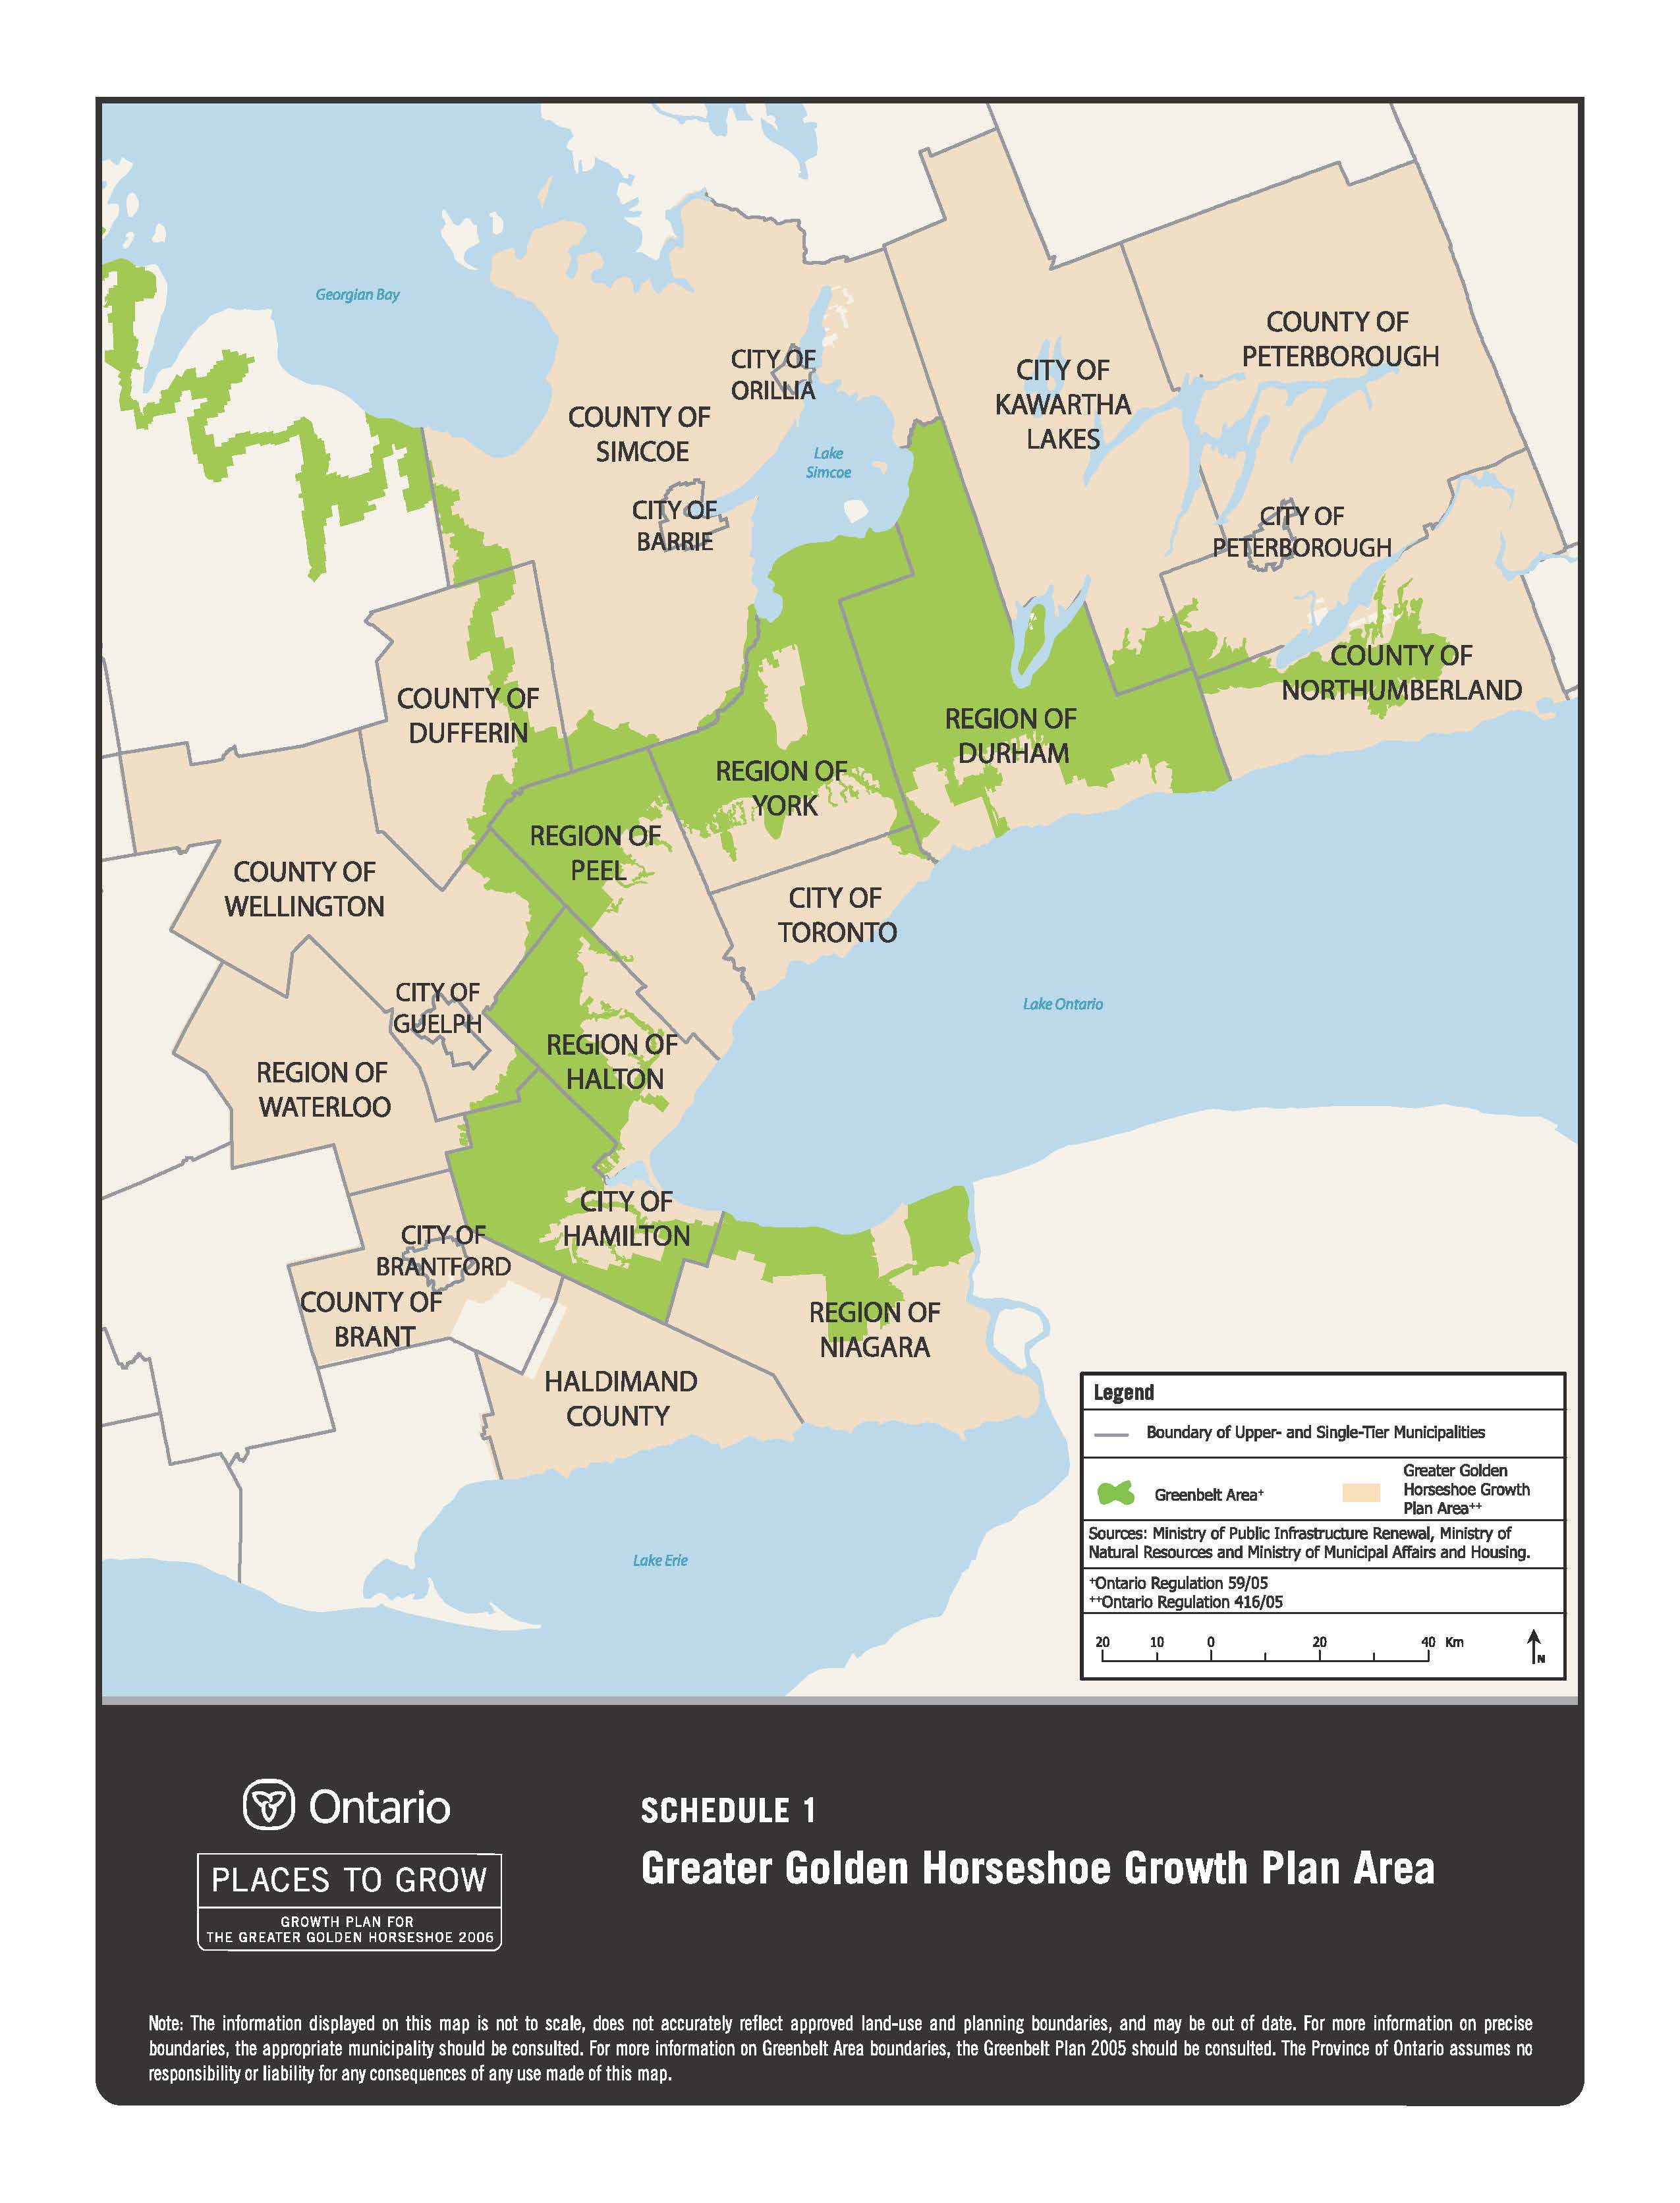
Schedule 1 - Greater Golden Horseshoe Growth Plan Area
Note: The information displayed on this map is not to scale, does not accurately reflect approved land-use and planning boundaries, and may be out of date. For more information on precise boundaries, the appropriate municipality should be consulted. For more information on Greenbelt Area boundaries, the Greenbelt Plan 2005 should be consulted. The Province of Ontario assumes no responsibility or liability for any consequences of any use made of this map.
Schedule 2
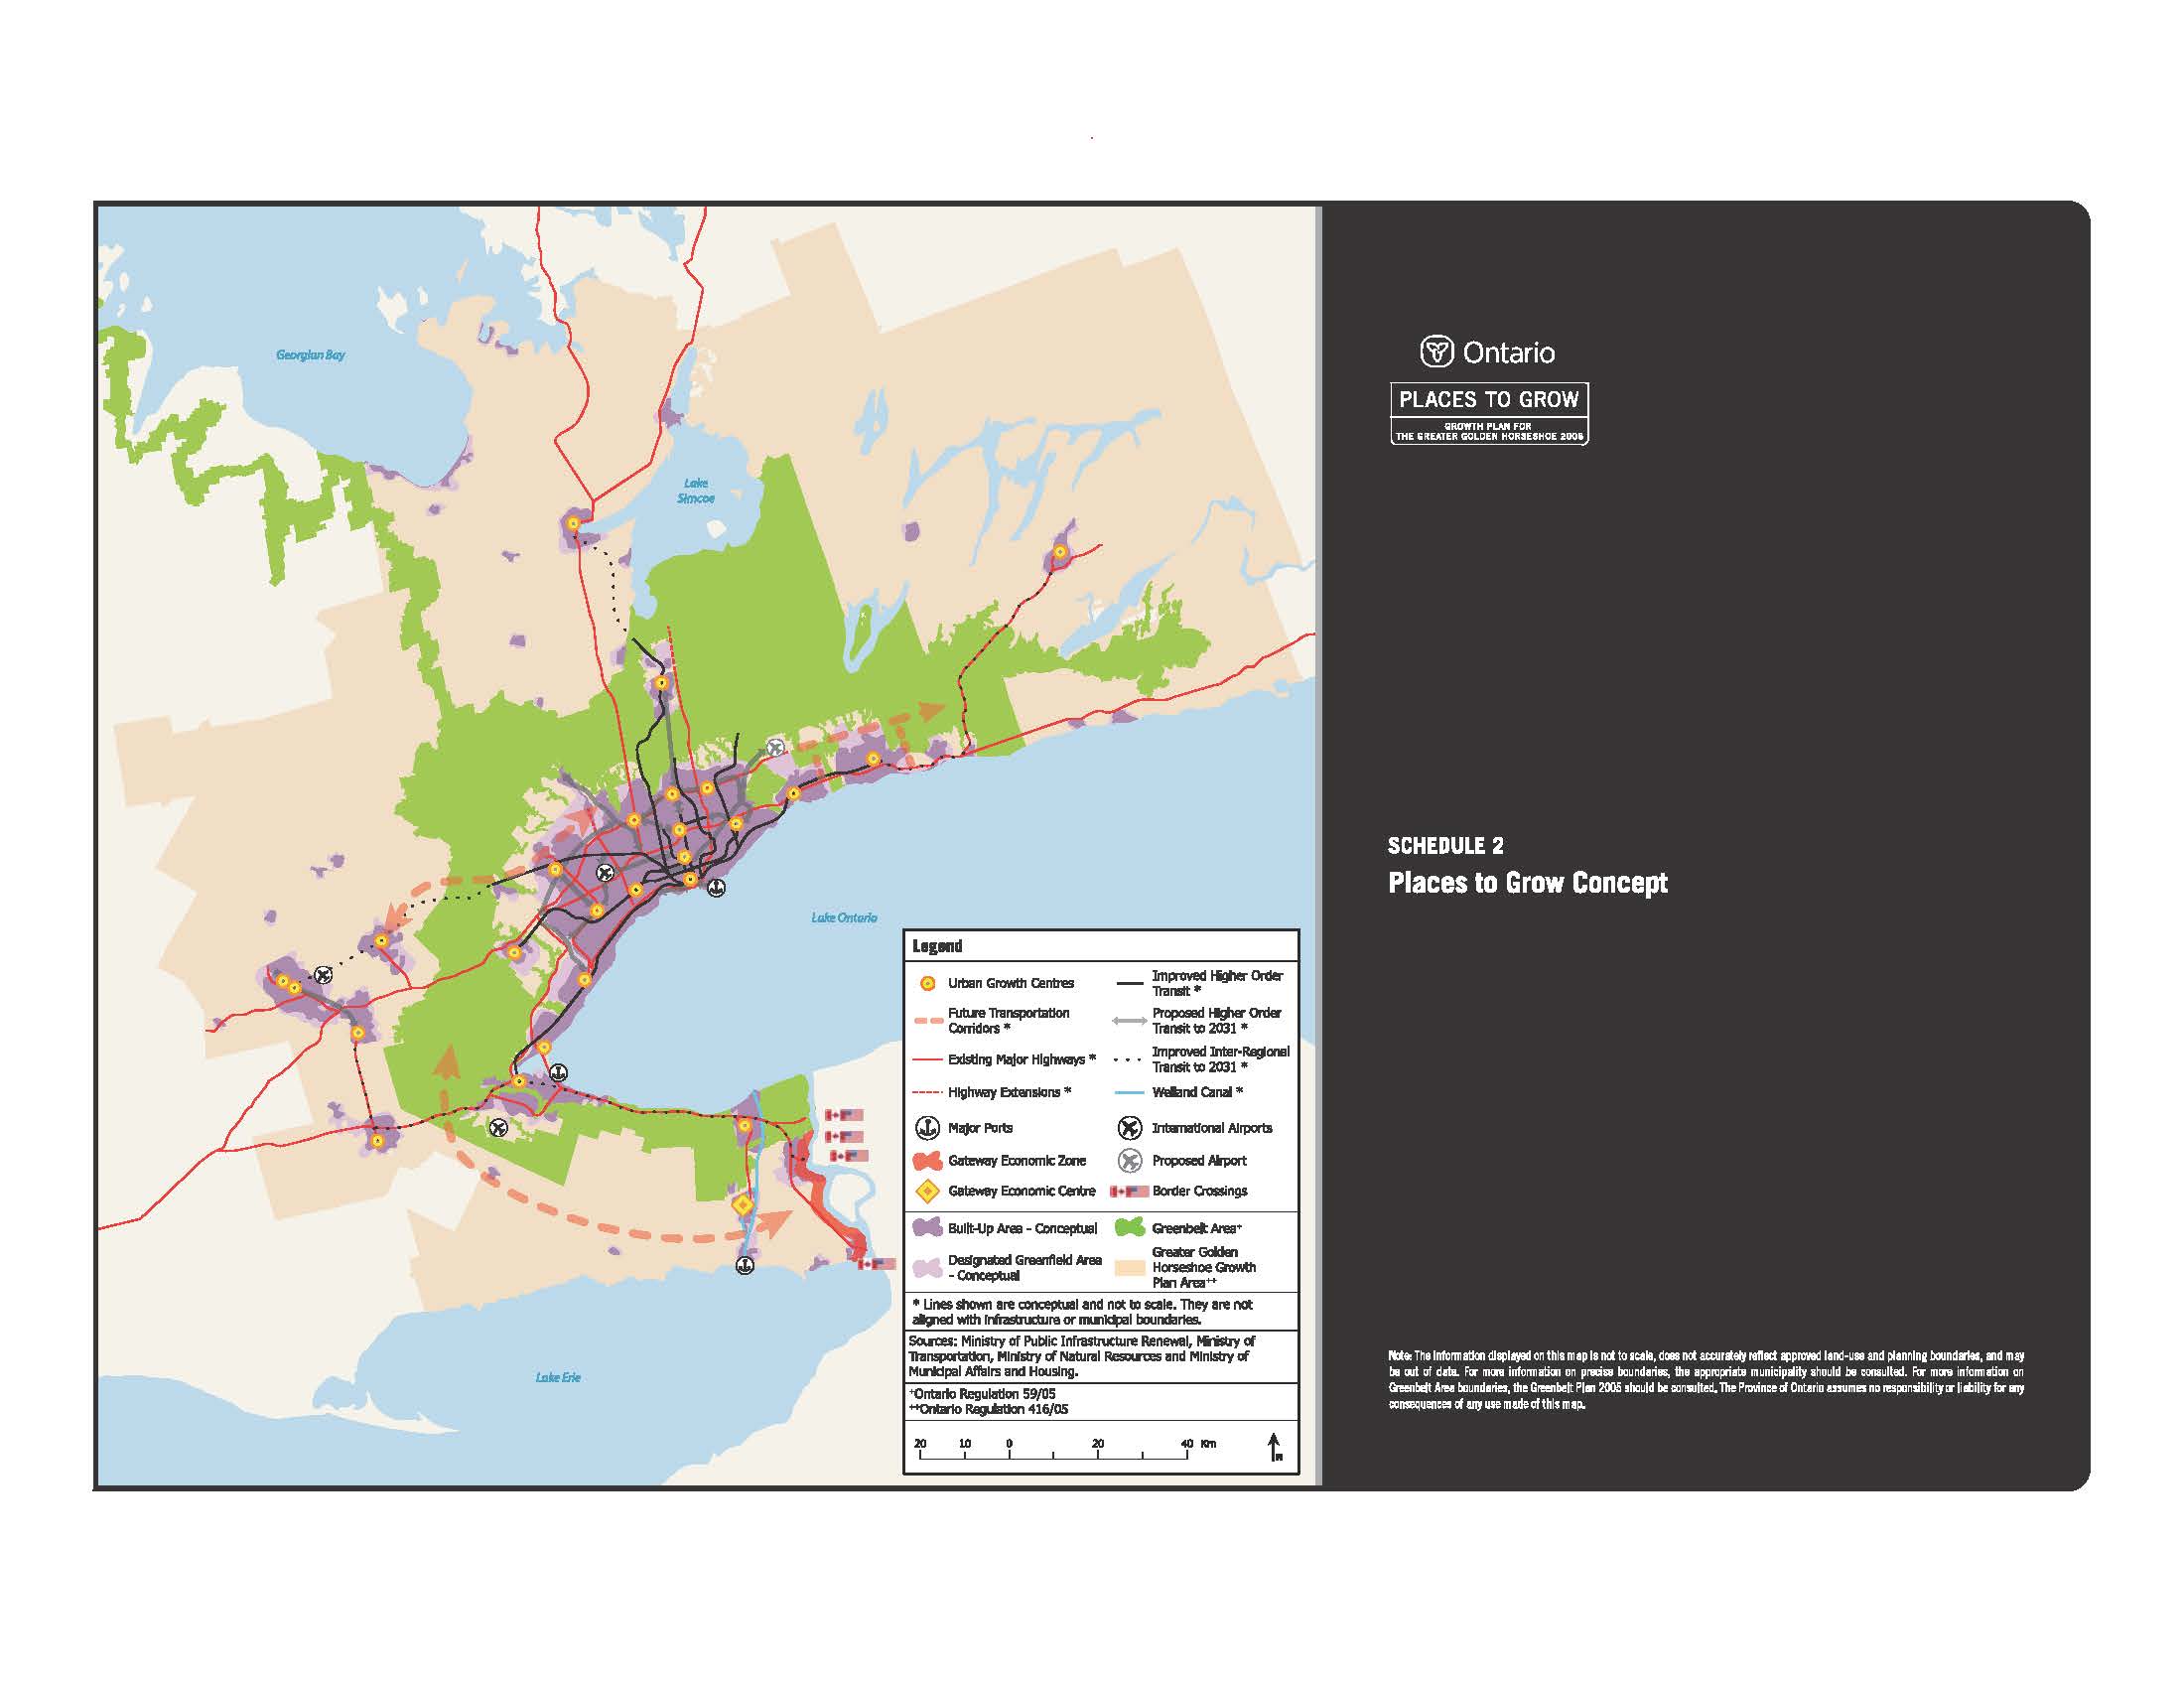
Schedule 2 - Places to Grow Concept
Note: The information displayed on this map is not to scale, does not accurately reflect approved land-use and planning boundaries, and may be out of date. For more information on precise boundaries, the appropriate municipality should be consulted. For more information on Greenbelt Area boundaries, the Greenbelt Plan 2005 should be consulted. The Province of Ontario assumes no responsibility or liability for any consequences of any use made of this map.
Schedule 3
|
Region |
Population 2001 | Population 2011 | Population 2021 | Population 2031 | Employment 2001 | Employment 2011 | Employment 2021 | Employment 2031 |
|---|---|---|---|---|---|---|---|---|
| Region of Durham | 530 | 660 | 810 | 960 | 190 | 260 | 310 | 350 |
| Region of York | 760 | 1,060 | 1,300 | 1,500 | 390 | 590 | 700 | 780 |
| City of Toronto | 2,590 | 2,760 | 2,930 | 3,080 | 1,440 | 1,540 | 1,600 | 1,640 |
| Region of Peel |
1,030 |
1,320 |
1,490 |
1,640 |
530 |
730 |
820 |
870 |
| Region of Halton |
390 |
520 |
650 |
780 |
190 |
280 |
340 |
390 |
| City of Hamilton |
510 |
540 |
590 |
660 |
210 |
230 |
270 |
300 |
| GTAH Total** |
5,810 |
6,860 |
7,770 |
8,620 |
2,950 |
3,630 |
4,040 |
4,330 |
| County of Northumberland |
80 |
87 |
93 |
96 |
29 |
32 |
33 |
33 |
| County of Peterborough* |
56 |
58 |
144 | 149 |
16 |
17 |
60 | 60 |
| City of Peterborough* |
74 |
79 |
144 | 149 |
37 |
41 |
60 | 60 |
| City of Kawartha Lakes |
72 |
80 |
91 | 100 |
20 |
23 |
25 | 27 |
| County of Simcoe* |
254 |
294 |
583 | 667 |
85 |
102 |
230 | 254 |
| City of Barrie* |
108 |
157 |
583 | 667 |
53 |
77 |
230 | 254 |
| City of Orillia* |
30 |
33 |
583 | 667 |
16 |
17 |
230 | 254 |
| County of Dufferin |
53 |
62 |
71 | 80 |
19 |
22 |
25 | 27 |
| County of Wellington* |
85 |
91 |
269 | 321 |
36 |
41 |
137 | 158 |
| City of Guelph* |
110 |
132 |
269 | 321 |
63 |
76 |
137 | 158 |
| Region of Waterloo |
456 |
526 |
623 | 729 |
236 |
282 |
324 | 366 |
| County of Brant* |
35 |
39 |
157 | 173 |
16 |
17 |
67 | 71 |
| City of Brantford* |
94 |
102 |
157 | 173 |
39 |
45 |
67 | 71 |
| County of Haldimand |
46 |
49 |
53 | 56 |
17 |
19 |
19 | 20 |
| Region of Niagara |
427 |
442 |
474 | 511 |
186 |
201 |
209 | 218 |
|
Outer Ring Total** |
1,980 |
2,230 |
2,560 | 2,880 |
870 |
1,010 |
1,130 | 1,240 |
|
Total GGH** |
7,790 |
9,090 |
10,330 | 11,500 |
3,810 |
4,640 |
5,170 | 5,560 |
Source: Hemson Consulting Ltd., “The Growth Outlook for the Greater Golden Horseshoe”, January 2005.
Note: Numbers rounded off to nearest 10,000 for GTAH municipalities, GTAH Total and Outer Ring Total and nearest 1,000 for outer ring municipalities.
* The 2011 forecasts were prepared (by Hemson Consulting Ltd.) during Winter 2005-2006, using data from the ‘Compact Scenario’ contained in “The Growth Outlook for the Greater Golden Horseshoe”, January 2005. Forecasts for these municipalities for 2021 and 2031 will be determined.
** Totals may not add up due to rounding.
Schedule 4
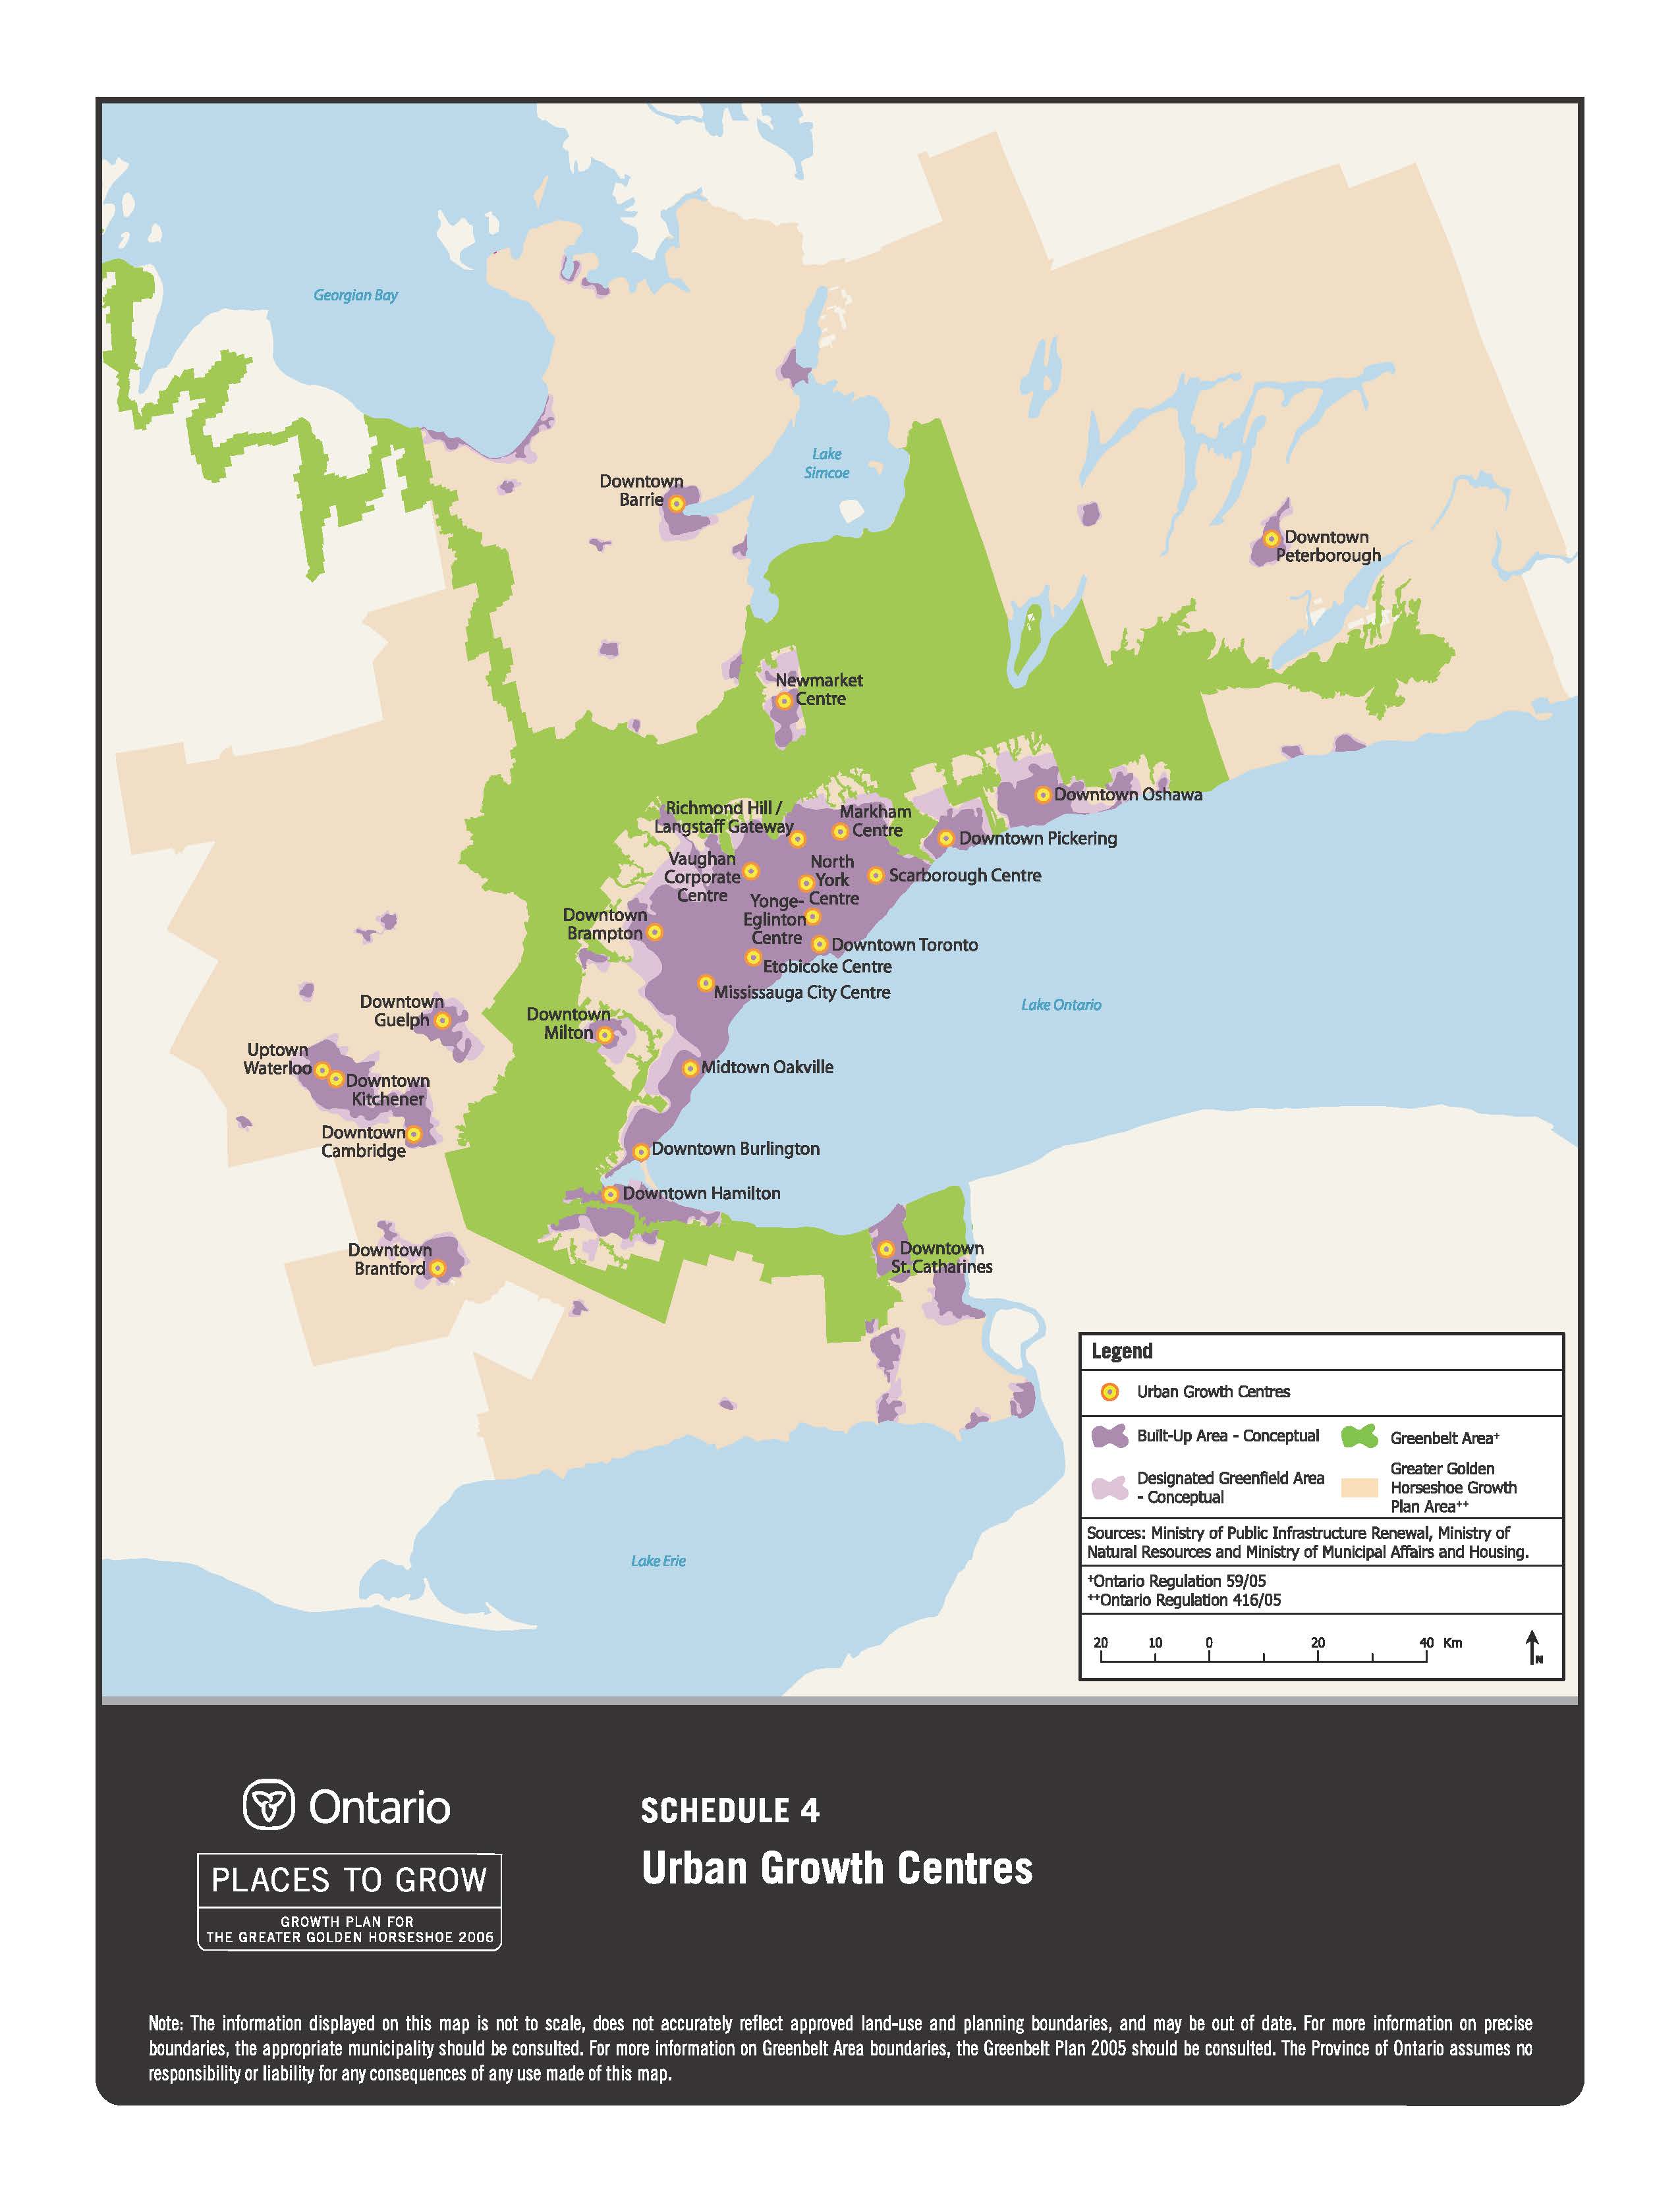
Schedule 4 - Urban Growth Centres
Note: The information displayed on this map is not to scale, does not accurately reflect approved land-use and planning boundaries, and may be out of date. For more information on precise boundaries, the appropriate municipality should be consulted. For more information on Greenbelt Area boundaries, the Greenbelt Plan 2005 should be consulted. The Province of Ontario assumes no responsibility or liability for any consequences of any use made of this map.
Schedule 5
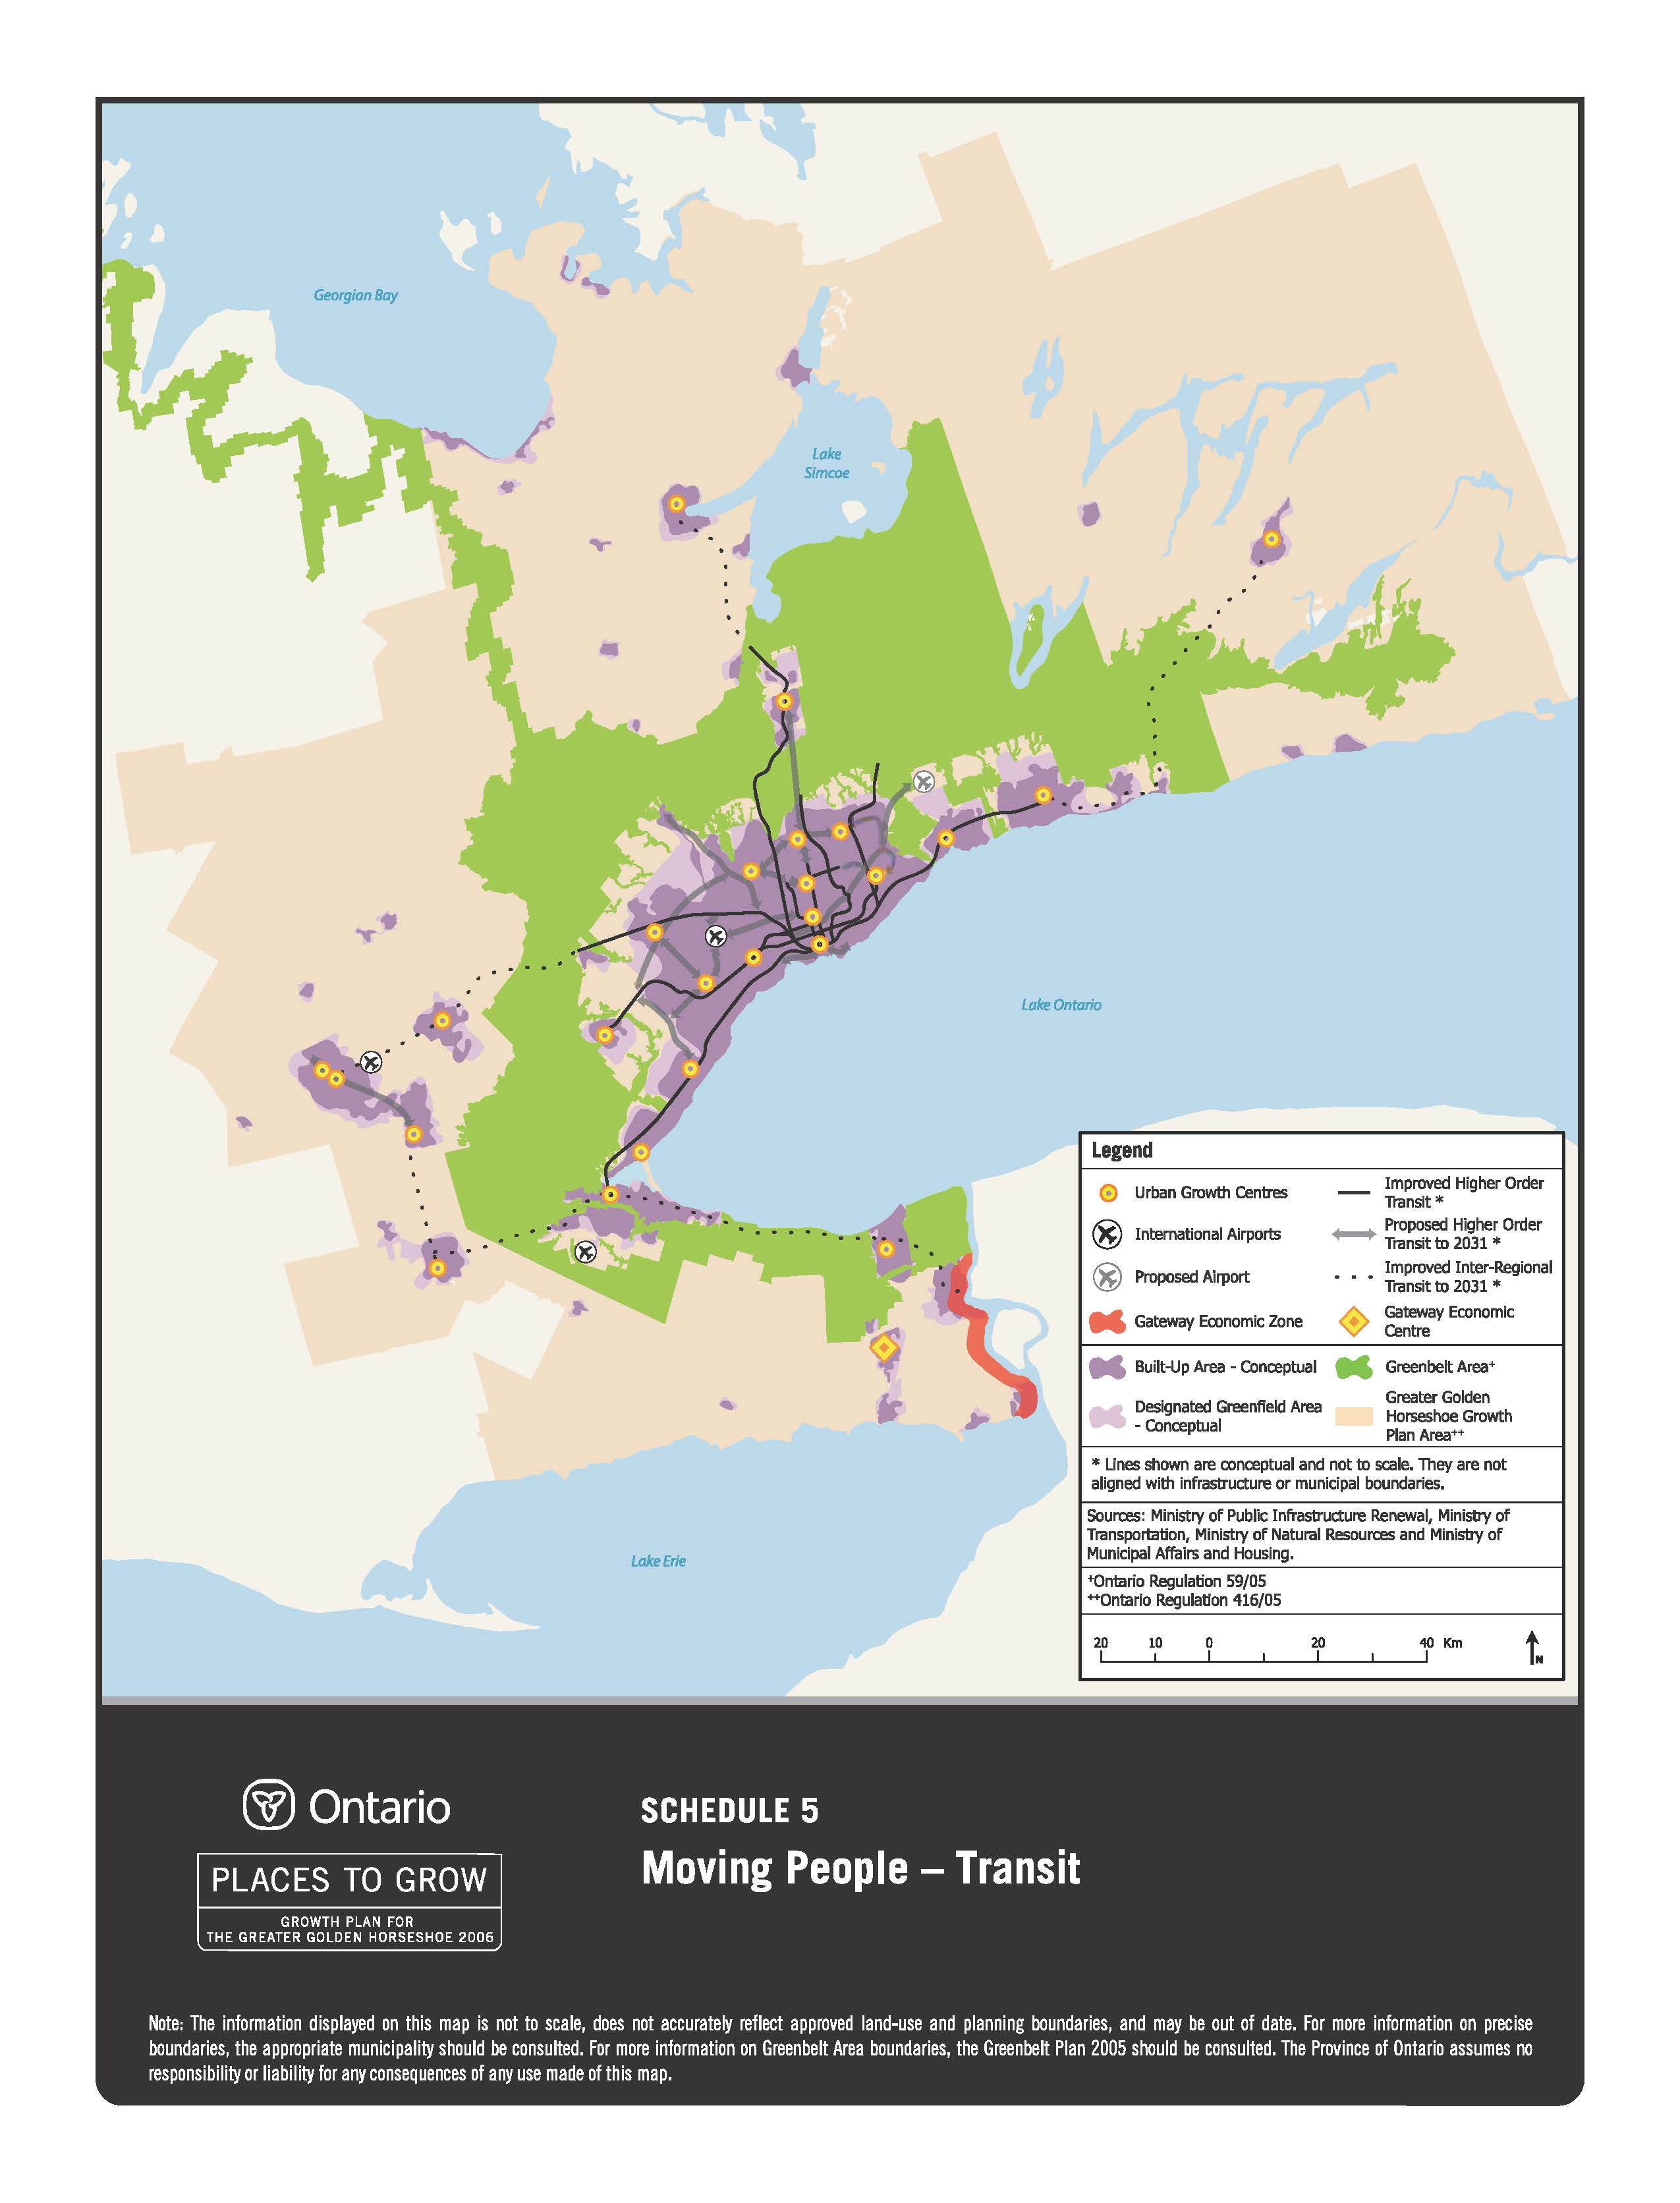
Schedule 5 - Moving People - Transit
Note: The information displayed on this map is not to scale, does not accurately reflect approved land-use and planning boundaries, and may be out of date. For more information on precise boundaries, the appropriate municipality should be consulted. For more information on Greenbelt Area boundaries, the Greenbelt Plan 2005 should be consulted. The Province of Ontario assumes no responsibility or liability for any consequences of any use made of this map.
Schedule 6
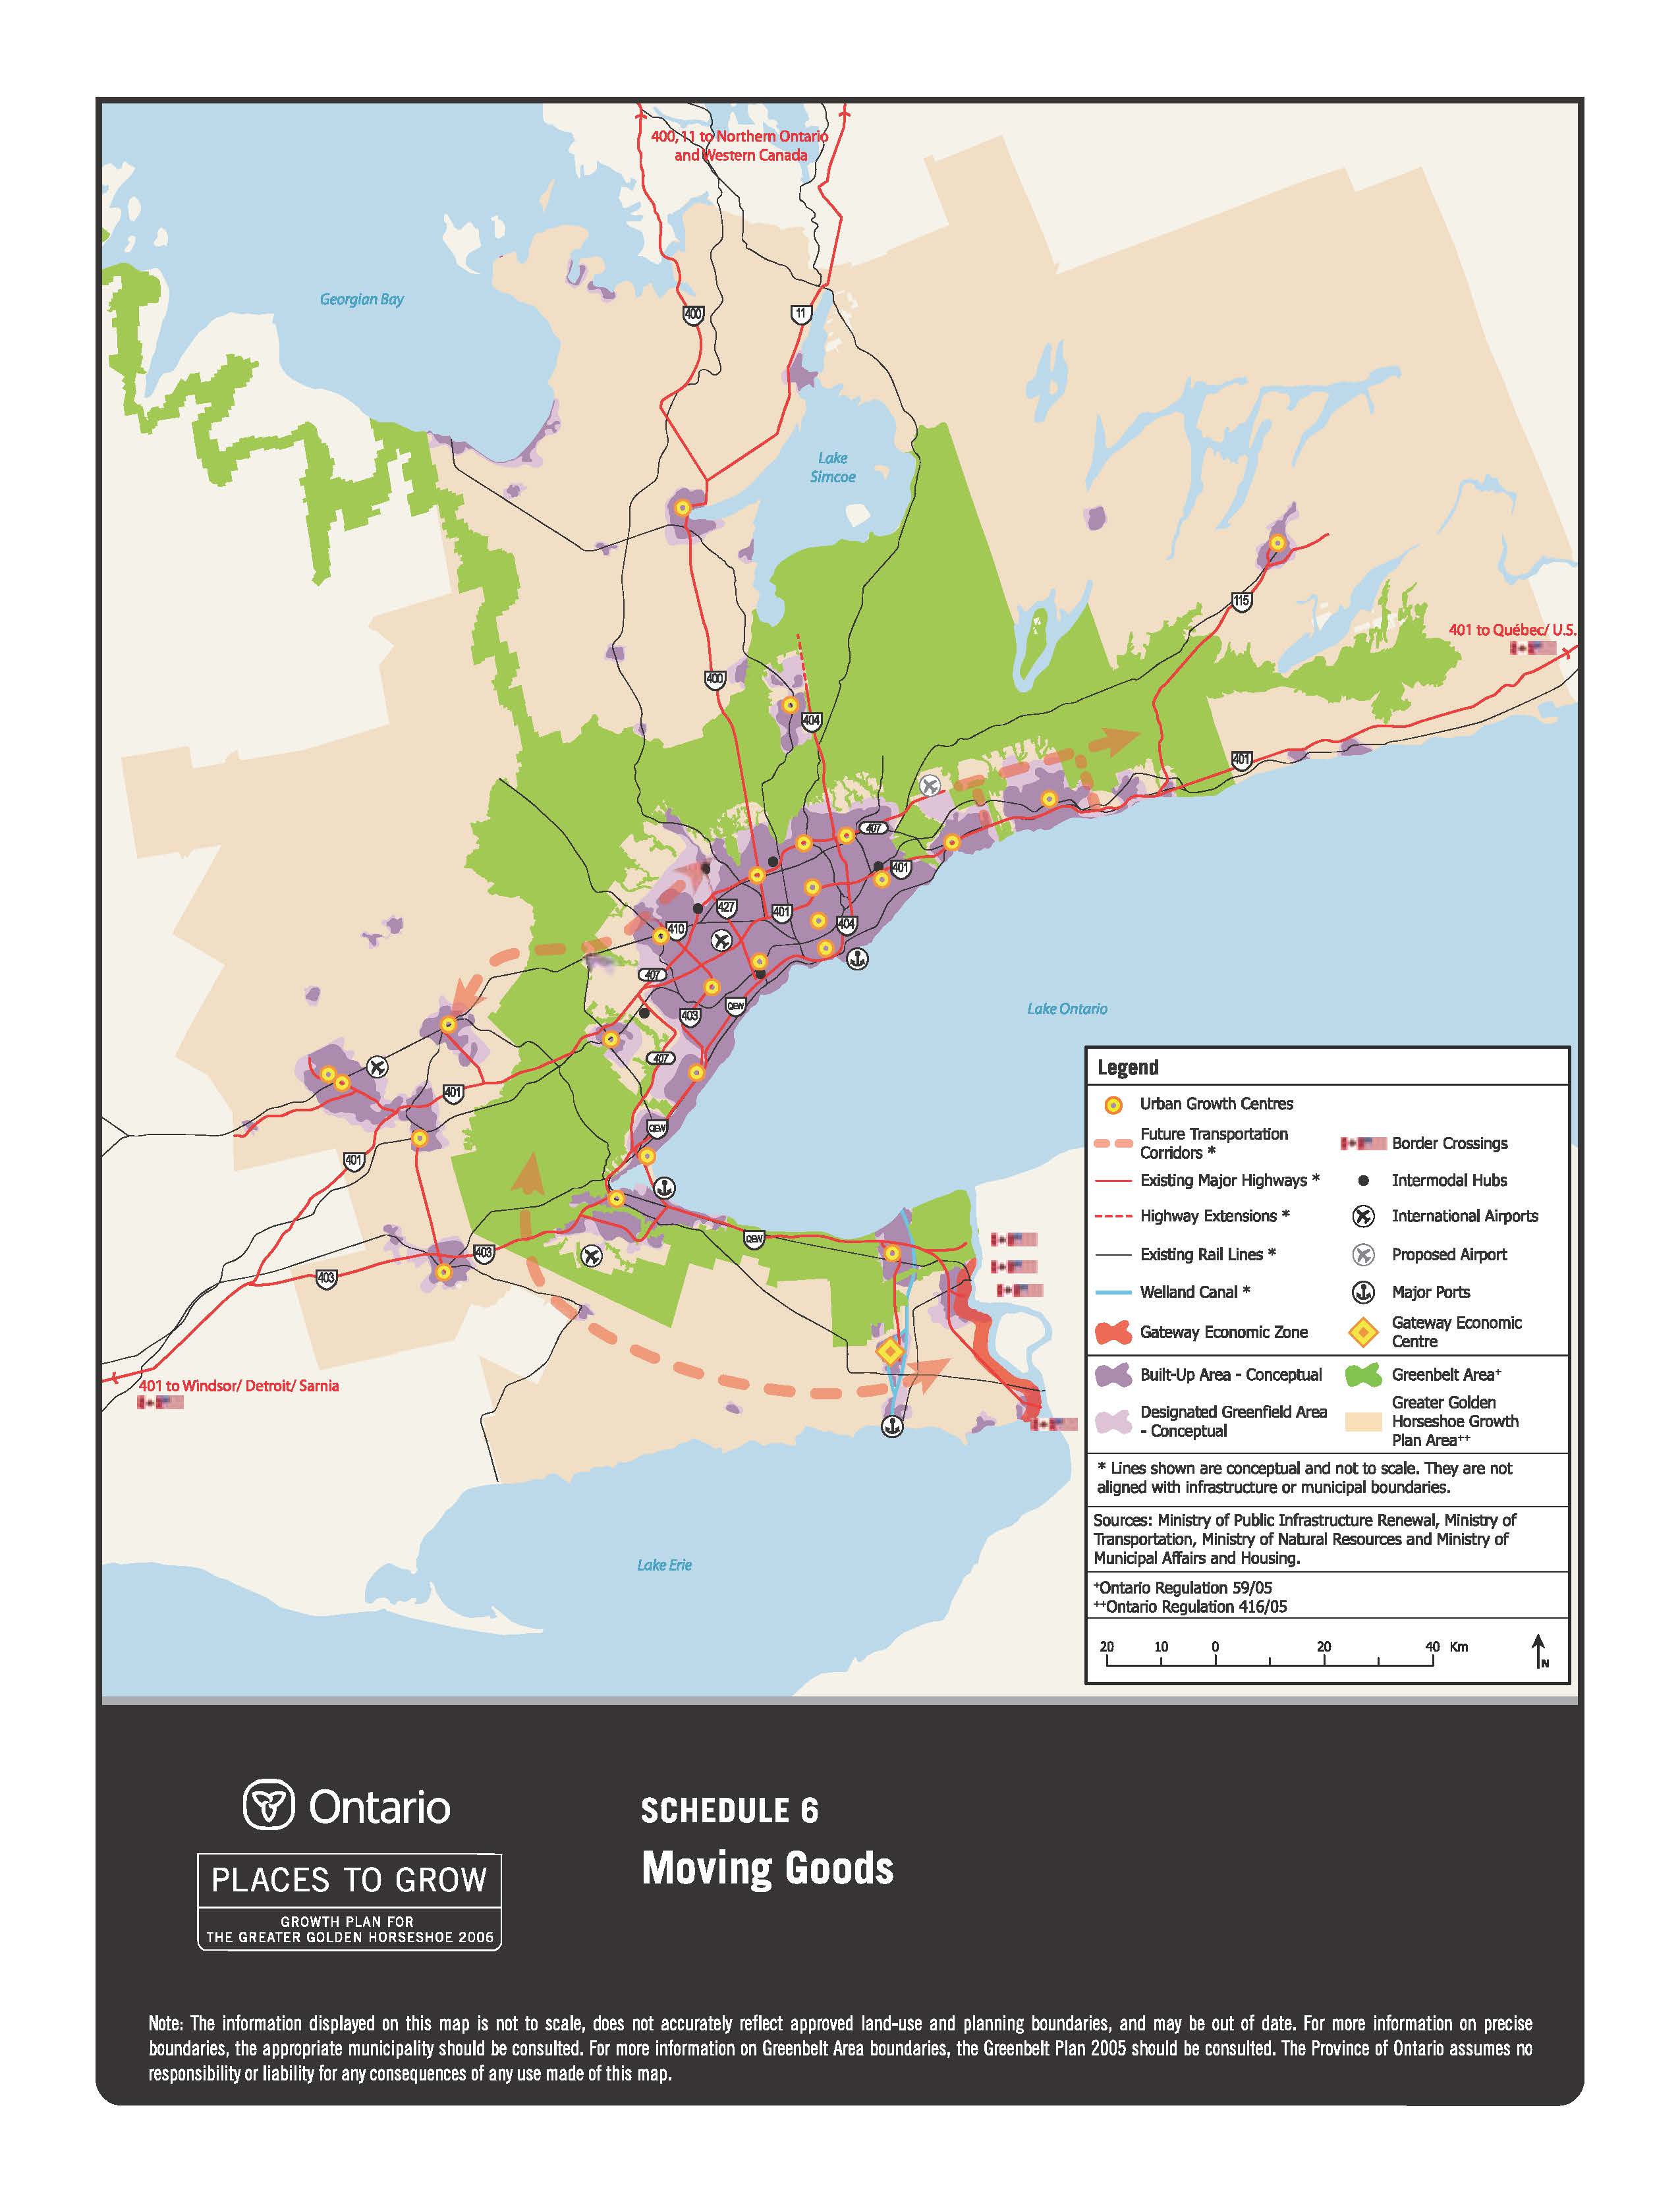
Schedule 6 - Moving Goods
Note: The information displayed on this map is not to scale, does not accurately reflect approved land-use and planning boundaries, and may be out of date. For more information on precise boundaries, the appropriate municipality should be consulted. For more information on Greenbelt Area boundaries, the Greenbelt Plan 2005 should be consulted. The Province of Ontario assumes no responsibility or liability for any consequences of any use made of this map.