Part H - Method ON-7: Determination of Size Distribution of Particulate Matter from Stationary Sources
Part H: Method ON-7: Determination of Size Distribution of Particulate Matter from Stationary Sources
Acknowledgement
This document is based on the State of California’s Air Resources Board - Method 501 (Determination of Size Distribution of Particulate Matter from Stationary Sources). It has been adapted to reflect requirements specific to Ontario.
1.0 Purpose
To determine the size distribution of particulate matter of a gas stream in a stack or duct, withdrawn under isokinetic conditions, segregated by size through inertial separation (cascade impactor) and determined gravimetrically.
2.0 Principle
An aerosol stream passes through a nozzle and impacts upon collection plates. Particles in the aerosol stream having large enough inertia will impact upon the collection plates while the other particles will follow the airflow through the impaction region.
Impaction occurs when the particle’s inertia overcomes the aerodynamic drag. Otherwise, the particle remains in the air stream and proceeds to the next stage. To keep the cut-point for each stage constant, the impactor is operated at a constant flow rate. At each stage, the particle impacts on a desiccated, tared glass fibre mat.
Each stage gives a cut-point based on aerodynamic diameter of the particle and the flow rate/face velocity. Aerodynamic diameter is defined as the diameter of a sphere of unit density (1.0 g/cm3) that attains the same terminal settling velocity as the actual particle under consideration.
Following sampling, the samples are cooled in a dessicator and weighed to 0.1 mg.
Note that for mathematical modeling purposes, it is convenient to express the behaviour of an irregularly shaped particulate specimen as if it were a spherical particle. Use of such common denominators makes it easier to predict, compare and correlate various materials. The Stokesian, or Equivalent Diameter is the diameter of a sphere having the same terminal settling velocity and density as the particle under consideration. Typically, the density of a particulate sample is not known during field sampling. All calculations in the field are therefore performed assuming unit particle density (1 g/cm3).
The assumed most significant negative bias with this approach is that spheres have the unique feature of being the most compact shape for the volume or surface area they possess. More irregular shaped (normal) particles will possess more surface than the sphere and will therefore fall more slowly because of the increased drag than their equivalent spherical diameter.
3.0 Applicability
This method is applicable to ducted source sampling environments with:
- a particulate mass concentration range of 0.00001 g /m3 (10 ug/m3) to 100 g/m3 (based on a pressure range between 125 to 500 mm of water gauge);
- a temperature range between 0°C and 450°C; and,
- a velocity between 3.0 and 30 m/s.
In general, the applicable range of solid particle separation using cascade impactors is between 0.30 and 20 microns in diameter.
This method is not applicable to high temperature, moisture saturated gas streams or fibrous material.
This method may be used as a screening tool for the determination of filterable PM10 and PM2.5 while conducting standard Method ON-5 sampling for total suspended particulate matter determination. The mass fractions obtained (from the cascade impactor sampling) are multiplied by the total PM emissions (minus the residual PM obtained from the back filter and probe/filter holder sample recovered).
Note: This variation of Method ON-5 accounts only for the PM10 and PM2.5 filterable fraction, and not the condensable fraction. For the condensable fraction, the US EPA Method 202 needs to be followed.
When using this method for PM10 and PM2.5 compliance testing, the Source Assessment Specialist needs to be contacted to approve its use.
Alternatively, the primary reference for PM10 and PM2.5 determination are the US EPA methods based on cut off cyclones to determine the filterable fractions, and the US EPA method 202 for the PM condensable fraction.
4.0 Apparatus
4.1 Sampling Train
A schematic diagram of the source test sampling train is presented in Figure 7-1. This train is similar to the Method ON-5 particulate sampling train. The schematic diagram shows the basic parts of the sampling train, including the right angle pre-collector and the cascade impactor mounted on a modified probe of a Method ON-5 sampling probe.
- Right Angle Pre-collector – serves to turn the sample stream through a 90° angle and help prevent overloading of first impactor stage. The curved nozzles used with Method ON-5 are not acceptable for use with particle sizing devices because of high particulate losses in the nozzle. Figure 7-2 shows a view of a right angle pre-collector.
- Cascade Impactor – consists of a threaded cylindrical casing, with up to 11 impaction jet stages, particle collection plate, threaded inlet and outlet sections, and a filter holder in the outlet section (for a 47 mm diameter final filter). It provides for up to 12 particle size classifications.
The preferred configuration is to use the single jet inlet followed by six (6) multi- jet stages with the collection plates and a filter.
Figure 7-3 shows a cross-section of the University of Washington 11-stage impactor, and Figure 7-4 illustrates the individual parts of a 7-stage impactor.
- Probe – Structurally stable, lined corrosion resistant metal liner, long enough to traverse at least half of the stack diameter, and capable of maintaining a gas temperature of 120°C at the exit end during sampling and including a probe temperature sensor.
- Pitot tube and Differential Pressure Gauge – S-type (Stausscheibe or reverse type) or standard type with tubing to connect the two pressure taps to inclined manometers or devices of equivalent sensitivity, readable to the nearest 0.10 mm H2O for ΔP values between 0.10 and 25 mm H2O. Velocity profile information is obtained prior to the sampling run by performing a velocity traverse using Method ON-2. The sampling flow rate, nozzle and sampling points are selected based on this velocity traverse.
- Temperature Sensors – Thermocouple or other calibrated device capable of measuring stack gas temperature to within 1.5% of the minimum temperature. Temperature sensor is used to measure the impactor exit gas temperature, the stack gas temperature, and the temperature of the gas in last impinger of the sampling train.
- Condenser – comprised of four impingers connected in series with leak-free fittings (e.g., ground glass). The first, third and fourth impingers are of the Greenburg-Smith design modified by replacing the tip with 1.3 cm I.D. glass tubing extending to about 1.3 cm from the bottom of the flask. The second impinger is of the standard Greenburg-Smith design. Known volumes of water are placed in the first and second impingers and a known weight of desiccant is placed in the fourth impinger. The impingers are maintained in an ice bath.
- Metering System – comprised of a vacuum gauge, leak-free pump with coarse and fine control valves, calibrated dry gas meter capable of measuring volume to within 2% and including an inlet and an outlet temperature sensor capable of measuring temperature to within 1°C or temperature compensation and a calibrated orifice meter.
- Barometer – mercury aneroid or other barometer capable of measuring atmospheric pressure to within 2.5 mm Hg. Alternatively, the daily atmospheric pressure is provided by Environment Canada may be used with an altitude adjustment for the sampling site at the rate of minus 2.5 mm per 30 meters of elevation increase or vice versa for elevation decrease.
- Gas Composition Determination Equipment – see Parts D and E (Methods ON-3 and ON-4)
4.2 Sample Recovery and Analysis Equipment
- Brushes – sized and shaped to clean out probe and nozzle; nylon bristles with stainless steel wire handle and extensions of stainless steel, Nylon, Teflon, or other inert material.
- Wash Bottles – glass or polyethylene; acetone should not be stored in polyethylene bottles for longer than one month.
- Liquid Sample Storage Containers – glass or polyethylene (500 or 1000 ml) with leak-free acetone resistant caps. Acetone samples should not be stored in polyethylene longer than one month.
- Storage Cylinder – for taking plates and stages from impactor.
- Petri Dishes – glass or polyethylene, large enough to hold unfolded substrate.
- Graduated Cylinder – with subdivisions no greater than 2 ml.
- Balance – capable of weighing impingers to the nearest 0.1 g.
- Dessicator.
- Analytical Balance – capable of weighing to the nearest 0.1 mg.
5.0 Reagents And Materials
5.1 Sample Collection
The following items are required for sample collection:
- Cascade Substrate – substrate material used depends on the sampling situations and the type of impactor used. The most commonly used are bare metal, greased metal, polypropylene coated metal, fibreglass and quartz.
Glass or quartz fibre mats are generally the Ministry’s preferred substrate choice. These mats provide a light-weight impaction surface, reducing re- entrainment due to particle bounce.
In hot gases containing sulphur oxides, glass fibre often exhibits gains in weight due to reaction with sulphur oxides and the formation of sulphates. In this case, (sulphuric) acid treated substrates need to be used. The manufacturer should be contacted when these filters are needed or the glass fibre mat can be acid treated following the procedure outlined in the State of California’s Air Resources Board - Method 501 (Chapter 4.1.2.3).
- Water – distilled or deionized. Run blank prior to field use to eliminate a high background on test samples.
- Silica Gel – new or fully regenerated, 6 to 16 mesh indicating type. To regenerate silica gel, dry at 175°C for 2 hours.
- Crushed Ice.
5.2 Sample Recovery
The following items are required for sample recovery:
- Acetone – reagent grade, 0.001% residue, in glass bottles.
- Water – distilled or deionized. Run blank prior to field use to eliminate a high background on test samples.
5.3 Sample Analysis
The following items are required for sample analyses:
- Acetone – reagent grade, 0.001% residue, in glass bottles.
- Desiccant – new or fully regenerated, self-indicating, e.g., 6 to 16 mesh silica gel.
6.0 Procedure
6.1 Sampling Equipment Preparation
- The Pitot tube, dry gas meter and orifice meter must be maintained in accordance with standard accepted procedures and calibrated prior to testing, in accordance with the procedures specified in Part C (Method ON-2, Chapter 7.1, Appendix 2A) and Part E (Method ON-4, Chapter 6.2 and Appendix 4B). Such calibration data must be available on request, prior to or during the actual testing and also must be submitted with the final report.
- Glass and quartz fibre substrates are checked visually against a light for irregularities and flaws or pinhole leaks. They are identified by appropriate labelling of their shipping containers (Petri dishes).
- Substrates are desiccated at 20°C ±6°C and ambient pressure for at least 24 hours and then weighed at intervals of at least 6 hours to a constant weight, i.e., 0.5 mg change from the previous reading. Weight of substrates is recorded to the nearest 0.1 mg. Record the substrates weighing room relative humidity which must not exceed 50% during weighing. The filter should not be exposed to the ambient atmosphere for longer than 2 minutes.
- Clean all parts of the cascade impactor of any dirt and soiling material, and inspect the material for plugged jets by holding the jet stage up to the light to determine if plugging exists. Then, assemble the impactor to check for missing parts.
6.2 Preliminary Survey
- Select the sampling site location and number of sampling points in accordance with Part B (Method ON-1).
- Determine gas flow parameters in order to prepare for actual sampling at isokinetic rates. Gas temperature, molecular weight, static pressure and the velocity profile (including cyclonic and reverse flow checks) are required parameters for this purpose. It is also important to know the range of particulate matter loading so that a sampling period can be established.
The parameters noted above can be determined by performance of methods outlined in Parts C to F (Methods ON-2 to ON-5). For this purpose Method ON-5 may be modified. For example, total sampling time may be reduced by decreasing the number of sampling points or the sampling time per point.
The information learned from such a test would include the gas temperature, velocity profile, moisture content and particulate matter loading. From this information, assuming the parameters of the source remain constant, isokinetic sampling rates can be calculated and the proper nozzle size determined. Also, the sampling period can be determined so as to meet the minimum criteria for particulate matter catch or total gas volume sampled.
The recommended isokinetic error limit for the above procedure is that each point sampled by an impactor should have a point velocity that is within 20% of the impactor inlet velocity. Each of the traverse points which would be used in a standard Method ON-5 run should be sampled. If the ratio of the minimum velocity to the maximum velocity is greater than 1.5, multiple impactor runs are required.
- Select a nozzle size and adjust the initial guess at the impactor flow rate so as to obtain the required sampling velocity for each traverse region.
- Make a preliminary guess for the impactor flow rate by calculating the time to collect a total sample of 50 mg particulate (sum of pre-collector, all stages and filter weights). The following equation is used for this calculation:
Equation 7-1
T50mg = 0.83335 ⁄ (Qi Ga)
Where:
- Qi
- actual impactor flow rate (m3/s)
- Ga
- mass loading (mg/m3)
When possible, 1-hour test-runs should be conducted; but, the minimum criteria for the actual testing period depends on the mass loading of the stack gas, the size distribution of the particles, and the gas flow rate in the sampler. If the results of a mass test are available, the mass loading can be obtained from them. If not, an estimate should be made based on the pre-test survey or other information. Given the mass concentration, an estimate of the sampling time for initial tests can be obtained from the nomograph shown in Figure 7-5.
The desired particle deposition on each of the collection plate substrate needs to be sufficient to weight (not less than 0.05 mg), but not too much that the particles overload the substrate (not more than 20 mg). The amount of particles that can be collected on a collection plate depends on the type of particles and the particle diameter. The larger particles are more likely to bounce or re-entrain.
- Depending on the gas stream particulate loading, multi-stage impactors can be assembled adding a pre-collector to knock out large diameter particles. Note that the pre-collector should only be used when heavy particulate loading is expected.
Select the stages that will give the desired stage cuts at this flow rate without resulting in particle bouncing or a very low Reynolds number. Most commercially available impactors come with fixed set of stages which are used at all times and no decision as to which stages to use is required. In some cases, a variety of stages are available and those most suitable to the sampling condition should be used.
If data regarding a particular particle diameter is desired, the cut point of two stages should bracket this diameter for reliable interpolation of the mass less than this diameter. If the target diameter is large, the cut point of the largest stage should be as close to the desired diameter as possible to reduce extrapolation errors.
6.3 Sampling Train Preparation
- Place about 100 ml of distilled or deionized water in each of the first 2 impingers and weigh each of the first three impingers and record to the nearest 0.5 g or measure the volume of water in each impinger to the nearest 1.0 ml.
- Place 200 to 300 g of desiccant in the fourth impinger, the weight being taken either directly or as the tared weight of desiccant and impinger and recorded to the nearest 0.5 g.
- Assemble the impactor with the selected impact plates and pre-weighed, numbered substrate (in a clean sheltered area). Attach to the impactor the calibrated nozzle and the precollector (if applicable). Conduct a preliminary leak check of the impactor/precollector combination. This leak check is optional. The purpose of this leak check is to catch and correct any leaks before sampling.
- Assemble the sampling train, keeping all openings where contamination could occur covered until just prior to assembly or until sampling is about to begin.
- A pre-test leak-check is required and it is performed according to the following procedure:
Pre-Test Leak-Check
- Plug the nozzle or inlet to the probe.
- Draw a vacuum of 380 mm Hg or the highest vacuum anticipated to occur during the test. The recommended procedure for drawing a vacuum is to start the pump with the bypass valve fully open and the coarse adjust valve completely closed. Partially open the coarse adjust valve and slowly close the bypass valve until the desired vacuum is reached. Do not reverse direction of the bypass valve; this will cause water to back up into the filter holder.
- Slowly remove the plug from the nozzle and immediately turn off the vacuum pump. This prevents the water in the impingers from being forced into the filter holder and silica gel from being entrained into the third impinger.
- Mark the probe with heat-resistant tape or other suitable means to enable to exact positioning of the probe at the sampling points.
- Clean the portholes prior to the test run to minimize the chance of sampling deposited material.
6.4 Sampling Train Operation
- Start the probe and heating system. Before commencing the test, verify that the heating system maintains a temperature of 120°C. Place crushed ice around the impingers (if this type of condensing apparatus is used).
- Remove any protective covering from the nozzle and position the nozzle at the first sampling point, ensuring that all components of the probe assembly are properly oriented with respect to the gas stream, i.e., nozzle and Pitot tube face opening planes are perpendicular to the direction of flow. Block off openings around the probe and porthole to prevent dilution of the gas stream.
- Immediately start the pump and adjust the flow rate to the pre-determined sampling rate. If the stack is under significant negative pressure (several centimetres of H2O) take care to close the coarse adjust valve before inserting the probe into the stack to prevent water from backing into the filter holder. If necessary, the pump may be turned on with the coarse adjust valve closed.
- Ensure that the probe nozzle does not make contact with the stack wall or ports, thus minimizing the chance of extracting deposited material.
- For each traverse, data are recorded according to the format shown in Part F (Method ON-5, Table 5-1). These data shall be recorded for each sampling point or velocity region selected (constant sampling rate with a nozzle chosen to be isokinetic, ±20%).
The dry gas meter volume is recorded at the start of the test and at the end of each of these time periods. The other information in the various columns is recorded at some time during each of the periods. Periodically check the gas flow rate through the test period to ensure isokinetic flow. To do this, record the gas meter volume and divide by the test-time. The gas sampling flow rate through the cascade impactor should remain constant during the test-run
- During the test run, ensure that the probe and filter bypass (or filter housing) are maintained at 120°C and that the temperature at the outlet of the impingers is less than 20°C. It may be necessary to add more ice and possibly salt to attain the required temperature. Periodically check the level and the zero of the manometer.
- If the pressure drop across the sampling train becomes too high, stop the test. Check for potential overloaded substrate. If it is suspected that the filter is overloaded, reject the test and repeat the test-run. A leak-check must be conducted before disassembling the train.
- At the end of the test-run, face the impactor downstream and close the course adjust valve, record the final dry gas meter reading. Remove the probe making sure not to bump the impactor against the stack wall or sampling ports. Turn off the pump.
Note:
No leak check should be performed after the particle sizing has been completed, as it will likely change the particle distribution in the fractionation head due to sudden changes in pressure and velocity.
6.5 Sample Recovery
- Upon removing the probe from the port, allow the sampling train to cool until it can be safely handled.
- Wipe off all external particulate matter near the tip of the probe nozzle, pre- collector and impactor. Place a cap over the nozzle probe to prevent the loss or contamination of the sample. The probe tip should not be tightly capped while the sampling train is cooling as this would create a vacuum in the filter bypass, thus drawing water from the impingers into the impactor.
- Remove the probe from the sampling train and cover the exposed end, being careful not to lose any sample in the probe. Remove the umbilical cord.
- The probe and impactor-impinger assembly should be removed to a clean and sheltered area; making sure that the impactor is maintained and transported in an upright position to avoid loss or shifting of PM among the unit stages.
- Inspect the components. Note and report any damage or abnormalities.
- Remove the nozzle-precollector and impactor from the probe. Carefully remove the plates or inserts using a pair of tweezers and clean disposable surgical gloves, and place them in Petri dishes. Label and seal each Petri dish.
- If it is desired to determine the moisture content of the exhaust gas, disassemble the impinger train. Weigh the impingers and their contents or seal the impingers for later weighing. Note and report the condition of the silica gel (i.e., the extent of saturation).
- Measure and record the amount of liquid caught in the first three impingers to the nearest 0.5 g or 1.0 ml.
6.6 Laboratory Analysis
- Transfer each collection plate inserts from the Petri dishes to a tared weighing dish. Desiccate for 24 hours at 20°C ± 6°C and ambient pressure. Then weigh them at intervals of at least 6 hours to a constant weight (report the weights to the nearest 0.1 mg.). Record the weighing room relative humidity, which must not exceed 50%. Samples should not be exposed to the ambient atmosphere for longer than 2 minutes.
If the sampled particulate matter is hygroscopic, a constant weight may be impossible to achieve. If this situation is encountered, the dry weight may be determined by weighing the sample at specific time intervals after removal from the dessicator (e.g., every 30 seconds), plotting the weight versus the time from removal and then extrapolating the graph to time zero to determine the desiccated weight.
- Retain all samples for at least 6 months after the test series. They are to be made available upon request by the Ministry.
- Calculate the change in weight for each collection plate insert. Add up the difference to get the total particulate matter collected by the cascade impactor. Divide the amount collected on each plate insert by the total amount collected, to find what percentage of the total particle weight was collected on each plate insert.
- For known materials, if using Stokes diameter, the particle density may be calculated from handbook values of the specific gravity of the material. For unknown materials, the particle density may be assumed to be 1.0 g/cm3 and the particle sizes reported as the equivalent aerodynamic diameter.
- Graph the results on log probability paper with the particle diameter (d) as the ordinate and cumulative percent by weight as the abscissa. It is recommended to draw the particle size distribution line through each of the data points (rather than trying to draw a straight or curved line) because this presents the data in an unedited format.
7.0 Theoretical Framework On Particles
The following information is aimed at providing a better understanding on particles and their characterization. This information was transcribed from the US EPA's Training module on Basic Concepts in Environmental Sciences.
7.1 Aerodynamic Diameter
Particles emitted from air pollution sources and formed by natural processes have a number of different shapes and densities as indicated in the following diagram.
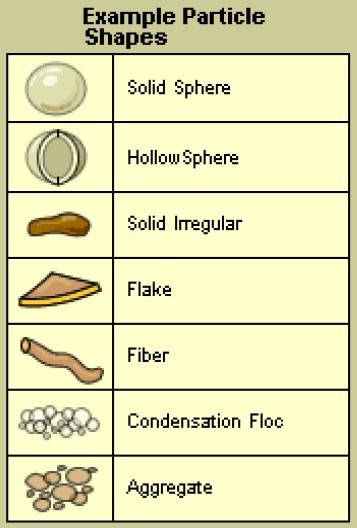
This image provides examples of particle shapes. The left hand side shows a picture with the right hand side describing the picture. There are seven particle shapes:
Solid sphere, hollow sphere, solid irregular, flake, fiber, condensation floc, and aggregate.
The photomicrograph below shows a variety of spherical particles and irregularly shaped particles collected on a polycarbonate filter.
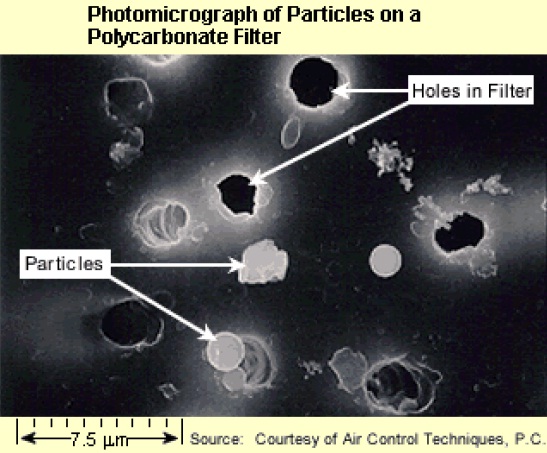
The image is of a photomicrograph of particles on a polycarbonate filter. The scale of the image is approximately 24.9 micrometers. The image has a dark black background and at random places on the background there are white circles with a gray fill representing particles, and white circles with a black fill representing holes in the filter.
Defining particle size for spherical particles is easy; it is simply the diameter of the particle. For non-spherical particles, the term “diameter” does not appear to be strictly applicable. For example, what is the diameter of a flake of material or a fibre? Also, particles of identical shape can be composed of quite different chemical compounds and, therefore, have different densities. The differences in shape and density could introduce considerable confusion in defining particle size.
In air pollution control, it is necessary to use a particle size definition that directly relates to how the particle behaves in a fluid such as air. The term “aerodynamic diameter” has been developed by aerosol physicists in order to provide a simple means of categorizing the sizes of particles having different shapes and densities with a single dimension. The aerodynamic diameter is the diameter of a spherical particle having a density of 1 gm/cm3 that has the same inertial properties in the gas as the particle of interest.
The aerodynamic diameter for all particles greater than 0.5 micrometer can be approximated using the following equation (Equation 7-2). Refer to aerosol textbooks to determine the aerodynamic diameter of particles less than 0.5 micrometer.
Equation 7-2

Where:
- dpa
- Aerodynamic particle diameter (µm)
- Dps
- Stokes diameter (µm)
- ρp
- Particle density (g/cm3)
Particle density affects the motion of a particle through a fluid and is taken into account in Equation 7-2. The Stokes diameter for a particle is the diameter of the sphere that has the same density and settling velocity as the particle. It is based on the aerodynamic drag force caused by the difference in velocity of the particle and the surrounding fluid. For smooth, spherical particles, the Stokes diameter is identical to the physical or actual diameter.
Inertial sampling devices such as cascade impactors are used for particle sizing. These sampling devices determine the aerodynamic diameter. The term “aerodynamic diameter” is useful for all particles including fibres and particle clusters. It is not a true size because “non-spherical” particles require more than one dimension to characterize their size.
Particles that appear to have different physical sizes and shapes can have the same aerodynamic diameter as illustrated below.
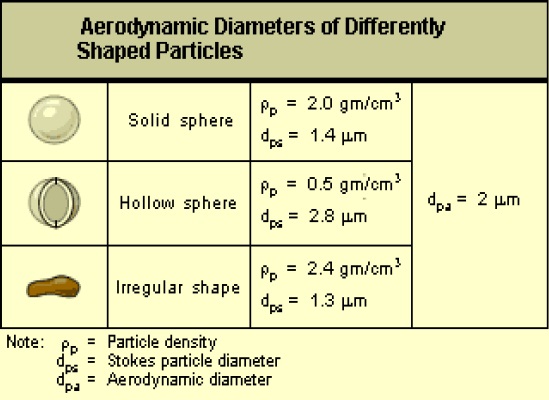
This image is of aerodynamic diameters of differently shaped particles. The image has three rows. The first row is a picture of a solid sphere with a particle density of 2.0 grams per cubic centimeter and a Stokes particle diameter of 1.4 micrometers. The second row has a picture of a hollow sphere with a particle density of 0.5 grams per cubic centimeter and a Stokes particle diameter of 2.8 micrometers. The third row has an image of an irregular shaped particle with a particle density of 2.4 grams per cubic centimeter and a Stokes particle diameter of 1.3 micrometers.
All three rows have an aerodynamic particle diameter of 2 micrometers.
Conversely some particles that appear to be visually similar can have somewhat different aerodynamic diameters as illustrated below.
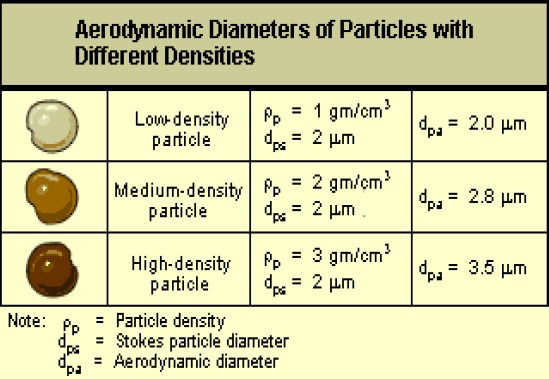
This figure shows the aerodynamic diameters of particles with different densities. The image has three rows. The first row shows a low-density particle with a particle density of 1 gram per cubic centimeter, a Stokes particle diameter of 2 micrometers, and an aerodynamic diameter of 2.0 micrometers. The second row shows a medium-density particle with a particle density of 2 grams per cubic centimeter, a Stokes particle diameter of 2 micrometers, and an aerodynamic diameter of 2.8 micrometers. The third row shows a high-density particle with a particle density of 3 grams per cubic centimeter, a Stokes particle diameter of 2 micrometers, and an aerodynamic diameter of 3.5 micrometers.
7.2 Particle Size Categories
7.2.1 Particle Size Terminology
Since the range of particle sizes of concern for air emission evaluation is quite broad it is beneficial to divide this range into smaller categories. Defining different size categories is useful since particles of different sizes behave differently in the atmosphere and the respiratory system.
The following table displays the particle size terminology along with the corresponding particle sizes.
| Description | Particle Size |
|---|---|
| Super-coarse | dpa > 10 µm |
| Coarse | 2.5 µm < dpa ≤ 10 µm |
| Fine | 0.1 µm < dpa ≤ 2.5 µm |
| Ultra-fine | dpa ≤ 0.1 µm |
The following diagram provides a visual comparison of the size of a fine particle (1.0 µm), coarse particle (10 µm), and a super-coarse particle (100 µm). There is a substantial difference in size between these particles, all of which are considered moderate-to-large in air pollution control.
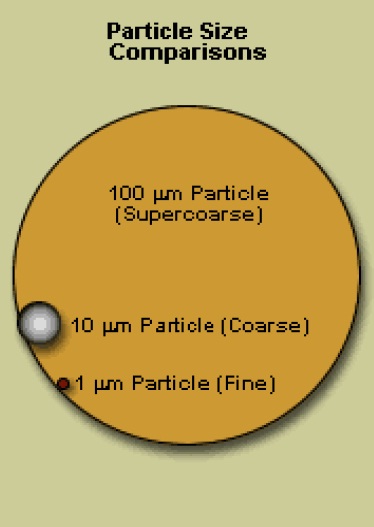
This image illustrates particle size comparisons. It shows a black circle with orange fill which represents the size of a 100 micrometer supercoarse particle. On the left side of the circle is a black circle with a gray to white gradient fill that represents the size of a 10 micrometer particle. This circle is approximately 10 times smaller than the orange circle. Below the 10 micrometer coarse particle is a red circle representing the size of a 1 micrometer fine particle. This red dot is approximately 10 times smaller than the 10 micrometer coarse particle.
7.2.2 Particulate Matter Categories
In addition to the terminology provided in the previous table, the particles are categorized as follows:
- Total Suspended Particulate Matter (TSP);
- PM10;
- PM2.5; and,
- Condensable Particulate Matter.
7.2.2.1 Total Suspended Particulate Matter
Particles ranging in size from 0.3 micrometer to about 40 micrometer in diameter are referred to as total suspended particulate matter (TSP). TSP includes a broad range of particle sizes including fine, coarse, and super-coarse particles.
7.2.2.2 PM10
PM10 is defined as the sum of both the filterable particulate matter fraction with an aerodynamic diameter of 10 micrometers and less, and the condensable particulate matter fraction.
PM10 is considered a specific type of contaminant because this size range is considered respirable. In other words, particles less than approximately 10 micrometers can penetrate into the lower respiratory tract. The particle size range between 0.1 and 10 micrometers is especially important in air pollution studies. A major fraction of the particulate matter generated in some industrial sources is in this size range.
7.2.2.3 PM2.5
PM2.5 is defined as the sum of both the filterable particulate matter fraction with an aerodynamic diameter of 2.5 micrometers and less, and the condensable particulate matter fraction.
PM2.5 particles settle quite slowly in the atmosphere relative to coarse and supercoarse particles. Normal weather patterns can keep PM2.5 particles airborne for several hours to several days and enable these particles to cover hundreds of miles. PM2.5 particles can cause health problems due to their potentially long airborne retention time and the inability of the human respiratory system to defend itself against particles of this size.
In addition, the chemical makeup of PM2.5 particles is quite different than for coarse and supercoarse particles. US EPA data indicate that PM2.5 particles are composed primarily of sulphates, nitrates, organic compounds, and ammonium compounds. The US EPA also determined that PM2.5 particles often contain acidic materials, metals and other contaminants believed to be associated with adverse health effects.
7.2.2.4 Condensable Particulate Matter
Particulate matter that forms from condensing gases or vapours is referred to as condensable particulate matter. Condensable particulate matter forms by chemical reactions as well as by physical phenomena.
Condensable particulate matter is usually formed from material that is not particulate matter at stack conditions but which condenses and/or reacts upon cooling and dilution in the ambient air to form particulate matter. The formation of condensable particulate matter occurs within a few seconds after discharge from the stack.
From a health standpoint, condensable particulate matter is important because it is almost entirely contained in the PM2.5 classification.
7.3 Particle Size Distribution
7.3.1 Interpretation of Raw Data
Particulate matter for size distribution evaluation is measured in a variety of ways. The data must be measured in a manner whereby it can be classified into successive particle diameter size categories.
In the case of cascade impactors, particulate matter is separated into diameter size categories within the impactor head during sampling. The mass of particulate matter contained within each size range is recovered and determined gravimetrically.
7.3.2 Sample Calculations
Calculation of both the mass median particle diameter and the geometric standard deviation for the following log-normal distribution data.
| Size Range (µm) |
dpa min (µm) |
Concentration (µg/m3) |
% Mass in Size Range | Cum. % Mass < dpa min |
|---|---|---|---|---|
| 0 to 2 | - | 1.0 | 0.5 | - |
| 2 to 4 | 2 | 14.5 | 7.25 | 0.5 |
| 4 to 6 | 4 | 24.7 | 12.35 | 7.75 |
| 6 to 10 | 6 | 59.8 | 29.90 | 20.1 |
| 10 to 20 | 10 | 68.3 | 34.15 | 50.0 |
| 20 to 40 | 20 | 28.9 | 14.45 | 84.13 |
| > 40 | 40 | 2.8 | 1.4 | 98.6 |
| Total = 200.0 | Total = 100.0 |
Procedure
- Plot the distribution data from the above table on log-probability paper, as illustrated below:
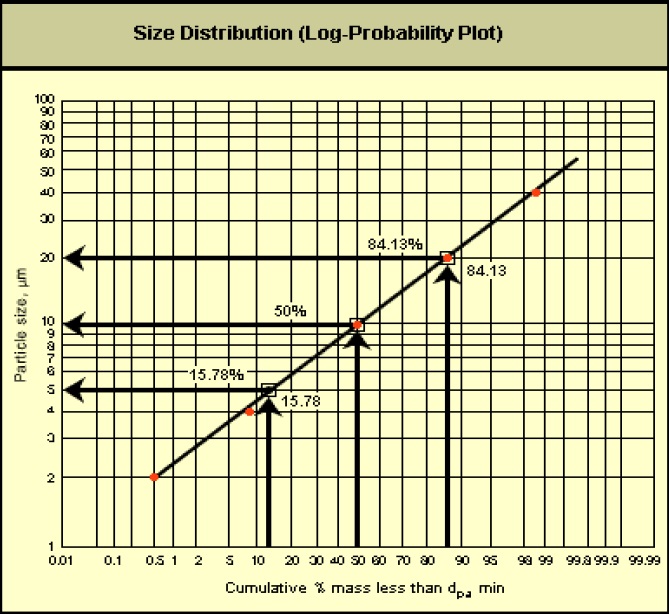
The image is a size distribution graph on a log-probability plot. The x-axis is labelled Cumulative percent mass less than minimum aerodynamic diameter. The y-axis is labelled particle size in micrometers. There is a diagonal line extending from the bottom left to the top right through the middle of the graph.
There are three examples on the graph. One is a cumulative mass less than minimum aerodynamic diameter of 15.78% representing a particle size of 5 micrometers. The second is a cumulative mass less than minimum aerodynamic diameter of 50% representing a particle size of 10 micrometers and the third is a cumulative mass less than minimum aerodynamic diameter of 84.13% representing a particle size of 20 micrometers.
The straight line indicates that the particle size data set is lognormal.
- Using the graph, determine the approximate particle size at 15.78%, 50%, and 84.13% probability.
- Determine the mass median particle diameter: Mass median particle diameter = d50 = 10 µm
- Determine the geometric standard deviation of the particle mass distribution.
σg = d50 ⁄ d15.78 = 10 µm) ⁄ 5 µm = 2.0
or:
σg = d84.13 ⁄ d50 = 20 µm) ⁄ 10 µm = 2.0
Particle size distributions resulting from complex particle formation mechanisms or several simultaneous formation mechanisms may not be lognormal. As shown in the following diagram, these distributions may exhibit more than one peak (multi-modal).
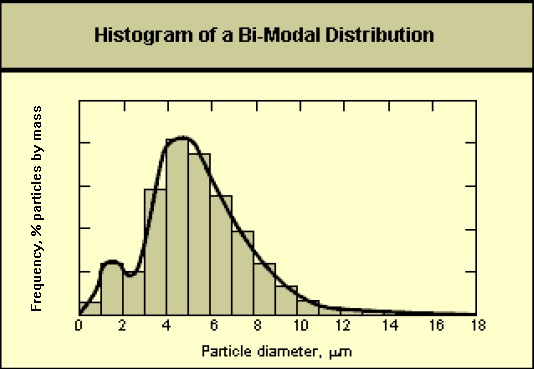
This image is a histogram of bi-modal distribution. The x-axis is labelled particle diameter in micrometers. The y-axis is labelled frequency, percent of particles by mass.
The graph is a bar graph with two peaks (bi-modal) at particle diameter 1-2 micrometers and particle diameter of 4-5 micrometers. After the second peak the graph curves downwards at a normal rate.
In these cases, plots of the data on log-probability paper will not yield a straight line. In order to characterize this type of particle size data, it may be necessary to treat the data as two separate lognormal distributions.
8.0 References
- California Air Resources Board, Method 501 – Determination of Size Distribution of Particulate Matter Emissions from Stationary Sources, September 1990.
- Marple, V.A. and K.L. Rubow, Chapter 4: Theory and Design Guidelines, Cascade Impactors: Sampling & Data Analysis, Eds. J.P. Lodge and T.L. Chan, A.I.H.A. 475 Wolf Ledges Parkway, Akron, OH 44331, 1986.
- Pilat, M., Operations Manual Pilat (University of Washington) Mark 3 and Mark 5 Source Test Cascade Impactor, University of Washington, Seattle, January 1998.
- United States Environmental Protection Agency, Education and Outreach, Basic Concepts in Environmental Sciences – Module 3: Characteristics of Particles, September 1990.
Figure 7-1: Cascade Impactor Particulate Sampling Train
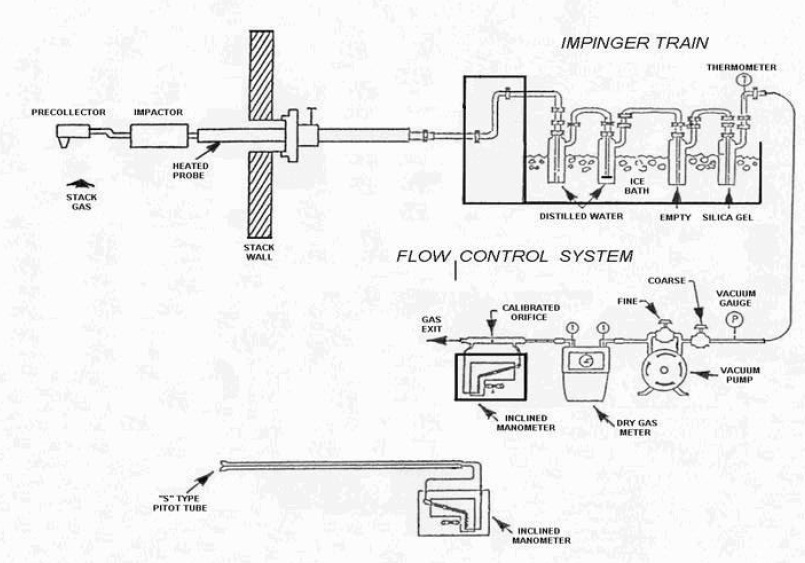
This figure is similar to the Method ON-5 particulate sampling train.
Each component is described under Section 4.0 Apparatus subsection 4.1 Sampling Train.
The Figure includes:
A nozzle angled down vertically to capture stack gas that is travelling vertically up a stack. The nozzle is attached to a right angle pre-collector which turns the gas 90 degrees and it then travels horizontally through the sampling probe.
The sampling probe, which is heated, consists of an impactor and is connected to an impinger train.
The impinger train shows four impingers connected in series in an ice bath. The first two are filled with distilled water, the third impinger is empty, and the fourth impinger contains silica gel. There is a thermometer attached to the fourth impinger outlet.
The sampling line connects the outlet of the fourth impinger to a vacuum gauge and vacuum pump. The vacuum pump has a fine and coarse valve.
The vacuum pump is connected to a dry gas meter.
The dry gas meter is connected to an inclined manometer with a calibrated orifice.
The stack gas then exits the sampling train to atmosphere.
The figure also shows an "S" type Pitot tube connected to an inclined manometer.
Figure 7-2: View of a Right Angle Precollector
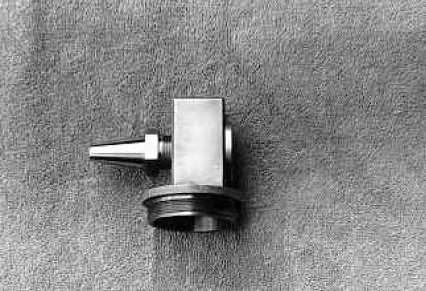
Figure shows a right angle pre-collector. The nozzle is pointing to the left (horizontally) and is attached to a rectangular shaped pre-collector which directs the stack gas through the nozzle and turns it 90 degrees to attach to a cascade impactor vertically.
Figure 7-3: Cross Section of a University of Washington Mark 5 Cascade Impactor
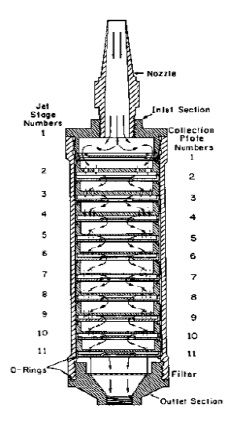
This figure provides a cross section view of a Mark 5 11-stage cascade impactor.
The nozzle is at the top of the figure with arrows that point down in the direction that stack gas would enter the impactor.
The jet stage numbers are on the left going from 1 to 11. The collection plate numbers are on the right going from 1 to 11 and corresponding with the jet plate numbers.
There are arrows moving from the nozzle through the entire impactor showing the direction of flow of the stack gas from jet stage and collection plate until the final filter (after stage 11) and then out through the outlet section.
Figure 7-4: Expanded View of Parts to the University of Washington Seven Stage Cascade Impactor
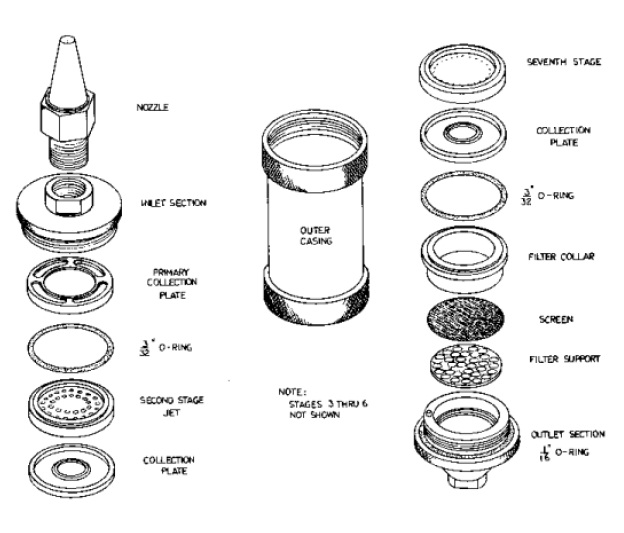
This figure illustrates the individual parts of a 7-stage impactor.
The individual parts are described in order from the sampling end moving inside the impactor. The parts are described below:
- A Nozzle with a conical shape and pointed tip to allow for the collection of stack gas;
- Inlet section connects to the nozzle by screwing in;
- Primary collection plate allows for collection of particulate matter of a certain size;
- 3/32 inch O-Ring;
- Second stage jet which has smaller holes than the primary collection plate;
- Collection plate for the second stage jet;
- Note: stages 3-6 are not shown in the diagram but each stage has smaller holes allowing for the separation of particulate matter based on size. Each stage has a filter, collection plate, and 3/32 inch O-Ring;
- Seventh stage filter;
- Collection plate;
- 3/32 inch O-Ring;
- Filter collar;
- Screen;
- Filter support;
- Outlet section with a 1/16 inch O-Ring.
Figure 7-5: Nomograph for Determining Sampling Time (50 mg Sample)
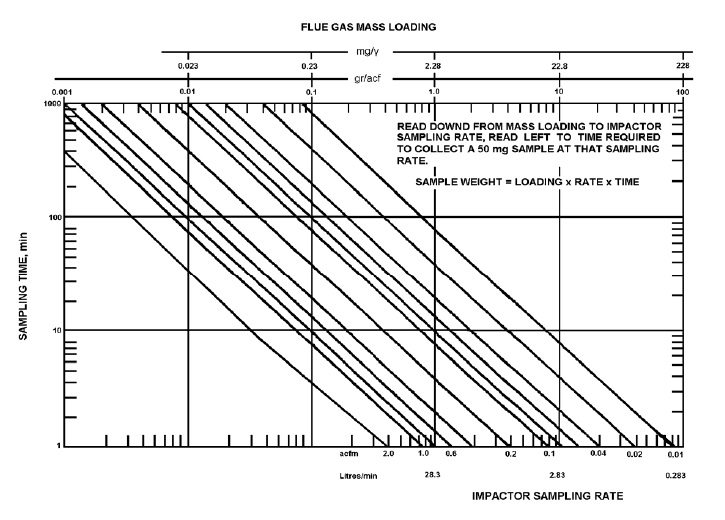
Given the mass concentration, an estimate of the sampling time for initial tests can be obtained from the nomograph shown in Figure 7-5.
The nomograph is divided into 15 equal square sections with each square representing one order of magnitude.
The bottom x-axis is labelled impactor sampling rate in litres per minute and in actual cubic feet per minute.
The y-axis is labelled sampling time in minutes.
The top x-axis is labelled flue gas mass loading in both milligrams per volume and in grams per actual cubic foot.
The graph has diagonal lines starting from the top left corner and extending down to the bottom right corner.
The graph is read downward from mass loading to impactor sampling rate. It is then read to the left to obtain the time required to collect a 60mg sampling at that sampling rate.
The equation derived from the graph is sample weight equals loading multiplied by rate multiplied by time.