The content on this page is no longer up to date. It will remain on ontario.ca for a limited time before it moves to the Archives of Ontario.
Ontario Toxics Reduction Program - Toolkit for Toxic Substance Accounting
This resource is intended to: explain the requirements set out in the Toxics Reduction Act, 2009 and Ontario Regulation 455/09, it describes the scope of the legislation and introduces key terms.
We’ve made changes to the Toxics Reduction Program to eliminate duplication with the federal government’s Chemicals Management Plan, (under the Canadian Environmental Protection Act, 1999) and reduce burden for industry.
On December 31, 2021, the Toxics Reduction Act, 2009 will be repealed and its associated regulations revoked, ending the Toxics Reduction Program. Until this time, facilities must continue to meet the requirements of the Toxics Reduction Act, 2009 and its associated regulations.
As a result of regulatory changes, facilities no longer need to prepare new toxic substance reduction plans or review their existing plans. Facilities with existing plans are still required to report annually on substances included in their plans that meet the thresholds.
The ministry is currently updating this Toolkit for Toxic Substance Accounting to reflect the legislative and regulatory changes. The updated version will be provided shortly.
Summary
To support Ontario’s commitment to reduce toxic substances in air, land and water, the Toxics Reduction Program focuses on:
- reducing the use and creation of prescribed toxic substances to protect the environment and human health; and
- informing Ontarians about prescribed toxic substances in their communities.
The program augments the traditional “end of pipe” approach to managing releases by focusing on reducing the use and creation of these prescribed toxic substances at the front end of the manufacturing process.
Through the Toxics Reduction Act (Act) and Ontario Regulation 455/09 (O. Reg. 455/09 or regulation), the program requires facilities to consider opportunities to reduce prescribed toxic substances while recognizing that there may be essential uses for some prescribed toxic substances. The program is not intended to force facilities to reduce their production of goods or force them out of business. The program does not restrict the use, creation, or release of prescribed toxic substances nor does it force facilities to implement reduction strategies. The implementation of toxic substance reduction plans is voluntary.
The list of prescribed toxic substances includes all the substances on the current federal National Pollutant Release Inventory (NPRI) Gazette Notices (NPRI Notices) as well as acetone. If a facility (identified through NAICS codes that commence with “31”, “32”, “33” or “212”) undertakes manufacturing or mineral processing activities using chemicals and is required to provide information under the federal NPRI and/or report for acetone under O. Reg. 127/01 – made under the Environmental Protection Act, it is also subject to the requirements of the Toxics Reduction Act and O. Reg. 455/09.
The tracking and quantification of prescribed toxic substances (i.e. toxic substance accounting) is required in order to meet the program’s annual reporting requirements. It supports an informed analysis of identified reduction options and is valuable in determining:
- the extent to which a prescribed toxic substance is used or created at a facility and what happens to it as a result of the facility’s activities (e.g. whether it is contained in product, transformed into a different substance, or destroyed; and what is released via various output streams, disposed of or transferred off-site);
- aspects of the facility’s operations that present good opportunities for reducing prescribed toxic substances; and
- a baseline to track progress in reducing prescribed toxic substances.
The higher the quality of the toxic substance accounting information, the more informed the decisions regarding the viability of a reduction option will be. This toolkit will help you understand the requirements under the program, how toxic substances are used at your facility and the extent to which toxic reduction options may be identified and implemented.
It provides both basic and complex examples to help illustrate how a facility may meet the program’s toxic substance accounting requirements. The examples are intended to illustrate “real life” scenarios and show possible approaches a facility may employ to meet the toxic substance accounting requirements. A number of suggested approaches are outlined in this toolkit and examples have been provided to help identify possible best methods for characterizing substance use, creation, destruction, transformation, and contained in product.
While every effort has been made to ensure the accuracy of the information contained in this toolkit, it should not be construed as legal advice. In the event of a conflict between this document and the requirements identified in the Act and regulation, the Act and regulation will prevail.
For any addenda or revisions to this guide please visit the MOECC website.
or contact:
General Inquiry
Ontario Ministry of the Environment and Climate Change
Tel: 416-325-4000 Toll-free: 1-800-565-4923 TTY: 1-800-515-2759 Fax: 416-325-3195
Cette publication hautement spécialisée n’est disponible qu’en anglais en vertu du reglement 441/97, qui en exempte I’application de la Loi sur les services en français. Pour obtenir de I’aide en français, veuillez communiquer avec Ie Ministere de l’Environnement et de l’Action en matière de changement climatique au
1.0 Introduction
1.1 Background
The Toxics Reduction Act, 2009 (the “Act”), is the cornerstone of Ontario’s Toxics Reduction Program. The Act requires regulated facilities to:
- Track and quantify their use and creation of prescribed toxic substances (toxic substance accounting);
- Prepare a plan to reduce the use and creation of prescribed toxic substances;
- Make a summary of the plan available to the Ministry and the public;
- Report to the Ministry and the public on their progress in reducing prescribed toxic substances; and
- Review their plans on a regular basis.
Regulated facilities are prescribed by O.Reg. 455/09 as facilities that undertake manufacturing or mineral processing (identified through NAICS codes that commence with “31”, “32”, “33” or “212”) and must provide information to the federal National Pollutant Release Inventory (NPRI) or O.Reg. 127/01 made under the EPA if the prescribed substance is acetone.
The purpose and value of toxic substance accounting in the toxics reduction planning process is:
- To determine how and why a substance moves through various processes at the facility;
- To determine the baseline information needed to explore possible opportunities for toxics reduction at the facility,
- To determine the baseline information needed to report on amounts that are; used, created, contained in product, released, disposed and transferred on a facility basis; and
- To track and measure a facility’s progress in reducing prescribed toxic substances (where possible).
1.2 Scope of Toolkit
This toolkit provides clarification and suggestions on elements of toxic substance accounting through the use of various examples and approaches. Topics covered in this document include:
- Identifying and describing stages and processes at a facility that use and create prescribed toxic substances;
- Developing process flow diagrams that show the movement of a prescribed toxic substance for each process;
- Considering best available method or combination of methods for tracking and quantifying;
- Tracking and quantifying prescribed toxic substances at the process level;
- Input/output balances;
- A glossary of terms; and;
- A list of references
This document does not cover the requirements a facility may need to follow to determine if they are subject to NPRI or O.Reg. 127/01. If a facility has any questions regarding this matter, they should contact:
National Pollutant Release Inventory
Environment and Climate Change Canada
5th Floor, Place Vincent Massey
351 St-Joseph Blvd.
Gatineau, QC K1A 0H3
Tel: 1-877-877-8375 Fax: 819-953-0461 - E-mail: ec.inrp-npri.ec@canada.ca
O.Reg. 127/01: Airborne Contaminant Discharge Monitoring and Reporting (for acetone)
This document is intended for the owner and operator (the persons ultimately responsible for ensuring compliance with the Act and regulation) of a facility captured under the Act as well as any person(s) who may assist them (e.g. facility technical contact, licensed planner, etc.). The regulated community includes facilities in Ontario that fall under the North American Industrial Classification System (NAICS) Codes as listed in Table 1.
1.3 Toxic Substance Accounting Requirements in the Act and Regulation
Under Section 9 of the Act, the owner and operator of a facility are required to ensure for each process at the facility that uses or creates a prescribed toxic substance, that the substance is tracked and quantified, in accordance with the regulation, to show the following:
- how the toxic substance enters the process;
- whether it is created, transformed or destroyed during the process;
- how it leaves the process; and,
- what happens to it after it leaves the process.
Section 12 of the regulation outlines the information required to meet the objectives of toxic substance accounting such as the requirements for process flow diagrams (PFDs) and the quantities that must be accounted for. Section 12 of the regulation also prescribes the use of a best available method or combination of methods for tracking and quantification purposes (with certain considerations), and that the quantifications must be calculated at the process level. When reporting the quantifications in the annual report, quantifications at the facility level are required.
Section 12 also refers to records that must be created during toxic substance accounting. These record requirements are explained throughout this document and a summary of the record requirements under the regulation is provided in Table 2.
The quality of the tracking and quantification of the amounts of substances, and the input/output balance are dependent upon: facilities having identified and described every stage of the facility’s operation; determining the number of processes that use and create the prescribed toxic substance within a stage; the development of process flow diagrams which give the visual representation of the flow of the toxics substance through each process and the relationship of one process to another; as well as, the determination of the methods or combination of methods for tracking and quantifying the amounts of the prescribed toxic substances.
| NAICS | Subsector |
|---|---|
| 212 | Mining (see note below) |
| 311 | Food Manufacturing |
| 312 | Beverage and Tobacco Product Manufacturing |
| 313 | Textile Mills |
| 314 | Textile Product Mills |
| 315 | Clothing Manufacturing |
| 316 | Leather and Allied Product Manufacturing |
| 321 | Wood Product Manufacturing |
| 322 | Paper Manufacturing |
| 323 | Printing and Related Support Activities |
| 324 | Petroleum and Coal Products Manufacturing |
| 325 | Chemical Manufacturing |
| 326 | Plastics and Rubber Products Manufacturing |
| 327 | Non-Metallic MineralProduct Manufacturing |
| 331 | Primary Metal Manufacturing |
| 332 | Fabricated Metal Product Manufacturing |
| 333 | Machinery Manufacturing |
| 334 | Computer and Electronic Product Manufacturing |
| 335 | Electrical Equipment, Appliance and Component Manufacturing |
| 336 | Transportation EquipmentManufacturing |
| 337 | Furniture and Related Product Manufacturing |
| 339 | Miscellaneous Manufacturing |
Note: NAICS 212 – (Mining, except oil and gas) – Applies to facilities that are using chemicals to separate, refine, smelt or concentrate metallic or non-metallic minerals from an ore. Mineral processing facilities that physically extract, grind, or crush (by non-chemical means) are not subject to the Act and regulation.
| Record No. | Regulation Section | Content of Record(s) | Annual Toxic Substance Reduction Plan Report (“Annual Report”) | Toxic Substance Reduction Plan |
|---|---|---|---|---|
| Record # 1 | 12 (2) 1 i and 12 (2) 1 ii | A description of every stage of the manufacturing operation at the facility that uses or creates the toxic substance. A description of how each stage is divided into one or more processes that use or create the substance | n/a | Due by the due date of the plan for the substance (December 31st) |
| Record # 2 | 12 (2) 2 i and 12 (2) 2 ii | Process flow diagrams (PFDs) that give a visual representation ofthe movement of the substance through each process, including how it enters the process, whether it is created, destroyed or transformed during the process, how it leaves the process and what happens to it after it leaves the process. Process flow diagrams (PFDs) that show the relationships between the processes | n/a | Due by the due date of the plan for the substance (December 31st) |
| Record # 3 | 12 (2) 3 | The tracking and quantification of the substance for each calendar year in which Section 9 of the Act applies in respect of the substance | To be used for the determination of the facility-wide quantities that are reported every year | Due by the due date of the plan for the substance (December 31st) |
| Record # 4 | 12 (2) 4 | If the sum of the quantities of the substance that are used and created in a process in a calendar year does not approximately equal the sum of the quantities of the substance that are destroyed, transformed and leave the process, a record describing why the sums are not approximatelyequal | n/a | Due by the NPRI compliance date (usually June 1st) of the following year, but the record becomes part of the plan (due by December 31st) |
| Record # 5 | 12 (2) 5 | A description of the method or combination of methods used to track and quantify the substance in each process, and an explanation of why the method or combination of methods was chosen | n/a | Due by the due date of the plan for the substance (December 31st) |
Records developed in accordance with the accounting requirements support two other major requirements of the Act and regulation: facility- wide reporting and toxic substance reduction planning. This topic is discussed in greater detail under subsection 1.5 of this toolkit. While the majority of records are not required until the preparation of the plan, they are all interlinked and it may prove beneficial for a facility to begin all record development early in order to be ready for facility-wide reporting (due prior to the plan).
1.4 Linkages to NPRI and Ontario Regulation 127/01 – Airborne Contaminant Discharge Monitoring and Reporting
Ontario’s Toxics Reduction Act and O.Reg. 455/09are closely interlinked with the federal NPRIprogram and O.Reg. 127/01. Much of the work that facilities currently do to meet the requirements of toxic substance accounting. However, it is important to keep in mind the differences.
The prescribed toxic substances in the regulation include all of the substances on the current federal NPRI Notices as well as acetone (adopted from O. Reg. 127/01). It should be noted that these substances are in the same form as specified byNPRI and/or O.Reg. 127/01.
The substance thresholds (including any applicable exemptions) are the same for NPRI or if the substance is acetone, the same for reporting under O. Reg. 127/01. This approach provides clarity to facilities attempting to determine if compliance with the Act and regulation is required.
For dioxins, furans and hexachlorobenzene, it is important to note that under the Toxics Reduction Act, 2009, reporting “no information available” (which is permitted to be reported under NPRI) is not allowed when reporting quantities for use, creation, contained in product, releases, disposals and transfers.
As noted previously, the requirements referred to as those belonging toNPRI are more accurately described in the current NPRI Notices. The regulation makes various references to the NPRI requirements.
| Toxic Substance Accounting under O.Reg. 455/09 and Toxics Reduction Act. | Similarities to NPRI & O.Reg. 127/01 | Differences from NPRI & O.Reg. 127/01 |
|---|---|---|
| Describing Stages and Processes | NPRI requires that the facility examine its operations more closely due to some of the rules that outline what activities are exempt for calculations to determinethresholds. | O.Reg. 455/09 uses terms “stages” and “processes”, whereas NPRI uses“activities” |
| Process Flow Diagram | N/A | NPRI and O.Reg. 127/01 do not require process flow diagrams |
| Considering Best Available Methods | Under O.Reg. 455/09 the listed methods for consideration for best available methods are the same as those listed in NPRI. | NPRI and O.Reg. 127/01 do not require “best available methods” |
| Changing Methods for tracking and quantification | Only under prescribed circumstances, a facility may change its methods in O.Reg. 455/09 | NPRI and O.Reg. 127/01 allow for changes of methods at any time. O.Reg. 455/09 does not allow changes of methods unless:
|
| Tracking and Quantification | Rules for calculations, including exemption in “things” and “activities” that are set out in NPRI also apply for accounting under TRA and O.Reg. 455/09. Quantifications used for reporting are at the facility level | O.Reg. 455/09 requires accounting to be conducted at the process level. NPRI and O.Reg. 127/09 do not prescribe the level of detail for accounting methods. Under NPRI, a facility may report “no information” for dioxins, furans, and hexachlorobenzene. Under O.Reg. 455/09 information on these substances is required using the best available method. |
| Input/Output Balances | n/a | NPRI and O.Reg. 127/09 do not require an explanation if the inputs and outputs balances are not approximately equal. |
1.5 Linkages to Planning and Reporting
Toxic Substance Reduction Plan (the Plan)
- Records prepared as part of the toxic substance accounting requirements are included in the Plan. The following records, however, are not required to be in included in a new plan prepared as a result of a review: 1) a record showing the tracking and quantification for each calendar year and, 2) if the sum of the quantities of the substance that are used/created does not equal the sum of the quantities destroyed/transformed/leaving the process, a record describing why they are not equal.
- Methods used and quantities determined through toxic substance accounting may be used to calculate a facility’s reduction targets (if a facility chooses to set targets), as well as anticipated reductions in use, creation, contained in product, releases to air, land and water, disposals, and transfers of a prescribed toxic substance. This information is included in the Plan.
- Quantities from toxic substance accounting will be used to help calculate costs related to toxic substance use, creation, release, disposal, transfer, and contained in product. The costs are included in the Plan.
- After changing an existing process at a facility, a comparison of year to year toxic substance accounting figures may help a facility determine if their plan needs to be reviewed earlier than the fixed review dates (i.e. 2019, 2023 and every 5 years thereafter). A definition of “significant process change” is provided in the glossary section. Further, a comparison of year to year toxic substance accounting figures may help facilities determine the amount by which prescribedtoxic substances are being reduced as a result of plan implementation.
Toxic Substance Reduction Plan Report (the Report)
- Toxic substance accounting helps to determine the facility-wide values for the annual reports, which are due by the NPRI compliance date (usually June 1st).
- Comparison of toxic substance accounting quantities from year to year may help facilities determine whether a “significant process change” has occurred. If a significant process change has occurred, it must be documented in the Report.
- An indication of whether there has been a change in the method or combination of methods used to track and quantify a substance must be included in the Report. If there has been a change, a description of the change, the reason for the change, and how the change will impact future tracking and quantification of the substance must also be included.
- A statement of whether any incident outside of the normal course of events occurred at the facility during the previous calendar year must be detailed in the Report including whether the incident affected the results of tracking and quantification of the substance and, if so, an explanation of how.
2.0 Toxic Substances
The toxic substances for the purposes of the Toxics Reduction Act, 2009 and O.Reg.455/09 include:
- All of the substances and substance groups as listed in Schedule 1 of the current NPRI Notices; and
- Acetone, as listed in O.Reg. 127/01.
Toxic substances can either be in pure form (as a chemical) or as a constituent or component of another chemical or product.
The Act and the regulation apply to manufacturing facilities that are required to report on a substance to NPRI or report under O. Reg. 127/01 for acetone.
NPRI and O.Reg. 127/01 also provide some exclusions with respect to quantifying certain substances. For comprehensive information regarding the NPRI exclusions, please visit the NPRI web-site.
It is important to note that NPRI and O.Reg. 127/01 update their requirements from time to time and that the Act and regulation adopt the most current requirements. It is the owner and operator’s responsibility to ensure that the most up-to-date NPRI Notice and/or O.Reg. 127/01 rules are being used.
3.0 Overall Approach
The Act and regulation provide a facility with the flexibility to determine an appropriate approach to accounting and to ensuring that it is complete and accurate. The legal framework does not prescribe in what form information must be presented in the records. If the method or combination of methods a facility is using to acquire data for NPRI and/or O.Reg. 127/01 reporting is the best available method, that facility may choose to continue to use the same method(s) to collect the additional data required to fulfill the requirements of the regulation.
One way in which facilities may begin undertaking accounting is to use a team approach. While this is not a requirement in the Act or regulation, staff from various areas of a facility may have information regarding a substance that may prove helpful in completing each of the required records. Appendix A provides further detail on how a team approach may be useful.
The illustration below may be a useful approach for facilities to apply.
Figure 1: Suggested Approach for Toxic Substance Accounting
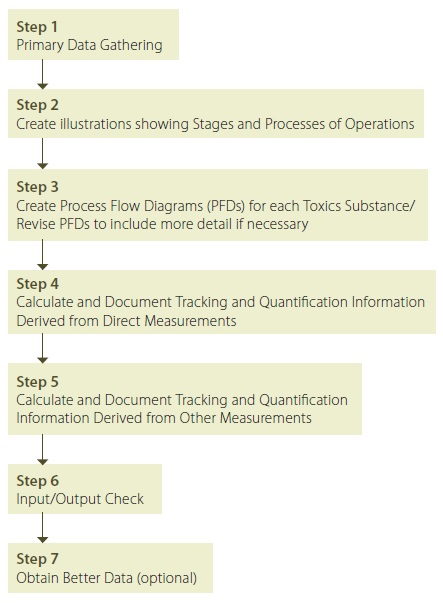
3.1 Preliminary Data Gathering
Prior to developing the records that are required under accounting, a facility may undertake a preliminary data gathering exercise to assess what information it has on hand and what gaps may exist. This is particularly beneficial because under the Act, a facility may use documents developed for another purpose to meet the requirements of the Act and regulation (see section 45 of the Toxics Reduction Act for the actual provision).
The following suggestions may be useful to certain facilities:
- Undertake an exercise to inventory all raw materials and products used on-site and verify that a material safety data sheet (MSDS) is available and is up-to-date for any Workplace Hazardous Materials Information System (WHMIS) controlled products.
- Obtain MSDSs for any new WHMIS controlled products identified.
- Review the MSDSs and identify products that contain any amount of prescribed toxic substances for which thresholds have been met. For example, a facility that does metal fabrication and finishing may use several products that contain toluene, including paints, paint thinners, and adhesives. The paints and adhesives may be associated with different production lines. The toxic substance accounting for this facility must include the toluene from each product.
- Review MSDSs for reference to any substance that may be created through normal use of the product or that may be created under special conditions (such as temperature or pressure or mixing with other substances).
- For non-WHMIS controlled products such as feedstock materials, obtain product specification and/or results of analytical testing for chemical characteristics. The definition of feedstock is provided in the glossary section at the end of this toolkit.
Quantification methods relating to feedstock materials are also discussed in Section 5.2.
- Review all environmental monitoring reports (such as Municipal/Industrial Strategy for Abatement reports) and Environmental Compliance Approvals to identify which output streams, from which operations, contain prescribed toxic substances.
- Review waste generator reports and analytical testing results of waste streams to determine which waste streams contain prescribed toxic substances.
Please note that Section 3.2 provides further guidance on the types of information available from various data sources.
Documentation of processes that may involve a prescribed toxic substance may exist with:
- process flow diagrams;
- schematics;
- site plan drawings showing the layout of equipment;
- mechanical or other drawings showing the location of floor drains and piping;
- drawings or Emission Summary and Dispersion Modeling (ESDM) reports showing the location of vents and air emission sources;
- spill reports;
- emergency preparedness plans showing the storage locations of hazardous materials;
- spill prevention contingency and countermeasure (SPCC) plans that identify where spillable materials are stored and in what quantities;
- standard operating procedures for receiving, transfers, storage, and use of products or waste containing prescribed toxic substances;
- standard operating procedures for equipment where products that contain prescribed toxic substances are processed (e.g. ovens, mixers, pressure vessels);
- equipment specifications and operating manuals; and
- publicly available data sources such as:
- United States (US) Environmental Protection Agency (EPA) Sector Notebooks (on-line resource)
- MOE Municipal/Industrial Strategy for Abatement (MISA) Development Documents
- Sector Specific Guidelines for Pollution Prevention, NPRI, Best Management Practices.
3.2 Data Sources
This section of the toolkit describes data sources that may be used to populate process flow diagrams and feed into the methods for tracking and quantifying prescribed toxic substances in each process (see Section 5).
Table 4 provides potential data sources for tracking and quantification. Sections 3.2.1 to 3.2.17 provide further information on the data sources.
3.2.1 MSDSs for Raw Materials
Material Safety Data Sheets (MSDSs) contain information regarding the presence, absence, and/or concentration of prescribed toxic substances in raw materials that areWHMIS controlled products. This information, found in “Composition and Information on Ingredients” of the MSDS, may be used along with the total raw material usage to calculate the quantity of a prescribed toxic substance entering a stage or process. In most cases, this information may be provided in ranges and it is up to the facility to decide which value they use (within the range) to meet the quantifications for accounting under the Act and O. Reg. 455/09. It is suggested that when a facility decides on a particular value within a range that they remain consistent from year to year. The “Physical and Chemical Properties” of the MSDS provides physical and chemical properties (such as evaporation rate or solubility in water) of a raw material, which may be useful with respect to tracking and quantifying a prescribed toxic substance’s path through a process. When an MSDS is available for a raw material, the facility may reasonably assume that the raw material received is homogeneous and that subsequent batches of the raw material contain the same concentration of the prescribed toxic substance.
The “Stability and Reactivity” and “Toxicological Information” of the MSDS may also provide information on prescribed toxic substances that may be created through normal use of the product or that may be created under special conditions (such as temperature or pressure or mixing with other substances. The “Regulatory Information” may contain prescribed toxic substances that are not listed in “Composition and Information on Ingredient.”
3.2.2 Purchasing Records and Production Numbers
Purchasing records will provide the total amount of a raw material purchased for the year. A facility’s “Consumables Reference List” will also provide information on raw materials consumed. Ideally, raw materials will be cost coded to a specific stage and process. Interviews with production-level staff may provide valuable information on the quantity of a raw material actually used and the ratio of raw material use to manufactured product.
It is important to reconcile purchased amounts with actual amounts used. In some cases, bulk chemical purchases are made for economic reasons, and there may be significant changes in chemical inventory amounts from year-to- year. These inventory changes may need to be factored into the toxic substance accounting to ensure that actual annual usages are not skewed by these inventory changes.
Amounts that are not used during a year and remain in storage are important to know. Storage may be considered a “stage” and/or “process” to provide clarity in how the substances flow through the facility even if certain amounts remain unconsumed.
| Tracking / Quantification Requirement | Potential Data Source(s) | Toolkit Section |
|---|---|---|
| Enters the Process (Use) | Data Sources | 3.2 |
| Enters the Process (Use) | MSDS | 3.2.1 |
| Enters the Process (Use) | Purchasing records and Consumable Reference List/Sheets | 3.2.2 |
| Enters the Process (Use) | Production numbers | 3.2.2 |
| Enters the Process (Use) | Monitoring data including continuous monitoring, source testing and other analytical testing results | 3.2.8, 3.2.9, 5.1.3 to 5.1.5 |
| Creation | MSDS | 3.2.1 |
| Environmental Compliance Approval application documents | 3.2.10 | |
| Creation | Published documents on chemical properties | 3.2.15 |
| Creation | Industry manuals, guidance documents | 3.2.16 |
| Creation | EPA Sector notebooks | 3.2.16 |
| Creation | Monitoring data including continuous monitoring, source testing and other analytical testing results | 3.2.8, 3.2.9, 5.1.3 to 5.1.5 |
| Destruction | Treatment /Abatement Equipment Specifications | 3.2.14 |
| Destruction | Monitoring data including continuous monitoring, source testing and other analytical testing results | 3.2.8, 3.2.9, 5.1.3 to 5.1.5 |
| Transformation | MSDS | 3.2.1 |
| Transformation | Equipment operating manuals | 3.2.17 |
| Transformation | Industry manuals, guidance documents | 3.2.16 |
| Transformation | Environmental Compliance Approval application documents | 3.2.10 |
| Transformation | Published documents on chemical properties | 3.2.15 |
| Transformation | Monitoring data including continuous monitoring, source testing and other analytical testing results | 3.2.8, 3.2.9, 5.1.3 to 5.1.5 |
| Contained in Product | MSDS for Product | 3.2.3 |
| Contained in Product | Product specification | 3.2.4 |
3.2.3 MSDS for Manufactured Products
For a facility that manufactures a WHMIS controlled product, an MSDS is required. The “Composition and Information on Ingredients” of the MSDS for the product provides concentration information which may be used to quantify the prescribed toxic substance(s) contained in the product.
3.2.4 Manufactured Product Information
For manufactured items that are not WHMIS controlled products, but are exported, information required for export may be used. For example, for products exported to Europe, information on some of the substance content may be required for compliance with the European Union’s Restriction on Hazardous Substances Directive. Some design specifications (e.g. coating thickness specification) may also yield useful information for the quantification of a prescribed toxic substance. In addition, customer specifications may also yield useful information for quantification (e.g. customer requirement for certification of specific manufactured product quality).
3.2.5 Hazardous Waste Generator Registration Report
For facilities that generate hazardous or liquid industrial waste, a Hazardous Waste Generator Registration Report (GRR) must be submitted to the Ministry. Part 2A of the GRR contains information regarding the source and characteristics of each waste stream, the quantities and methods of the waste processed or stored on-site, and the quantities and ultimate fate of the waste disposed off-site. This information may be used to estimate quantities of prescribed toxic substances in waste streams and track their ultimate fate. The GRR may identify which industrial processes created or transformed a prescribed toxic substance.
Note that with respect to determining off- site disposals and transfers of prescribed toxic substances, facilities may review NPRI's toolbox for the best available methods.
3.2.6 Waste Manifests and Cost of Waste Disposal
For facilities that generate hazardous or liquid industrial waste off-site, their waste manifests may provide a valuable source of information Waste manifests provide information regarding the characteristics and quantities of each shipment of waste transferred off-site, and the number of shipments. This information, along with that provided in the Hazardous Waste GRR, may be used to track and quantify off-site transfers of prescribed toxic substances in subject waste.
Information created to characterize waste for off-site disposal is often provided for aggregate waste and not for waste generated from specific processes. A waste receiver may undertake an initial and subsequent periodic analytical testing of the waste stream to confirm that the waste treatment facility can accept the material. Such analytical data is available to the generating facility.
The characterization methods for waste streams often involve a toxicity characteristic leachate procedure (TCLP or leachate test) for solid wastes and a bulk chemistry test for liquids and sludge. This analytical data may help determine whether a prescribed toxic substance (such as lead) is contained in the waste stream. This data may show the presence of prescribed toxic substances that were created or transformed and therefore provide the opportunity for a facility to back-track through the process to determine how and under what conditions the prescribed toxic substance was formed.
Note that with respect to determining off-site disposals and transfers of prescribed toxic substances, facilities may use NPRI guidance available in the NPRI toolbox for best available methods.
3.2.7 Off-Site Transfer of Recyclable Materials and Cost
For recyclable material transfers that are not captured under Reg. 347 “General Waste Management” made under the EPA and its manifesting requirements, facilities may have a bill of lading or business record that identifies the off-site transfers. The amounts of prescribed toxic substances in these transfers should be quantified. Please note that with respect to determining off-site disposals and transfers of prescribed toxic substances, facilities may follow NPRI guidance for the best available methods.
3.2.8 Analytical Results of Effluent Water Quality
Sampling and analytical testing of wastewater and storm water may provide concentrations of prescribed toxic substances. These results may help determine the quantities of prescribed toxic substances being released from discrete processes within a facility e.g. cleaning residues, and as such may be useful for tracking and quantification.
Under the Municipal Industrial Strategy for Abatement (MISA) Effluent Monitoring and Effluent Limits regulations, industrial dischargers analyze samples from their wastewater discharge and report data based on the results.
Few municipal sewer-use by-laws require effluent sampling. However, municipalities often collect effluent samples at or downstream of industrial facilities to assess compliance with sewer use by-law limits. This data may be available to the industrial facility upon request.
Environmental Compliance Approvals issued for Industrial Sewage Works and required under the Ontario Water Resources Act, often contain conditions that require that approval holders sample their discharge, analyze the discharge samples, and report data based on the results of the analysis of the samples.
Sampling that is required as part of a regulatory requirement is often only for “end-of-pipe” quality and not for a discrete process related to wastewater streams. However, this data may show the presence of prescribed toxic substances that were created or transformed and therefore provide the opportunity for a facility to back-track through the process to determine how and under what conditions the prescribed toxic substance was formed.
A facility may also have undertaken a wastewater characterization study that included the sampling of discrete wastewater streams as a result of one of the following:
- in order to complete a “waste survey” report as a sewer-use by-law requirement prior to discharge to sewer.
- as part of an initiative to better understand environmental impacts.
- as part of an initiative to identify where within a process a prescribed toxic substance is created.
- to identify source problems to address a non- compliance issue.
- testing done by consultants or suppliers to design treatment systems.
This data may be used to better understand what happens to a prescribed toxic substance throughout a process.
3.2.9 Results of Indoor, Ambient and Stack Air Testing
Air testing may provide concentrations of prescribed toxic substances in certain locations which may help determine the quantities of prescribed toxic substances being released from discrete processes within a facility, and as such, may be useful for tracking and quantification.
Ambient air or stack testing may be a condition on an Environmental Compliance Approval (Air) required under the Environmental Protection Act and the information from the testing may also help with the quantification for toxic substance accounting.
Indoor air testing or industrial hygiene testing may be conducted as a result of a health and safety risk assessment or to address a worker complaint. If the intent of the industrial hygiene testing is to monitor a worker’s breathing space during normal work functions and the sampling is conducted via a pump attached to the worker, the results may provide estimates to determine air concentrations, and/or emissions of the substance into air. It may also provide an overall indication of whether a prescribed toxic substance (such as lead) is being used or created in the process. If sampling is conducted via a pump (drawing air through a filter media or into a bag for later testing) at a fixed location in the facility, then this information may provide concentration levels of prescribed toxic substances. In both cases, this data may show the presence of prescribed toxic substances that were created or transformed and therefore provide the opportunity for a facility to back-track through the process to determine how and under what conditions the prescribed toxic substance was created or transformed.
3.2.10 Environmental Compliance Approval (Air) and Application Documents
The facility’s documentation originally submitted in support of the application for an Environmental Compliance Approval (Air) normally includes an Emission Summary and Dispersion Modeling (ESDM) report which contains a description of the process, sources of air emissions and contaminants that may be emitted. The supporting documentation may also include equipment specifications, operating conditions, and operation manuals for equipment such as ovens, thermoforming and extrusion equipment, granulators, mixers, and cyclones. All of the toxic substances set out in the regulation would be considered “contaminants” under the EPA. Therefore, a facility that has undergone the Environmental Compliance Approval application process may have already partially determined, for processes that emit a prescribed toxic substance to the environment, when a prescribed toxic substance is created, transformed or destroyed and under what operating conditions (temperature, pressure) these activities occur.
The information contained in the documentation originally submitted as the Environmental Compliance Approval application supporting documentation may be used to determine process-related releases of a prescribed toxic substance as well as provide information regarding industry standards for determining transformations and releases. However, it should be noted that these determinations are based on “worst case scenarios” to demonstrate compliance with point of impingent standards and as such may not be directly applicable for quantification under toxic substance accounting.
3.2.11 NPRI report
A facility’s NPRI report will provide quantification of the total releases of a prescribed toxic substance to air, water and land, disposals and transfers. These values are calculated in accordance with NPRI guidance, and may be used when quantifying the amounts that enter the process, are created, and are contained in product. Depending on the methods used to acquire data to report to NPRI and the source of the data to support the calculations (ie. process level data “rolled-up” to the facility level for the purpose of reporting to NPRI), supporting documents and calculations for the NPRI report may be a good source of information for tracking and quantification.
3.2.12 O.Reg. 127/01 report and associated calculations
A facility’s O.Reg. 127/01 report will provide quantification of the total emissions of acetone to air, water and land disposals and transfers. These values are calculated in accordance with O.Reg. 127/01 guidance, and may be used when reporting outputs.
3.2.13 Spill reports
Spill reports provide information regarding the source, circumstances, identity, quantity, time frame and ultimate fate of substances that have been spilled or accidentally released. This information may be used to identify, track and quantify prescribed toxic substances that have been lost from specific processes to spills. Spill reports provide an opportunity to better understand normal operations and maintenance activities and what may go wrong; and therefore, provide opportunities for improvement in equipment maintenance, storage, transfers, etc. Spill reports containing analytical testing results of spilled materials may also show the presence of prescribed toxic substances that were created or transformed; and therefore, provide the opportunity for a facility to back-track through the process to determine how and under what conditions the prescribed toxic substance was formed.
3.2.14 Treatment/Abatement Equipment Specifications
Design briefs, equipment specifications and warranty statements may provide data for use in toxic substance accounting. For example, if a paint booth air filter has a stated efficiency for a specific application and it is maintained as per specifications in the operations and maintenance manual, then this efficiency rating may be used to determine the amount of prescribed toxic substance in the air released from the paint booth and what remains in the filter.
3.2.15 Other Documents/Information Sources on Physical and Chemical Properties of Toxic Substances
Chemistry and toxicology textbooks such as the CRC Handbook of Chemistry and Physics and The Merck Index provide valuable information on the properties of prescribed toxic substances such as evaporation rates, solubility in water, stability and reactivity. This information is useful in determining how prescribed toxic substances can be transformed or destroyed. The “Handbook of Environmental Data on Organic Chemicals” by Karel Verschueren also provides information on organic chemical use and formulations, transformations, natural sources for occurrences, human or anthropogenic caused sources, and methods for sampling. The US Agency for Toxic Substances and Disease Registry also provides information on sources and methods for sampling prescribed toxic substances.
Online resources may also be useful and include but are not limited to the following:
- Canadian Centre for Occupational Health and Safety
- Chem Info
- Hazardous Substance Data Bank
- US Environmental Protection Agency
- Additional resources may be found in section 12.0 of the toolkit
3.2.16 Documents/Information Sources on Typical Processes and Fate of Toxic Substances
There are a number of sector specific guidance documents, notebooks and resources that describe typical processes, prescribed toxic substances used and created, along with their fate.
A Ministry Municipal/Industrial Strategy for Abatement (MISA) Development Document is available for each of the MISA sectors. These documents provide information on principal raw materials, descriptions of the processes, and flow diagrams showing stages and processes for Ontario industries in these sectors. In addition, a reference section directs the reader to more detailed sources of information on processes.
The United States Environmental Protection Agency Sector Notebooks are an on-line resource for several sectors. These Sector Notebooks are an excellent resource providing information on raw materials, descriptions of processes, characteristics of inputs and output streams, and pollution prevention options.
US EPA AP-42 is a compilation of air emission factors. This data source provides process descriptions and may also provide ranges of prescribed toxic substance concentrations in raw materials. For example, US EPA AP-42, Section 11.3 provides a typical range of the concentration of fluorine that is found in the feedstock for brick making.
Information on processes, input and output streams, and pollution prevention options may also be found in various government technical resource documents such as:
- Environment Canada’s Technical Resource Guide Prepared to Assist Wet Processing Textile Mills Required to Prepare and Implement Pollution Prevention Plans
- EPA Guides to Pollution Prevention – The Commercial Printing Industry
- City of Toronto, Environmental Regulations and Best Management Practices For Petroleum Facilities in the City of Toronto
- MOECC, Best Management Practices, Dry Cleaning and Laundry Services
- NEWMOA, Pollution Prevention in Machining and Metal Fabrication, A Manual for Technical Assistance Providers
Information on tracking and quantification may also be found in guidance documents on NPRI, pollution prevention, etc., published through industrial trade associations such as the Canadian Plastics Industry Association, the Ontario Mining Association, the Chemical Industry Association of Canada (formerly Canadian Chemical Producers Association), the Canadian Association for Surface Finishers, Canadian Vehicle Manufacturers Association etc.
3.2.17 Process Equipment Specifications and Operating Manuals
Design briefs, equipment specifications and warranty statements for process equipment may provide data for use in toxic substance accounting. This data includes such things as oven operating temperatures, process flow rates, pH of baths, coating application efficiency rates, product application rates, etc. An equipment supplier may provide “Consumable Reference Sheets” for their product which outline the amount a “consumable” will be used.
4.0 Stages and Processes
The intent of the regulation to require the owner and operator of a facility to identify and describe stages and processes is to gain a better understanding of how the substance flows through its operation.
A facility may already have some form of illustration or description of its operation that describes the manufacturing of their product or material flow. While this information may be used, it is important to keep in mind that the Toxics Reduction Act focuses on the substance and how it flows through the facility, not necessarily the flow of products.
4.1 Identifying and Describing Stages and Processes
The regulation requires that:
“…the owner and the operator of a facility shall create the following records in respect of the toxic substance:
- A record that describes,
- every stage of the manufacturing operation at the facility that uses or creates the substance, and
- how each stage is divided into one or more processes that use or create the substance.
(O. Reg. 455/09, s. 12 (2) 1.)
- A record that includes process flow diagrams that,
- give a visual representation of the movement of the substance through each process, including how it enters the process, whether it is created, destroyed or transformed during the process, how it leaves the process and what happens to it after it leaves the process, and
- show the relationships between the processes.”
(O. Reg. 455/09, s. 12 (2) 2.)
The regulation further states that:
“In determining how many processes a stage of the manufacturing operation should be divided into… the owner and operator of the facility shall ensure that a sufficient number of processes are identified for that stage to enable the owner and the operator to meet the requirements set out in section 9 of the Act and this section.”
(O. Reg. 455/09, s. 12 (3))
Stages describe the facility’s operation from a higher level and processes describe the substance’s flow at a more detailed level. Figure 2 provides an illustration showing the difference between these two concepts. It is up to the facility to determine the level of detail since each facility is unique and may experience varying levels of complexity in the way the substance flows through the facility.
4.2 Identifying and Describing Stages of the Operation
There are many approaches that a facility may take in meeting the requirement to describe stages that use and create a substance. However, a useful starting point may be to identify all major aspects of an operation, regardless of whether all stages use or create a specific prescribed toxic substance. An added benefit to this approach is that if a facility has multiple substances to account for, a single “master” document may be developed and then referred to in the record for a particular substance as long as it meets all the requirements.
Because “stages” generally depict a higher level perspective, one approach to identify and describe stages of the facility’s operation is to first consider how the facility divides up its operation from a business management perspective.
Figure 2: Illustrating the difference between stages and processes
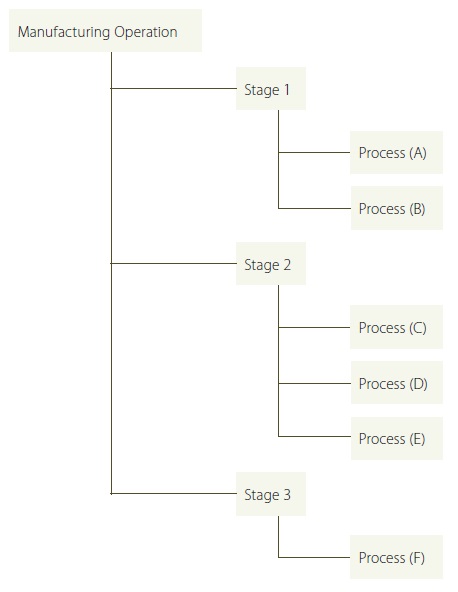
A typical operation may first be divided into the main production operations, and ancillary operations. The stages associated with each of these operations could then be listed, as shown in the following examples.
Example: Stages of a Facility’s Main Production Operations
- Receiving
- Warehousing or Storage
- Preparation or Staging
- Production Line
- Packaging
- Shipping
Example: Stages of a Facility’s Ancillary Operations
- Water or wastewater treatment
- Maintenance shop
- Tooling or die shop
- Operation of boilers, compressors
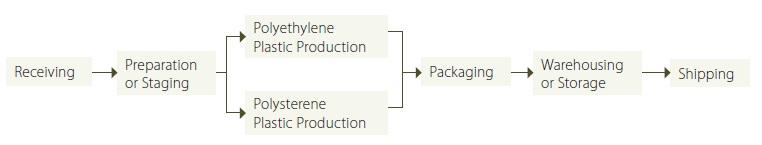
Figure 3 shows an illustration that reflects the above-listed “Example: Stages of a Facility’s Main Production Operations”, where each box represents a stage:
Figure 3: Illustration for “Example Stages of Facility’s Main Production Operations”

The advantage of using an illustrative approach over a textual one is that it helps start the thinking process about the flow of the prescribed toxic substance from one stage to another. This may help in developing process flow diagrams later on. However, the format for describing and identifying the processes under the stages is entirely at the facility’s discretion.
In the example above, the production operations are fairly easy to describe with a simple illustration because the stages are linear and continuous. Periodically, substances are introduced at one end and periodically, substances leave in the finished products at the other end.
For facilities with multiple products where there are parallel activities related to the individual products, a facility may consider each product line to be a separate manufacturing stage (or group of stages). For example, if a plastics manufacturing facility manufactured different types of plastic, each production line could be separated into its own stage. Figure 4 provides an illustration showing stages that reflects this example.
Figure 4: Example Illustration Showing Unique Stages for Production Lines
If the facility has chosen to identify all the stages in its operation (showing both stages that use and create the substance and those that do not), an indication of the stages that use or create a prescribed toxic substance is useful. Figure 5 provides one example of how this information might be illustrated, (building on Figure 3):
Figure 5: Identification of Stages that Use or Create a Toxic Substance
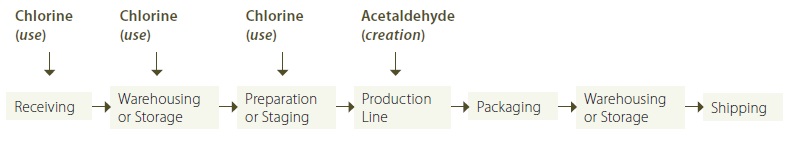
Figure 5 shows the use of one prescribed toxic substance, and the creation of another prescribed toxic substance in certain stages of the manufacturing operation. This is an example of how a master stage diagram may be used for multiple substances. More discussion on approaches for grouping substances that flow or move together, including an example, can be found in appendix B. However, for the purposes of the regulation, the record for each substance would need to reference the master stage diagram in order to meet the requirement.
The purpose of describing the stages that use or create a substance is to:
- Stimulate thinking about the substance and how it moves through the operation of a facility;
- Determine how the stage can be further broken down in order to identify processes; and
- Ensure the details of operations for the baseline year are captured to a degree that future changes to operations are obvious.
It is suggested that sufficient detail be provided in the descriptive text. Answering what, where, how, why and when about the use and creation of a prescribed toxic substance may be considered as one approach. Specific detail that may be included in the text includes answers to the following questions:
- Which production stages and processes use products that contain the prescribed toxic substance? What is the purpose of the substance(s)?
- How is it received, in what quantities, and how frequently?
- Where and how is it stored and how is it transferred for use?
- In what operations is it used? Why is that particular product required? Is it used in a continuous operation or a batch operation? During how many shifts?
- In what operations is the prescribed toxic substance created?
- What happens to the prescribed toxic substance? Does it become part of the manufactured product? Does it end up in a waste, air, or wastewater stream? Does it get transformed into another prescribed toxic substance or it is destroyed?
Figure 6 provides an example of a record for the description of stages, divided into a number of processes, for a fictional brick manufacturing facility for hydrogen fluoride.
While the example in figure 6 provides stages and processes that do not use or create the substance (in this case hydrogen fluoride), the illustration may be of benefit to provide an overview of the entire operation. For the purposes of the Act and regulation, a facility would need to identify and describe the “production stage” and then focus on the “drying process” and the “kiln firing and cooling process”.
Figure 6: Illustration Showing Stages and Processes for Fictional Brick Manufacturing Facility for Hydrogen Fluoride
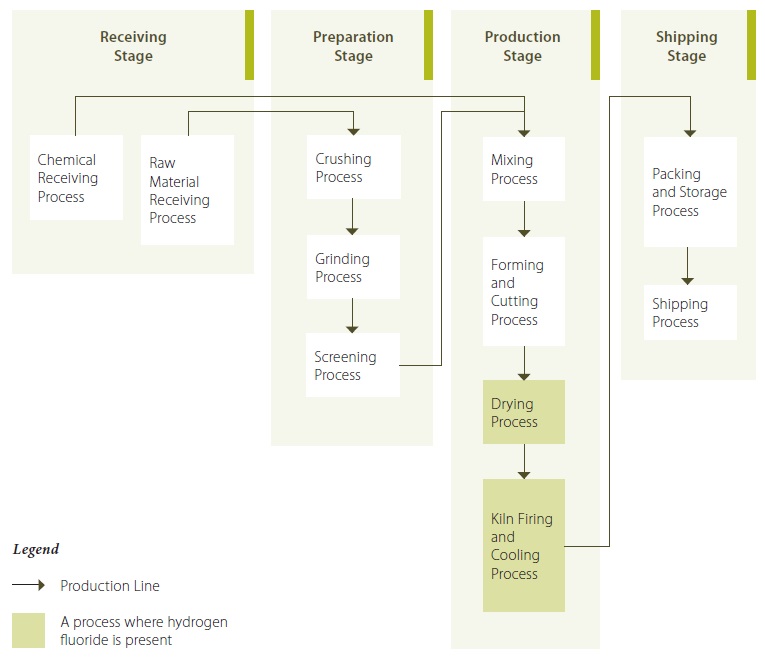
Figure 6 Description
Hydrogen fluoride is a by-product of fluorine. Fluorine is introduced as a constituent in the natural raw materials (including clays and shales). Assay tests show a range of fluorine concentrations from 0.02 to 0.05 % by weight for the raw material received in 2010. During the raw material receiving process of the receiving stage, the raw materials are received in bulk by covered dump trucks from an on-site quarry, are dumped into a hopper which transfers the raw material via an underground conveyor system to a storage area. Chemicals such as pigments are received during the chemical receiving process via truck and are transported to a storage area via forklift. During the preparation stage, the raw material passes through the crushing, grinding and screening processes by mechanical means. During the production stage, the ground, screened clay and shale is mixed with water to a desired consistency, and pigments are added to customers’ specifications. In the forming and cutting process, the mixture is extruded and cut by mechanical means, into bricks sized according to customers’ specifications. The bricks from the forming and cutting process enter the drying process to remove excess moisture from the bricks. The dryers typically are heated to approximately 400°F (200°C) using waste heat from the cooling zone of the kiln. The dried bricks are collected from the drying process and loaded into the kiln firing and cooling process, where the bricks are fired to temperatures reaching between 500 and 600 degrees Celsius. During both the drying process and the kiln firing and cooling process, some of the fluorine present in the bricks is transformed to hydrogen fluoride gas by dehydroxylation. Hydrogen fluoride gas is collected and treated using a dry scrubber containing limestone. The cooled bricks are transferred to the shipping stage, where they are packed, stored and eventually shipped. The brick manufacturing facility generally operates year-round, 24 hour per day, 7 days per week, with the exception of scheduled maintenance. Most of the processes run continuously, with the exception of the drying process and kiln firing and cooling process, which are batch processes that shut down between filling and emptying, since the dryers and kilns must be full before they are run.
4.3 Identifying and Describing Processes of the Operation
The regulation requires that:
“…the owner and the operator of a facility shall create the following records in respect of the toxic substance:
A record that includes process flow diagrams that,
- give a visual representation of the movement of the substance through each process, including how it enters the process, whether it is created, destroyed or transformed during the process, how it leaves the process and what happens to it after it leaves the process, and
- show the relationships between the processes.”
(O. Reg. 455/09, s. 12 (2) 2.)
To determine what is required to describe the processes that use and create a substance, the facility should look at the Act and the regulation together. The Act requires a description that may be provided textually, and the regulation requires a visual representation to describe the movement of the substance.
Specific detail that may be included in the text includes answers to the following questions:
- How and why does the prescribed toxic substance enter the process?
- Where in the process is the prescribed toxic substance created? How is it created? When is it created? Why is it created? Under what conditions?
- What happens to the prescribed toxic substance? Does it become part of a product? Does it end up in a waste, air, or wastewater stream? Does it get transformed into another prescribed toxic substance or is it destroyed? Under what conditions do these occur?
- What happens to it after it leaves the process? Does it go to another process or does it leave the facility?
Figure 7 provides an example for a fictional anodizing facility and describes the process both with text and a visual representation that shows the movement of chromium for the black dye process.
Figure 7: Process Flow Diagram for Black Dye Process Involving Chromium
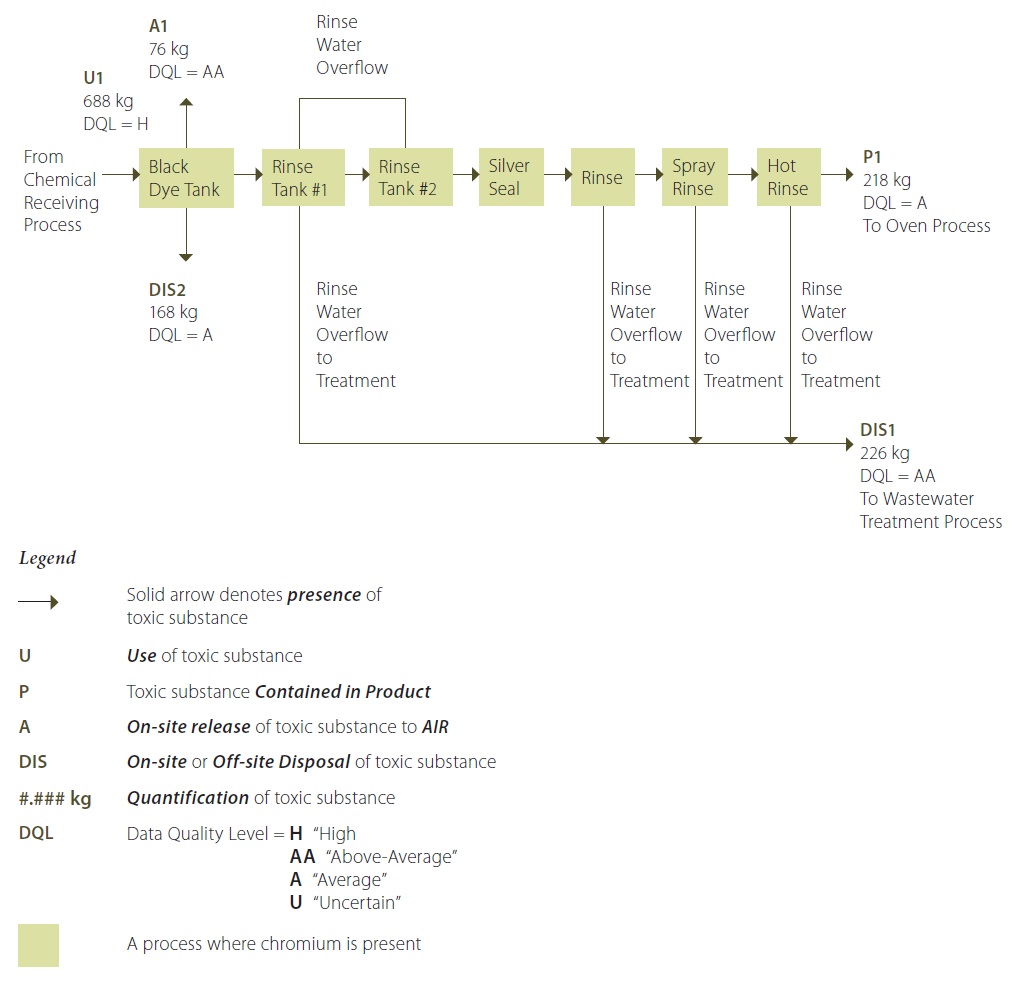
Figure 7 Description:
Chromium is added to the black dye tank from the chemical receiving process (U1). Parts are dipped in the black dye tank in order to give the surface of the part the desired colour and finish. The black dye process involves immersion of parts in this bath, which is a solution containing a trivalent chromium metallized azo dye. A chemical reaction occurs in the bath, and some chromium is deposited on the surface of the parts in the tank. This amount of chromium is now embedded as a surface coating on the part, and it will end up in the final product – passing through the following processes without loss or transformation. Note that the parts are hung on racks, and the operator uses a hydraulic system to lift the racks of parts out of each tank and move it to the next tank for immersion. The parts on the racks typically carry some liquid from each bath into the following bath, which is termed “drag-out” from the preceding bath and “drag-in” to the next bath. Thus, some chromium is “dragged” out of the black dye tank and into the following rinse tank #1. Another portion of chromium is also dragged out of rinse tank #1 and into rinse tank #2, but this is a lesser amount since the concentration of the chromium in the tank #1 is much lower than in the black dye process tank. Rinse water overflow from rinse tank #2 is routed back to rinse tank #1. There is also some drag-out of chromium from rinse tank #2 into the following tank, containing a silver seal product, and then into the following tanks, which are additional rinse ranks. The parts are then transfered to the oven process (P1). Each of the rinse tanks that overflow to the wastewater treatment system potentially carry some chromium from the baths to the wastewater treatment process (DIS1). The black dye rank requires periodic replenishing of the ingredients in the black dye solution. The operator does a quality control check once per sift, and adds a required amount of black dye powder to maintain the bath concentration at a level of 15 g/L. In addition, once per year the entire bath contents are changed, due to the accumulation of contaminants in the bath, and the tank contents are disposed of off-site as hazardous waste by a licenced contractor (DIS2). There is a ventilation system above the black dye tank, and some chromium is lost to the atmosphere as an air emission (A1).
Figure 8 illustrates a process flow diagram example that shows the use, transformation, and destruction of a prescribed toxic substance. This process flow diagram depicts the ore extraction process associated with a fictional gold mining operation. The substance being tracked is ionic cyanide.
Figure 8: Gold Extraction Process Flow Diagram Involving Ionic Cyanide, including Use, Transformation and Destruction
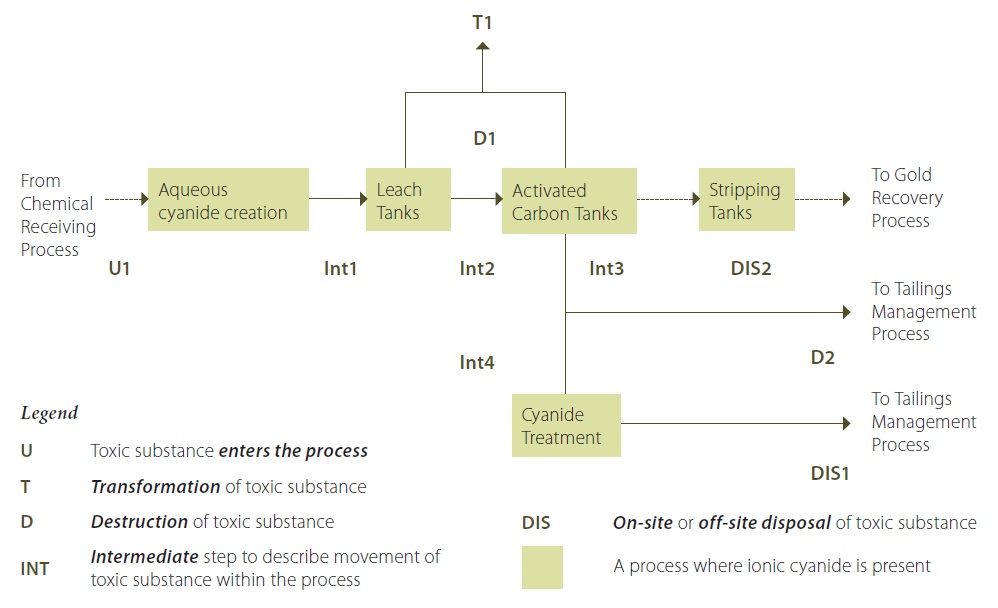
Figure 8 Description:
Cyanide salt (ionic) is added to water to create an aqueous ionic cyanide in a solution (U1). This ionic cyanide solution is added to the raw ore slurry leach tanks. Some of the ionic cyanide bonds with the gold to form aurocyanide in solution. The ionic cyanide that bonds with gold to form aurocyanide is considered to be destroyed. The slurry mixture coming out of the leach tanks (containing water, ground ore, ionic cyanide and aurocyanide (D1) is transferred to activated carbon tanks, where the aurocyanide is adsorbed onto the activated carbon. The slurry in the leach tanks and activated carbon tanks is maintained at a pH of greater than 12 by adding lime to the tanks. This largely avoids the transformation of ionic cyanide to hydrogen cyanide that is released to the air from these activities (T1) (although by nature of the chemical reaction, it is less likely to have zero releases of hydrogen cyanide; however, reducing these releases to less than 1% is possible). The gold-loaded carbon from the activated carbon tanks is then transferred to stripping vessels where the gold is removed from the carbon into a solution. The gold solution is then transfered to the recovery process. The spent ore slurry containing the remaining ionic cyanide from the activated carbon tanks (Int3) is routed to a cyanide treatment area during the coldest six months of 2010 (Int4). In the cyanide treatment area, most of the ionic cyanide is destroyed by being converted into cyanate (D2). The treated spent ore slurry, containing the destroyed cyanide along with a small quantity of untreated ionic cyanide, is transferred to the tailings management process (DIS1). During the warmest six months of 2010, the spent ore slurry from the activated carbon tanks was transfered directly to the tailings management process, bypassing the cyanide treatment area (DIS2).
4.3.1 How a Substance Enters the Process
After identifying which processes use and/or create a prescribed toxic substance, an owner and operator must determine how it enters the process at the facility (as the substance itself or as a constituent of another substance).
It is also important to consider whether the substance enters intentionally or un-intentionally.
Some examples of how a substance may enter a process include:
- The arrival of purchased materials containing the substance in the storage process for later use;
- Hexavalent chromium used in the hard chrome plating tank to be consumed in the chromium plating process;
- The use of zinc in the hot dip tank in the production of galvanized steels;
- The use of hydrochloric, hydrofluoric, and sulfuric acid in the mineral processing activities to extract a metal form ore;
- The use of chromium and nickel alloy to be used for manufacturing of stainless steel;
- Ionic cyanide, as a constituent of wastewater, which enters a cyanide treatment process;
- Chromium and nickel as constituents (alloying elements) of a metallic industrial part (e.g. a semi finished product made by stainless steel) enters a process to receive a ceramic coating.
4.3.2 Creation of Toxic Substance(s)
After identifying which processes use and/or create a prescribed toxic substance, the next step is describing how it is created in the process (whether intentionally or unintentionally).
The “Stability and Reactivity” and “Toxicological Information” sections of a WHMIS-controlled product’s MSDS may provide information on the substances that may be created through normal use of the product or that may be created under special conditions (such as temperature or pressure or mixing with other substances). In the absence of this data, a facility is encouraged to investigate operations that involve the mixing of chemicals, pressure, and temperature to determine whether any new prescribed toxic substances are created. Examples of prescribed toxic substances that may be created include:
- Nitrate compounds formed in wastewater as a result of wastewater treatment operations;
- Hydrochloric, hydrofluoric, and sulfuric acids formed by combustion of coal, raw materials for brick manufacturing;
- Organic compounds including polycyclic aromatic hydrocarbons (PAHs), such as benzo(a)pyrene formed by combustion of fuel sources such as wood and hydrocarbons;
- Dioxins and furans as a result of smelting;
- Styrene formed through the thermoforming of polystyrene;
- Acetylaldehyde formed through the extrusion of polystyrene;
- Creation of ammonia during curing operations;
- Creation of formaldehyde during painting operations;
- Diisocyantes or toluene diisocyanates formed from the chemical reaction of mixing specialty paints;
- Creation of acids or ionic substances (such as cyanides) when their salts are added to an aqueous solution.
The EPA Sector Notebooks provide additional examples of where prescribed toxic substances are created. These notebooks are available online (as of July 2010).
4.3.3 Transformation of Toxic Substances
After identifying which processes use and/or create a prescribed toxic substance, an owner and operator must determine if it is transformed into one or more other prescribed toxic substances.
The “Stability and Reactivity” and “Toxicological Information” sections of a WHMIS-controlled product’s MSDS may provide information on prescribed toxic substances that may be transformed through normal use of the product or that may be transformed under special conditions (such as temperature or pressure or mixing with other substances). In the absence of this data, a facility is encouraged to investigate operations that involved the mixing of chemicals, pressure, and temperature to determine whether prescribed toxic substances are transformed into other prescribed toxic substances. A couple of examples of prescribed toxic substances that may be transformed include:
- Fluorine to hydrogen fluoride as a result of combustion;
- Ionic cyanides to hydrogen cyanide under certain conditions (i.e. pH).
It may be important to understand how and under what conditions transformation occurs. An enhanced understanding of the complex chemistry of a particular process and the response of the process to variables that can be controlled may often result in the identification of options to reduce or eliminate the creation on unwanted by-products.
4.3.4 Destruction of Toxic Substances
After identifying which processes use and/or create a prescribed toxic substance, an owner and operator must determine whether the substance was destroyed. If the substance changes into one or more substances that are not prescribed toxic substances it is considered destroyed under the Act and regulation. This is different than transformation which takes place when a prescribed toxic substance is transformed to another substance that is also prescribed under the regulation.
Examples of destruction include:
- Bonding of an ionic substance (such as cyanides) to another substance to create a more stable molecule (for example, the bonding of ionic cyanide with gold in order to extract gold from ore creates aurocyanide, which is not a prescribed toxic substance)
- On-site treatment of prescribed toxic substances to create substances that are not toxic (for example, the treatment of cyanide to produce cyanates)
- Degradation of prescribed toxic substances into substances that are no longer toxic (for example, cyanide has the ability to naturally degrade into other substances such as cyanates)
4.3.5 Toxic Substance(s) Contained in Product
After identifying which processes use and/or create a prescribed toxic substance, an owner and operator must determine whether the substance leaves the process as contained in product. At the process level, contained in product does not necessarily mean the final product intended for sale. It may also apply to products that are temporary and needed further along in the manufacturing operation.
Examples of substances contained in product leaving a process include:
- The raw materials containing the substance leaving storage to be used in a manufacturing operation or mineral processing;
- When extracting and concentrating copper from an ore, the sulfuric acid leaving with the dissolved copper from one of the purification processes;
- The ethylbenzene in varnish or paints that has been manufactured at the facility that is intended for distribution or sale.
4.3.6 Intermediate
The term “intermediate” may be useful to describe a circumstance when a prescribed toxic substance moves through a process that is not sufficiently covered by any of the other terms provided. This is not in the regulation and it is up to the facility to decide whether it is a useful approach for use in their process flow diagrams.
5.0 Choosing Methods for Tracking and Quantification
The regulation requires that:
“…A record that describes the method or combination of methods used to track and quantify the substance in each process and explains why the method or combination of methods was chosen.”
(O. Reg. 455/09, s. 12 (2) 5.)
The regulation also requires that:
“…the best available method or combination of methods for tracking and quantifying the toxic substance is used, taking the following into consideration:
- How the substance enters the process, what happens to it during the process, how it leaves the process and what happens to it after it leaves the process.
- Industry standards.
- Economic achievability of a method or combination of methods.
- Continuous monitoring, predictive monitoring, source testing or sampling, mass balance, published emission factors, site-specific emission factors and engineering estimates.
- Any methods required to be used for the purposes of meeting a requirement under federal, provincial or municipal law.”
(O. Reg. 455/09, s. 12 (6))
The regulation requires that the amount of a substance that enters the process, is created, transformed, destroyed, contained in product, disposed, released to the environment, or transferred for recycling is tracked and quantified using the best method or combination of methods available to that facility and also requires that a rationale for determining the best available method be provided in a record.
5.1 Determining Best Available Methods
The reason for including the concept of Best Available Methods in the regulation is to convey the importance of data quality generated by the methods chosen and to provide decision making information when determining which toxics reduction options, if any, are worthwhile to implement. The best quality data should be balanced with the considerations set out in regulation, such as existing practices based on industry standards, economic realities, and applicable laws that prescribe methods. Subsections 5.1.1 to 5.1.9 of this toolkit provide some discussion for each of the aforementioned considerations.
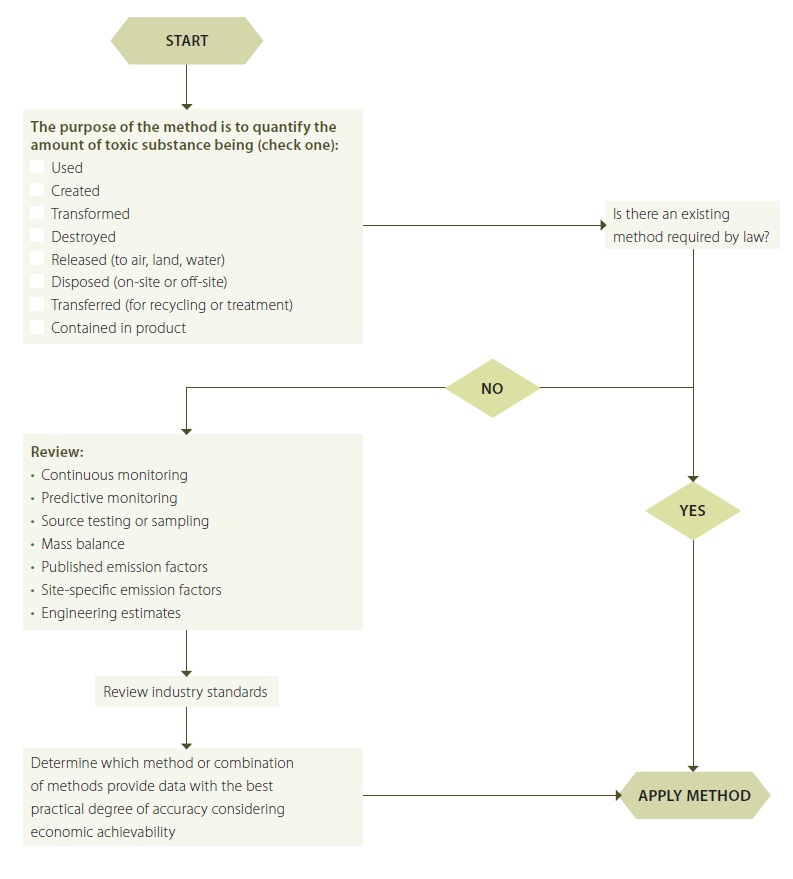
Figure 9 illustrates a decision making approach that may assist a facility in evaluating and selecting a best available method.
The following questions may help a facility to understand the considerations specified in the regulation:
- What is the method quantifying (use, creation, etc)? What form is the prescribed toxic substance in?
- Is there current methodology prescribed by law for measuring the amount of a prescribed toxic substance in the pathway or route?
- If no method is prescribed by law, the owner and operator may consider a number of methods including: continuous monitoring, predictive monitoring, source testing or sampling, mass balance, published emission factors, site-specific emission factors and engineering estimates.
- When considering a direct measurement methodology (such as continuous monitoring, source testing or sampling), consider the following:
- Is there a standard sampling methodology that has been proven to yield reliable results for the prescribed toxic substance and the pathway or route requiring sampling?
- Does the facility have the ability to design and implement a sampling program that will yield results that are representative of the pathway or route requiring quantification? This will be dependent upon access to a sampling point, homogeneity of the stream being sampled, the number of samples required, and the cost to collect and analyze samples for the prescribed toxic substance.
- Are there industry standards for methods? And are there sector specific engineering estimates for quantifying the amount of the prescribed toxic substance?
- What is economically achievable for the facility? Consider the following:
- What is the cost associated with obtaining the data and implementing the method or combination of methods?
- Does a more costly method result in a significantly better data quality level than the next best method (consider the economic achievability of the two methods)?
- Are there other benefits to having data with a higher degree of accuracy - such as from a business or environmental stewardship perspective?
- What data accuracy is needed for decision makers to make the decision to implement a toxic substance reduction option?
Figure 9: Possible Decision Making Process to help Determine Best Available Method
5.1.1 Industry Standards
Industry standards are generally understood to be industry-developed practices that become commonly accepted norms of business practice. Facilities may find it useful to look toward industry developed guidance documents and/or training materials for methodologies of measuring quantities of substances in different processes. These materials may be found through industry associations, trade journals, conference presentations, and potentially developed by the facility itself.
There are a number of sector specific guidance documents, documents on best practices and best management practices, as well as other resources that describe typical processes associated with a given sector, substances used and created, along with their fate. These resources may include quantifications (on transfer rates, emission factors, amount of prescribed toxic substance contained in product) developed from tests performed at a facility within a particular industry, considered to be representative of the industry as a whole and operation tested. For some sectors, there may be numerous published or commonly accepted methods of measuring quantities of substances in different processes that have been developed by industry. In the context of best available methods, the facilities are encouraged to consider the methods that will yield good quality data for their particular facility.
5.1.2 Continuous Monitoring Method
Continuous monitoring is a direct measurement system that records data over an extended and uninterrupted period of time. Once the concentration and the flow rate have been determined, quantification can be accomplished by multiplying the concentration by the flow rate and the length of time in operation. Continuous monitoring is typically used for process water, and air emissions. The benefits of continuous monitoring are that it may provide an accurate representation of concentrations of prescribed toxic substance inputs, transfers and releases. Differences resulting from different batch processes during different shifts or commingling of streams throughout the day, and changes in process parameters, such as temperature, operator input, are all accounted for. Continuous monitoring systems also allow for quantification of streams attributed to non-normal, maintenance, cleaning, or upset conditions. Significant effort may be required to interpret results to determine whether, for quantification purposes, an average annual concentration multiplied by the number of hours of operation would provide a reasonable representation of total mass, considering the number, frequency and impact of non-normal, maintenance, cleaning, and upset conditions/operations.
Continuous emission monitoring is considered to be a higher cost estimation method.
5.1.3 Predictive Monitoring Method
Predictive monitoring is based on developing a correlation between prescribed toxic substance creation, transformation, destruction or adherence to product and process parameters such as fuel usage, raw material input, and oven temperature. Predictive monitoring may be considered a hybrid of continuous monitoring and source testing. A correlation test must first be performed to determine the relationship between prescribed toxic substance creation, transformation, destruction, adherence to product or release and process parameters. For example, a facility (or industry association) may undertake a test or series of tests to determine the amount of a prescribed toxic substance that is released during curing based on the temperature of the oven and how much of a substance adheres to the product. A chart or graph is normally created. A facility may then monitor oven temperatures (a simple and cost effective parameter to measure) and then using the chart determine the amount of the prescribed toxic substance that is contained in product. Quantifications can then be calculated or predicted using process parameters based on the results of the initial correlation test.
5.1.4 Source Testing or Sampling Method
Source testing involves direct measurement of the input, output, or product streams to determine the concentration of a prescribed toxic substance in a sample or stream. The concentration of the toxic substance is then multiplied by the flow rate and time or by the volume to quantify the amount of the prescribed toxic substance for the year. Source testing of air streams generally involves inserting a sampling probe into a stack or duct to collect a volume of exhaust effluent isokinetically. Source testing of air streams may also include drawing a known volume of air through a pump or tube, as for industrial hygiene sampling. The contaminants collected in or on various media are subsequently analyzed. For liquid or solid streams, grab samples or 24-hour composite samples are extracted from the targeted stream. Sampling of product may involve composite of discrete sampling and testing. Judgment is required to determine how to deal with sample results that are below detection limits.
The benefits of source testing are that it can provide an actual concentration of a prescribed toxic substance contained within the targeted stream from a discrete source. However, this data is rarely available to characterize each stream and testing results often represent a “snap-shot” in-time. For batch processes with relatively consistent inputs, source testing is a very accurate means of quantification. However, this would need to be verified by collecting samples from different batch processes during different shifts, and for various process parameters, such as temperature and operator input. Judgment is required to determine an appropriate sampling plan that would provide data representative of the operation/process over a year.
When a manufacturing product is a WHMIS-controlled product in Canada or is destined for export to a location with strict requirements, source testing may be a regulatory requirement for the end product. It may also be required to demonstrate compliance with customer specifications.
Source testing is often conducted as a regulatory requirement for provincial or municipal authorities. Under the Municipal Industrial Strategy for Abatement (MISA) Effluent Monitoring and Effluent Limits regulations, industrial dischargers are required to sample their wastewater discharge, analyze the wastewater discharge samples, and report data based on the results of the analysis of the samples, as well as to ensure that the quality and quantity of wastewater discharge comply with regulatory limits. The Ontario Ministry of Environment document, “Protocol for the Sampling and Analysis of Industrial/Municipal Wastewater” provides guidance on sample types and techniques for grab samples, composite samples, on-line analyzers, automated sampler considerations, and compositing techniques.
Few municipal sewer-use by-laws require effluent sampling. However, municipalities often collect effluent samples downstream of or at industrial facilities to assess compliance with sewer use limits. This data may be available to the facility upon request.
Environmental Compliance Approvals (Industrial Sewage Works) often contain conditions that require approval holders to sample their discharge, analyze the discharge samples, and report data based on the results of the analysis of the samples.
Source testing for air emissions is not a common condition of Environmental Compliance Approval (Air). However, during the application process the Ministry may require source testing to support engineering estimates. In these cases the source testing methodology may be prescribed or may need to be approved prior to testing.
Source testing of waste streams is routinely undertaken by the waste receiver prior to acceptance of the waste and on a random and set frequency to confirm that the waste treatment facility can accept the material. Such analytical data is available to the generating facility.
5.1.5 Published Emission Factors Method
Emission factors are typically constants (usually expressed in mass emission per unit of production or mass of raw material input) which are applied to a process parameter or production rate to generate an emission rate. The most commonly used emission factors are those published by the United States Environmental Protection Agency (US EPA). The US EPA, other regulatory agencies, and industry associations use data from past source testing performed at one or more facilities within a specific subsector to develop emission factors for a variety of industrial processes. These emission factors may provide reasonable assumptions of concentrations of prescribed toxic substances emitted/released when they are applied to a source that they were meant for.
The basic equations for determining emissions from emission factors are as follows:
Ex = BQ × CEFx
or
Ex = BQ × EFx × (100 − CEx) ⁄ 100
Where:
- Ex
- Emission of contaminant x in kg (or other unit of mass)
- BQ
- Activity rate or base quantity (BQ), base quantity unit
- CEFx
- Controlled emission factors of contaminant x, in kg/BQ (value is dependent on the external control devices installed, if any)
- EFx
- Uncontrolled emission factors of contaminant x, in kg/BQ
- CEx
- Overall emission control efficiency of contaminant x, %
The following sources of emission factors are commonly used and widely available:
- Emission Factors published in the US EPA Document Number AP-42, Compilation of Air Pollutant Emission Factors. This document includes process descriptions and emission factors for a broad range of criteria contaminant emission sources. Supplements are published regularly.
- Factor Information Retrieval (FIRE) Data System. The FIRE Data System (from the US EPA) is a database that may be used in initial efforts to identify contaminants. Note: although the FIRE Data system may be used to identify contaminants from a variety of sources, the quality of the emission factors listed in this system varies.
- Locating and Estimating (L&E) documents for specific prescribed toxic substances. The L&E report series are for specific air emissions from sources (source category or substance) and characterizes the source categories for which emissions of a prescribed toxic substance have been identified. These volumes include general descriptions of the emitting processes, identifying potential release points and emission factors. The L&E series presently contains emission reports for prescribed toxic substances such as Acrylonitrile, Arsenic, Benzene, 1,3Butadiene, Cadmium, Carbon Tetrachloride, Chlorobenzene, Chloroform, Chromium, Cyanide, Dioxins and Furans, Formaldehyde, Lead, Mercury, Methyl Chloroform, Methyl Ethyl Ketone, Methylene Chloride, Nickel, Perchloroethylene, Styrene, Toluene, and Xylene.
- U.S. state environmental agencies also publish information such as the National Association of Clean Air Agencies (NACAA).
- Guidance and emission rate estimating information provided by the Ontario Ministry of Environment and Climate Change for O. Reg. 127/01 – Airborne Contaminant Discharge Monitoring and Reporting and provided by Environment Canada for reporting to the National Pollutant Release Inventory.
- Contaminants identified from site- specific source testing and/or industry sponsored studies.
5.1.6 Site-specific Emission Factors Method
Industrial facilities may also develop their own site-specific emission factors using emission- testing data and source activity information. For a particular piece of equipment, specified emission factors may be available from the manufacturer. It is cautioned though that facilities only rely on equipment specified emission factors if the equipment is used for the application intended and is operated and maintained in accordance with the specifications and manufacturers’ operating and maintenance manuals.
5.1.7 Engineering Estimates Method
In many cases, engineering assessments are the most appropriate approach to determining process factors and base quantity values. Concentrations of prescribed toxic substances in various targeted streams may be estimated from engineering principles and judgment, by using knowledge of the chemical and physical processes involved, the design features of the source and an understanding of the applicable physical and chemical laws. The reliability of these estimates depends on the complexity of the process and the level of understanding of its physical-chemical properties. The best practice to applying engineering estimates may include the following basic principles:
- Review data pertaining to the specific source and to the industrial sector in general;
- Use the data to provide gross approximations and refine them using sound engineering principles as data becomes available to provide more accurate estimations;
- Whenever possible, alternate methods of calculation should be followed to cross-check each level of approximation;
- Employ good record keeping by documenting all related information for further emission refinement when more accurate data becomes available.
The use of derived formulae (sometimes in combination with accepted empirical data) is also considered an engineering estimate.
The following provides an example of an engineering estimate for determining toluene emissions from a solvent waste storage tank during filling operations:
Assumptions:
The volume of vapour emitted when filling a waste tank will be the same as the volumetric flow rate of the liquid entering the tank as long as the liquid entering the tank is not under pressure.
A typical truck pump has a volumetric flow rate of 50 US Gallons per minute (190 L/min). The concentration of a contaminant in the vapour phase is proportional to the mole fraction of that contaminant in the liquid times its vapour pressure (Raoult’s Law).
Assume the facility empties the waste tank at 50 US Gallons per minute (190 L/min) to the truck. Since the vapour emission rate is the same as the liquid transfer rate, the emission from the waste tank vent is 50 US Gallons per minute (3.15 L/s) of saturated vapour at 20°C (293.15 K) and atmospheric conditions. This temperature is generally higher than expected in an external tank in Ontario (even in the summer) but the saturated vapour pressure is generally published at 20°C or 25°C so the emission calculated may be conservatively high.
Assume the liquid in the waste tank has the following composition:
- Saturated vapour pressure for toluene is 22.4(mmHg)
- Molecular weight of toluene is 92.13(g/g-mole)
- Weight % Composition (Mass basis) is 65% (from analytical testing results)
If 1 kg of solvent is used as a base, the moles of each contaminant is calculated as:
Moles Toluene ⁄ kg Solvent = “Weight % Composition” ÷ “Molecular Weight”. So, Moles of Toluene⁄kg of Solvent = 0.007055 kg-moles
The liquid phase mole fraction (F) = moles of contaminant in liquid phase ÷ total moles in liquid phase. So the liquid phase mole fraction for toluene is 0.007055 ÷ 0.01144 = 0.62.
For an ideal gas, the Ideal Gas Law says PV = nRT
Where:
- P
- Pressure of the gas (101.3 kPa at atmospheric pressure)
- V
- Volume of gas (in L)
- n
- moles of gas (in g-mol)
- R
- 8.314 kPa L/g-mol K
- T
- Temperature (in Kelvin)
- n
- M ÷ Mwt
Where:
- n
- moles of gas (in g-mol)
- M
- mass of gas (in g)
- Mwt
- molecular weight of the contaminant (in g-mol)
So the mass emission rate of toluene from the tank is M = MwtPV ÷ RT = 0.2195 g/s.
Note: This example is derived from the Ministry of Environment and Climate Change’s “Ontario Air and Noise Best Practices” document for Vapour Emissions from a Solvent Waste Storage Tank.
5.1.8 Mass Balance Method
Using a mass balance method involves applying the law of conservation of mass to a process or piece of equipment. If there is no accumulation, then all the materials that go into the activity or process must come out. Releases are determined from the differences in input, output, accumulation and depletion of a substance. The general equation for a mass balance is:
Min = Mout + Maccumulated/depleted
Where:
- Min
- Mass of compound in the raw material feed + mass created
- Mout
- Mass of compound in the finished product and released to air, land and water (Mout = Mproduct + Memitted)
- Maccumulated/depleted
- Mass of compound accumulated or depleted in the system
The reliability of quantifications based on mass balances is dependent on the source type considered. In general the mass balance method may be appropriate for some quantifications, such as solvent use and transfers. However, this method may not be suitable for many other sources, such as cases where chemical transformation of input streams occurs. Field verification of material usages may be recommended for these cases.
5.2 Feedstock
It is recognized that raw materials such as ore, coal, crude oil or trees, pose a challenge to facilities in tracking and quantifying substances that are entering relevant processes. These raw materials derived from resource based operations are called feedstock materials. While the regulation requires tracking and quantification of prescribed toxic substances in processes (which may include feedstock materials) the regulation does not prescribe any specific method, only that it is the best available method or combination of methods. Best available methods may include a combination of analytical testing results and industry best practices.
For example, the pulp and paper industry, NCASI and Forest Product Innovation Centre (FPIC) maintain (member access only) databases that provide standard concentrations of various NPRI substances by species of tree, or by type of recycled material used as feedstock. The FPIC has data that is more applicable to Canadian or regional feedstock sources as it incorporates the influence of Canadian soil bases into the values (i.e. Canadian Shield).
One source for estimating concentrations of substances in ore feedstock could come from an individual facility’s assay results (in addition to other testing methods, depending upon the type of mining) which would provide the average fractions of a limited suite of parameters in feedstock. However, not all of the listed prescribed toxic substances that may be contained in the ore will be tested. For example, some metals are commonly found together, so this will influence what gets tested when characterizing a vein.
For the petroleum industry, the Chemistry Industry Association of Canada, has commissioned several studies on best practices for calculating releases of volatile organic compounds (VOCs) such as benzene, toluene, ethylbenzene and xylene from the management of feedstock materials.
The US Agency for Toxic Substances and Disease Registry (ASTDR) may also provide information on the concentration of prescribed toxic substances in raw materials derived from petroleum products.
5.3 Assigning a Quality Level to Data Quantification Methods
This section of the toolkit provides some discussion regarding the quality of data that certain methods produce versus others. It should not be interpreted as the ministry requiring or preferring one method over another, but rather as simply providing an approach to assigning a data quality level classification system.
“Highest” Data Quality Level Quantification Methods
- Continuous monitoring of prescribed toxic substances, according to an approach that has been validated by a regulatory agency.
- Comprehensive and validated source testing over a range of operating conditions.
- Quantifications that are derived from comprehensive equipment-specific testing (e.g., source tests are conducted to measure a prescribed toxic substance contained in targeted stream over a range of operating conditions where process data was available and recorded; and result in a statistically significant data set).
- Mass balance for processes where:
- 100% of the material balance is accounted for (e.g., 100% emitted to air as may be the case for some highly volatile prescribed toxic substances); and
- is reasonable to assume that the prescribed toxic substance will not undergo a chemical transformation through the source/process.
“Above-Average” Data Quality Level Quantification Methods
- Validated source testing at one specific operating condition.
- Quantifications that are developed from tests on a moderate to large number of industry sources where the source category population is sufficiently specific to minimize variability.
- Engineering calculations/judgment: Quantifications derived from fundamental scientific and engineering principles.
“Average” Data Quality Level Estimating Quantification Methods
- Quantifications that are developed from tests on a reasonable number of facilities where the source category population is sufficiently specific to minimize variability.
- Engineering calculations/judgment: Quantifications derived from fundamental scientific and engineering principles and/or relevant empirical data.
- Partially validated source testing at one specific operating condition: emission rate estimates that are from source testing where the testing has only been partially validated at a specific operating condition.
“Marginal” or “Uncertain” Data Quality Level Quantification Methods
- Un-validated source testing at one specific operating condition: emission rate estimates that are from un-validated source testing.
- Quantifications that are developed from tests on only a small number of facilities where there is evidence of variability within the source category population
- Calculations/judgment: Quantifications derived from calculations where the scientific/technical integrity of the approach is uncertain are considered to have uncertain data quality.
5.4 Describing Methods
The regulation requires that:
“…A record that describes the method or combination of methods used to track and quantify the substance in each process and explains why the method or combination of methods was chosen.”
(O. Reg. 455/09, s. 12 (2) 5.)
The purpose of the requirement to describe the method or combination of methods is to:
- Provide details on the decision making process for choosing the best available method at the current time and share it with other people at the facility for future years;
- Provide contextual information on the numbers generated by the method(s) chosen; and
- When applicable, determine if a change in the method(s) is (are) warranted. Please note that there is further discussion on when it is appropriate to change the method(s) in section 5.5 of this toolkit.
5.5 Maintaining Consistency in Tracking and Quantification Methods
The regulation requires that:
The method or combination of methods used for tracking and quantifying a toxic substance for a process shall not be changed unless,
- the change is as a result of a review of the current version of the toxic substance reduction plan for the substance under section 7 of the Act; or
- the change is for the purposes of complying with a requirement under an Act, an Act of Canada or a municipal by-law.
- subject to subsection (7.1), the change,
- is made as a result of a recommendation provided by a toxic substance reduction planner under section 18.2, and
- is made after the recommendation is provided and before June 1 in the year immediately following the year in which the recommendation was required to be obtained.
(7.1) Clause (7) (c) does not apply if the recommendation is provided in respect of a new version of a plan prepared as a result of an amendment under section 5 of the Act.”
(O. Reg. 455/09, s. 12 (7))
“If the method of combination of methods for tracking and quantifying a toxic substance is changed under subsection (7), the record created under paragraph 5 of subsection (2) shall be amended to describe the new method or combination of methods and the owner and the operator of the facility shall ensure that the change is reflected in the next version of the toxic substance reduction plan.”
(O.Reg.. 455/09, s. 12 (8))
The regulation requires that once a facility decides upon the best available method or combination of methods, it must continue to use the method(s) until the toxic substance reduction plan is reviewed. Plan reviews are required in 2019, 2023, and every five years thereafter. However, if required by another law, a method may be changed in between the review periods. The rationale behind requiring that the method remains consistent is based on the overall objective of the Program, to show trends and comparisons from one year to the next. If changes in the quantifications occur due to a change in methodology, it would be difficult for a facility to demonstrate that the change occurred due to actions resulting from implementation of an option in the toxic substance reduction plan.
For clarification purposes, a change in methodology refers to a change from one method listed in the regulation to another (continuous monitoring, predictive monitoring, source testing or sampling, mass balance, published emission factors, site-specific emission factors and engineering estimates). For example, from engineering estimates to mass balance or from one combination of methods to another.
A facility may update or improve an existing methodology that it has been using. For example, if a facility has been using published emissions factors and there is a newly published update, the facility may use the updated value without it being considered a change in method.
This above clarification may help address some concerns that facilities may have with regard to ensuring that they are meeting the spirit of NPRI. NPRI guidance encourages facilities to use better methods as they become available. While NPRI does not prescribe the continued use of a methodology listed in its Gazette notice, O. Reg. 455/09 requires the continued use of a method(s) subject to certain exceptions as described in the regulation.
| Process | Method/ Combination of Methods | Industry Standards | Economic Achievability | Considerations |
|---|---|---|---|---|
| Electroplating: Decorative chromium plating | Engineering estimate* | Estimation based on process parameters, engineering principles, pilot testing, data from process texts | Cost for facility internal resources or external consultants | Time and chromium thickness conversion data/chart for reliable process parameters need to be prepared; published reports to be assessed for applicability Average data quality |
| Electroplating: Decorative chromium plating | Predictive monitoring* | Includes process time measurement; determining electroplating time for specific products based on real time data, electroplating constants, equipment specifications, conversion charts and modeling | Costs for analysis of existing process data and to determine correlation | Time and chromium thickness conversion data/chart for reliable process parameters need to be prepared Average data quality |
| Electroplating: Decorative chromium plating | Continuous monitoring | Coating thickness gauges: Magnetic Induction or XRF (X-Ray Fluorescence Spectrometry) | Significant equipment cost involved to purchase thickness gauge(s);sample preparation costs | Some thickness interference limitations for XRF monitoring Highest data quality |
| Electroplating: Decorative chromium plating | Mass balance* | No industry standard for precise measurement of mass in-mass out | Costs for scale | May be feasible for smaller parts |
| Electroplating: Decorative chromium plating | Source testing/Sampling | Metallographic evaluation: cutting/lathing, preparing and observing by microscope | Equipment for sample preparation and optical microscope/costs | Sample preparation time Determination of representative number of samples per product Above-average data quality |
| Electroplating: Decorative chromium plating | Site-specific emission factor/Published emission factor | Not Applicable | Not Applicable | Not Applicable |
Note: There is no existing methodology required by law for quantification of chromium contained in product. For this process, chromium is contained in the coating on the product leaving the process. Quantification includes the determination of the amount of chromium in the coating and the amount of coating on product (surface areas and thickness).
In this example, the best available methods for quantification of chromium in product would be a combination of Engineering estimate and Predictive monitoring along with one of the following methods:
- Mass balance (for small to medium products)
- continuous monitoring (for big or complex products)
- Sampling.