2022–23 Third Quarter Finances
The Third Quarter Finances report contains information about Ontario’s 2022–23 fiscal outlook, primarily as of December 31, 2022.
Highlights
- Ontario’s real gross domestic product (GDP) increased 0.4 per cent in the third calendar quarter of 2022, following a 0.9 per cent gain in the second quarter of 2022. Real GDP in the third quarter was 4.0 per cent above the pre-pandemic level in the fourth quarter of 2019.
- Compared to the 2022 Ontario Economic Outlook and Fiscal Review (also referred to as the Fall Economic Statement, or FES), the estimated projection for both real and nominal GDP growth in 2022 has been revised upwards, while the private sector projection for real and nominal GDP growth in 2023 has been revised downwards.
- As of the 2022–23 Third Quarter Finances, the province’s 2022–23 deficit is projected to be $6.5 billion — $13.3 billion lower than the outlook published in the 2022 Budget, and $6.4 billion lower than the 2022 Ontario Economic Outlook and Fiscal Review, primarily due to higher than forecast taxation revenues. Similar updates have been seen in other jurisdictions across Canada.
- Revenues in 2022–23 are projected to be $16.6 billion higher than forecast in the 2022 Budget and $9.6 billion higher than expected in the 2022 Ontario Economic Outlook and Fiscal Review, mainly reflecting stronger than expected taxation revenues as a result of higher net tax assessments for 2021 and prior years, based on new information from the Canada Revenue Agency, received since the release of the 2022 Ontario Economic Outlook and Fiscal Review.
- Overall program expense in 2022–23 is projected to be $188.6 billion, $3.4 billion higher than forecast in both the 2022 Budget and the 2022 Ontario Economic Outlook and Fiscal Review, mostly due to significant one-time costs associated with ongoing land and land-related claims with Indigenous communities.
Introduction
Amid global geopolitical conflict, high inflation, rising interest rates and ongoing supply chain challenges, Ontario’s economy has remained resilient in the face of ongoing uncertainty, with real gross domestic product (GDP) estimated to have increased by 3.7 per cent in 2022.
Ontario’s economy is not immune to an expected economic slowdown in 2023, as demonstrated by private sector forecasters revising their GDP forecasts lower, on average, for that year, since the release of the 2022 Ontario Economic Outlook and Fiscal Review. That is why the government is maintaining its responsible fiscal plan, which includes ensuring fiscal policy works in tandem with monetary policy, while delivering on its Plan to Build.
Against this backdrop, the government is remaining transparent and accountable by releasing the 2022–23 Third Quarter Finances, which provides updated information about the evolution of Ontario’s economic and fiscal outlook since the release of the 2022 Ontario Economic Outlook and Fiscal Review.
The government plans to provide its next economic and fiscal update as part of the 2023 Budget, on or before March 31, 2023.
Section A: Ontario’s 2022–23 Fiscal Outlook
The province’s 2022–23 deficit is projected to be $6.5 billion — $13.3 billion lower than the outlook published in the 2022 Budget, and $6.4 billion lower than the 2022 Ontario Economic Outlook and Fiscal Review, primarily due to higher than forecast taxation revenues.
Revenues in 2022–23 are projected to be $196.4 billion, $16.6 billion higher than forecast in the 2022 Budget and $9.6 billion higher than projected in the 2022 Ontario Economic Outlook and Fiscal Review. The increased revenue forecast reflects stronger than expected taxation revenues as a result of higher net tax assessments for 2021 and prior years, based on new information received from the Canada Revenue Agency since the release of the 2022 Ontario Economic Outlook and Fiscal Review. Similar to other provinces, Ontario incorporates updated information received from the Canada Revenue Agency into its regular financial updates.
Overall program expense in 2022–23 is projected to be $188.6 billion, $3.4 billion higher than forecast in both the 2022 Budget and the 2022 Ontario Economic Outlook and Fiscal Review. Increases in program expense since the release of the 2022 Ontario Economic Outlook and Fiscal Review are primarily due to significant one-time costs associated with ongoing land and land-related claims with Indigenous communities, where Ontario is in active negotiations, or claims are accepted for negotiation or are under review
Other program expense increases since the release of the 2022 Ontario Economic Outlook and Fiscal Review include: spending related to reopening of colleges and its resulting additional on-campus activity; the government’s commitment to support the City of Toronto, to address a portion of its 2022 operating deficit; and additional funding for prevention and containment of COVID-19 at long-term care homes. These expenses have been partially offset by additional third-party revenues from colleges, ministry underspending, particularly for infrastructure projects, and through the drawdown of existing contingencies within the fiscal plan.
Interest on debt is projected to be $13.4 billion, slightly lower than the $13.5 billion forecast in the 2022 Budget and approximately $0.2 billion lower than the $13.6 billion projection in the 2022 Ontario Economic Outlook and Fiscal Review,due to a lower deficit than previously estimated partially offset by higher than forecast interest rates.
As a result of the lower deficit, the net debt-to-GDP ratio is projected to be 38.3 per cent in 2022–23, 3.1 percentage points lower than the 41.4 per cent forecast in the 2022 Budget and 0.1 percentage points lower than projected in the 2022 Ontario Economic Outlook and Fiscal Review.
The 2022 Budget included a $1.0 billion reserve in 2022–23, to protect the fiscal outlook against any unforeseen changes in the province’s revenue and expense forecasts. This reserve has been maintained as part of the current fiscal outlook. It provides additional prudence in the government’s fiscal framework and is distinct from contingency funds that set aside dedicated funding to be allocated in response to emerging needs. If not needed, the reserve is eliminated at year-end as part of the final projection for 2022–23 published in the 2023 Budget.
| Item | 2022 Budget | Current Outlook | In-Year Change |
|---|---|---|---|
| Revenue | 179,798 | 196,447 | 16,649 |
| Expense — Programs | 185,163 | 188,554 | 3,392 |
| Expense — Interest on Debt | 13,485 | 13,442 | (43) |
| Total Expense | 198,648 | 201,996 | 3,349 |
| Surplus/(Deficit) Before Reserve | (18,850) | (5,549) | 13,301 |
| Reserve | 1,000 | 1,000 | – |
| Surplus/(Deficit) | (19,850) | (6,549) | 13,301 |
Notes: Numbers may not add due to rounding. Current outlook primarily reflects information available as of December 31, 2022, as well as other significant updates to the fiscal plan.
Sources: Ontario Treasury Board Secretariat and Ontario Ministry of Finance.
Revenue
Revenues in 2022–23 are projected to be $196.4 billion, $16.6 billion higher than forecast in the 2022 Budget and $9.6 billion higher than forecast in the 2022 Ontario Economic Outlook and Fiscal Review.
The forecast for Total Taxation Revenue increased by $8.7 billion, compared to the 2022 Ontario Economic Outlook and Fiscal Review. Key changes in the taxation revenue outlook, compared to the 2022 Ontario Economic and Fiscal Review, include:
- Corporations Tax revenue increased by $5.0 billion, mainly due to higher amounts from processing 2021 and prior year tax returns by the Canada Revenue Agency;
- Sales Tax revenue increased by $3.4 billion, largely due to an upward revision by the federal government, in December of 2022, to Ontario’s 2021 HST official entitlements;
- Personal Income Tax revenue increased by $0.5 billion, mainly due to higher compensation of employees growth for 2022, reflecting strong growth in employment;
- Land Transfer Tax is $233 million lower, reflecting slowing activity in the housing market; and
- All Other Taxes combined increased by $83 million, mainly due to higher revenues from the Gasoline Tax and Education Property Tax, partially offset by lower revenues from the Employer Health Tax, Ontario Health Premium and Fuel Tax.
Net income from Government Business Enterprises is $251 million higher, mainly due to higher net income from Ontario Power Generation, reflecting higher production and lower costs, and partially offset by lower revenue from the LCBO, reflecting lower than anticipated sales.
Projected Government of Canada Transfers decreased by $207 million since the release of the 2022 Ontario Economic Outlook and Fiscal Review, mainly due to lower revenues received as a result of slower than expected progress on projects under the Investing in Canada Infrastructure Program.
Other Non-Tax Revenues combined are projected to increase by $898 million, due to higher third-party revenues from colleges reflecting projected growth in international student enrolments and revenues from other on-campus services.
| Item | 2022–23 |
|---|---|
| 2022 Budget Total Revenue Outlook | 179,798 |
| Revenue Changes in the 2022–23 First Quarter Finances | 1,204 |
| Revenue Changes in the 2022 Ontario Economic Outlook and Fiscal Review | 5,820 |
| Revenue Changes Since the 2022 Ontario Economic Outlook and Fiscal Review — Corporations Tax | 4,960 |
| Revenue Changes Since the 2022 Ontario Economic Outlook and Fiscal Review — Sales Tax | 3,420 |
| Revenue Changes Since the 2022 Ontario Economic Outlook and Fiscal Review — Personal Income Tax | 453 |
| Revenue Changes Since the 2022 Ontario Economic Outlook and Fiscal Review — Land Transfer Tax | (233) |
| Revenue Changes Since the 2022 Ontario Economic Outlook and Fiscal Review — All Other Taxes | 83 |
| Revenue Changes Since the 2022 Ontario Economic Outlook and Fiscal Review — Total Taxation Revenue | 8,683 |
| Revenue Changes Since the 2022 Ontario Economic Outlook and Fiscal Review — Government of Canada Transfers | (207) |
| Revenue Changes Since the 2022 Ontario Economic Outlook and Fiscal Review — Government Business Enterprises | 251 |
| Revenue Changes Since the 2022 Ontario Economic Outlook and Fiscal Review — Other Non-Tax Revenue | 898 |
| Total Revenue Changes Since the 2022 Ontario Economic Outlook and Fiscal Review | 9,626 |
| 2022–23 Third Quarter Finances Total Revenue Outlook | 196,447 |
Notes: Numbers may not add due to rounding. Current outlook primarily reflects information available as of December 31, 2022, as well as other significant updates to the fiscal plan.
Source: Ontario Ministry of Finance.
Additional developments could materially affect the 2022–23 revenue outlook as new information becomes available during and well after the end of the 2022–23 fiscal year. These include changes to the economic growth outlook, the results from 2022 tax return processing, revenue collections from Ontario-administered taxes and the earnings of government business enterprises. The government will monitor these developments and provide further details in future fiscal updates.
Expense
Total expense is projected to be $202.0 billion, or $3.3 billion higher than the 2022 Budget projection and $3.2 billion higher than the projection at the time of the 2022 Ontario Economic Outlook and Fiscal Review. Changes to expense since the release of the 2022 Ontario Economic Outlook and Fiscal Review are largely driven by ongoing land and land related claims with Indigenous communities, where Ontario is in active negotiations, or claims are accepted for negotiation or are under review.
Other program expense increases include: spending related to reopening of colleges following the easing of public health restrictions and resulting additional on-campus activity; the government’s commitment to support the City of Toronto, to address a portion of its 2022 operating deficit; and additional funding for prevention and containment of COVID-19 at long-term care homes. These expenses have been partially offset by additional third-party revenues from colleges, ministry underspending, particularly for infrastructure projects, and through the drawdown of existing contingencies within the fiscal plan.
| Item | 2022–23 |
|---|---|
| 2022 Budget Total Expense Outlook | 198,648 |
| Total Expense Changes in the 2022–23 First Quarter Finances | 105 |
| Total Expense Changes in the 2022 Ontario Economic Outlook and Fiscal Review | 15 |
| Total Program Expense Changes Since the 2022 Ontario Economic Outlook and Fiscal Review — Land and Land Related Claims | 5,000 |
| Total Program Expense Changes Since the 2022 Ontario Economic Outlook and Fiscal Review — College Sector Spending – Consolidation | 727 |
| Total Program Expense Changes Since the 2022 Ontario Economic Outlook and Fiscal Review — Support for a Portion of the City of Toronto’s 2022 Operating Deficit | 235 |
| Total Program Expense Changes Since the 2022 Ontario Economic Outlook and Fiscal Review — Prevention and Containment of COVID‑19 in Long-Term Care Homes | 183 |
| Total Program Expense Changes Since the 2022 Ontario Economic Outlook and Fiscal Review — Additional Funding for the Alcohol and Gaming Commission of Ontario | 35 |
| Total Program Expense Changes Since the 2022 Ontario Economic Outlook and Fiscal Review — Additional Resources for the Landlord and Tenant Board and Ontario Land Tribunal | 4 |
| Total Program Expense Changes Since the 2022 Ontario Economic Outlook and Fiscal Review — Enhancement of Emergency Management Ontario | 3 |
| Total Program Expense Changes Since the 2022 Ontario Economic Outlook and Fiscal Review — Ontario Student Assistance Program (OSAP) Underspending | (90) |
| Total Program Expense Changes Since the 2022 Ontario Economic Outlook and Fiscal Review — Ministry of Economic Development, Job Creation and Trade Savings | (102) |
| Total Program Expense Changes Since the 2022 Ontario Economic Outlook and Fiscal Review — Public Safety Radio Network (PSRN) Underspending | (155) |
| Total Program Expense Changes Since the 2022 Ontario Economic Outlook and Fiscal Review — Ministry of Infrastructure Program Underspending | (700) |
| Total Program Expense Changes Since the 2022 Ontario Economic Outlook and Fiscal Review — Total Program Expense Changes Since the 2022 Ontario Economic Outlook and Fiscal Review — All Other Changes | (10) |
| Total Program Expense Changes | 5,130 |
| Net Drawdown of the Contingency Fund | (1,738) |
| Total Net Program Expense Changes Since the 2022 Ontario Economic Outlook and Fiscal Review | 3,392 |
| Interest on Debt Change Since the 2022 Ontario Economic Outlook and Fiscal Review | (163) |
| Total Expense Changes Since the 2022 Ontario Economic Outlook and Fiscal Review | 3,229 |
| 2022–23 Third Quarter Finances Total Expense Outlook | 201,996 |
Notes: Numbers may not add due to rounding. Current outlook primarily reflects information available as of December 31, 2022, as well as other significant updates to the fiscal plan.
Sources: Ontario Treasury Board Secretariat and Ontario Ministry of Finance.
Program Expense Update
Total program expense in 2022–23 is projected to be $188.6 billion, $3.4 billion higher than forecast in both the 2022 Budget and the 2022 Ontario Economic Outlook and Fiscal Review. Increases in program expense since the release of the 2022 Ontario Economic Outlook and Fiscal Review are primarily due to significant one-time costs associated with ongoing land and land-related claims with Indigenous communities.
Details of key changes to program expense projections since the release of the 2022 Ontario Economic Outlook and Fiscal Review include the following:
- $5.0 billion in one-time expense associated with ongoing land and land related claims with Indigenous communities, where Ontario is in active negotiations, or claims are accepted for negotiation or are under review;
- $727 million in accounting adjustments for higher than forecast college sector spending from increased on-campus activities following the easing of public health restrictions, offset by third-party revenues;
- $235 million to support a portion of the City of Toronto’s operating deficit with up to one third of the city’s projected 2022 COVID-19 pressures, ensuring continued operations and the provision of public services;
- $183 million to help long-term care homes prevent and contain the spread of COVID-19, including increased staffing supports;
- $35 million to support the operations of the Alcohol and Gaming Commission of Ontario, primarily as a result of reduced recoveries from regulated sectors;
- $4 million for additional resources for the Landlord and Tenant Board and Ontario Land Tribunal, to improve service standards and facilitate the faster resolution of disputes in order to increase housing supply; and
- $3 million in additional funding to support increased capacity at Emergency Management Ontario, to better respond to future public health threats.
Other changes to program expense, representing ministry savings and underspending, are outlined below. Through the course of the year, circumstances may give rise to savings and underspending due to effective fiscal management to obtain greater value for money, changes to program take-up, federal program changes, delays by project partners outside of the government’s direct control and other factors:
- $90 million in underspending in the Ministry of Colleges and Universities, related to lower than expected student uptake for financial assistance;
- $102 million in underspending for the Ministry of Economic Development, Job Creation and Trade, due to updated timing of initiative delivery into future years;
- $155 million in underspending in the Ministry of the Solicitor General, related to the Public Safety Radio Network;
- $700 million in underspending in the Ministry of Infrastructure, accompanied by a reduction in federal revenue of $170 million, due to revised implementation timelines for a number of planned infrastructure projects, including those related to high-speed internet and the Investing in Canada Infrastructure Program; and
- All Other Changes of $10 million in underspending.
$1.7 billion in program expense changes have been offset from contingencies.
Interest on Debt Expense Update
Interest on debt expense is projected to be $13.4 billion, slightly lower than the $13.5 billion forecast in the 2022 Budget and approximately $0.2 billion lower than the $13.6 billion projection in the 2022 Ontario Economic Outlook and Fiscal Review. Due to rising interest rates, Ontario’s cost of borrowing has, however, increased to 4.0 per cent, which is higher than the 3.4 per cent forecast in the 2022 Budget but lower than the 4.2 per cent forecast in the 2022 Ontario Economic Outlook and Fiscal Review.
Fiscal Prudence
The Fiscal Sustainability, Transparency and Accountability Act, 2019 requires Ontario’s fiscal plan to incorporate prudence in the form of a reserve to protect the fiscal outlook against unforeseen changes in the province’s revenue and expense, including those resulting from Ontario’s economic performance. The 2022 Budget included a reserve of $1.0 billion in 2022–23, which has been maintained as part of the current fiscal outlook. If not needed, the reserve is eliminated at year-end as part of the final projection for 2022–23 published in the 2023 Budget. In addition, the Contingency Fund is maintained to help mitigate expense risks — for example, in cases where health and safety may be compromised, and for contingent liabilities associated with claims by Indigenous communities – and unforeseen events which may otherwise adversely affect Ontario’s fiscal performance. The remaining balance of the Contingency Fund is projected to be $1.8 billion for 2022–23.
Section B: Ontario’s Recent Economic Performance and Outlook
Recent Economic Performance
In the third calendar quarter of 2022, Ontario’s real gross domestic product (GDP) recorded its fifth consecutive quarter of growth, increasing 0.4 per cent and thus exceeding the pre-pandemic level by 4.0 per cent at the end of the fourth quarter of 2019. However, Ontario’s real GDP growth slowed from a 0.9 per cent increase in the second quarter of 2022, particularly in interest rate sensitive sectors such as consumer spending and housing, which coincided with continued tightening of monetary policy by the Bank of Canada.
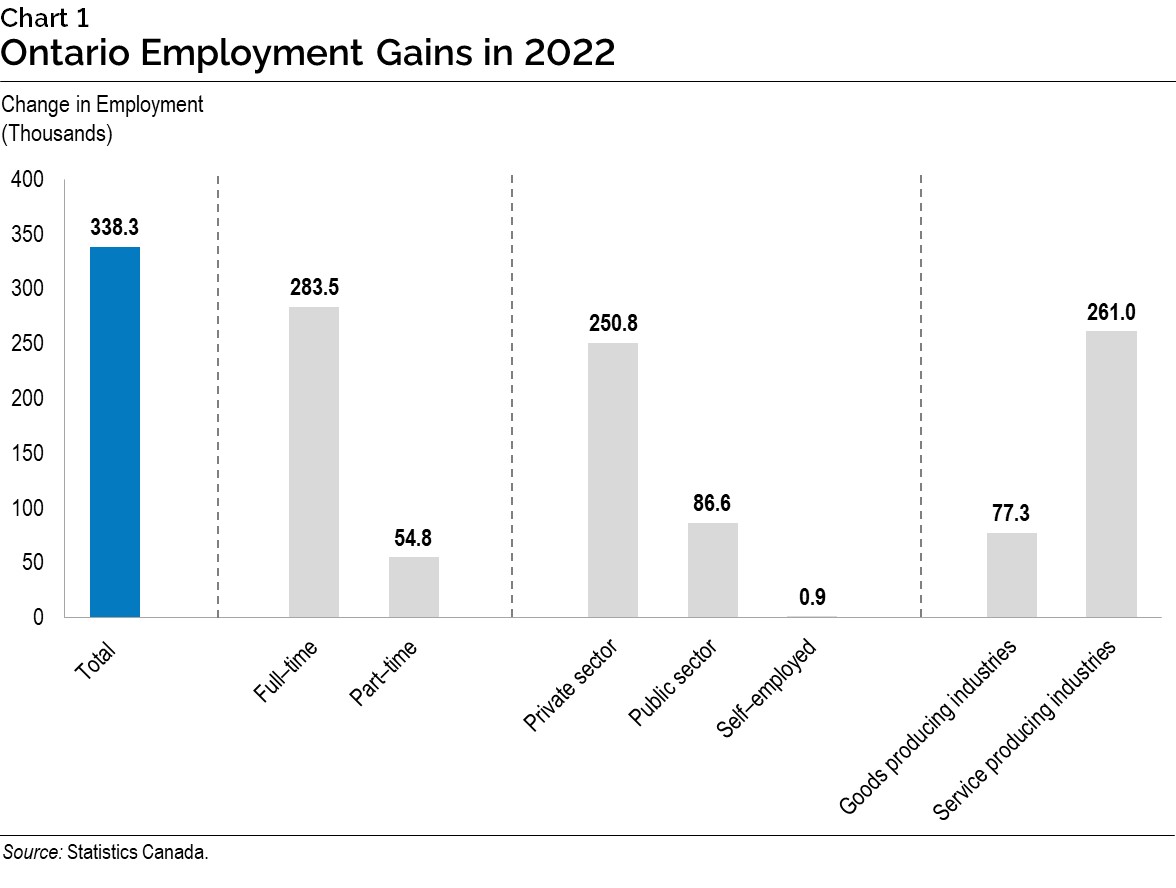
Ontario’s labour market remained strong in 2022, with employment rising by 338,300, following a gain of 367,400 in 2021. Most of the net employment gains in 2022 were in full-time (84 per cent of the total), private sector (74 per cent of the total) jobs. In addition, the unemployment rate remained near historic lows, ending the year at 5.3 per cent in December 2022.
Like many other economies around the world, inflation in Ontario rose strongly in 2022, in part due to a rebound in demand, supply chain disruptions and higher commodity prices further exacerbated by Russia’s invasion of Ukraine. Over the last several months, inflation pressures have begun to ease but remain elevated. Ontario’s Consumer Price Index (CPI) increased 6.0 per cent in December 2022, compared to a year earlier, moderating from a recent peak of 7.9 per cent in June 2022.
Economic Outlook
The outlook for global growth has weakened, partly due to the impacts of tighter monetary policy as central banks around the world address elevated price inflation. The International Monetary Fund estimates global real GDP grew 3.4 per cent in 2022, and projects real GDP to increase 2.9 per cent in 2023. U.S. real GDP increased by 2.1 per cent in 2022 and is projected to rise 0.5 per cent in 2023, according to Blue Chip Economic Indicators.
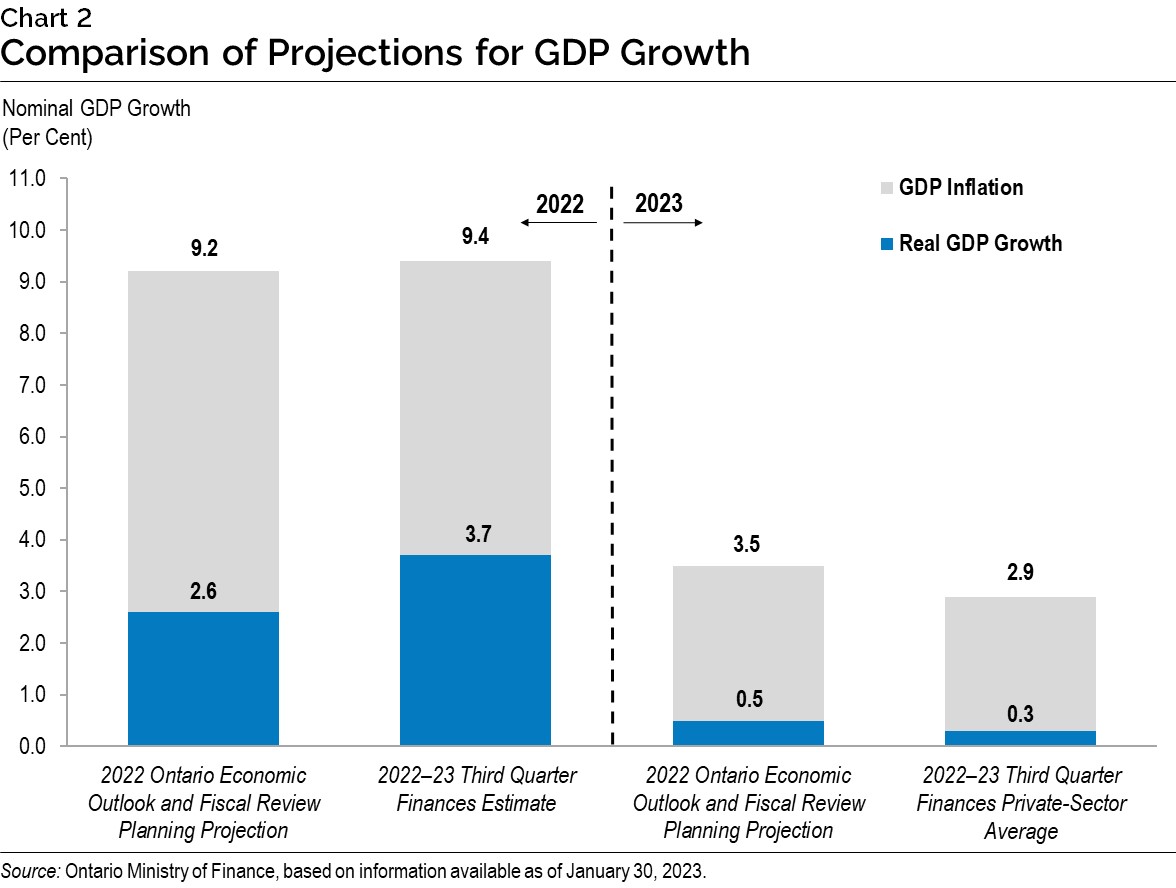
The Ministry of Finance estimates that Ontario real GDP increased 3.7 per cent in 2022, which is higher than the 2022 Ontario Economic Outlook and Fiscal Review planning assumption of 2.6 per cent. Ontario nominal GDP is estimated to have increased 9.4 per cent in 2022, slightly above the 2022 Ontario Economic Outlook and Fiscal Review planning assumption of 9.2 per cent.
Private sector forecasters, on average, project Ontario’s real GDP to rise by 0.3 percent in 2023, compared to the 2022 Ontario Economic Outlook and Fiscal Review planning assumption of 0.5 per cent. Ontario’s nominal GDP is projected to rise by 2.9 per cent in 2023, compared to the 2022 Ontario Economic Outlook and Fiscal Review planning assumption of 3.5 per cent, due largely to weaker GDP inflation expectations.
The future path of price inflation is a key risk to the economic outlook. In 2022, the Bank of Canada raised interest rates significantly to help reduce inflation. In recent months, inflation has begun to moderate, helped by lower energy prices. If inflation remains above the Bank of Canada’s 2 per cent target for longer than expected, the Bank may increase interest rates more than expected, which risks further negative impacts on the economy. Conversely, there is also an upside risk that inflation may moderate more quickly than expected, allowing the Bank of Canada to lower interest rates sooner than expected, which would support economic growth.
Russia’s invasion of Ukraine remains an ongoing source of global economic uncertainty and continues to impact commodity markets and global supply chains. On the other hand, the loosening of pandemic-related health restrictions in China and the subsequent increase in economic activity could help further ease global supply chain disruptions and boost global GDP growth.
Section C: Details of Ontario’s Finances
| Item | 2022–23 2022 Budget | 2022–23 Current Outlook | 2022–23 In-Year Change |
|---|---|---|---|
| Taxation Revenue — Personal Income Tax | 44,584 | 50,791 | 6,207 |
| Taxation Revenue — Sales Tax | 32,287 | 35,858 | 3,571 |
| Taxation Revenue — Corporations Tax | 19,736 | 27,625 | 7,889 |
| Taxation Revenue — Education Property Tax | 5,652 | 5,804 | 152 |
| Taxation Revenue — Employer Health Tax | 7,842 | 7,738 | (104) |
| Taxation Revenue — Ontario Health Premium | 4,722 | 4,663 | (59) |
| Taxation Revenue — Gasoline Tax | 2,088 | 1,962 | (126) |
| Taxation Revenue — Land Transfer Tax | 5,686 | 4,152 | (1,534) |
| Taxation Revenue — Tobacco Tax | 953 | 851 | (102) |
| Taxation Revenue — Fuel Tax | 703 | 557 | (146) |
| Taxation Revenue — Beer, Wine and Spirits Taxes | 635 | 626 | (9) |
| Taxation Revenue — Electricity Payments in Lieu of Taxes | 511 | 547 | 36 |
| Taxation Revenue — Ontario Portion of the Federal Cannabis Excise Duty | 215 | 253 | 38 |
| Taxation Revenue — Other Taxes | 800 | 670 | (130) |
| Taxation Revenue — Total | 126,414 | 142,097 | 15,683 |
| Government of Canada — Canada Health Transfer | 17,560 | 17,524 | (36) |
| Government of Canada — Canada Social Transfer | 6,191 | 6,178 | (13) |
| Government of Canada — Equalization | – | – | – |
| Government of Canada — Infrastructure Programs | 1,239 | 1,069 | (170) |
| Government of Canada — Labour Market Programs | 1,128 | 1,128 | – |
| Government of Canada — Social Housing Agreement | 263 | 263 | – |
| Government of Canada — Other Federal Payments | 4,139 | 4,183 | 44 |
| Government of Canada — Direct Transfers to Broader Public Sector Organizations | 479 | 491 | 12 |
| Government of Canada — Total | 30,999 | 30,836 | (163) |
| Income from Government Business Enterprises — Liquor Control Board of Ontario | 2,583 | 2,441 | (142) |
| Income from Government Business Enterprises — Ontario Power Generation Inc./Hydro One Ltd. | 1,186 | 1,460 | 274 |
| Income from Government Business Enterprises — Ontario Lottery and Gaming Corporation | 2,330 | 2,384 | 54 |
| Income from Government Business Enterprises — Ontario Cannabis Store | 180 | 225 | 45 |
| Income from Government Business Enterprises — Total | 6,279 | 6,510 | 231 |
| Other Non-Tax Revenue — Fees, Donations and Other Revenues from Hospitals, School Boards and Colleges | 9,365 | 10,262 | 897 |
| Other Non-Tax Revenue — Vehicle and Driver Registration Fees | 1,034 | 1,034 | – |
| Other Non-Tax Revenue — Miscellaneous Other Non-Tax Revenue | 1,169 | 1,169 | – |
| Other Non-Tax Revenue — Other Fees and Licences | 1,211 | 1,208 | (3) |
| Other Non-Tax Revenue — Sales and Rentals | 1,939 | 1,939 | – |
| Other Non-Tax Revenue — Reimbursements | 1,039 | 1,039 | – |
| Other Non-Tax Revenue — Royalties | 307 | 307 | – |
| Other Non-Tax Revenue — Power Supply Contract Recoveries | 42 | 46 | 4 |
| Other Non-Tax Revenue — Net Reduction of Power Purchase Contracts | – | – | – |
| Other Non-Tax Revenue — Total | 16,106 | 17,004 | 898 |
| Total Revenue | 179,798 | 196,447 | 16,649 |
Notes: Numbers may not add due to rounding. Current outlook primarily reflects information available as of December 31, 2022, as well as other significant updates to the fiscal plan.
Source: Ontario Ministry of Finance.
| Ministry Expense | 2022–23 2022 Budget | 2022–23 Current Outlook | 2022–23 In-Year Change |
|---|---|---|---|
| Agriculture, Food and Rural Affairs (Base) | 331.3 | 331.3 | – |
| Agriculture, Food and Rural Affairs — Demand-Driven Risk Management and Time-Limited Programs | 439.3 | 439.3 | – |
| Agriculture, Food and Rural Affairs — COVID‑19 Time-Limited Funding | 47.6 | 47.6 | – |
| Agriculture, Food and Rural Affairs (Total) | 818.1 | 818.1 | – |
| Attorney General (Base) | 1,783.7 | 1,822.8 | 39.1 |
| Attorney General — COVID‑19 Time-Limited Funding | 52.0 | 52.0 | – |
| Attorney General (Total) | 1,835.7 | 1,874.8 | 39.1 |
| Board of Internal Economy (Base) | 278.2 | 278.2 | – |
| Board of Internal Economy — Provision for Costs of General Election | 100.0 | 100.0 | – |
| Board of Internal Economy (Total) | 378.2 | 378.2 | – |
| Children, Community and Social Services (Base) | 18,326.5 | 18,472.8 | 146.4 |
| Children, Community and Social Services — COVID‑19 Time-Limited Funding | 22.0 | 23.0 | 1.0 |
| Children, Community and Social Services (Total) | 18,348.5 | 18,495.8 | 147.3 |
| Citizenship and Multiculturalism (Base) | 52.6 | 50.7 | (1.9) |
| Citizenship and Multiculturalism — COVID‑19 Time-Limited Funding | 3.7 | 3.7 | – |
| Citizenship and Multiculturalism (Total) | 56.3 | 54.4 | (1.9) |
| Colleges and Universities (Base) | 9,439.4 | 10,167.9 | 728.5 |
| Colleges and Universities — Student Financial Assistance | 1,333.0 | 1,241.6 | (91.4) |
| Colleges and Universities — COVID‑19 Time-Limited Funding | 10.7 | 10.7 | – |
| Colleges and Universities (Total) | 10,783.1 | 11,420.2 | 637.1 |
| Economic Development, Job Creation and Trade (Base) | 429.8 | 429.8 | – |
| Economic Development, Job Creation and Trade — Time-Limited Investments | 434.4 | 545.5 | 111.1 |
| Economic Development, Job Creation and Trade — COVID‑19 Time-Limited Funding | 78.0 | 96.0 | 18.0 |
| Economic Development, Job Creation and Trade (Total) | 942.1 | 1,071.2 | 129.1 |
| Education (Base) | 32,439.0 | 32,441.5 | 2.5 |
| Education — Teachers’ Pension Plan | 1,630.0 | 1,630.0 | – |
| Education — COVID‑19 Time-Limited Funding | 597.5 | 968.6 | 371.2 |
| Education (Total) | 34,666.5 | 35,040.2 | 373.7 |
| Energy (Base) | 327.6 | 327.6 | – |
| Energy — Electricity Cost Relief Programs | 6,273.7 | 6,273.7 | – |
| Energy (Total) | 6,601.3 | 6,601.3 | – |
| Environment, Conservation and Parks (Base) | 711.9 | 716.1 | 4.3 |
| Environment, Conservation and Parks — COVID‑19 Time-Limited Funding | 24.7 | 24.7 | – |
| Environment, Conservation and Parks (Total) | 736.6 | 740.8 | 4.3 |
| Executive Offices (Total) | 47.0 | 48.3 | 1.3 |
| Finance (Base) | 938.5 | 978.1 | 39.6 |
| Finance — Investment Management Corporation of Ontario | 221.9 | 221.9 | – |
| Finance — Ontario Municipal Partnership Fund | 501.9 | 501.9 | – |
| Finance — Power Supply Contract Costs | 42.3 | 42.3 | – |
| Finance (Total) | 1,704.6 | 1,744.2 | 39.6 |
| Francophone Affairs (Base) | 7.4 | 7.4 | – |
| Francophone Affairs — Time-Limited Investments | 0.6 | 0.6 | – |
| Francophone Affairs (Total) | 7.9 | 7.9 | – |
| Government and Consumer Services (Base) | 835.8 | 832.8 | (3.0) |
| Government and Consumer Services — Realty | 1,184.5 | 1,248.6 | 64.1 |
| Government and Consumer Services — COVID‑19 Time-Limited Funding | 89.2 | 89.2 | – |
| Government and Consumer Services (Total) | 2,109.6 | 2,170.7 | 61.1 |
| Health (Total) | 68,414.4 | 68,414.4 | – |
| COVID‑19 Health Response | 4,753.6 | 4,922.3 | 168.7 |
| Heritage, Sport, Tourism and Culture Industries (Base) | 871.2 | 906.8 | 35.6 |
| Heritage, Sport, Tourism and Culture Industries — Ontario Cultural Media Tax Credits | 816.9 | 819.2 | 2.3 |
| Heritage, Sport, Tourism and Culture Industries — COVID‑19 Time-Limited Funding | 200.0 | 200.0 | – |
| Heritage, Sport, Tourism and Culture Industries (Total) | 1,888.2 | 1,926.1 | 37.9 |
| Indigenous Affairs (Base) | 118.3 | 118.9 | 0.6 |
| Indigenous Affairs — One-Time Investments including Settlements | – | 5,000.0 | 5,000.0 |
| Indigenous Affairs (Total) | 118.3 | 5,118.9 | 5,000.6 |
| Infrastructure (Base) | 981.5 | 479.0 | (502.5) |
| Infrastructure — Federal–Provincial Infrastructure Programs | 717.4 | 440.9 | (276.5) |
| Infrastructure — Waterfront Toronto Revitalization (Port Lands Flood Protection) | 25.0 | 25.0 | – |
| Infrastructure — Municipal Infrastructure Program Investments | 398.4 | 398.4 | – |
| Infrastructure (Total) | 2,122.3 | 1,343.3 | (779.0) |
| Labour, Training and Skills Development (Base) | 301.7 | 296.4 | (5.3) |
| Labour, Training and Skills Development — Training Tax Credits (Co-operative Education and Apprenticeship Training) | 92.0 | 92.0 | – |
| Labour, Training and Skills Development — Demand-Driven Employment and Training Programs | 1,126.6 | 1,156.6 | 30.0 |
| Labour, Training and Skills Development — COVID‑19 Time-Limited Funding | 284.7 | 469.0 | 184.3 |
| Labour, Training and Skills Development (Total) | 1,804.9 | 2,013.9 | 209.0 |
| Long-Term Care (Total) | 6,750.9 | 6,750.9 | – |
| Municipal Affairs and Housing (Base) | 562.4 | 562.4 | – |
| Municipal Affairs and Housing — Time-Limited Investments | 414.5 | 414.5 | – |
| Municipal Affairs and Housing — Social Housing Agreement – Payments to Service Managers | 210.3 | 210.3 | – |
| Municipal Affairs and Housing — COVID‑19 Time-Limited Funding | 127.5 | 391.3 | 263.8 |
| Municipal Affairs and Housing (Total) | 1,314.7 | 1,578.5 | 263.8 |
| Northern Development, Mines, Natural Resources and Forestry (Base) | 1,439.4 | 1,440.3 | 1.0 |
| Northern Development, Mines, Natural Resources and Forestry — Emergency Forest Firefighting | 100.0 | 100.0 | – |
| Northern Development, Mines, Natural Resources and Forestry (Total) | 1,539.3 | 1,540.3 | 1.0 |
| Seniors and Accessibility (Base) | 203.1 | 203.1 | – |
| Seniors and Accessibility — Time-Limited Investments | 0.8 | 0.8 | – |
| Seniors and Accessibility — COVID‑19 Time-Limited Funding | 31.1 | 40.5 | 9.4 |
| Seniors and Accessibility (Total) | 235.0 | 244.4 | 9.4 |
| Solicitor General (Base) | 3,516.4 | 3,364.0 | (152.4) |
| Solicitor General — COVID‑19 Time-Limited Funding | – | 1.8 | 1.8 |
| Solicitor General (Total) | 3,516.4 | 3,365.8 | (150.6) |
| Transportation (Base) | 5,888.2 | 5,888.2 | – |
| Transportation — Federal–Provincial Infrastructure Programs | 720.7 | 720.7 | – |
| Transportation — COVID‑19 Time-Limited Funding | 585.0 | 585.0 | – |
| Transportation (Total) | 7,194.0 | 7,194.0 | – |
| Treasury Board Secretariat (Base) | 335.2 | 335.2 | – |
| Treasury Board Secretariat — Employee and Pensioner Benefits | 1,590.1 | 1,590.1 | – |
| Treasury Board Secretariat — Operating Contingency Fund | 4,325.8 | 1,529.1 | (2,796.7) |
| Treasury Board Secretariat — Capital Contingency Fund | 224.2 | 220.9 | (3.3) |
| Treasury Board Secretariat (Total) | 6,475.3 | 3,675.3 | (2,800.0) |
| Interest on Debt | 13,485.0 | 13,442.0 | (43.0) |
| Total Expense | 198,647.7 | 201,996.3 | 3,348.5 |
Notes: Numbers may not add due to rounding. Current outlook primarily reflects information available as of December 31, 2022, as well as other significant updates to the fiscal plan.
Sources: Ontario Treasury Board Secretariat and Ontario Ministry of Finance.
| Sector | 2022–23 Current Outlook Investment in Capital Assets | 2022–23 Current Outlook Transfers and Other Infrastructure Expenditures | 2022–23 Current Outlook Total Infrastructure Expenditures | 2022 Budget Total Infrastructure Expenditures | In-Year Change Total Infrastructure Expenditures |
|---|---|---|---|---|---|
| Transportation — Transit | 6,767 | 1,406 | 8,173 | 8,183 | (9) |
| Transportation — Provincial Highways | 2,778 | 240 | 3,018 | 3,018 | – |
| Transportation — Other Transportation, Property and Planning | 142 | 77 | 219 | 219 | – |
| Health — Hospitals | 3,022 | 3 | 3,025 | 3,025 | – |
| Health — Other Health | 53 | 162 | 215 | 215 | – |
| Education | 2,922 | 15 | 2,938 | 2,938 | – |
| Postsecondary Education — Colleges and Other | 837 | 49 | 886 | 470 | 416 |
| Postsecondary Education — Universities | – | 135 | 135 | 135 | – |
| Social | 20 | 299 | 319 | 319 | – |
| Justice | 570 | 34 | 604 | 847 | (243) |
| Other Sectors | 1,043 | 1,485 | 2,528 | 3,279 | (751) |
| Total Infrastructure Expenditures | 18,155 | 3,904 | 22,059 | 22,647 | (588) |
| Less: Other Partner Funding | 3,021 | – | 3,021 | 2,611 | 410 |
| Total | 15,134 | 3,904 | 19,038 | 20,035 | (997) |
Note: Numbers may not add due to rounding.
Source: Ontario Treasury Board Secretariat.
| Item | 2018–19 | 2019–20 | 2020–21 | Actual 2021–22 | Current Outlook 2022–23 |
|---|---|---|---|---|---|
| Revenue | 153,700 | 156,096 | 164,893 | 185,062 | 196,447 |
| Expense — Programs | 148,751 | 152,273 | 169,023 | 170,453 | 188,554 |
| Expense — Interest on Debt | 12,384 | 12,495 | 12,274 | 12,558 | 13,442 |
| Total Expense | 161,135 | 164,768 | 181,297 | 183,011 | 201,996 |
| Reserve | – | – | – | – | 1,000 |
| Surplus/(Deficit) | (7,435) | (8,672) | (16,404) | 2,051 | (6,549) |
| Net Debt | 338,496 | 353,332 | 373,564 | 380,415 | 401,101 |
| Accumulated Deficit | 216,642 | 225,764 | 239,294 | 236,857 | 247,142 |
| Gross Domestic Product (GDP) at Market Prices | 860,104 | 893,224 | 866,981 | 956,707 | 1,046,883 |
| Primary Household Income | 567,484 | 593,065 | 592,460 | 644,263 | 705,280 |
| Population — July (000s) | 14,309 | 14,545 | 14,726 | 14,809 | 15,109 |
| Net Debt Per Capita (dollars) | 23,657 | 24,293 | 25,368 | 25,688 | 26,546 |
| Household Income Per Capita (dollars) | 39,660 | 40,775 | 40,232 | 43,504 | 46,678 |
| Net Debt as a Per Cent of Revenue | 220.2% | 226.4% | 226.5% | 205.6% | 204.2% |
| Interest on Debt as a Per Cent of Revenue | 8.1% | 8.0% | 7.4% | 6.8% | 6.8% |
| Net Debt as a Per Cent of GDP | 39.4% | 39.6% | 43.1% | 39.8% | 38.3% |
| Accumulated Deficit as a Per Cent of GDP | 25.2% | 25.3% | 27.6% | 24.8% | 23.6% |
Note: Numbers may not add due to rounding.
Sources: Statistics Canada, Ontario Treasury Board Secretariat and Ontario Ministry of Finance.
Section D: Ontario’s 2022–23 Borrowing Program
| Item | 2022–23 2022 Budget | 2022–23 Current Outlook | 2022–23 Change from 2022 Budget |
|---|---|---|---|
| Deficit/(Surplus) | 19.9 | 6.5 | (13.3) |
| Investment in Capital Assets | 13.4 | 13.3 | (0.2) |
| Non-Cash Adjustments | (9.7) | (17.7) | (8.0) |
| Loans to Infrastructure Ontario | (0.1) | (0.2) | (0.1) |
| Other Net Loans/Investments | 0.7 | 0.0 | (0.7) |
| Debt Maturities/Redemptions | 30.5 | 30.6 | 0.0 |
| Total Funding Requirement | 54.7 | 32.5 | (22.2) |
| Decrease/(Increase) in Short-Term Borrowing | (3.0) | – | 3.0 |
| Increase/(Decrease) in Cash and Cash Equivalents | – | – | – |
| Pre-Borrowing in 2021–22 for 2022–23 | (10.3) | (10.3) | – |
| Pre-Borrowing for 2023–24 | – | 9.9 | 9.9 |
| Total Long-Term Public Borrowing | 41.5 | 32.2 | (9.3) |
Note: Numbers may not add due to rounding.
Source: Ontario Financing Authority.
Ontario’s current funding requirements for 2022–23 are projected to decrease by $22.2 billion compared to the forecast in the 2022 Budget, reflecting stronger financial results reported in the Public Accounts of Ontario 2021–22 and a decrease in the projected deficit for 2022–23. The funding requirements are down $6.9 billion, compared to the forecast in the 2022 Economic Outlook and Fiscal Review.
The province’s long-term borrowing program for 2022–23 is forecast to remain unchanged from the forecast in the 2022 Ontario Economic Outlook and Fiscal Review, reflecting additional pre-borrowing of $6.9 billion for the next fiscal year, for a total of $9.9 billion. The province’s total long-term borrowing program is $9.3 billion lower than forecast in the 2022 Budget. Short-term borrowing for the fiscal year is projected to remain unchanged since the release of the 2022 Economic Outlook and Fiscal Review.
As of February 7, 2023, Ontario had completed $29.9 billion or 93 per cent of its $32.2 billion 2022–23 long‑term borrowing program. Approximately $26.2 billion or 88 per cent was completed in Canadian dollars, with the remaining $3.7 billion or 12 per cent completed primarily in U.S. dollars.
Green Bonds remain a core component of Ontario’s borrowing program and are an important tool to help finance public transit initiatives, extreme weather resistant infrastructure, as well as energy efficiency and conservation projects. Ontario remains the largest issuer of Canadian dollar Green Bonds, totalling $13.5 billion issued since 2014–15, with $13.0 billion outstanding. Subject to market conditions, Ontario plans to continue issuing multiple Green Bonds each fiscal year, including in 2022–23.
Ontario is updating its Green Bond Framework. The update will include better alignment of framework categories with the Green Bond Principles through standardized wording, as well as the expansion from green to sustainable to allow for a greater breadth of potential bond offerings in the future.
Interest rates have risen by more than projected in the 2022 Budget, resulting in an increase of Ontario’s cost of borrowing for 2022–23 to 4.0 per cent from 3.4 per cent projected in the 2022 Budget, but down from the 4.2 per cent forecast in the 2022 Economic Outlook and Fiscal Review. In spite of the higher interest rates, interest on debt is forecast to decline to $13.4 billion from the $13.5 billion forecast in the 2022 Budget as a result of lower deficits and the borrowing program. Ontario will continue to monitor movements in long-term interest rates and provide regular updates on interest on debt costs in future fiscal updates.
2022–23 Long-Term Borrowing
| Item | Amount |
|---|---|
| Canadian Dollar Issues | 26.2 |
| Foreign Currency Issues | 3.7 |
| Total | 29.9 |
Note: Numbers may not add due to rounding.
Source: Ontario Financing Authority.
Ministry of Finance: www.ontario.ca/finance
For general inquiries regarding the 2022–23 Third Quarter Finances, please call or email:
Toll-free English and French inquiries: 1-800-337-7222
Teletypewriter (TTY): 1-800-263-7776
Email: FinanceCommunications.fin@ontario.ca
© King’s Printer for Ontario, 2023
Chart Descriptions: Alternative Text for Web Accessibility
Chart 1: Ontario Employment Gains in 2022
This bar chart illustrates Ontario’s annual employment gains in 2022. Changes are as follows: Total employment was 338,300 higher; Full-time employment was 283,500 higher; Part-time employment was 54,800 higher; Private-sector employment was 250,800 higher; Public-sector employment was 86,600 higher; Self-employment was 900 higher; Goods producing industry employment was 77,300 higher; and service producing industry employment was 261,000 higher.
Source: Statistics Canada.
Chart 2: Comparison of Projections for GDP Growth
The stacked bar graph illustrates the 2022 Ontario Economic Outlook and Fiscal Review planning projections and the 2022–23 Third Quarter Finances estimate for Ontario nominal GDP growth, real GDP growth and GDP inflation rates for 2022, and the 2022 Ontario Economic Outlook and Fiscal Review planning projections and 2022–23 Third Quarter Finances private-sector averages for Ontario nominal GDP growth, real GDP growth and GDP inflation rates for 2023.
The 2022 Ontario Economic Outlook and Fiscal Review planning projections for Ontario real GDP growth are 2.6 per cent for 2022 and 0.5 per cent for 2023. The 2022 Ontario Economic Outlook and Fiscal Review planning projections for Ontario nominal GDP growth are 9.2 per cent for 2022 and 3.5 per cent for 2023.
The 2022–23 Third Quarter Finances estimate for Ontario real GDP growth is 3.7 per cent for 2022, while the 2022–23 Third Quarter Finances private-sector average for Ontario real GDP is 0.3 per cent for 2023. The 2022–23 Third Quarter Finances estimate for Ontario nominal GDP growth is 9.4 per cent for 2022, while the 2022–23 Third Quarter Finances private-sector average for Ontario nominal GDP growth is 2.9 per cent for 2023.
Source: Ontario Ministry of Finance, based on information available as of January 30, 2023.
Footnotes
- footnote[1] Back to paragraph Potential liability for these claims is recorded if the settlement of the claim is assessed as likely and the amount of the settlement can be reasonably estimated
- footnote[2] Back to paragraph The ministry structures have been retained from the 2022 Budget. The new government structure, reflecting the announcement of the Executive Council on June 24, 2022, will be reflected in future publications.
- footnote[3] Back to paragraph In the 2022 Budget, the government made COVID‑19 Time‐Limited Funding available in 2022–23. This funding continues to be presented separately in order to transparently capture the temporary nature of these investments.
- footnote[4] Back to paragraph Based on the requirements of Public Sector Accounting Standards, the Province consolidated the Investment Management Corporation of Ontario into the Ministry of Finance.
- footnote[5] Back to paragraph For presentation purposes in the 2022–23 Third Quarter Finances, time-limited COVID‑19 related spending has been included separately instead of within the Ministry of Health and the Ministry of Long-Term Care. This change in presentation does not impact ministry allocations, which reflect the ministry structure(s) presented in the 2022–23 Expenditure Estimates.
- footnote[6] Back to paragraph The Co-operative Education Tax Credit remains in effect. The Apprenticeship Training Tax Credit is eliminated for eligible apprenticeship programs that commenced on or after November 15, 2017.
- footnote[7] Back to paragraph The Ontario Ministry of Long-Term Care total includes expenses incurred by Ontario Health for funding for long-term care. These amounts will be consolidated in the total expense of the Ontario Ministry of Health, including $4.7 billion in 2022–23.
- footnote[8] Back to paragraph Interest on debt is net of interest capitalized during construction of tangible capital assets of $401 million in 2022–23.
- footnote[9] Back to paragraph Includes $401 million in interest capitalized during construction.
- footnote[10] Back to paragraph Includes provincial investment in capital assets of $13.3 billion.
- footnote[11] Back to paragraph Includes transfers to municipalities, universities and non-consolidated agencies.
- footnote[12] Back to paragraph Includes broadband infrastructure, government administration, natural resources and the culture and tourism industries.
- footnote[13] Back to paragraph Other Partner Funding refers to third-party investments, primarily in hospitals, colleges and schools.
- footnote[14] Back to paragraph Includes federal/municipal contributions to provincial infrastructure investments.
- footnote[15] Back to paragraph Interest on debt is net of interest capitalized during construction of tangible capital assets of $175 million in 2018–19, $245 million in 2019–20, $230 million in 2020–21, $321 million in 2021–22 and $401 million in 2022–23.
- footnote[16] Back to paragraph Population figures are for July 1 of the fiscal year indicated (i.e., for 2018–19, the population on July 1, 2018 is shown).