Building Ontario
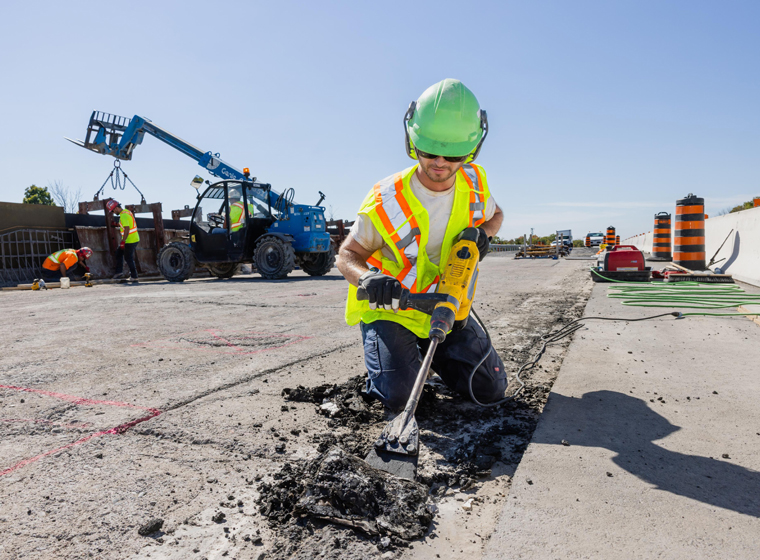
As Canada stares down economic uncertainty, it has never been more important to get shovels in the ground and keep workers on the job. That’s why we have a plan to build and upgrade Ontario’s highways, schools, hospitals, transit and more.
Our Building Ontario plan will:
- prioritize made-in-Ontario and made-in-Canada products, including making Ontario and Canadian steel, cement, forestry and other construction materials mandatory for government-funded infrastructure projects
- create new opportunities for workers by building new road, highways, schools and hospitals
- build new highways, roads and transit across the province, relieving the costs of gridlock, connecting people to jobs, supporting the movement of goods and stimulating economic growth
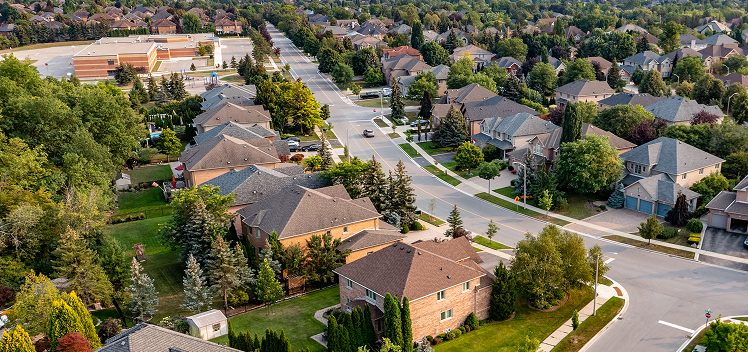
- build the local infrastructure needed for new homes
- bring access to reliable high-speed internet to every community across the province
Building Ontario facts
Projects Completed:
4,264
Projects Ongoing:
1,676
Total Projects:
5,940
Find out what’s happening near you
Use the map below to browse key projects being built in your community. It contains information on approximately 6,000 ongoing and completed projects in Ontario. The map will be updated on an ongoing basis.
Learn more about provincially funded high-speed internet projects across the province.
Building transit, highways and roads
Transit
Expanding and improving transit to get you to work, school and home quicker and easier.
Total projects: 623
Roads and bridges
Building new roads, highways and bridges to make your commute quicker and easier, and get goods to market faster.
Total projects: 1,060
Building better services

Health care
Building new hospitals, community care and long-term care homes where you need them.
Total projects: 216
Education
Building new schools, universities and colleges so you have more places to learn.
Total projects: 882
Child care
Building new licensed child care spaces in schools and other community settings.
Total projects: 590
Recreation
Building and upgrading museums, sport facilities, theatres, and cycling and walking paths.
Total projects: 594
Building stronger communities
Broadband
Making high-speed internet accessible in every community across the province.
Total projects: 270
Northern Ontario
Building new hospitals and schools, expanding roads and passenger rail, and improving high-speed internet access.
Note: northern projects may also be reported in other investment areas.
Total projects: 1,704
Communities
Building more homes so you can attain the dream of home ownership.
Total projects: 2,258