Condition factor for salmonid aquaculture
Learn about the importance of measuring and calculating condition factor in farmed salmonid species.
ISSN 1198-712X, Published November 2024
Introduction
Condition factor (K) is an easy, fast and non-invasive assessment tool that can be used in aquaculture to help determine whether fish are properly nourished. Based on the length-weight relationship of a fish, condition factor is expressed as a numerical value (K).
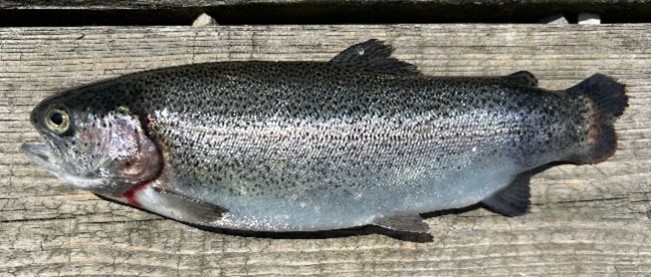
K is a proxy for food fat and body reserves of a fish. Higher K values indicate greater fat and body reserves and a more rotund or round fish. Lower K values indicate less fat and body reserves and a more slender or elongated fish, as length is increasing faster than weight.
K is typically greater than 1.0 in healthy salmonids but can vary by:
- species
- strain
- life stage
- season
Importance of condition factor
Condition factor is a welfare indicator that can help producers optimize feed management and the nourishment (energy state) of fish. It can help identify welfare issues related to body mass such as emaciated fish and may be used to determine whether fish are able to withstand stressful events such as transportation or fasting.
Sampling fish for condition factor can be a good time to perform broader fish health assessments to identify and score concerns (such as lesions, injuries, fin wear, disease, deformities) and whether or not disease interventions or culling of welfare-challenged fish is appropriate.
Calculating condition factor
Condition factor can be calculated using the following formula:
Condition factor (K) = [W (g) ÷ L3 (cm)] × 100
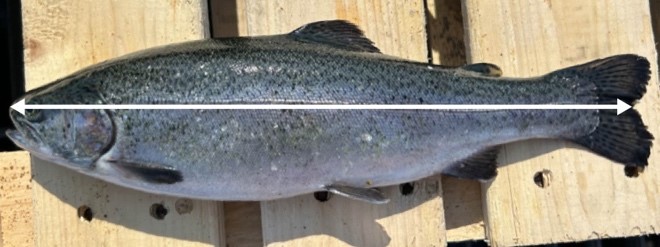
Where W is the live weight of the fish in grams (g), and L is the fork length of the fish in centimetres (cm). Fork length refers to the length measured from the snout to the fork of the caudal fin (Figure 1).
Table 1 shows the condition factor guidelines for salmonid species.
| Fish health | K value |
|---|---|
| Emaciated | < 0.9 |
| Poor condition | 0.9 to 1.0 |
| Fair condition | 1.0 to 1.1 |
| Positive performance | > 1.1 |
| Possible deformity | > 1.6 |
Condition factor example calculations
Well-conditioned
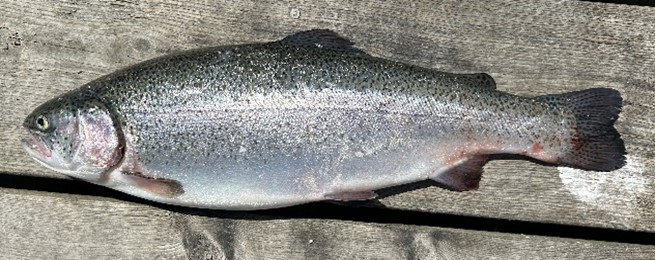
K = [W (g) ÷ L3 (cm)] × 100
= (1,265 ÷ 453) × 100 = 1.39
K value of 1.39, indicating positive performance and a well-conditioned fish.
Poor-conditioned
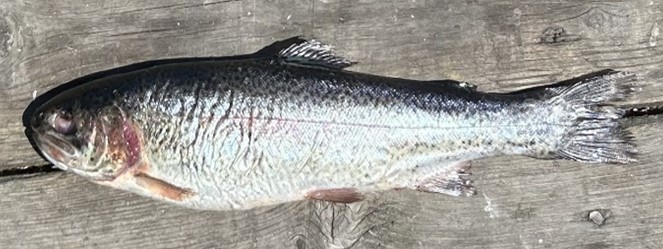
K = [W (g) ÷ L3 (cm)] × 100
= (279 ÷ 30.63) × 100 = 0.97
K value of 0.97, indicating a poor condition factor and a potentially emaciated state.
Spinal deformity
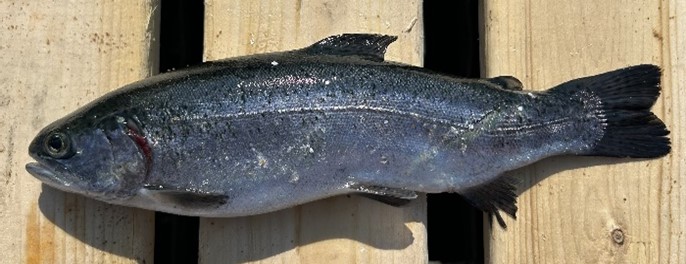
Vertebral deformity
Measuring condition factor
Condition factor assessments are typically performed on adult or sub-adult fish where growth distribution has stabilized.
Condition factor measurements are especially important during or shortly after higher-risk events such as fasting, transfers and feeding regimen changes where fish are more susceptible to decreased growth performance.
Being handled and removed from water is very stressful for fish. Sampling for condition factor during routine farm management activities in which fish are already being handled can reduce overall stress.
Condition factor should not be measured:
- immediately after feeding, as the K value increases with stomach fullness
- during the spawning season. Fish nearing sexual maturity will tend to have a higher K value than fish at the end of the spawning season
- when spinal deformities are present (such as scoliosis) as they can skew K values
Considerations for condition factor
Considerations to make when assessing the condition factor of salmonids include:
- Condition factor varies by season. K value typically decreases during the cold months of winter and early spring and increases during warmer months in summer and early fall.
- There will always be a certain degree of size variation within a population. When greater than 2% of the population have a condition factor less than 0.9, this represents a serious welfare concern.
- Keeping historical records of condition factor will help producers and veterinarians identify welfare issues, as well as provide useful information in the event of an animal health emergency.
References
Ahmad, I., and Ahmed, I. 2019. Length Weight Relationship and Condition Factor of Cultured Rainbow Trout, Oncorhynchus mykiss. Journal of Ecophysiology and Occupational Health, 19: 24–27.
Compassion in World Farming. N.A. Improving the welfare of farmed Atlantic salmon at rearing. Food Business. Retrieved April 16, 2024.
Getso, B.U., Abdullahi, J.M., and Yola, I.A. 2017. Length-Weight Relationship and Condition Factor of Clarias gariepinus and Oreochromis niloticus of Wudil River, Kano, Nigeria. Journal of Tropical Agriculture, Food, Environment and Extension. 16(1):1–4.
Government of Canada, F. and O.C. 2004. 5.0 Length and Weight Measurement of Finfish. Fisheries and Oceans Canada. Retrieved April 24, 2024.
National Farm Animal Care Council (NFACC). 2021. Code of Practice for the Care and Handling of Farmed Salmonids.
Noble, C., Gismervik, K., Iversen, M.H., Kolarevic, J., Nilsson, J., Stien, L.H. and Turnbull, J.F. 2020. Welfare Indicators for farmed rainbow trout: tools for assessing fish welfare. FISHWELL. Retrieved April 24, 2024.
Schallich, E., and Gormley, T.R. 1996. Condition Factor, Fat Content and Flavour of Farmed and Wild Salmon. Farm & Food. 6(3):28–31.
Stein, L.H., Bracke, M.B.M., Folkedal, O., Nilsson, J., Oppedal, F., Torgersen, T., Kittilsen, S., Midtlyng, P. J., Vindas, M.A., Øyvind, Ø., and Kristiansen, T.S. 2013. Salmon Welfare Index Model (SWIM 1.0): a semantic model for overall welfare assessment of caged Atlantic salmon: review of the selected welfare indicators and model presentation. Reviews in Aquaculture. 5:33–57.
Utne, K.R., Pauli, B.D., Haugland, M., Jacobsen, J.A., Maoileidigh, N., Melle, W., Broms, C.T., Nøttestad, L., Holm, M., Thomas, K., and Wennevik, V., 2021. Poor feeding opportunities and reduced condition factor for salmon post-smolts in the Northeast Atlantic Ocean. Journal of Marine Science, 78(8): 2844–2857
Author credits
This fact sheet has been authored by Nancy Gao, research assistant – aquaculture, Ministry of Agriculture, Food and Agribusiness (OMAFA), and reviewed by Michael McQuire, aquaculture and aquaponics specialist, OMAFA. Special thanks to Dr. Alexandra Reid, lead veterinarian, OMAFA.