Electrofishing river sampling
The standard method for examining nearshore fish communities with electrofishing gear. This method can be used to estimate habitat stratified fish density biomass and species richness.
MNR 62762
This publication was produced by:
Aquatic Research and Development Section
Ontario Ministry of Natural Resources
2140 East Bank Drive
Peterborough, Ontario
K9J 8M5
This technical report should be cited as follows:
Jones, N.E. 2011. Electrofishing Rivers: Nearshore Community. Sampling Methodologies for Ontario’s Flowing Waters. Ontario Ministry of Natural Resources, Aquatic Research and Development Section, River and Stream Ecology Lab, Aquatic Research Series 2011-06
Please send comments and suggestions on the manual to Nick Jones at Nicholas Jones.
Abstract
Sampling fishes in rivers can be intimidating and difficult due to the inherent logistical considerations and safety risks associated with high-energy flows. This protocol describes a standard method for sampling the wadeable nearshore fish community in non-wadeable rivers using electrofishing gear. This protocol acknowledges that regulated and natural rivers can have strong longitudinal and lateral gradients in fish abundance, growth, and community mibership that must be considered when developing a sampling plan.
1.0 Introduction
Electrofishing is an effective way to sample fish where water depth and water conductivity are appropriate (Nielsen and Johnson 1983). Electrofishing by boat has been shown to be ineffective in larger rivers with low conductivity (<50 μS) and considerable depth >1.5 m and >0.5 ms-1 velocity. Despite low conductivity, backpack electrofishing shoreline areas of a river can provide consistent and reliable data for use in trend analyses of small-bodied fishes and the young of larger fishes (Korman et al. 2009; Korman and Campana 2009; Smokorowski et al. 2011). Populations within discrete shoreline sites can be treated as closed for a 24-h period between marking and recapture (Korman et al. 2009; Korman and Campana 2009) however; environmental conditions must be relatively constant during this period. Work by the River and Stream Ecology Lab has shown that lateral and longitudinal gradients exist in fish distribution, movients, and growth in hydropeaking rivers. Territorial species such as sculpin tend not to move during power generation and associated high flows. They prefer to stand their ground. More mobile species such as dace and trout tend to move with the rising water levels into progressively distal lateral habitats (Figure 1). Longitudinally, fish biomass is greatest near the dam where large amounts of seston feed a large community of filter feeding insects (e.g. Simulidae, Hydropsychidae) and subsequently fishes (e.g. Cottus). Not only is biomass greater near the dam but growth rates of fishes were 2 times that found in neighbouring natural rivers. We also found that the more mobile fishes were not nearly as abundant upstream as they were much further downstream. At some hydropower facilities, invertebrates and fish receive deep cold hypolimnetic water with poor quality seston, and as a result show low abundance and poor growth near the dam (Ward 1975).
This protocol describes a standard method for examining the nearshore (< 60 cms water depth) fish community in wadeable and non-wadeable rivers using electrofishing gear. This method can be used to estimate habitat stratified fish density, biomass, and species richness by sampling multiple sites/plots. This methods does not use block nets. Attipts to use block nets in deep fast sections of river failed to maintain a closed population. In turn, this method provides an index of abundance.
Figure 1
Sculpin-dominated community below dam (A)
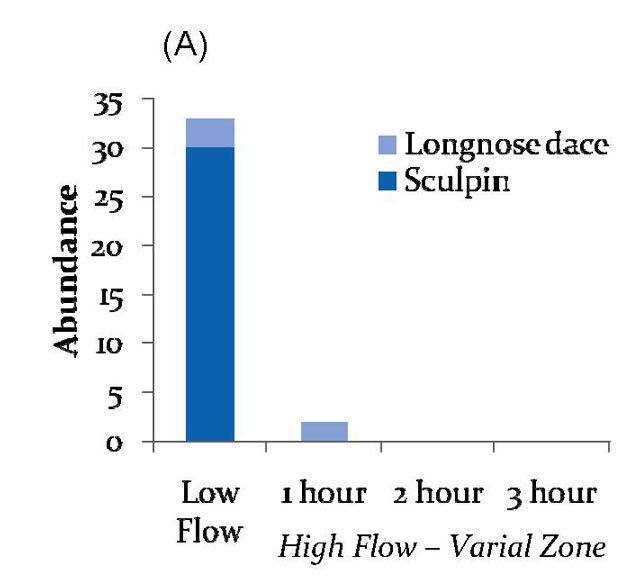
Dace-dominated community 15 km below dam (B)
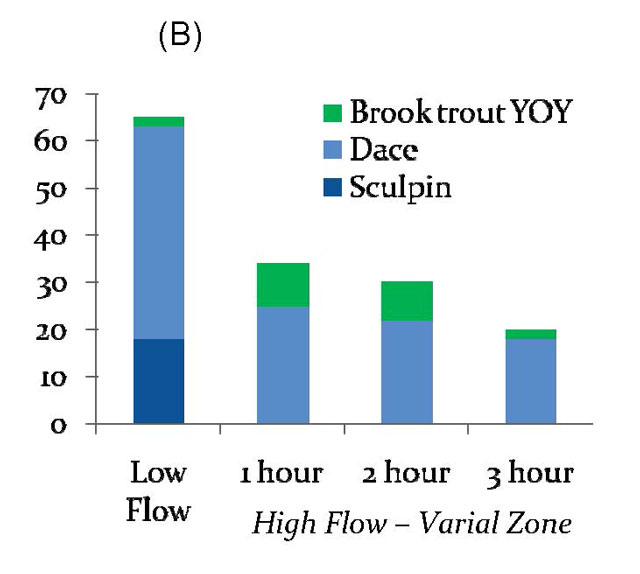
Numbers of fishes sampled during consecutive bouts of electrofishing three plots per site during low flows, and 1, 2, and 3 hours after high flows (hydropeaking).
2.0 Gear description and settings
Basic equipment required for sampling includes a GPS, measuring tape, fish measuring board, fish identification field book, thermometer, conductivity meter, flow meter, and personal gear including waders, waterproof gloves, rain gear, and polarized glasses. Dip nets, a pole mounted anode, balance, measuring board, anaesthetic, buckets, live wells, and sharp scissors are necessary for sampling fishes. Sites should be marked with permanent markers such as marking tape and pictures should be taken of the site and plots. Paint egg-sized rocks blaze orange or green and use these to mark plot boundaries and guide efishing. Field crews should have all the necessary maps of their waterbody, including sampling site locations before going into the field. If a pre-survey was completed, which is strongly recommended, directions on how to find the waterbody, boat launching sites, and navigational hazards can also be added to the maps. Prior to the first field sampling day, crews will need to prepare enough sampling forms to record their results while in the field (Appendix). Sampling forms can be printed or copied onto waterproof paper for working in inclient weather.
Backpack, shoreline, punt or boat electrofishers can be used to conduct nearshore sampling. In most situations a backpack electrofisher is most versatile and effective. In low conductivity water (e.g. 25 μS), upwards of 750 volts may be needed to stun fishes. Average power information is displayed on modern backpack units (e.g. Smith Root LR-24) and for some the user can decide whether the current or the voltage will be automatically adjusted to exceed output power. The electrical current carried by water is dependent on water conductivity and tiperature, and the complexity of habitat, all of which can vary between sites and days. This variability may have serious impact on electrofishing data, so measuring the amount of power (i.e. electrical work done) iitted by the unit will help to resolve issues of comparability between rivers, sites, and different days. Power is defined as the rate of doing work and is the product of voltage and current and is measured in watts (W). In order to standardize the watts used between sites and plots, voltage and current must be adjustable. Try to keep power output around 100 watts. Standardizing between different makes and models of equipment is important.
3.0 Site selection
3.1 Site selection
Unlike many lakes, longitudinal boundaries are not always clear in rivers. We strongly advise that field crews take a pre-sampling time to familiarize thiselves with the area of river targeted for survey. The area of river to be examined can be defined in several ways: a lake, large tributary, or waterfall might nicely define the upstream and downstream limits. If there are no obvious limits then you might consider the home ranges of the target fishes. Although river fishes may make long distance migrations for events such as spawning or over-wintering, the home ranges of some common fishes in rivers rarely exceed 10 km (Minns 1995). A mottled sculpin’s home range is typically <2 m (Petty and Grossman 2010).
In hydropower rivers, the zone of influence can be estimated to end where a large tributary enters the river or where the river enters a large lake. Lewis et al. (2004) suggests that the zone of influence extend to where the watershed area is greater than or equal to five times the watershed draining to the proposed waterpower site. In essence the dilution factor of Lewis et al. (2004) is four, one part regulated to 4 parts natural regime. Alternately, physical attributes such as thermal regime can be modelled to estimate the zone of influence. The exact location of sampling will depend on local conditions at the suggested sampling site. Sometime the site location chosen on a map will not be suitable for sampling. In such cases, move either up or down to the nearest suitable habitat and record the new location.
For regulated rivers, unless otherwise directed, the first site is immediately downstream of the dam or where safe to do so and where methodologies allow. The first five sampling sites are 0, 250, 500, 1000, and 2000 m downstream from the dam. The riaining distance of the zone of influence is divided by five to establish spacing for the riaining sites. This geometric and arithmetic spacing acknowledges that there are longitudinal gradients in abiotic and biotic variables, and that most of the change typically happens close to the dam (Ward and Stanford 1983). At each site create three electrofishing plots.
Natural rivers can be stratified into segments if so desired. A segment is a section of river with relatively homogenous habitat over the large-scale, e.g. geomorphic classifications, valley segments, uniformity in geology or substrate, or sections of river split by lakes. This stratification will help ensure that fundamentally different river segments are represented and that potential variation is partitioned. Segments upstream of a dam can be stratified.
3.2 Sample size (number of sites) to assess index of abundance
A minimum of 10-40 sites (30-120 plots) should be sampled, however; this is highly dependent on the objectives of the sampling, length of river, degree of variation in habitat, and the fish species sought. Higher variability is common in fish that aggregate (e.g. spawning time); whereas, randomly distributed fish would provide a low degree of variation. It is generally more beneficial to sample many small plots (e.g. 50-100 m2) vs. a few very large sites (e.g. 250 m2).
3.3 Sample size (number of sites) to assess biodiversity of the nearshore community
As with abundance estimation, you will likely need 10-40 sites, to adequately assess biodiversity. Species accumulation curves can be determined after each day of sampling to understand how much sampling is required for an area of interest. Richness is a function of many factors including but not limited to sampling effort, spatial extent of sampling, habitat heterogeneity, post glaciation dispersal, season etc. Species accumulation curves are graphs that show the total number of fish sampled from all samplings on the X axis and the total number of different species from all samplings on the side axis (Y axis). As the number of samples increases the number of species increases. The rate of increase slows as most of the species possible to sample are recorded and the probability of finding a new species approaches zero. The shape of the curve and the number of samples can be used to predict the probable number of species at a site. See RIN Support Spreadsheet.xls at: Development of Netting Protocols for Rivers (Riverine Index Netting) for automated spreadsheet called species richness (taxa density sensu Gotelli and Colwell 2001).
4.0 Field procedures
4.1 Electrofishing the site (plots)
Plan to electrofish the river during roughly the same time each year. More importantly, sample under similar water levels each year. This is particularly important for hydropeaking rivers not so much for run of the river operations. Fish present at low water levels may not move into areas that become wetted at higher flows (i.e. areas that are typically dry) during peak electrical diand. In turn, this may alter density estimates. Korman and Campana (2009) found significantly higher fish densities at low flows than during high flows. To ensure water levels are consistent will require cooperation from the hydro facility and weather. As fishes grow, their habitat needs may change (i.e. shift to progressively deeper shoreline habitats). Thus, comparing data from the same sites but from different times of the year or under different flows is not advised (Korman et al. 2009).
Mark the upper and lower limits of sample plots with GPS coordinates and permanent physical markers, such as brightly painted rocks or stakes: these will guide your plot dimensions. Place addition painted rock along the sides of the plot to guide electrofishing. Site length should range between 25-100m of shoreline. Sites should be classified by water velocity as either fast or slow (i.e. pool or riffle; Jones et al. 2003). Aim to sample between 50-100 m2 of shoreline habitat. Suggested plot dimensions include 2 x 30, 3 x 20, 4 x 15 m, but plots can be of a variable length and width if several widths and lengths are recorded (Figure 2).
Figure 2. Defining plot areas for sampling at a site
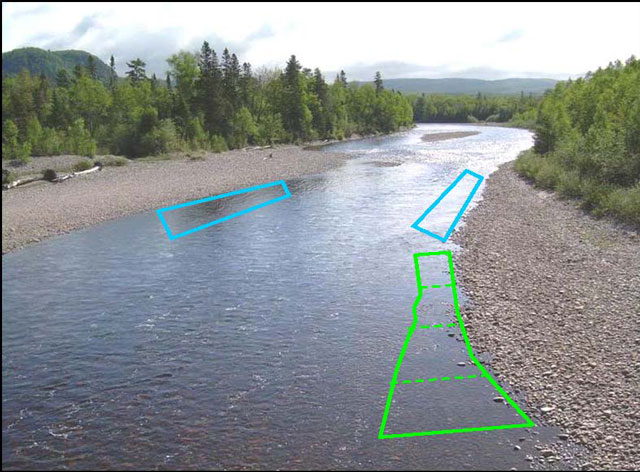
Three hypothetical plots: one with a variable plot width (green) and two plots with a fixed width (blue).
Maximum water depth fished should be 60 cms and is determined by marking the side of the crew’s waders. The total surface area electrofished should be guided by this depth limit and the associated distance to shore and the length of the site. Electrofish at a rate of 5-7 sm-2 in an upstream direction using standard back-and-fourth electrofishing technique (see electrofisher settings above). Block nets are not used. Two netters per anode operator are required. In riffles netters should keep their nets in the water to catch stunned benthic fishes: you may not see thi otherwise. Sampling among years should use the same methods. Identify, count, and measure (mass and fork length) fishes if necessary. Collect representative specimens when uncertain of their identity. Calculate species richness and catch per unit effort (individuals per unit area). Retain a subsample if age and growth, isotopes, or stomach contents, information is sought.
4.2 Fish safety
To prevent injury, use aerated live wells or frequently change water, use live well colors that mimic the natural environment and include cover in thi (e.g. rocks, leaves), minimize handling time, minimize sampling at water tiperatures above 25°C, avoid overcrowding fish in live wells, and segregate large predatory fish from small fish to prevent predation in live wells. If necessary sedate fish to make measurients more accurate, safe, and efficient.
4.3 Information to record
Record the water level and discharge based on flow gauges. Information to record about the plots includes the length and width of each transect at the site. Use a current-speed metre to estimate the range of current velocity at the plot at each corner. Record discharge and the dominant substrates (see Table 1) for each plot sampled. Record information on the air and water tiperatures, conductivity, and any observations on aquatic vegetation or woody debris. Take photographs that include distinctive markers such as large boulders or trees that will help to locate the site in the future. For each fish, the fish code should be recorded (see Appendix) as well as the fork length and mass, and if otoliths or tissue have been taken from the fish.
Table 1. Substrate classes based on the modified Wentworth scale
| Substrate class | Size descriptor |
|---|---|
| Organic matter | Wood chips, leaves, dead branches |
| Clay and silt | < 0.0625 mm |
| Sand | 0.0625 – 2 mm |
| Gravel | 2 – 64 mm |
| Cobble | 64 – 256 mm |
| Boulder | > 256 mm |
| Bedrock | Impermeable, continuous rock |
5.0 Data managient
The data recorded on the electrofishing forms are in a format compatible with the software package FISHNET 3.0 and as such data entry can be done directly from the forms into FISHNET 3.0. Send formatted data to the ministry representative if you do not have access to FISHNET. Record required information for permits to collect.
6.0 Safety and communication
6.1 Field safety
Electrofishing must follow the ministry electrofishing policy (2008). Frequently, sampling takes place in riote locations and may require travel on roads that receive little maintenance. A satellite phone is necessary in areas lacking cellular phone coverage and CB radios are required to coordinate traffic on logging roads. Consult with on-line data via Water Survey of Canada and/or hydropower companies to learn about current and forecasted flow.
Delay sampling if there are severe weather conditions. All first-aid and safety equipment must be accessible and personal floatation devices must be worn should any boat travel occur. Safety of sampling crews must override all other activities and everyone participating in sampling must be aware of their rights and obligation according to the Occupational Health and Safety Act. Follow any safety operating procedure (SOP) your ministry or department might have (e.g. backpack efishing, working on water, hazardous driving conditions, etc.). A designated person must know where the field crew is on any given day and how to contact thi. The crew must report to this person at the end of the day. As an additional check-in measure, government of Ontario iployees must use the Provincial Communications Unit (PCU). Know where your put-in and take-out points are located including iergency exit points. Missing your take-out point can be annoying and potentially dangerous, particularly if your ability to move upstream is limited. An iergency safety plan should be discussed amongst crew mibers e.g. contacts, directions to hospital.
6.2 Invasive species transfer
Care must be taken not to transfer invasive flora and fauna species. This may mean cleaning of dip nets and felt-soled boots, possible chiical treatment (e.g. peroxide, Alconox) of gear, or perhaps high tiperature steaming and drying. It may also mean that gear is confined to an area of the province i.e. provincial zones. When a boat is used to travel to sites, ensure that it is drained (bilge/live well) and all visible vegetation is rioved before moving to a new waterbody. Boat, motor, and trailer should be pressure washed and all gear should be left to dry between 48 and 96 hours if possibility of contamination is high.
6.3 License to collect fish for scientific purposes
Electrofishing and other methods of capturing fish for managient purposes are critical tools used by fisheries managers and researchers. Contractors are required to have a valid collector’s permit to carry out a fish survey which is available from the ministry work centre. However, due to recent changes in regulations, ministry staff are no longer required to obtain a permit; however, sampling in provincial parks still requires a permit. The License to Collect Fish for Scientific Purposes is provided in Section 36.1 of the Ontario Fishery Regulations (OFR) which identifies the appropriate local authority for license submission. This license is issued under Section 34.1(1) of the Fish Licensing Regulations under the Fish and Wildlife Conservation Act (FWCA) by any of the following: Area Supervisor, Regional Operations Manager, Great Lakes Manager, and Fisheries Section Manager.
6.4 Species at risk permits
A permit may be required under the provincial Endangered Species Act (ESA) or the federal Species at Risk Act (SARA), if the sampling locations are in areas where a listed species at risk may be captured. Species listed as Extirpated, Endangered or Threatened are protected under both the Endangered Species Act and Species at Risk Act. A list of species listed under the Endanger Species Act can be found at Species at Risk webpage and Schedule 1 species protected under SARA can be found at the Species at Risk Public Registry webpage. The local ministry and DFO district offices should be contacted, should there be a possibility of encountering a listed species. If the sampling activity is anticipated to cause an unacceptable level of harm to the population of a listed species, it is possible that a permit will not be issued and alternative sampling locations or methods may need to be selected.
7.0 Acknowledgments
Thanks to Scott Gibson, Josh Korman, Matthew Bond, Ray Tyhuis, Ryan Hill, and Karen Smokorowski for their helpful comments, criticisms, and lively discussions.
8.0 References
Gotelli N, Colwell RK. 2001. Quantifying biodiversity: Procedures and pitfalls in the measurient and comparison of species richness. Ecology Letters 4:379-391
Jones, N. E., W. M. Tonn, G. J. Scrimgeour, and C. Katopodis. 2003. Productive capacity of an artificial stream in the Canadian Arctic: assessing the effectiveness of fish habitat compensation. Canadian Journal of Fisheries and Aquatic Sciences 60: 849 863.
Korman, J. and S.E. Campana. 2009. Effects of hydropeaking on nearshore habitat use and growth of age-0 rainbow trout in a large regulated river. Transactions of the American Fisheries Society 138:76-87.
Korman, J., M. Yard, C. Walters, and L.G. Coggins. 2009. Effects of fish size, habitat, flow, and density on capture probabilities of age-0 rainbow trout estimated from electrofishing at discrete sites in a large river. Transactions of the American Fisheries Society 138:58–75.
Lewis A, Hatfield T, Chilibeck B, Roberts C. 2005. Assessment methods for aquatic habitat and instream flow characteristics in support of applications to dam, divert, or extract water from streams in British Columbia. Ministry of Water, Land & Air Protection and Ministry of Sustainable Resource Managient; 103. [22 Noviber 2011].
Minns, C.K. 1995. Allometry of home range size in lake and river fishes. Canadian Journal of Fisheries and Aquatic Sciences 52:1499-1508.
Nielsen, L.A., and D.L. Johnson, editors. 1983. Fisheries techniques. American Fisheries Society, Bethesda, Maryland.
MNR. 2008. Electrofishing equipment and operating: Guidelines and procedures. Fisheries Section, MNR.
Petty, J. T. and G. D. Grossman. 2010. Giving-up densities and ideal pre-iptive patch use in a predatory benthic stream fish. Freshwater Biology 55: 780-793.
Smokorowski, K., Metcalfe, R., Finucan, S. Jones, N.E, Marty, J, Power, M, Pyrce, R., Steele, R. Ecosysti level assessment of environmentally-based flow restrictions for maintaining ecosysti integrity: a comparison of a modified peaking vs. unaltered river. Ecohydrology 4:791–806 DOI:10.1002/eco.167.
Ward J.M. (1975) Downstream fate of zooplankton from a hypolimnial release mountain reservoir. Internationale Vereinigung fur Theoretische und Angewande Limnologie 19:1798–1804.
Ward J.V., Stanford J.A. 1983. The serial discontinuity concept of lotic ecosystis. In Dynamics of Lotic Ecosystis. Edited by T.D. Fontaine and S.M. Bartell. Ann Arbor Science, Ann Arbor, Michigan, USA pp. 29-42.
8.1 Helpful resources
Erling Holm, E., N.E. Mandrak, and M.E. Burridge 2009. The ROM field guide to freshwater fishes of Ontario. Toronto : Royal Ontario Museum
Johnson, D.H., B.M. Shrier, J.S. O’Neal, J.A. Knutzen, X. Augerot, T. A. O’Neil, and T. N. Pearsons, eds. 2007. Salmonid Field Protocols Handbook: Techniques for Assessing Status and Trends in Salmon and Trout Populations. American Fisheries Society, Bethesda, Maryland. 478 pp.
Flotiersch, J.E, B.C. Autrey, and S.M. Cormier, eds. 2000. Logistics of Ecological Sampling on Large Rivers. U.S. Environmental Protection Agency, Cincinnati, Ohio.
Appendix: Species codes
| Species code | Species name |
|---|---|
| 010. | Petromyzontidae - Lampreys* |
| 011. | American brook lamprey - Lampetra appendix |
| 012. | northern brook lamprey - Ichthyomyzon fossor |
| 013. | silver lamprey - Ichthyomyzon unicuspis |
| 014. | sea lamprey - Petromyzon marinus |
| 015. | Ichthyomyzon sp. |
| 016. | chestnut lamprey - Ichthyomyzon castaneus |
| 020. | Polyodontidae - Paddlefishes* |
| 021. | paddlefish - Polyodon spathula |
| 030. | Acipenseridae - Sturgeons* |
| 031. | lake sturgeon - Acipenser fulvescens |
| 032. | caviar |
| 040. | Lepisosteidae - Gars* |
| 041. | longnose gar - Lepisosteus osseus |
| 042. | spotted gar - Lepisosteus oculatus |
| 043. | Lepisosteus sp. |
| 050. | Amiidae - Bowfins* |
| 051. | bowfin - Amia calva |
| 060. | Clupeidae - Herrings* |
| 061. | alewife - Alosa pseudoharengus |
| 062. | American shad - Alosa sapidissima |
| 063. | Gizzard shad - Dorosoma cepedianum |
| 064. | Alosa sp. |
| Salminidae - Trouts: * | |
| 070. | Salmoninae - Salmon and Trout subfamily |
| 071. | pink salmon - Oncorhynchus gorbuscha |
| 072. | chum salmon - Oncorhynchus keta |
| 073. | coho salmon - Oncorhynchus kisutch |
| 074. | sockeye salmon - Oncorhynchus nerka |
| 075. | chinook salmon - Oncorhynchus tshawytscha |
| 076. | rainbow trout - Oncorhynchus mykiss |
| 077. | Atlantic salmon - Salmo salar |
| 078. | brown trout - Salmo trutta |
| 079. | Arctic char - Salvelinus alpinus |
| 080. | brook trout - Salvelinus fontinalis* |
| 081. | lake trout - Salvelinus namaycush |
| 082. | splake - Salvelinus fontinalis x Salvelinus namaycush |
| 083. | Aurora trout - Salvelinus fontinalis timagamiensis |
| 084. | Oncorhynchus sp. |
| 085. | Salmo sp. |
| 086. | Salvelinus sp. |
| 090. | Coregoninae - Whitefish subfamily* |
| 091. | lake whitefish - Coregonus clupeaformis |
| 092. | longjaw cisco - Coregonus alpenae |
| 093. | cisco (lake herring) - Coregonus artedi |
| 094. | bloater - Coregonus hoyi |
| 095. | deepwater cisco - Coregonus johannae |
| 096. | kiyi - Coregonus kiyi |
| 097. | blackfin cisco - Coregonus nigripinnis |
| 098. | Nipigon cisco - Coregonus nipigon |
| 099. | shortnose cisco - Coregonus reighardi |
| 100. | shortjaw cisco - Coregonus zenithicus* |
| 101. | pygmy whitefish - Prosopium coulteri |
| 102. | round whitefish - Prosopium cylindraceum |
| 103. | chub - Coregonus sp. (Cisco species other than C. artedi) |
| 106. | Coregonus sp. |
| 107. | Prosopium sp. |
| 120. | Osmeridae - Smelts* |
| 121. | rainbow smelt - Osmerus mordax |
| 130. | Esocidae - Pikes* |
| 131. | northern pike - Esox lucius |
| 132. | |
| muskellunge - Esox masquinongy | |
| 133. | grass pickerel - Esox americanus vermiculatus |
| 134. | Esox sp. |
| 135. | chain pickerel - Esox niger |
| 140. | Umbridae - Mudminnows* |
| 141. | central mudminnow - Umbra limi |
| 150. | Hiodontidae - Mooneyes* |
| 151. | goldeye - Hiodon alosoides |
| 152. | mooneye - Hiodon tergisus |
| 160. | Catostomidae - Suckers* |
| 161. | quillback - Carpiodes cyprinus |
| 162. | longnose sucker - Catostomus catostomus |
| 163. | white sucker - Catostomus commersonii |
| 164. | lake chubsucker - Erimyzon sucetta |
| 165. | northern hog sucker - Hypentelium nigricans |
| 166. | bigmouth buffalo - Ictiobus cyprinellus |
| 167. | spotted sucker - Minytria melanops |
| 168. | silver redhorse - Moxostoma anisurum |
| 169. | black redhorse - Moxostoma duquesnei |
| 170. | golden redhorse - Moxostoma erythrurum* |
| 171. | shorthead redhorse - Moxostoma macrolepidotum |
| 172. | greater redhorse - Moxostoma valenciennesi |
| 173. | river redhorse - Moxostoma carinatum |
| 174. | black buffalo - Ictiobus niger |
| 176. | Catostomus sp. |
| 177. | Moxostoma sp. |
| 178. | Ictiobus sp. |
| 180. | Cyprinidae - Carps and Minnows* |
| 181. | goldfish - Carassius auratus |
| 182. | northern redbelly dace - Chrosomus eos |
| 183. | finescale dace - Chrosomus neogaeus |
| 184. | redside dace - Clinostomus elongatus |
| 185. | lake chub - Couesius plumbeus |
| 186. | common carp - Cyprinus carpio |
| 187. | gravel chub - Erimystax x-punctatus |
| 188. | cutlips minnow - Exoglossum maxillingua |
| 189. | brassy minnow - Hybognathus hankinsoni |
| 190. | eastern silvery minnow - Hybognathus regius |
| 191. | silver chub - Macrhybopsis storeriana |
| 192. | hornyhead chub - Nocomis biguttatus |
| 193. | river chub - Nocomis micropogon |
| 194. | golden shiner - Notiigonus crysoleucas |
| 195. | pugnose shiner - Notropis anogenus |
| 196. | ierald shiner - Notropis atherinoides |
| 197. | bridle shiner - Notropis bifrenatus |
| 198. | common shiner - Luxilus cornutus |
| 199. | blackchin shiner - Notropis heterodon |
| 200. | blacknose shiner - Notropis heterolepis |
| 201. | spittail shiner - Notropis hudsonius |
| 202. | rosyface shiner - Notropis rubellus |
| 203. | spotfin shiner - Cyprinella spiloptera |
| 204. | sand shiner - Notropis stramineus |
| 205. | redfin shiner - Lythrurus umbratilis |
| 206. | mimic shiner - Notropis volucellus |
| 207. | pugnose minnow - Opsopoeodus iiliae |
| 208. | bluntnose minnow - Pimephales notatus |
| 209. | fathead minnow - Pimephales promelas |
| 210. | blacknose dace - Rhinichthys atratulus |
| 211. | longnose dace - Rhinichthys cataractae |
| 213. | fallfish - Siotilus corporalis |
| 214. | pearl dace - Margariscus nachtriebi |
| 215. | silver shiner - Notropis photogenis |
| 216. | central stoneroller - Campostoma anomalum |
| 217. | striped shiner - Luxilus chrysocephalus |
| 218. | ghost shiner - Notropis buchanani |
| 219. | grass carp - Ctenopharyngodon idella |
| 220. | rudd - Scardinius erythrophthalmus |
| 221. | Phoxinus sp. |
| 222. | Hybognathus sp. |
| 223. | Nocomis sp. |
| 224. | Notropis sp. |
| 225. | Pimephales sp. |
| 226. | Rhinichthys sp. |
| 227. | Siotilus sp. |
| 228. | Hybopsis sp. |
| 229. | Luxilus sp. |
| 230. | Ictaluridae - Bullhead Catfishes* |
| 231. | black bullhead - Ameiurus melas |
| 232. | yellow bullhead - Ameiurus natalis |
| 233. | brown bullhead - Ameiurus nebulosus |
| 234. | channel catfish - Ictalurus punctatus |
| 235. | stonecat - Noturus flavus |
| 236. | tadpole madtom - Noturus gyrinus |
| 237. | brindled madtom - Noturus miurus |
| 238. | margined madtom - Noturus insignis |
| 239. | flathead catfish - Pylodictis olivaris |
| 241. | Ictalurus sp. |
| 242. | Noturus sp. |
| 243. | Ameiurus sp. |
| 244. | northern madtom - Noturus stigmosus |
| 250. | Anguillidae - Freshwater Eels* |
| 251. | American eel - Anguilla rostrata |
| 260. | Cyprinodontidae - Killifishes* |
| 261. | banded killifish - Fundulus diaphanus |
| 262. | blackstripe topminnow - Fundulus notatus |
| 270. | Gadidae - Cods* |
| 271. | burbot - Lota lota |
| 280. | Gasterosteidae - Sticklebacks* |
| 281. | brook stickleback - Culaea inconstans |
| 282. | threespine stickleback - Gasterosteus aculeatus |
| 283. | ninespine stickleback - Pungitius pungitius |
| 284. | fourspine stickleback - Apeltes quadracus |
| 290. | Percopsidae - Trout-perches |
| 291. | trout-perch - Percopsis omiscomaycus |
| 300. | Percichthyidae - Tiperate Basses* |
| 301. | white perch - Morone americana |
| 302. | white bass - Morone chrysops |
| 303. | Morone sp. |
| 310. | Centrarchidae - Sunfishes* |
| 311. | rock bass - Ambloplites rupestris |
| 312. | green sunfish - Lepomis cyanellus |
| 313. | pumpkinseed - Lepomis gibbosus |
| 314. | blue gill - Lepomis macrochirus |
| 315. | longear sunfish - Lepomis megalotis |
| 316. | smallmouth bass - Micropterus dolomieu |
| 317. | largiouth bass - Micropterus salmoides |
| 318. | white crappie - Pomoxis annularis |
| 319. | black crappie - Pomoxis nigromaculatus |
| 320. | Lepomis sp. |
| 321. | Micropterus sp. |
| 212. | creek chub - Siotilus atromaculatus |
| 310. | Centrarchidae – Sunfishes con’t |
| 322. | Pomoxis sp. |
| 323. | warmouth - Lepomis gulosus |
| 324. | orangespotted sunfish - Lepomis humilis |
| 330. | Percidae - Perches* |
| 331. | yellow perch - Perca flavescens |
| 332. | sauger - Stizostedion canadense |
| 333. | blue pike (blue pickerel) - Stizostedion vitreum glaucum |
| 334. | walleye (yellow pickerel) - Sander vitreum |
| 335. | eastern sand darter - Ammocrypta pellucida |
| 336. | greenside darter - Etheostoma blennioides |
| 337. | rainbow darter - Etheostoma caeruleum |
| 338. | Iowa darter - Etheostoma exile |
| 339. | fantail darter - Etheostoma flabellare |
| 340. | least darter - Etheostoma microperca |
| 341. | johnny darter - Etheostoma nigrum |
| 342. | logperch - Percina caprodes |
| 343. | channel darter - Percina copelandi |
| 344. | blackside darter - Percina maculata |
| 345. | river darter - Percina shumardi |
| 346. | tessellated darter - Etheostoma olmstedi |
| 347. | Stizostedion sp. |
| 348. | Etheostoma sp. |
| 349. | Percina sp. |
| 350. | ruffe - Gymnocephalus cernuus |
| 360. | Atherinidae - Silversides* |
| 361. | brook silverside - Labidesthes sicculus |
| 365. | Gobiidae - Gobies* |
| 366. | round goby - Neogobius melanostomus |
| 367. | tubenose goby - Proterorhinus marmoratus |
| 370. | Sciaenidae - Drums* |
| 371. | freshwater drum - Aplodinotus grunniens |
| 380. | Cottidae - Sculpins* |
| 381. | mottled sculpin - Cottus bairdii |
| 382. | slimy sculpin - Cottus cognatus |
| 383. | spoonhead sculpin - Cottus ricei |
| 384. | deepwater sculpin - Myoxocephalus thompsonii |
| 385. | Cottus sp. |
| 386. | Myoxocephalus sp. |
| 387. | fourhorn sculpin - Myoxocephalus quadricornis |
*Family name
Electrofishing metadata form (sample)
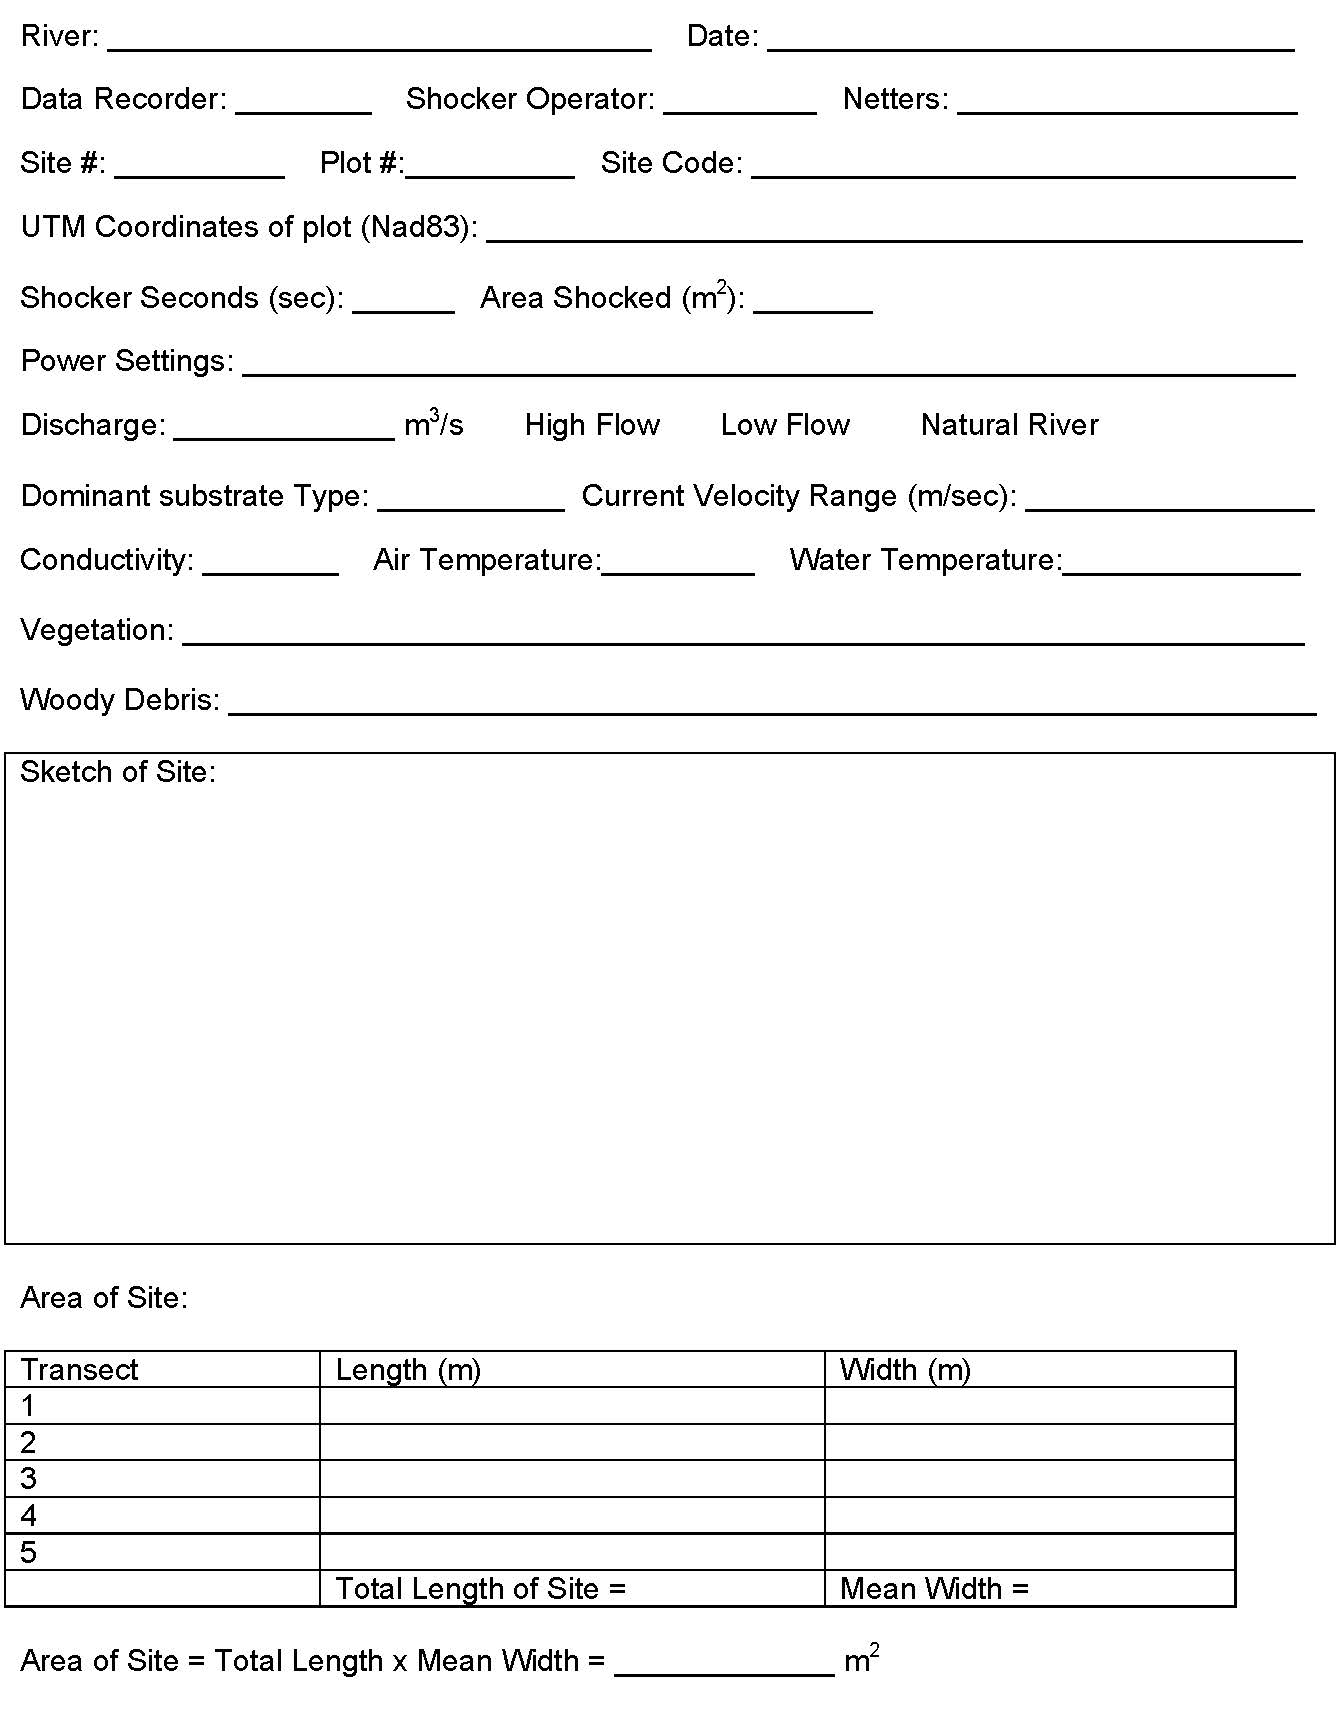

- River: [insert here]
- Date: [insert here]
- Data recorder: [insert here]
- Shocker operator: [insert here]
- Netters: [insert here]
- Site #: [insert here]
- Plot #: [insert here]
- Site code: [insert here]
- UTM Coordinates of plot (Nad83): [insert here]
- Shocker seconds (sec): [insert here]
- Area shocked (m2): [insert here]
- Power settings: [insert here]
- Discharge: [indicate Yes or No]
- m3/s [Yes or No]
- High Flow [Yes or No]
- Low Flow [Yes or No]
- Natural River [Yes or No]
- Dominant substrate type: [insert here]
- Current velocity range (m/sec): [insert here]
- Conductivity: [insert here]
- Air temperature: [insert here]
- Water temperature: [insert here]
- Vegetation: [insert here]
- Woody debris: [insert here]
- Sketch of site: [insert here]
- Area of site:
- 5 Transects:
- Length (m) [insert here] × Width (m) [insert here]
- Length (m) [insert here] × Width (m) [insert here]
- Length (m) [insert here] × Width (m) [insert here]
- Length (m) [insert here] × Width (m) [insert here]
- Length (m) [insert here] × Width (m) [insert here]
- Total length of site: [insert here]
- Mean width: [insert here]
- Area of Site = Total Length × Mean Width = [insert here] m2
- 5 Transects:
- For each fish record:
- Fish #:
- Species code:
- Fork length (mm):
- Mass (g):
- Otoliths taken? (Y/N)
- Tissue taken?(Y/N)
- Comment:
MNR 62762
ISBN 978-1-4435-8961-1 (PDF)