Forest management: Great Lakes and St. Lawrence landscapes
Direction for forest managers on standards, guidelines and best management practices to follow when developing forest management plans in the Great Lakes-St. Lawrence forest region. The primary objective of the guide is to ensure biodiversity at the landscape level is enhanced or maintained.
Cette publication spécialisée n’est disponible qu’en anglais en vertu du Règlement 411/10, qui en exempte l’application de la Loi sur les services en français.
Current publications of the Ontario Ministry of Natural Resources and price lists are available from this office.
Natural Resources Information Centre:
300 Water Street
P.O. Box 7000
Peterborough, ON K9J 8M5
Telephone inquiries about ministry programs and services should be directed to the Service Ontario Contact Centre:
General Inquiry
Renseignements en Francais
Other government publications are available from: Publications Ontario, Main Floor, 777 Bay St., Toronto
Visit the Ontario’s Forests website
Visit the Ontario Ministry of Natural Resources website
How to cite this manual:
ISBN: 978-1-4435-3270-9 Print “Imprimer”
ISBN: 978-1-4435-3271-6 Portable Document Format (PDF)
Dedication
This guide is dedicated to the children born to those involved in its development. They are our lasting approach to evaluating our effectiveness.
Acknowledgements
The Forest Management Branch of the Ministry of Natural Resources (MNR) would like to thank the individuals who contributed to the development team for this guide. These individuals gave of their personal time and took time away from their primary duties to provide MNR with their professional advice.
The development team advised MNR on the content and direction of the Landscape Guide to ensure it was efficient and effective and the Ministry gratefully acknowledges the contributions of the development team: Michael Gluck (Ontario Ministry of Natural Resources: Forest Management Branch, Forest Policy Section), Joe Churcher (Ontario Ministry of Natural Resources: Forest Management Branch, Forest Policy Section), Colin Hewitt (Abitibi Consolidated; Representing Ontario Forest Industries Association), Gillian MacEachern (Wildlands League), David Pearce (Wildlands League), Robert Pineo (Ontario Federation of Anglers and Hunters), Kandyd Szuba (Domtar; Representing Ontario Forest Industries Association).
Exceptional leadership of Brian Hillier and Joe Churcher of Forest Policy Section must be acknowledged in allowing the Landscape Guide to be innovative and comprehensive.
This is a science-based policy that had exceptional support from the dedicated group of professionals that comprised the Great Lakes St-Lawrence Science Team:
- Phil Elkie, Forest Landscape Specialist, OMNR, Forest Policy Section.
- John Boos, Regional Planning Biologist, OMNR, Southern Region Planning.
- Jeff Bowman, Research Scientist, OMNR, Wildlife Research and Development Section. Colin Daniel, Systems Analyst, ESSA Technologies.
- Rob Davis, Senior Coordinator, Science and Information, Ontario Parks, Planning & Research
- Julie Elliott, Analyst, OMNR, Applied Research and Development Section. Leonardo Frid, Systems Analyst, ESSA Technologies.
- David Heaman, Fire Science and Planning Specialist, OMNR Aviation and Forest Fire Management Branch.
- Rob Kushneriuk, Forest Landscape Specialist, OMNR, Wildlife Research and Development Section.
- Greg Lucking, Regional Planning Biologist, OMNR, Northeast Region Planning
- Stephen Mills, Forest Wildlife Habitat Specialist, OMNR, Northeast and Science and Information Section.
- Brian Naylor, Forest Management Guide Biologist, OMNR, Forest Policy Section
- Fred Pinto, Conifer Program Leader, OMNR, Southern Region Science and Information Specialist.
- Bruce Pond, Research Scientist, OMNR, Wildlife Research and Development Section.
- Rob Rempel, Research Scientist, OMNR, Applied Research and Development Section.
- Glen Watt, Regional Planning Analyst, OMNR, Southern Region Planning Section.
- Murray Woods, Senior Analyst Forested Landscapes, OMNR, Southern Region Science and Information Section.
Good forest management guides require good tools for successful implementation. Ontario’s Landscape Tool was developed by Phil Elkie, Andy Smiegielski, Michael Gluck, Julie Elliott, Rob Rempel, Rob Kushneriuk, Brian Naylor, Jeff Bowman, Bruce Pond and Derek Hatfield
Development of the regional direction could not have occurred without the assistance and support of Kazia Milian, Roger Davison and Glen Watt in the GLSL South and Steve Osawa, Roger Leith, Denis Gagnon and Robert Hunt in the GLSL-North.
The Provincial Forest Technical Committee provided MNR with thoughtful and constructive advice throughout the development of the Landscape Guide.
A final note of sincere appreciation to the public and to the staff of MNR for the professional support and comments that were submitted as a result of many workshops, meetings with the development team, informal communications and the Environmental Bill of Rights (EBR) environmental registry postings.
How to use this guide
The most efficient way to use the Forest Management Guide for Great Lakes-St. Lawrence Landscapes (hereafter referred to as the Landscape Guide) in Forest Management Planning is to follow these steps:
- Read the Landscape Guide: The main body of the guide describes how the guide was developed, forest management planning (FMP) implementation steps and an approach to effectiveness monitoring of the guide direction.
- Refer to the Landscape Guide Milestones Appendices for the applicable Landscape Guide Region. There are 6 Landscape Guide regions across Ontario. Each forest management planning unit has Landscape Guide direction contained within a single Landscape Guide region.
- Use Ontario’s Landscape Tool (OLT) (Elkie et al. 2009a) to measure and assess the landscape of interest. OLT is a computer-based tool that measures indicators described in the Landscape Guide and Appendices. OLT also contains science and information packages which describe the simulation models, results and supporting science used in the development of the guide.
- Incorporate the Landscape Guide direction into forest management planning.
1 Introduction
1.1 Objective of the Landscape Guide
The objective of the Landscape Guide is to direct forest management activities to maintain or enhance natural landscape structure, composition and patterns that provide for the long term health of forest ecosystems in an efficient and effective manner. For purposes of this guide, ‘landscape’ describes an area covering hundreds of thousands to tens of thousands of square kilometres, roughly equivalent to ecoregions (see section 1.2.3).
The Crown Forest Sustainability Act (CFSA) (1994) provides for the sustainability (long- term health) of Crown forests to be managed to meet social, economic and environmental needs of present and future generations. Ontario’s forest management guides are based, in part, on the two CFSA principles that direct Ontario’s forest management planning. The first principle mandates that large, healthy, diverse and productive Crown forests and their associated ecological processes and biological diversity should be conserved. The second principle directs that conservation should be achieved through emulation of natural disturbances and landscape patterns while minimizing adverse effects on forest values. These principles of the CFSA provide the direction for both the development of the Landscape Guide direction and the determination of its effectiveness. Emulation of natural disturbance and landscape patterns through forest management, directs how to conserve biodiversity (as is required under the required under the Declaration Order regarding MNR’s Class Environmental Assessment Approval for Forest Management on Crown Lands in Ontario (EA Condition 39)) and is treated as a hypothesis as discussed in section 2.3. The principal comparison for evaluating effectiveness of the Landscape Guide direction is between forests that have developed from natural processes versus those that have arisen through application of the forest management guides. The principal measurement, as mandated by the CFSA, is the conservation of biodiversity and ecological processes. Additional policy background is described later (Section 1.3); however, it is important to describe some key concepts that form the basis for the Landscape Guide.
Similar to all forest management guides, the mandate of this document is limited to Crown forests within the Area of the Undertaking (AOU) of Ontario (specifically those forests within the Great Lakes-St. Lawrence forest region), and for any Crown forests within that forest region located outside the AOU for which MNR has Environmental Assessment approval to undertake forestry activities. The philosophy and direction provided may also be helpful when managing other Crown forests outside of the AOU and private forest lands.
1.2 Key concepts
1.2.1 Effectiveness
Key concepts in the CFSA principals such as conserving diverse and productive forests and their associated ecological processes and biological diversity with an explicit comparison to natural disturbances and landscape patterns are comparable to the concept of ecological integrity (Karr 1991). Integrity implies an unimpaired condition or the quality or state of being complete or undivided; it implies correspondence with some original condition (Karr 1996). A healthy ecosystem has an adaptive set of organisms. For example, primary-secondary consumer complexes, such as Bay Breasted Warblers, help control the spread of forest disease by controlling spruce budworm outbreaks. Functional systems, such as a community of soil organisms, provide nutrients to future trees and habitat for amphibians and small mammals through decomposition. Nest webs, such as those that include keystone woodpeckers, help to provide nesting and feeding habitat for a variety of wildlife. Although much is still to be learned, we know that the underlying habitat diversity, together with the flow of energy within integrated food webs, plays a critical role in sustaining the integrity of forest ecosystems (McCann 2007). Plant and wildlife communities must be adaptive because environmental conditions never remain constant. Whether it is long-term cycles of solar activity, the effects of global increases in particular gases, or the adaptive cycles of exploitation, conservation, release, and reorganization (Gunderson and Holling 2002), environments will change. Genetic diversity and pathways of mobility are key elements for ensuring populations and communities can adapt to ever changing environmental conditions. As environments change through successional development stages, individual species will rise and fall in relative abundance.
The purpose of the CFSA is to ensure the long-term health of our forest ecosystems for the benefit of the local and global environments, while enabling present and future generations to meet their material and social needs. Meeting this purpose, means, in part, that ecosystem patterns and processes reflect the composition, structure and function of comparable natural systems. Forest management should not negatively affect the provision of ecosystem services related to nutrient dynamics, primary and secondary production, habitat and predator-prey dynamics, hydrological cycles or pest and disease control. Forest management should not impede the ability of plant and wildlife communities to adapt to changing conditions. Genetic diversity and pathways of mobility are key elements for ensuring populations and communities can adapt to ever changing environmental conditions. The effectiveness of the Landscape Guide is based on the prediction that forest management will result in landscapes that are similar to those created from natural disturbance in terms of their community structure, population trends and ecological processes. Whether this prediction is borne out will be part of the review of the Landscape Guide. Section 4 describes this review and the approach to effectiveness monitoring in more detail.
1.2.2 Efficiency
Efficiency was considered as the ease with which people can prepare, read and implement forest management plans using the Landscape Guide. The principle of efficiency was second only to effectiveness throughout the development of the Landscape Guide. Some examples of how efficiency was considered include:
- Streamlining the Landscape Guide direction to integrate with the strategic forest management planning.
- Identifying parsimonious direction (standards, guidelines and best management practices) based on a Decision Analysis and Adaptive Management Approach (see section 2).
- Forest Management Guide for Great Lakes – St. Lawrence Landscapes
- Discussions with practitioners and others that provided feedback on proposed direction (see section 2.1)
- Using a coarse filter of emulating natural disturbances and landscape patterns as an efficient way to direct management.
OMNR will monitor the efficiency of the Landscape Guide through continuing discussions and feedback from those involved in the development and application of the Landscape Guide – like predictions on effectiveness, the predicted efficiencies will be considered in the future review of the Landscape Guide (section 4.3).
1.2.3 Landscape guide regions
The Landscape Guide uses a forest-centric approach to define landscapes based on natural factors that reflect structure, composition and function across space and time (Rowe and Sheard 1981, Franklin 1993). Ecoregions are ecological landscape units (ranging in resolution from hundreds of thousands to tens of thousands of square kilometres) characterized by distinct patterns of responses to climate as expressed by soils, hydrology, vegetation (species ranges and productivity), and fauna (OMNR 2000). Processes that operate at ecoregion scales include natural disturbance regimes, forest succession and population dynamics of some wildlife (e.g. caribou, wolves, moose, goshawk, great grey owl). Ecoregions were used to develop the Landscape Guide regions, which this guide considers as its landscape unit.
Landscape Guide Regions are groupings of Forest Management Units that approximate ecoregion boundaries (Figure 1). These regions have been designed such that Forest Management Units are nested within Landscape Guide Regions so that direction for individual Management Units may be given efficiently within an ecoregion context. Landscape Guide direction can vary among Landscape Guide regions to reflect significant ecological differences in landscape structure, composition and/or pattern. Each Landscape Guide region has its own Milestones Appendix which directs individual management units in their contribution to biodiversity conservation at the Landscape Guide region level. Landscape guide regions are also used in the approach to effectiveness monitoring (Section 4).
Figure 1. Landscape guide regions of Ontario
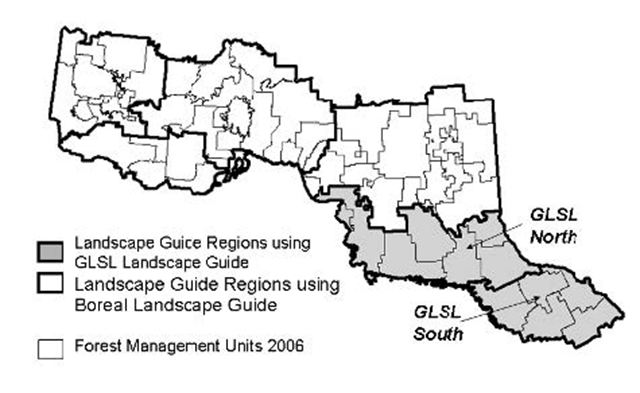
Enlarge Figure 1. Landscape guide regions of Ontario map
Landscape Guide Regions shaded grey will use the Forest Management Guide for Great Lakes-St. Lawrence Landscapes, whereas other regions will use the Forest Management Guide for Boreal Landscapes (in preparation).
1.2.4 Guides, standards, guidelines and best management practices
Direction within this document is characterized as a standard, a guideline, or a best management practice. It is important to understand the differences between these three terms since they have different implications with respect to writing a forest management plan.
- guide: A document that contains direction (including past forest or timber management “guidelines”).
- standard: A component of a guide that provides mandatory direction. The Landscape Guide uses standards when precise direction is given.
- guideline: A component of a guide that provides mandatory direction, but requires professional judgment for it to be applied appropriately at the local level. The Landscape Guide uses guidelines in order for professionals to incorporate knowledge and experience of local ecological conditions to improve the application of mandatory direction.
- best management practice: A component of a guide that suggests a practice or strategy to help implement the overall purpose of the standards and guidelines (note that this is a revised definition from previous forest management guides).
Standards must be followed as written; there is no room for interpretation on the part of the planning team. Guidelines are also mandatory and must be followed, but require professional expertise and local knowledge in order to be implemented. They may be expressed as a range of values or may need to be implemented in different ways according to the site conditions or circumstances encountered. Best management practices are not mandatory direction, but rather are examples of practices that the planning team may wish to use. The list of best management practices is not intended to be exhaustive; planning teams may think of and implement other ideas or strategies. There is no requirement to use any of these best management practices, and a specific best management practice may not be applicable to local circumstances.
Standards and guidelines are formatted in bold in the Landscape Guide. The formatted text is the actual standard or guideline. Best management practices are indicated as such but they have normal format.
1.3 Policy background
1.3.1 MNR’s strategic direction
The Ministry of Natural Resources (MNR) is the steward of Ontario’s provincial parks, forests, fisheries, wildlife, mineral aggregates, and the Crown lands and waters that make up 87 per cent of the province. This is a major responsibility which MNR manages through a diverse legislative mandate and an array of programs aimed at meeting the needs of a broad client base.
The Ministry envisions a healthy environment that is naturally diverse and supports a high quality of life for the people of Ontario through sustainable development. The Ministry’s mission is to manage Ontario’s natural resources in an ecologically sustainable way to ensure that they are available for the enjoyment and use of future generations. The Ministry is committed to the conservation of biodiversity and the use of natural resources in a sustainable manner.
In 2008 the MNR revised its Statement of Environmental Values (SEV) under the Environmental Bill of Rights (EBR). The SEV is a document that describes how the purposes of the EBR are to be considered whenever decisions that might significantly affect the environment are made in the Ministry. The Ministry has considered its SEV during the development of the Forest Management Guide for Great Lakes-St. Lawrence Landscapes. This document is intended to reflect the direction set out in the SEV and to further the objectives of managing our natural resources on a sustainable basis.
1.3.2 Legislative context
The two key pieces of legislation that govern forest management on Crown land in Ontario are the Crown Forest Sustainability Act (CFSA) and the Environmental Assessment (EA) Act.
As noted earlier, Landscape Guide objectives to emulate natural disturbances and landscape patterns are based on one of the principles of the CFSA. The CFSA also requires the development and distribution of four regulated manuals, two of which give legal context to the forest management guides. The Forest Management Planning Manual (FMPM) requires that forest management guides be used during the preparation of a forest management plan. Similarly, the Forest Operations and Silviculture Manual lists the various policies, including the forest management guides that relate to forest operations on Crown land.
The CFSA, through its regulated manuals, requires that forest management guides be used in the preparation of a forest management plan. For purposes of monitoring compliance, it is important to realize that the approved forest management plan is the legal instrument against which forest operations are compared. What occurs on the ground is compared to what is written in the approved plan, not what is found in this guide. Therefore, it is necessary to include the direction from this guide that is relevant to particular locations and operations in the appropriate portion of the forest management plan, as required by the Forest Management Planning Manual.
Using the forest management guides during the planning and implementation of forest management activities is also a legal requirement under MNR’s class environmental assessment approval for forest management on Crown lands in Ontario as set out in Declaration Order MNR-71, as amended by MNR-71/2, under the Environmental Assessment Act (Condition 38a). Other parts of Condition 38 include posting the status of current guides on the Internet; reviewing and, where necessary, revising each guide at least every five years; reflecting up-to-date scientific knowledge in the guides; where feasible and with the advice of the Provincial Forest Technical Committee, pilot testing new direction before it is finalized; describing the approach to the effectiveness monitoring program that will be implemented for the new guide; and providing opportunities for public review of draft guides, through the Environmental Bill of Rights Registry, and access to final guides, through MNR’s Internet site. Other conditions of the declaration order relate indirectly to the forest management guides, most notably Condition 31, the continuation of a program of scientific studies to assess the effectiveness of the guides, and Condition 37, the maintenance of the Provincial Forest Technical Committee as a public advisory committee to the Assistant Deputy Minister, Forests Division with respect to content of and changes to forest management guides.
There is also other provincial and federal legislation that must be followed during forest operations. These laws formed part of the rationale behind the development of the specific direction in this guide. If there are inconsistencies or gaps between federal or provincial legislation and the direction in this guide, however, the legislation will always take precedence.
1.3.3 The revised forest management guides
Ontario’s Forest Accord (1999), an agreement between MNR, the forest industry and the Partnership for Public Lands supported a transparent review of the forest management guidelines which are applied within forest management planning with a goal of ensuring the guidelines fulfill their intended purpose in an effective and efficient manner. In 1999 MNR hired independent consultants to review the existing forest management guides for ambiguity and redundancy. The consultants were asked to provide recommendations about how to improve the efficiency and usability of the guides, while maintaining and respecting the original intent of the guides which was to provide sound forest management direction. The final report listed 80 recommendations to improve the guides (Aborvitae et al. 2000). For example, MNR needed to be more careful and consistent in the wording used to describe the direction provided in each guide. One of the most important, was to restructure the material and consolidate the guides into a fewer number of documents. Further examination of this recommendation resulted in a decision to create a new suite of five guides. These two recommendations, along with 78 others, were accepted by MNR to review existing guides, as described in the Implementation and Phase-In Section.
1.4 Implementation and phase-in provisions
1.4.1 Previous guides replaced
For the GLSL-North and GLSL–South guide regions, this guide replaces the landscape level direction in the following forest management guides:
- Forest management guide for natural disturbance pattern emulation (OMNR 2001)
- Forest management guidelines for the provision of marten habitat (OMNR 1996a)
- Forest management guidelines for the provision of pileated woodpecker habitat (OMNR 1996b)
- Forest management guidelines for the provision of white-tailed deer habitat (OMNR 1997)
- Timber management guidelines for the provision of moose habitat (OMNR 1988)
This version of the Landscape Guide is written for only the Great Lakes-St. Lawrence Forest Region. A Landscape Guide for Boreal Forest Region will be released in the future.
1.4.2 Implementing the Landscape Guide in phase I (first five year term) of forest management plans
This version of the Landscape Guide will be used in the preparation of forest management plans in the GLSL-South and GLSL-North Landscape Guide Regions (Figure 1) scheduled for approval on or after April 1, 2011 (standard).
1.4.3 Applying the Landscape Guide to phase II (second five year term) of forest management plans
There will be two types of forest management plans to be prepared for Phase II (second five year term) – those that had prepared 10-year plans with the Landscape Guide, and those that had not.
1.4.3.1 Forest management plans with phase I written without the Landscape Guide
Forest management plans written prior to implementation of the Landscape Guide are not required to update the Long Term Management Direction or the landscape indicators in FMP-13 based on the Landscape Guide (standard).
1.4.3.2 Forest management plans with phase I written with the Landscape Guide
Teams that did apply the Landscape Guide to develop 10-year FMPs will be planning operations for the second five-year term starting in 2014. During Phase I, Stage Three (Operational Planning), the spatial assessment of sustainability will be updated and documented in the final version of FMP-13. This includes landscape scale spatial assessments of the effects of planned operations for both the first five-year term and the second five-year term of the Forest Management Plan. A similar assessment is not done in Phase II planning. Rather, at this stage the assessment is done through the annual reporting process.
During Phase Two (second five year term) the Landscape Guide will be used two ways (guideline):
- The registered professional forester, who is normally the plan author, will determine whether the long-term direction remains valid for the second five-year-term. Part of this determination will consider biodiversity objectives that were developed with the Landscape Guide.
- The Landscape Guide pattern indicators (section 3.1.2) will be used to evaluate the ability of the management unit to meet the spatial objectives of the Forest Management Plan
2 Development of the Landscape Guide
As recognized in “Our Sustainable Future” (OMNR 2005), our understanding of the way the natural world works and how our actions affect it is often incomplete and we should exercise caution and special concern for natural values in the face of this uncertainty. The Landscape Guide deals with “caution and special concern” by applying principles of adaptive management (e.g. Holling 1978, Walters 1986, Baker 2000) and decision analysis (Howard 1966) (see Crawford et al. 2005 for a comparison of these concepts). The goal of adaptive management is to speed the process of learning by treating policies as hypotheses, and developing monitoring and research programs that directly test the effectiveness of the polices and guidelines. This interface between science and policy forms the foundation of Forest Management Guide development and testing. Adaptive management links science and policy to enable the development of policy through a cycle that facilitates continuous improvement to practices using a four-phase adaptive management cycle (Figure 2).
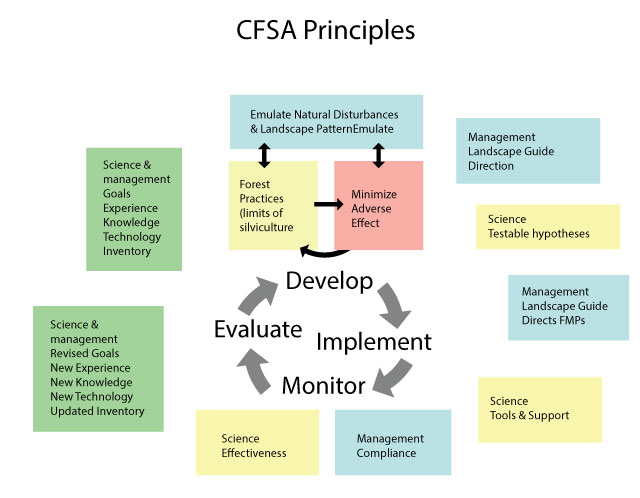
Figure 2. The adaptive management cycle that is proposed for development, implementation, monitoring and evaluating of the Landscape Guide. Green Boxes represent shared activities of management and science during develop and evaluate phases, whereas yellow and blue boxes represent parallel but separate activities of science and management (respectively) in the implement and evaluate phases. The development of the guide brought together science and management to combine goals, experience, knowledge, technology and inventory to develop an analytical framework from which landscape direction and testable hypotheses were developed (Adapted from Stankey et al. 2005.)
Jones and Nudds (2003) outlined a Decision Analysis and Adaptive Management (DAAM) process for policy development that provides additional detail on the “develop” phase of Figure 2. It is described below with links to the applicable sections of the Landscape Guide.
- Involve as many parties as possible. Section 2.1 lists the people involved in the development of the guide and the roles they played.
- Specify management objectives and options. Section 1 describes the management objectives of the Landscape Guide. Section 2.2 describes how a changing management approach of the Landscape Guide direction, based on emulation of natural disturbances and landscape patterns, is an alternative to the featured wildlife species approach of previous forest management guides.
- Identify the main uncertainties, as hypotheses and examine evidence for alternative hypotheses. Section 2.3 identifies how quantifying the adaptive cycles of naturally disturbed landscapes, including disturbance regimes, forest succession pathways and habitat function are the main uncertainties of the Landscape Guide. This section also describes how Simulated Ranges of Natural Variation (SRNV) were developed as a result of critical evaluation of various sources of information describing disturbance regimes, forest succession pathways, and habitat requirements conducted by the science team and consultation with MNR and non-MNR experts using analysis of current and pre- industrial forest conditions.
- The science and development team used regional workshops and informal review of these inputs in order to evaluate and rank competing hypotheses by likelihood in light of uncertainty. The outcome of this review was used to refine the SRNV or select alternative hypotheses to use for management options (e.g. pre-industrial conditions).
- Develop models to forecast outcomes, given different hypotheses. The science team created strategic forest management model (SFMM and Patchworks) simulations in order to forecast outcomes of alternative ways to move or maintain the landscape within the SRNV. The development and science teams used these models to assess combinations of potential standards and guidelines as alternative ways to emulate natural landscape patterns.
- Evaluate alternative management options. The Landscape Guide Development Team evaluated options based on literature and modeling results. For example, in the technical report “Forest Policy Scenario Analysis: Evaluating the Effectiveness of Coarse-Filter Policy Options on Conserving Forest Songbird Communities” a quantitative ranking was given to each alternative set of forest management policy options. The options were evaluated in terms of how close the songbird community responded to forests arising from various option-sets (scenarios) relative to the simulated natural forest. This ranking provided input into the overall decision making process specifically the development of Landscape Guide indicators. Section 2.4 describes the process of developing milestones, which were the result of an evaluation of alternative management options of following Landscape Guide direction. This process compared alternative management options to move towards or maintain the landscape within the SRNV. This section also discusses pilot testing of the Landscape Guide which contributed to the development of Landscape Guide direction.
- Select management options. Section 3 of the Landscape Guide contains the direction (standards, guidelines and best management practices) for forest management planners to follow.
- Select the highest uncertainties in the Landscape Guide direction. Section 4.1 of the Landscape Guide identifies some of the highest uncertainties related to the Landscape Guide direction.
The remaining DAAM steps are addressed in detail in Effectiveness Monitoring of Forest Management Guides: Strategic Direction (2009) and will inform future review of the Landscape Guide discussed in section 4.3.
- Design and implement a hypothesis-based monitoring program to evaluate effectiveness of policy options (i.e. the Landscape guide direction), according to sound principles of experimental design.
- Monitor key responses.
- Update ranking of alternative hypotheses by likelihood to achieve desired outcomes given monitoring results.
2.1 People involved
One of the first steps in the development of the Landscape Guide was to provide non- exclusive participation in the process through a variety of ad-hoc groups at provincial and local levels. These groups, described below, helped to iteratively refine the problem statement and analyze the management direction that is required and appropriate to help meet the objective of the guide (Lee 1993).
2.1.1 Development team
A multi-disciplinary team provided OMNR with advice and guidance on how to develop the Landscape Guide. They ensured that the guide took a holistic approach to the management of forested landscapes, built upon past forest management experience and filled gaps in direction. In addition to their technical and professional experience, development team members were affiliated with the Ontario Forest Industries Association, Canadian Parks and Wilderness Society - Wildlands League, and Ontario Federation of Anglers and Hunters and sought ideas from members of these organizations as the Landscape Guide was developed.
2.1.2 Science team
A comprehensive science team made up of natural resource science and management experts was formed to support the development team in predicting and evaluating the effectiveness and effects of possible forest management guide direction. The science team created an analytical framework that allowed the development team to take an adaptive management approach to guide development. In addition, they provided results of applicable scientific research, the results of relevant and appropriate monitoring programs, advantages and disadvantages of changes to current forest management practices, advances in analytical and operational technology, and extensive landscape-level scenario analyses. Additional discussions occurred with science advisors from Canadian Forestry Service, Canadian Wildlife Service, various universities, and natural resource agencies in other provinces.
2.1.3 Provincial Forest Technical Committee
The Provincial Forest Technical Committee (PFTC) is a group that advises the Assistant Deputy Minister, Forests Division about how to ensure that forest management guides are kept current with respect to scientific knowledge and management practices by acting as a review board for these guides. The PFTC received regular reports on the Landscape Guide development process and were provided with opportunities to participate in various aspects of the development process. PFTC advice on the development of the Landscape Guide was incorporated throughout guide development.
2.1.4 Practitioner experience
Development team members sought advice from forestry and biology practitioners’ experience in forest management planning by field visits, discussing related management costs, operational realities, experience with previous management guides and input to forest management simulation modelling (section 2.4). These discussions were invaluable in ensuring efficiency in the development of the Landscape Guide.
2.1.5 Forest management planners
Workshops were held through 2007 and 2008 in both the GLSL North and GLSL South Landscape Guide Regions. Foresters and biologists who had local knowledge of the landscape and experience in forest management planning provided input to landscape simulation model inputs and development of forest management simulation modelling.
2.1.6 Public engagement
The public was engaged in the development process through discussions in which ideas were exchanged to improve the content and direction of the Landscape Guide including:
- Presentations to all three Regional Advisory Committees
- Presentations to some Local Citizens Committees
- Multiple presentations to forest industry groups, environmental organizations (e.g. Wildlands League, Forest Ethics, Greenpeace, Ecojustice, Earthroots, Wildlife Conservation Society), local trappers councils, local field naturalists
2.2 A changing management approach
Section 1 describes the objective of the Landscape Guide. The review and revision of previous forest management guides that led to the development of this guide provided an opportunity to compare two forest management options for biodiversity conservation: 1) the featured wildlife species approach, which was in use prior to the Landscape Guide; and, 2) the coarse and fine filter approach to management in which emulating natural disturbances and landscape patterns is the coarse filter and specific habitat provisions, like those found in featured wildlife species approach are provided, if necessary, as fine filters. This section describes the featured wildlife species approach used in previous forest management guides and the coarse and fine filter approach, followed by a comparison of the two.
2.2.1 Featured wildlife species approach
The featured wildlife species approach to managing wildlife habitat is based on the assumption that managing habitat for a selected species will accommodate the habitat needs of most wildlife species. This approach to wildlife habitat management was adopted by Ontario and used for a number of years (OMNR 1990). The following sections describe the landscape-level habitat management direction for those species of wildlife which had been identified as featured species (featured species which did not have landscape-level habitat management direction are not discussed).
2.2.1.1 Timber management guidelines for the provision of moose habitat
Moose are a socially and economically important resource whose populations and habitat are protected and enhanced to provide opportunities for recreation and continuous social and economic benefit for the people of Ontario. Ontario developed moose management strategies to meet the goals established for the moose management policy (OMNR 1980, currently under review) including harvest control, population management, enforcement, inventory and assessment, research, allocation, hunter education and habitat management. The habitat management strategy of the moose policy addressed landscape-scale forest management by directing wildlife managers to work closely with forest managers to produce moose habitat which approximates the habitat created by a relatively large forest fire of medium intensity. The Timber Management Guidelines for the Provision of Moose Habitat directed the production of relatively small (80-130 ha), irregular shaped cuts, scattered shelter patches and a high diversity of age class and tree species stands.
Moose habitat is characterized at the landscape scale by the availability of browse, cover, and special habitats. Browse and cover can be provided through application of the Landscape Guide composition, structure and pattern direction (e.g. Rempel et al. 1997), direction for the provision of special habitats can be found in the Stand and Site Guide. Moose can use heterogeneous landscapes of young forest that produce browse mixed with relatively small patches of older conifers or other habitat types as cover habitat. If there are few or no suitable patches of cover habitat interspersed in mostly feeding habitat, moose may need to move considerable distances to find cover. The ability of moose to move between cover and feeding habitats depends upon a number of factors, such as time of year, weather, snow characteristics, the quality and quantity of cover and forage, etc. (Hundertmark 1998, Renecker and Schwartz 1998). Moose are animals that benefit from forest edges, particularly edges that provide food (browse) in close proximity to cover. Thus, the suitability of a patch as winter feeding or cover habitat – or both -will depend strongly on the ratio of young forest to residual, mature conifer. Highly interspersed areas provide a greater likelihood of the area functioning as feeding habitat, whereas low interspersion mature areas will more likely be moose cover habitat.
2.2.1.2 Forest management guidelines for the provision of white-tailed deer habitat
The Forest Management Guidelines for the Provision of White-tailed Deer Habitat (OMNR 1997) suggested that maintenance or creation of particular landscape characteristics important to deer (percent of forest types and age classes, forest patch size and distribution, etc) will increase the likelihood that all the biological diversity associated with the landscape will be perpetuated (Voigt et al. 1992). Specifically, 10-15% of the landscape should be in forage and thermal cover that is arranged together in winter concentration areas known as deer yards. Where they exist, deer yards are used during the winter, and the major cover is provided by conifer species. Although the value of different conifer species varies because of their crown shapes and leaf characteristics, the key indicator is crown closure. Coniferous trees enhance winter habitat by intercepting snowfall which allows deer to conserve energy and retain mobility and access to food supplies (Mattfeld 1974, Hanley and Rose 1987). The three most important features of a successful deer yard are traditional use, cover, and browse (OMNR 1997).
FMP application
OMNR (1998) procedures to identify active deer yards will be used in application of the Landscape and Stand and Site Guide (standard).
2.2.1.3 Forest management guide for the provision of marten habitat
The Forest Management Guide for the Provision of Marten Habitat (OMNR 1996a) was written in response to the 1994 EA decision to include featured wildlife species that have mature forest habitat requirements. Landscape level direction in the marten guide was intended to provide habitat for martens, and, in so doing, to influence the supply and arrangement of mature and older conifer-dominated forest across the boreal landscape.
The main landscape level direction of the marten guide was to maintain 10 - 20 percent of the forest, which has the capability to produce marten, in suitable conditions. Suitable conditions were directed in the guide as mature forests with greater than 40 percent spruce, fir or cedar arranged in large patches of 3000 to 5000 ha. Fryxell et al. (2008) found that marten habitat could be more generally expressed as mature forest older than 50 years with greater than 30 percent of all conifer species. Recent research (Naylor et al. 2005) found no difference in marten harvest by trappers between areas that had large patches (≥3000 ha) of habitat and those in which habitat patches were smaller. However, patches of habitat at least the size of home ranges (≥ 500 ha) may be necessary. The results of this research were used to develop the Landscape Guide indicators for structure, composition and pattern.
2.2.1.4 Forest management guide for the provision of pileated woodpecker habitat
Landscape level direction in the Forest Management Guide for the Provision of Pileated Woodpecker Habitat (OMNR 1996b) was intended to provide habitat for pileated woodpeckers, and, in so doing, to influence the supply and arrangement of upland mature and older forest across the GLSL landscape. Research suggests that a coarse filter emulation of natural disturbance supplies the composition and patch size required for pileated woodpecker habitat (Bush 1999).
2.2.1.5 Species at risk
A species at risk is any native plant or animal that is at risk of extinction or of disappearing from the province. The Stand and Site Guide provides conservation direction for forest-dwelling species at risk in the GLSL landscape.
2.2.2 The coarse and fine filter management approach
There are hundreds of species of vertebrates in the boreal and Great-Lakes-st. Lawrence (GLSL) forest regions of Ontario (see D’Eon and Watt 1994, Bellhouse and Naylor 1997) and invertebrate species are likely to number in the tens of thousands. Thus, a species-by-species approach to the provision of wildlife habitat and the conservation of biodiversity is impossible. However, this might be achieved through the hierarchical application of standards and guides that are judiciously selected to act as coarse and fine filters.
The concept of coarse and fine filters was popularized by Hunter (1990) and is illustrated in Figure 3. To manage Ontario’s forests to reflect society’s ecological, social and economic expectations, Ontario has, over the last ten years, begun to rely on a nested coarse and fine filter approach to meet wildlife habitat needs and provide healthy forests. This forest management guide builds upon this approach. The coarse filter component creates a diversity of ecosystem conditions through space and time, in turn providing habitat for the majority of native species. A series of fine filters is then used, if necessary, to modify the results of applying the coarse filter. A fine filter may be required for one of two reasons: 1) the societal and/or economic aspects of sustainable development require more or less habitat than would be provided by nature, or 2) the ecological requirements of a particular species or value are not addressed or accommodated sufficiently through application of only the coarse filter, in some cases because the proposed actions cannot completely mimic natural events. The extent to which the first type of fine filter is applied will vary across the province, depending on local forest conditions and societal expectations. Both the coarse and fine filters can be applied at all scales, from the landscape to the site.
In designing a coarse filter, one must determine the most desirable mix of ecosystem conditions to include. One of the principles of the CFSA provides direction on what to consider as the coarse filter (i.e. a mix based on nature), as well as what fine filters to develop.
The long term health and vigour of Crown forests should be provided for by using forest practices that, within the limits of silvicultural requirements, emulate natural disturbances and landscape patterns [coarse filter] while minimizing adverse effects on plant life, animal life, water, soil, air and social and economic values, including recreational values and heritage values [fine filters]. (CFSA s. 2(3)2)
In Ontario, the emulation of natural disturbances and landscape patterns is used as the basis of the coarse filter. The many values that a forest provides, as identified in this principle (e.g. plant life, animal life, water, soil, etc.), are the topics of the series of fine filters.
The predominant natural disturbance in Ontario’s boreal forest is wildfire, while a combination of fire, wind, and insect outbreaks play a role in the development of the Great Lakes–St. Lawrence forest region. In the Landscape Guide, Ontario’s forest landscape is designed through application of the coarse filter by addressing three key prescriptive indicators: pattern, composition and structure. At this scale only a few fine filters are applied to provide for or evaluate the landscape scale habitat requirements of one or more of caribou, white-tailed deer, moose, marten, and pileated woodpecker.
The coarse and fine filter approach to wildlife habitat management has existed for some time and has gradually been introduced and at least partially implemented in most parts of Ontario. It is, however, quite different from the featured species approach used extensively in the past and will take some time before forest planners and operators are familiar with it and understand it fully.
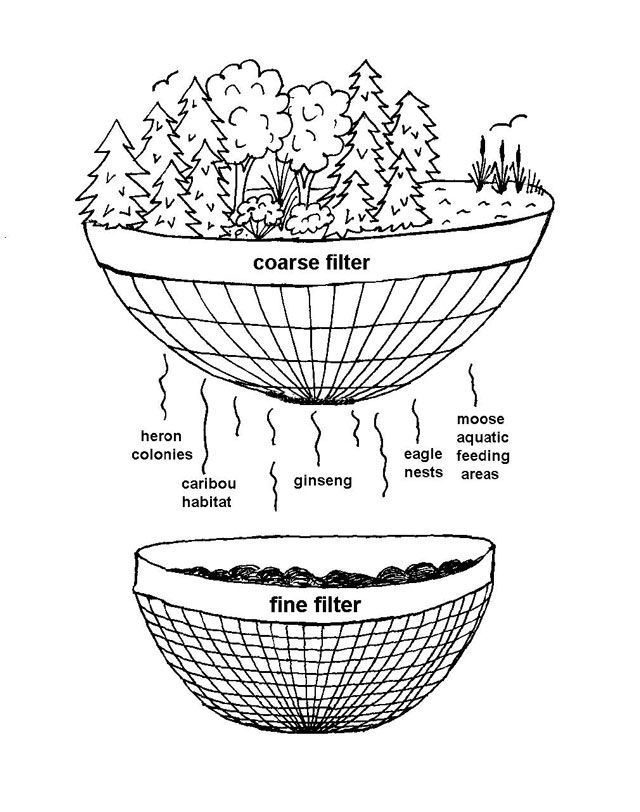
Figure 3. A conceptual model showing the relationship between coarse and fine filters in habitat management. A coarse filter operates at a variety of spatial scales to: provide habitat for a very broad range of wildlife, to support interactions among wildlife species, and to facilitate ecosystem processes. A fine filter may be required for wildlife species whose needs are not captured by the coarse filter (for example, heron nests and moose aquatic feeding areas). Biodiversity is most likely to be conserved by hierarchical application of both filters on the landscape (figure courtesy of Kandyd Szuba).
2.2.3 Comparison of featured wildlife species guidelines to coarse filter direction
Previous forest management guides directed management to provide habitat for featured wildlife species. Landscape composition, structure and pattern direction addresses habitat for a range of wildlife – including those wildlife species featured in previous habitat management guides. A coarse filter that emulates natural disturbances and landscape patterns should provide an adequate amount of habitat in general across the landscape. This includes landscape-level featured wildlife species habitat needs, such as interspersed age classes of conifer and mixed forest for moose and deer, or larger patches of mature conifer dominated or mixedwood forest for marten and pileated woodpecker.
Table 1 relates direction in previous featured wildlife species guides to comparable coarse filter direction that forms the basis of the replacement landscape direction (section 3). For example, the 500 ha home range for marten is similar to the 500 ha scale of measure for the texture of the mature and old forest indicator used in the Landscape Guide. These results suggest provision of marten habitat through the use of a coarse filter that emulates the landscape patterns, specifically the amount and distribution of mature forest that would have resulted from natural disturbances. These results have also been incorporated into a new habitat model for marten (see Science and Information Package A for details). All of the wildlife species discussed below have spatial habitat models included in OLT.
Table 1. Comparison of habitat direction featured in wildlife species guidelines with comparable coarse filter direction
| Previous Management Guidelines: Name | Previous Management Guidelines: Landscape Level Directions | Comparable coarse filter direction |
|---|---|---|
| Timber Management Guidelines for the Provision of Moose Habitat (OMNR 1988) |
|
|
| Forest Management Guidelines for the Provision of White-tailed Deer Habitat (OMNR 1997) |
|
|
| Forest Management Guide for the Provision of Marten Habitat (OMNR 1996a) |
|
|
| Forest Management Guide for the Provision of Pileated Woodpecker Habitat (OMNR 1996b) |
|
|
2.3 Understanding ranges of natural variation
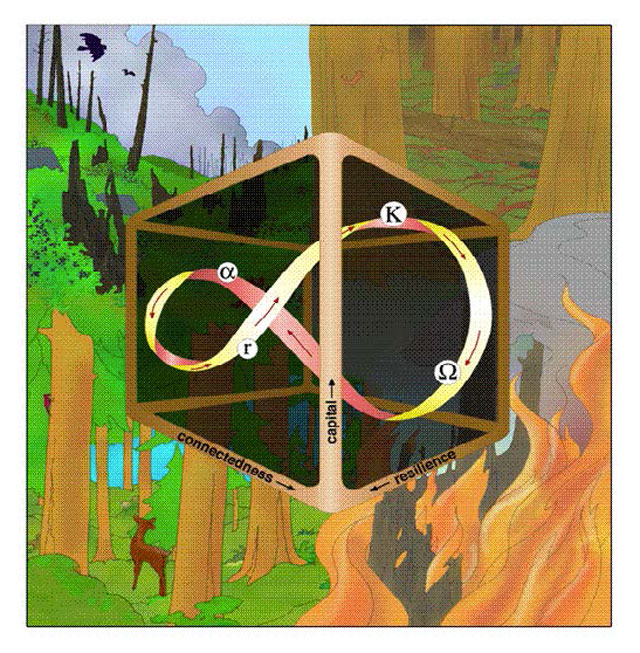
The relationship between biodiversity measured at the landscape scale and ecological processes that result in natural disturbance patterns has been described as an adaptive cycle (Gunderson and Holling 2001). One example of an adaptive cycle is the progress of a possible cycle for an ecological system in which stand-replacing fires are a disturbance agent (Figure 4). In this example, forested landscapes develop as a mixture of tree species which became established in a reorganization phase of the adaptive cycle and further develop along a trajectory during the growth, maturity and collapse phases. Perera et al. (2004) provide a thorough review of concepts and applications in emulating natural disturbance. Management strategies designed to conserve biodiversity must ensure that, at a landscape scale, future forest conditions contain all phases of the adaptive cycle in order to maintain the ecological processes that service all values. The Landscape Guide recognizes the importance of maintaining this dynamic by directing forest management to create and/or maintain the landscape mosaic created by and driving this adaptive cycle. Forest management seeks to emulate, not mimic, different phases of the adaptive cycle, primarily through the silvicultural intervention required to create future forest conditions. Our understanding and quantifying the adaptive cycles of naturally disturbed landscapes and how these landscapes provide ecological functions is the main uncertainties in the evaluating the effectiveness of the Landscape Guide. These uncertainties are addressed in more detail in section 4.1.
Quantitative estimates of the landscape structure, composition and pattern that might arise from natural disturbances and landscape patterns are required to provide Landscape Guide direction. There are at least three sources of information that can be used to make these estimates:
- The Pre-Industrial Condition (PIC) estimates what happened at a specific point or period in time. The Landscape Guide used PIC information from Ontario Lands Survey Notes (Pinto and Romaniuk 2002) to estimate landscape structure, composition and pattern across the Landscape Guide regions. The strength of this information source is that it estimates landscapes that we are certain existed. On the other hand, a PIC-based estimate only tells you about a single landscape that resulted from specific combinations of ecological, climate and disturbance events. Generally, PICs have less information about forest age.
- The current forest condition provides the most accurate estimate of landscape structure, composition and pattern. Forest Resource Inventory (FRI) maps were used by the Landscape Guide to produce these estimates. The Landscape Guide recognizes that the GLSL forest landscape has been managed for over 100 years and that these estimates of the current landscape condition provides a reference point that informs us more of the result of this management than a landscape that has been naturally disturbed.
- Landscape simulation models can be used to provide probability-based estimates about what might happen over a specific period in time. The Landscape Guide uses landscape disturbance and succession models to simulate the adaptive cycles of landscapes as they might occur without human intervention. The GLSL science team estimated a simulated range of natural variation (SRNV) for landscape composition and pattern using the Tool for Exploratory Landscape Simulation and Analysis (TELSA) (ESSA Technologies Ltd. 2005). A critical and iterative process of developing TELSA model inputs including forest disturbance and succession rules was carried out by the science team. The goal of this process was to simulate natural variation around natural reference condition that was similar to a pre-industrial condition (PIC). Iterations involved modifications by the science team and field practitioners to the TELSA model inputs. These inputs included landscape dynamics, (e.g. forest succession rules and disturbance sizes and cycles) landscape condition (e.g. forest cover and age) and model mechanics (e.g. how the TELSA simulated fire spread). Iterations continued until the PIC forest composition and amounts of disturbance was simulated by TELSA or could be reconciled by model limitations in representing natural processes (Figure 5). For more information and examples of these iterations, refer to Science Package A: Simulations, Rationale and Inputs (Elkie et al. 2007).
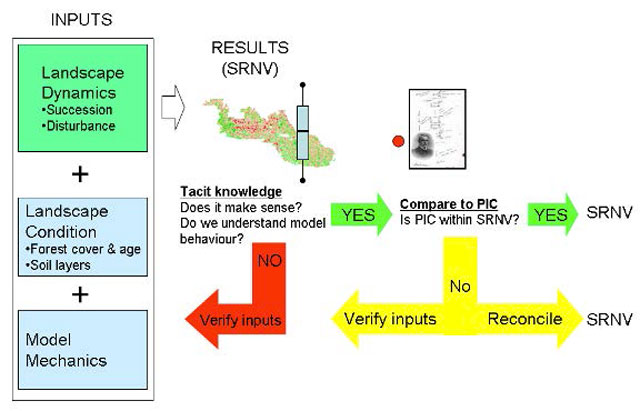
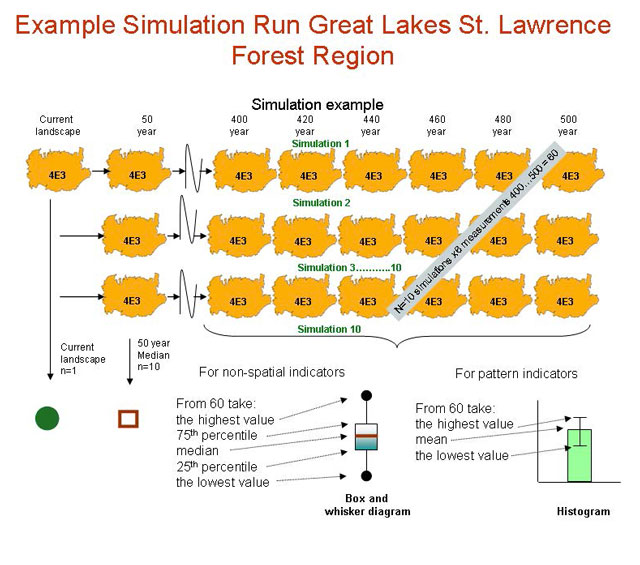
TELSA was calibrated at the ecoregion scale for ecological processes such as natural disturbance and succession but the model was run at eco-district scales due to tradeoffs between modelling scale and computer processing. TELSA was run for an initialization period in which natural disturbances and succession were simulated to “erase” the management footprint. After this initialization period, the SRNV was calculated by taking measurements of landscape indicator values at 20 year intervals. The resulting SRNV was expressed as a box and whisker plot for non-spatial indicators or as a histogram for spatial indicators (Figure 5). The SRNV was simulated using all of the land base at ecodistrict extents but were partitioned for crown land areas of forest management units to allow efficient integration into forest management planning. A draft SRNV was reviewed by practitioners in each Landscape Guide region and revisions were made based on this review.
There are two supporting documents that accompany the Landscape Guide, both of which are available through OLT:
- Science Package A: Simulations, Rationale and Inputs (herein called Science Package A): This document provides the rationale and methodology of simulation modelling that was used to simulate ranges of natural variation. It provides a detailed description of all models and inputs (e.g. disturbance regimes and succession pathways) (Elkie et al. 2009b)
- Science Package B: Results and Tools for Forest Management Planning (herein called Science Packages B): These documents include results and tools for Landscape Guide implementation in forest management planning. In addition, historical information from Ontario Land Surveys provides an estimate of the pre- industrial condition of the forest (PIC). There is a separate package B for each Landscape Guide region (i.e. GLSL North (Elkie et al. 2009c) and GLSL South (Elkie et al. 2009d)).
Multiple information sources were used during the development of estimates since it is unlikely that any single source of information will provide enough insight to estimate ranges of natural variation for all indicators. OLT provides complete descriptions of information sources including the SRNV, historical survey records (Pre-Industrial Condition), and, current ecological databases (e.g. FRI, remote sensing, growth and yield plots). Additional science and information can be used in application of the Landscape Guide with the approval of OMNR forest science and regional planning specialists (best management practice).
2.3.1 Climate change and the landscape guide
Climate change may impact biological diversity in many ways by changing patterns of insect and disease outbreaks, plant and animal distributions and natural disturbance events (OMNR 2005). Climate change projections for Ontario (Colombo 2007) allow policymakers in Ontario to envision the potential impacts of climate change on people, infrastructure and the environment. Recent ecological literature proposes policy-level strategies for climate change mitigation and adaptation (e.g. Chapin et al. 2006, Spittlehouse 2005). At a management unit level, sustainable forest management that maintains or increases forest carbon stocks and produces an annual sustained yield of timber, fibre, or energy from the forest, provides the largest sustained mitigation of climate change ((Ter-Mikaelian et al. 2008, IPCC 2007), while also providing many social and environmental benefits (IPCC 2007). The Landscape Guide directs sustainable forest management to manage a range of tree species mixes, ages, and patch sizes with an assumption of being resilient (i.e. having the capacity to adapt) to changes in temperature and precipitation. Following landscape direction to manage a forest’s age and tree species composition within a range of natural variation will maintain the above ground forest’s carbon balance within an expected range of natural variation (Colombo et al. 2005). In addition, the Landscape Guide must, by law, be reviewed every five years and revised when appropriate to reflect new knowledge and experience. As our understanding and predictions about climate change improve, policy options that more actively respond to climate change may be incorporated into future versions of the Landscape Guide to address its effects more directly.
2.4 Evaluating alternative management options
The science team created strategic forest management model (SFMM) simulations in order to forecast outcomes of the two management options: the featured wildlife species approach used in previous forest management guides and the coarse and fine filter approach of the Landscape Guide. Forecasting allowed different management scenarios to be generated for either management option. These alternative forecasts were evaluated against the SRNV, economic and social indicators. The economic indicator was medium and long term harvest volume by tree species group and silvicultural costs. Social, non-timber indicators were habitat for featured wildlife species and old growth. Explicit acceptable levels of tolerance for effects of management simulations on social and economic values were not generated in the development of this guide. Relative impacts, however, were assessed through Landscape Guide region workshops through the comparison of possible management scenarios. The development and science teams used these models to assess combinations of potential standards and guidelines as ways to meet selected management objectives of each option. The results of these analyses were presented to various groups in both Landscape Guide regions listed in section 2.1 and are available from Forest Policy Section, Ontario Ministry of Natural Resources.
2.4.1 Developing milestones
Through an iterative process of scenario development described above, a possible management trajectory towards or within Landscape Guide ranges was developed for each forest management unit. Milestones were developed to describe this trajectory for each management unit and for each Landscape Guide indicator. They include directional statements (e.g. maintain, increase or decrease) from the present condition over the short (0-10 years), medium (0-20 years) and long term (0-100 years). Planning teams will use these directional statements when developing specific targets for Landscape Guide indicators (see section 3.3). Milestones were developed with limited silvicultural, social and economic considerations to provide a time frame (short, medium or long term) in which biodiversity objectives can be met.
These general steps were followed in each Landscape Guide region to develop milestones:
- Draft SRNVs were presented at workshops attended by representatives of forest management planning teams.
- Revisions to landscape simulation model inputs were made based on input from workshop participants following the same decision-making process described in section 2.4 (e.g. changes to forest succession rules). A final SRNV was estimated and/or additional information added to PIC and incorporated into OLT.
- A range of management scenarios to maintain or move the landscape towards the SRNV was explored through an iterative process that did a rough screening of socio- economic and silvicultural considerations to select a scenario according to these development principles:
- Landscape guide direction, together with forest management planning, supports CFSA principles of sustainability.
- Consider current landscape conditions, silvicultural limitations, and effects on other values (for example, provincially featured wildlife species), not to take precedence over biodiversity conservation, but rather identified realistic management opportunities.
- Differences between the current condition of the landscape and the SRNV may be the result of management actions that occurred long before the era of forest sustainability (white pine logging in the late 1800’s) and/or may be the result of pests or pathogens (e.g. white pine blister rust).
- Milestones were presented directly to the Provincial Forest Technical and Regional Advisory Committees, and to the public through posting of the Landscape Guide on the Environmental Registry.
- Milestones, by management unit, for each Landscape Guide indicator can be found in the appendices of the Landscape Guide.
2.4.2 Pilot testing the Landscape Guide
Pilot testing was part of the development of the Landscape Guide. Pilot testing dealt with evaluating the efficiency of implementing the Landscape Guide, and identifying and correcting problems in draft direction. A pilot test in which actual application of the Landscape Guide to a forest management plan was not considered since this would have required preparation of a separate forest management plan. The Landscape Guide directs strategic forest management planning and so the development team sought the advice of experienced forest management planning professionals in the writing of the guide and development of direction. The development of milestones allowed for further refinement of guide direction and implementation steps through discussions with foresters and biologists. Pilot testing of the science and information products was conducted primarily by providing them to 2010 forest management planning teams for use as background information in the development of their forest management plans. In addition, OLT was subjected to two phases of beta-testing; within OMNR and with non-government forest managers.
3 Applying the Landscape Guide in a forest management plan
The following points summarize the application of the Landscape Guide in Phase I of a forest management plan:
- Measure the current forest condition using Landscape Guide (see section 3.1).
- Use the SRNV as the forest management plan desirable levels for Landscape Guide indicators (see section 3.2).
- Develop targets for the Landscape Guide indicators that are consistent with movement within or towards the SRNV (see section 3.3).
- Identify large landscape patches (LLPs) that are required to meet targets for landscape pattern indicators (see section 3.4).
3.1 Measure the condition of current forest landscape
The Landscape Guide indicators quantify landscape structure, composition and pattern as an efficient set of tools to direct management. The Landscape Guide indicators are variables that are used to describe the current landscape mosaic, make predictions on the future landscape mosaic and assist in evaluating the effectiveness of the Landscape Guide. Indicators were selected by compiling and categorizing previous landscape-level direction and then comparing them to simulations of forest management landscapes. For example, the science team assigned a quantitative ranking to each alternative set of forest management policy options. The options were evaluated in terms of how close the songbird community responded to forests arising from various option-sets (scenarios) relative to the simulated natural forest (Rempel et al. 2007). This ranking was used by the development team to select a parsimonious set of Landscape Guide indicators to direct the landscape composition, structure and pattern. The Landscape Guide indicators are listed in Table 2.
FMP application
Forest management plans will use the Landscape Guide indicators as the biodiversity indicators of objective achievement. The indicators required in FMPs can vary by Landscape Guide region as listed in the Landscape Guide Appendices (for example young forest indicators are only a landscape indicator for the GLSL South). Landscape guide indicators will replace previous forest management planning direction for landscape pattern, area by forest type and age and amount and distribution of old growth forest (standard).
The forest management planning team can use OLT to analyze and document their planning inventory to calculate plan start levels for all of the Landscape Guide indicators in table FMP-13
Planning teams can use Landscape Guide indicators in the order recommended in table 2 (best management practice). The order of this hierarchy is based on experience from the development of the Landscape Guide and recognizes that pattern is dependent on composition. For example it is difficult to arrange the texture of the mature and old forest if the amount does not exist on the landscape. Teams can follow this order through all subsequent application steps in this section.
Table 2. Landscape Guide Indicators arranged by CFSA category, Landscape Guide section heading, indicator name, recommended order of application and units of measurement. Refer to section 3.1 for specific details on Landscape Guide indicators
| CFSA Objective Category | Landscape Guide Indicator Group | Landscape Guide Indicator | Recommended order of application | Measurement (units) |
|---|---|---|---|---|
| Structure and Composition | Landscape classes (mature and older age classes) | Tolerant hardwood | 1st | Area (ha) |
| Structure and Composition | Landscape classes (mature and older age classes) | Intolerant hardwood | 1st | Area (ha) |
| Structure and Composition | Landscape classes (mature and older age classes) | White pine mixedwood | 1st | Area (ha) |
| Structure and Composition | Landscape classes (mature and older age classes) | Mixedwood | 1st | Area (ha) |
| Structure and Composition | Landscape classes (mature and older age classes) | Mixed pines | 1st | Area (ha) |
| Structure and Composition | Landscape classes (mature and older age classes) | Spruce-fir-cedar | 1st | Area (ha) |
| Structure and Composition | Old growth forest | Old growth by Forest Management Plan Forest Unit or appropriate grouping | 2nd | Area (ha) |
| Structure and Composition | Red and white pine forest | All ages red and white pine forest units | 4th | Area (ha) |
| Structure and Composition | Young forest | Pre-sapling development stage | 5th | Area (ha) |
| Structure and Composition | Young forest | Pre-sapling + Sapling & T- stage development stages combined | 5th | Area (ha) |
| Pattern | Texture of the mature and old forest | Texture of the mature and old forest | 3rd | 50 ha hexagon scale histogram |
| Pattern | Texture of the mature and old forest | Texture of the mature and old forest | 3rd | 500 ha hexagon scale histogram |
| Pattern | Young forest patch size | Young forest patch size | 6th | Patch size frequency histogram |
3.1.1 Structure and composition
The majority of landscapes for which this guide is applicable have remained continuously forested. However, forest harvesting, coupled with fire suppression have altered landscape structure and composition across Ontario compared to naturally disturbed landscapes (Aird 1985, Hearndon et al. 1992). Comparisons of historic with current forest conditions across the landscape show reductions and increases in some tree species due to forest harvest, land settlement, human caused fires and other activities. For example, in an analysis of land surveyors’ notes observed along a 278 km long transect through central Ontario, Jackson et al. (2000) found significant reductions from the mid 1800s to the present of yellow birch (Betula alleghaniensis Britt.), balsam fir (Abies balsamea (L.) Mill.), and eastern white cedar (Thuja occidentalis L.) and significant increases of poplar (Populus spp.) and white birch (Betula papyrifera Marsh.). In a comparison of historic survey notes and current forest inventory, Elkie (2005 in prep) found that boreal forests in northwestern Ontario currently contain more mixedwood forest than was found in the late 1800s. Pinto and Romaniuk (2002) also compared land surveyor notes in the Temagami region of Ontario and found a decrease in conifer dominated forest cover and an increase in intolerant and mid-to-tolerant hardwood forest. Thompson et al. (2006) found a reduction from the 1600s of up to 40% of the white pine in Algonquin Park attributable to logging in the 1800s, intense post-logging fires in the 1800s and to the past 60 years of fire suppression, which have eliminated seed sources and seedbeds. Comparing historic conditions of Algonquin Park to the present, Quinn (2004) found a loss of conifer, alteration in gap size structure, qualitative change in woody debris, a reduction in basal area and of “supersize” trees, and a reduction in early successional riparian (beaver) habitat. However, he emphasized that these changes are not fundamental; the forest ecosystem is substantively similar to the past.
The current forest age class structure and tree species composition of the landscape are two of the strongest drivers of the future forest landscape condition, and are likely to influence future forest condition as strongly as management activities. For example, according to the forest inventory, Ontario’s forests currently have a bimodal age-class distribution, with large amounts of young and old forest, and are increasing in age (OMNR 2002). The ecological literature discusses varying effects of fire suppression on the composition and age-class structure of the forest (e.g. Johnson et al. 2001, Podur et al. 2002). Carleton and MacLellan (1994) compared upland post- fire to upland post-logging stands and found that the logged stands were less likely to have returned to their original composition than if they had burned. Suffling et al. (1982) concluded that younger age classes represented a much higher proportion of the landscape prior to fire suppression in NW Ontario. Carleton (2000) provides a more detailed discussion of vegetation responses to the managed forest landscapes of central and northern Ontario.
The literature varies in its use of the terms “forest structure” and “composition”. For purposes of this guide, landscape structure indicators consider forest structure to be a combination of development stage (e.g. sapling, immature, mature) and canopy structure (even or uneven aged). Composition is measured at the landscape level by classifying forest stands into forest units and aged-based development stages. The forest units are based on a classification system that aggregates forest stands for management purposes, combining those that will normally have similar tree species composition, will develop in a similar manner (both naturally and in response to silvicultural treatments), and will be managed under the same silviculture system. The forest unit currency is the base unit used for simulations in each Landscape Guide region for all results (e.g. landscape classes, evaluative indicators etc). The forest units used were the OMNR regional standard forest units available at the time of running the simulations. The Landscape Guide structure and composition indicators are described in detail in the sections below.
FMP application
Planning teams will include all crown land within the forest management unit when measuring landscape structure and composition indicators (standard).
Table3. Forest units, development stages and landscape classes used in the GLSL Landscape Guide
Each forest unit has a name, description, ages of onset of development stages with a colour coding indicating the corresponding landscape class for the forest unit development stage. T-Stage refers to stands that have gone through some sort of disturbance in which part of the overstory crown has been removed consequently encouraging, through either natural or management disturbance, an understory.
| Forest Unit: Name | Forest Unit: Description | Development Stage age of onset: presapling 1 | Development Stage age of onset: sapling1 | Development Stage age of onset: immature 2 | Development Stage age of onset: mature | Development Stage age of onset: old growth | Development Stage age of onset: T-stage2 |
|---|---|---|---|---|---|---|---|
| HDSL1 | Hardwood selection north | 0 | 15 | 40 | 803 | 1403 | |
| HDSL2 | Hardwood selection south | 0 | 15 | 35 | 753 | 1403 | |
| HDUS | Hardwood shelterwood | 0 | 15 | 35 | 753 | 1303 | |
| BY | Yellow birch | 0 | 15 | 40 | 803 | 1403 | |
| Oak | Oak | 0 | 15 | 35 | 703 | 1203 | |
| PO | Poplar | 0 | 10 | 25 | 654 | 954 | |
| BW | White birch | 0 | 10 | 30 | 654 | 1004 | |
| PWST | White pine seed tree | 0 | 15 | 35 | 755 | 1205 | |
| PWUS4 | White pine 4 cut shelterwood | 0 | 15 | 35 | 755 | 1205 | |
| PWOR | White pine red oak | 0 | 15 | 35 | 805 | 1405 | |
| PWUSH | White pine hardwood shelterwood | 0 | 15 | 35 | 755 | 1205 | |
| HE | Hemlock | 0 | 15 | 45 | 856 | 1556 | |
| LWMW | Lowland mixedwood | 0 | 15 | 35 | 756 | 1206 | |
| MWD | Mixedwood dry | 0 | 10 | 30 | 656 | 1056 | |
| MWR | Mixedwood rich | 0 | 10 | 30 | 656 | 1056 | |
| MWUS | Mixedwood shelterwood | 0 | 15 | 35 | 756 | 1206 | |
| PWLISC | White pine conifer shelterwood | 0 | 15 | 35 | 757 | 1307 | |
| PR | Red pine | 0 | 15 | 40 | 807 | 1407 | |
| PJ1 | Ja:k pine | 0 | 10 | 25 | 607 | 1007 | |
| PJ2 | Ja:k pine conifer | 0 | 10 | 25 | 607 | 1007 | |
| SP1 | Urland spruce | 0 | 10 | 25 | 657 | 1107 | |
| SF | Spruce fir mixedwood | 0 | 15 | 30 | 708 | 1158 | |
| SB | Black spruce | 0 | 10 | 25 | 658 | 1108 | |
| LC | Lowland conifer | 0 | 15 | 30 | 708 | 1158 | |
| CE | Cedar | 0 | 15 | 35 | 758 | 1258 |
- Landscape Class: Presaplinq & Sapling Description: presaplinq, sapling and T-staqe developnent stages of all forest units ▲
- Landscape Class: Immature Description: imnature development stage of all forest units ▲
- Landscape Class: Tolerant Hardwoods Description: mature and old growth development stages of HDSL1, HDSL2, HDUS, BY and Oak ▲
- Landscape Class: Intolerant Hardwoods Description: mature and old growth development stages of PO and BW ▲
- Landscape Class: Mixedwood Description: mature and old growth development stages of HE, LWMW, MWD, MWR and MWUS ▲
- Landscape Class: White Pine Mixedwood Description: mature and old growth development stages of PWOR, PWUSH, PWUS4 and PWST ▲
- Landscape Class: Spruce-Fir-Cedar Description: mature and old growth development stages of SP1, SF, SB, LC and CE ▲
- Landscape Class: Spruce-Fir-Cedar Description: mature and old growth development stages of SP1, SF, SB, LC and CE ▲
3.1.1.1 Landscape classes
Background
Landscapes provide habitat for many wildlife species, each with its own preferences for combinations of vegetation types, development stages, patch sizes and configurations. As discussed earlier, it would be difficult to manage wildlife habitat on a species-by-species approach within the context of a forest management plan. To reduce the complexity of this problem, the landscape development team suggested the development of landscape classes according to our understanding of how forests function as habitat. They requested a classification scheme of between 5-10 classes for easy visual interpretation. The landscape classes are the fundamental coarse filter assessment units. Landscape classes are groupings of forest units by development stage. They were developed based on cluster analyses of used and preferred habitat types depicted in OMNR’s habitat matrices (e.g., Holloway et al. 2004). The habitat matrices summarize habitat affinities of selected vertebrate species based on forest type and development stage. The landscape classes express meaningful differences in wildlife use. The SRNV of the landscape class indicators is presented as a box and whisker graph, for example as shown in Figure 7. The SRNV for the landscape class indicators are provided for each forest management unit in Science and Information Package B.
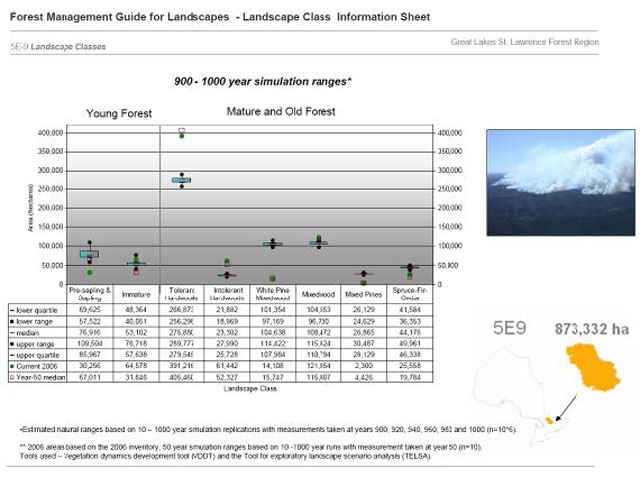
FMP application
Forest management plans will represent landscape classes in strategic forest management models (standard).
Planning teams will compare their plan forest units to the Landscape Guide forest units to ensure that there is compatibility at the landscape class level (guideline). Detailed FRI query description of forest units used in the development of Landscape Guide forest units are provided in science package A.
3.1.1.2 Old growth forest
Background
The Old Growth Policy for Ontario’s Crown Forests (OMNR 2003) describes how MNR will ensure that old growth conditions and values are present in Ontario’s Crown forests in order to conserve biological diversity at levels that maintain or restore ecological processes, while allowing for sustainable development now and in the future. This policy is compatible with the CFSA principal of emulating natural disturbance and landscape patterns, which the Landscape Guide treats as a hypothesis (see section 2.3). Ongoing discussion regarding the importance of old growth forests is muddied due to inconsistent use of the terms “old growth” and “mature” forest. For the purposes of this guide, a forest is in a mature stage of development when overstory trees attain full development and sexual maturity—mortality of over-storey trees begins to create gaps and encourages understorey development; and height growth slows dramatically. On the other hand, the old growth period is a condition of dynamic forest ecosystems that tends to include complex forest stand structure, relatively large dead standing trees (snags), accumulations of downed woody material, up-turned stumps, root and soil mounds, accelerating tree mortality, and ecosystem functions that may operate at different rates or intensities compared with earlier stages of forest development.
The SRNV for the old growth by Landscape Guide forest unit is expressed as a box and whisker graph, for example as shown in Figure 8. The SRNV for this indicator is provided by forest management unit in OLT and Science and Information Package B.
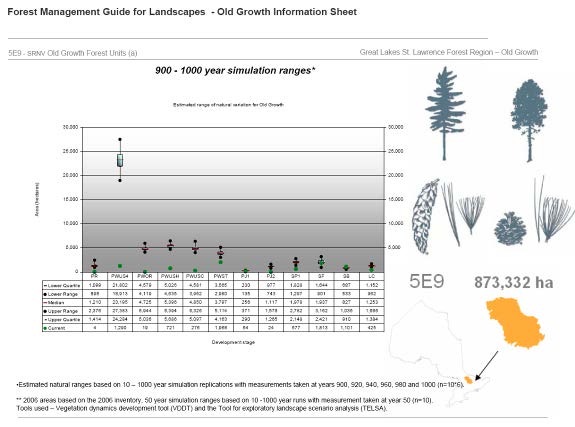
FMP application
Old growth will be defined using Old Growth Forest Definitions for Ontario (OMNR 2003). The old growth development stage of all plan forest units, or appropriate groupings of plan forest units as determined by the forest management planning team, will be represented in strategic forest management models. Planning teams will derive an old growth SRNV for plan forest units, or groupings, based on comparison with the Landscape Guide forest unit SRNV (guideline).
The arrangement of old growth is directed using the texture of the mature and old (which includes old growth) forest indicator (see section 3.1.2.1). Old growth as it functions as habitat for selected wildlife species will be evaluated as part of OMNR’s approach to effectiveness monitoring of the Landscape Guide (See section 4).
3.1.1.3 Red and white pine forest
Background
The all ages of red and white pine forest units indicator was selected by the science team based on differences between current landscape conditions, pre-industrial condition, and simulated ranges of natural variation. This indicator is used to direct the total amount of area in all development stages of red and white pine forest units on the landscape. This direction is consistent with Old Growth Policy for Ontario’s Crown Forests (OMNR 2003) which contributes to the maintenance of all ages of red and white pine and includes old growth stands, within their natural geographic ranges by maintaining no less than the 1995 amount while permitting a sustainable harvest of red and white pine now and in the future.
The SRNV for the all ages of red and white pine forest units indicator is expressed as a box and whisker graph similar to landscape classes. The SNRV for this indicator can be found in OLT and Science and Information Package B.
FMP application
Forest management plans will represent, in strategic forest management models, the total amount of area in all age classes of red and white pine forest units that correspond to the following Landscape Guide forest units for the GLSL: PWST, PWUS4, PWOR, PWUSH, PWUSC and PR. Planning teams will structure their plan forest units to ensure compatibility with this indicator (guideline).<
In addition, forest management teams will develop targets to ensure that this indicator does not drop below the 1995 amount (the total number of hectares) (guideline).
3.1.1.4 Young forest
Background
Young forest is the result of stand replacing disturbances and functions as habitat for a variety of wildlife (e.g. King et al. 2001, Costello et al. 2000). The indicator was selected by the science team based on differences between current landscape conditions, pre-industrial condition, and simulated ranges of natural variation (e.g. Figure 9). The SRNV for the young forest indicator is expressed as a box and whisker graph, for example as shown in Figure 9. The SRNV of the young forest indicators is provided by forest management unit in OLT and Science and Information Package B.
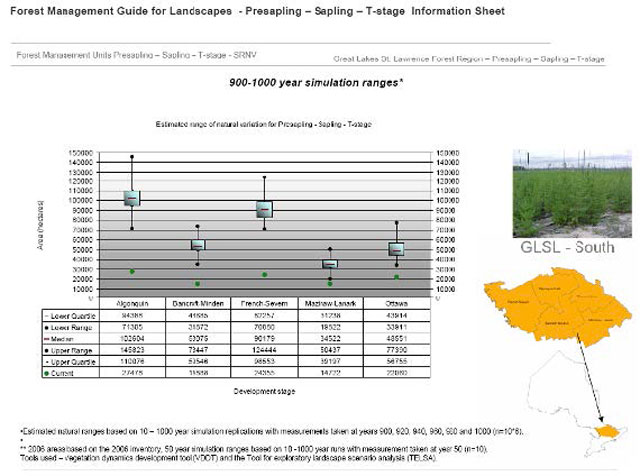
FMP application
Forest management plans will represent, in strategic forest management models, the amount of two types of young forest classes: i) the presapling development stage of all forest units combined and ii) the presapling, sapling and T-stage of all forest units combined (guideline).
3.1.2 Pattern
Background
Many important concepts in landscape ecology (e.g., fragmentation, edge effects, corridors and connectivity, metapopulation dynamics, reserve size) were developed where forests are not the dominant feature on the landscape (e.g., predominantly agricultural landscapes with islands
of residual forest; see Lindenmayer and Franklin 2002, Perera and Baldwin 2000). However, the landscapes where this guide will be applied are very different in that they provide continuous forest cover and the average rate of annual disturbance is less than one percent per year. Numerous studies identified differences in landscape patterns resulting from forest harvest when compared to fire disturbance. Results can vary depending on scale of measurement and spatial proximity rules for defining disturbances. For example, Gluck and Rempel (1996) found clearcut patches to be larger and more irregular in shape than natural disturbances, when comparing individual disturbances. However, Perera and Baldwin (2000) reported the opposite when comparing disturbances across Ontario. Differences of opinion exist about the importance of landscape pattern for biodiversity conservation. For example, there are many empirical and theoretical studies indicating that the primary importance of habitat is its amount rather than its spatial configuration, unless the total amount drops below a certain threshold (e.g., McGarigal and McComb 1995, Drolet et al. 1999, Drapeau et al. 2000, Fahrig 2003, Malcolm et al. 2004). Other studies suggest the importance of pattern in affecting habitat quality (e.g. Ferguson and Elkie 2004, Chapin et al. 1998).
The texture of the mature and old forest and young forest patch size are coarse filter indicators used to characterize landscape pattern in this guide. They are related in many ways: the amount and distribution of young forest patches can affect the texture of the mature and old forest in terms of wildlife habitat (interior loving wildlife species vs. edge loving species), and they are often the result of different forest management actions such as harvesting large or small contiguous areas. Connectivity means different things to different wildlife species and requires a wildlife species-specific assessment of movement across the landscape of interest (e.g. Goodwin 2002). Both of the Landscape Guide pattern indicators indirectly measure connectivity for a range of wildlife species.
FMP application
The crown land base of some forest management units may be fragmented by a high degree of private land ownership where forest condition information is not available and management intent is unknown. Across these units, areas of high ownership fragmentation may be delineated and exempt from application of landscape pattern indicators by forest management planning teams (guideline). The crown-land portion of these exempt areas will be considered for landscape structure and composition indicators. 3.1.2.1 Texture of the Mature and Old Forest.
Background
In landscape ecology terms, the dominant class, however defined, on the landscape is called the matrix. Non-matrix patches are quite easily measured and interpreted using traditional patch-measurement techniques (e.g. McGarrigal and Marks 1995). However, characterizing the pattern associated with the matrix has been identified as a challenge in landscape ecology (e.g. Fahrig 2003). The landscape matrix for most of Ontario’s forests is a mature forest. Visually, one can look at a landscape map and see areas in which mature and old forest is arranged in relatively high concentrations, areas with low concentrations and areas that have a relatively medium amount. The texture of the mature and old forest indicator characterizes this matrix by representing the proportions of the landscape in different concentration classes on a histogram – thus quantifying the texture as shown in Figure 10.
Two assessment levels for this indicator are used because it is possible that the texture measurement at one level, as expressed in a proportional frequency histogram, is exactly the same between two landscapes even though the same texture measurement at a finer or coarser level is significantly different. In other words, measuring landscape texture at two levels allows better characterization of the spatial configuration of the landscape than traditional landscape ecology measurements. The age of onset for mature and old forest is defined, by forest unit, in science package A. The texture of the mature and old forest is measured at two levels i) 500 hectares and 5000 hectares for the GLSL North Landscape Guide region
FMP application
Planning teams will use OLT to measure the texture of the mature and old forest indicator or a substitute tool that has received approval from OMNR (standard).
Texture of the mature and old forest will be measured at plan start year and year 10 of the forest management plan (standard).
3.1.2.2 Young forest patch size
Background
Patches deal with the extent of the homogeneous forest types that make up the landscape mosaic. Like edge, patches have also been the focus of review and analysis in the ecological literature (see Lindenmayer and Franklin 2002, Fahrig 2002). Patch sizes can influence the availability of specific contiguous habitat conditions, an overall landscape mosaic and the amount and distribution of edge (Lindenmayer et al. 2000). From a management perspective, experience with past forest management guides in Ontario demonstrated that use of specific patch sizes and shapes can have long-lasting consequences for forests that will require focused efforts over very long time periods to reverse. Thus, it is important to document the forests at these early stages of development to assist in the long term sustainable management of the entire forest.
The young forest patch size indicator uses a histogram to quantify the relative proportion (Y axis) of young forest patches by different patch size classes (X axis) (Figure 11). Similar to the mature and old forest matrix, young forest (i.e., forest less than 36 years) is measured using a texture technique. Fifteen hectare hexagons are overlaid on the landscape of interest. OLT reviews each hexagon and determines i) if it is forested (i.e., 50% or greater of the hexagon contains forest) and ii) the proportion of the forested area that is young. Each hexagon that has at least 50% of the forested area less than 36 years is classed as young. Young hexagons that are adjacent to each other are counted as the same patch. A frequency distribution of young forest patches is created in nine size classes (i.e., 1-100 ha, 101-250 ha, 251-500 ha, 501-1000 ha, 1001-2500 ha, 2501-5000 ha, 5001-10,000ha, 10,001-20,000 ha and > 20,000ha). Patches less than 16 hectares are not counted.
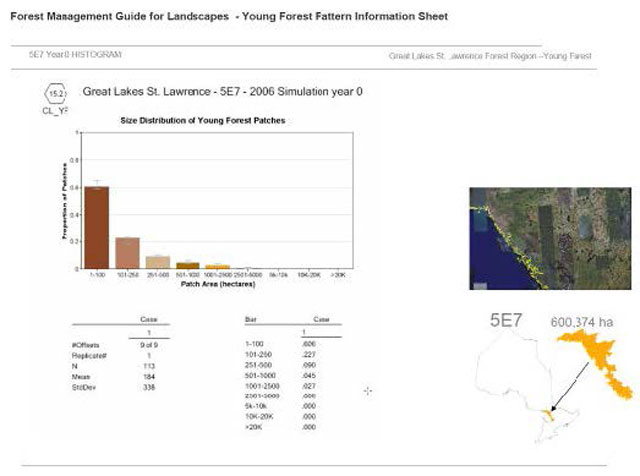
FMP application
Young forest patch size will be measured at plan start year and year 10 of the forest management plan (standard).
Young forest is defined as being less than 36 years of age (standard).
Planning teams will use OLT to measure this indicator or a substitute tool that has received approval from OMNR (standard).
3.2 Use SRNV as desirable levels in FMP
FMP application
The SRNV will be used as the desirable levels for the Landscape Guide indicators (guideline).
The intent of this guideline is to ensure that the desirable levels for biodiversity objectives in the FMP will represent a science-based estimate of landscape conditions and patterns. The SRNVs were modelled in TELSA to reflect a range of variation around natural conditions, although relatively more extreme conditions were not modelled. This means that the SRNV represents a suitable management range that excludes extremes in landscape condition that would occur infrequently in nature.
Forest management plans also have forest cover, socio-economic and silvicultural objectives; each has their own desirable levels and targets. The determination of sustainability, which will reflect implementation of this guideline, will determine whether, on balance, the ecological, socio-economic, and silvicultural objectives of the FMP are being achieved, and progress is being made towards the desired forest and benefits, consistent with the CFSA principles.
Documentation requirements for biodiversity objectives are outlined in the FMPM. Planning teams may compare (identify any major differences) indicator values between the plan start level, simulation year zero and the desirable level (SRNV). These values will assist planning teams in identifying reasonable rates of movement toward the SRNV. Discussion may include, but is not limited to: natural disturbances, silvicultural requirements, insect and/or disease issues, socio- economic effects and changes in forest resources inventories (best management practice).
3.3 Develop targets for biodiversity objectives
FMP application
Forest Management Planning Teams will develop targets for the Landscape Guide indicators that are consistent with Landscape Guide milestones over the short (e.g. 10 years), medium (e.g. 20 years) and long terms (e.g. 100 years)(guideline).
The intent of this guideline recognizes that targets are an outcome of the planning process for which milestones are a planning input. Milestone development considered limited silvicultural, social and economic values that may be better understood at local levels. The documentation requirements regarding targets for Landscape Guide indicators are outlined in the FMPM. Consistent with FMPM direction, application of this guideline within a forest management plan will consider a broader balancing of social, economic and environmental considerations. It is acceptable for some Landscape Guide indicators to have long-term targets outside the SRNV providing movement towards the desirable level.
For these objectives that have long-term targets established to encourage movement towards the desirable level, part of the management strategy documentation will discuss an estimate of when the desirable levels will be reached including associated management challenges (guideline).
Each Landscape Guide region has an appendix of this guide with milestones. Each forest management unit has a milestone table with directional statements for each of the Landscape Guide indicators.
3.4 Identify large landscape patches to meet targets
FMP application
Planning teams will identify any large landscape patches (LLPs) that may be required to meet targets created for Landscape Guide pattern indicators (e.g. texture of the mature and old forest matrix, young forest patch size), and allow for the efficient implementation of other guides (e.g. Stand and Site Guide) (guideline).
LLPs are areas that are used to meet biodiversity objectives and their targets associated with Landscape Guide indicators. A strategic landscape map is a way of identifying those parts of the landscape that are being used to meet spatially explicit biodiversity objectives and need to be represented in a strategic forest management model. In other words, the strategic landscape map informs the strategic management model about how the pattern indicators of the Landscape Guide will affect the Long Term Management Direction of the forest.
Ideally, when applying the coarse filter, biodiversity at the landscape level will be maintained and perhaps enhanced. Management of stand-level habitat features (e.g. cavity nests, snags, down woody debris, deer yards, moose aquatic feeding areas and calving areas) that may occur on the landscape is directed in the Forest Management Guide for Conserving Biodiversity at the Stand and Site Scales (the stand and site guide) (OMNR 2009). However, deer and moose may require special landscape consideration when non-forest management (i.e. population) objectives exist.
FMP application
When non-forest management (i.e. population) objectives exist moose, deer or other wildlife habitats will be evaluated using wildlife habitat models (available in OLT) to determine if application of the coarse filter direction of the Landscape Guide is making a positive contribution to these objectives. Identification, arrangement, and planning of deer yards or the arrangement of moose habitat on the landscape should be planned using a hierarchy of Landscape Guide analysis techniques. Firstly, the SRNV of the amount of habitat (when available) should be considered at the management unit level and the contribution of the habitat SRNV at the deer yard level or moose area level should be considered relative to that broader landscape. Secondly, the pattern within either large deer yards or moose areas should be planned i) in a manner that enhances habitat within the deer yard or moose area and ii) in a way that contributes to the broader landscape pattern objectives (guideline).
The Planning team should practice judicious use of LLPs by considering the landscape condition at the start of the planning term, past management, natural disturbances and the SRNV (guideline).
The following best management practices are provided to help teams develop strategic landscape maps:
- The size of an LLP relates to the Landscape Guide indicator of interest. For example, in addressing the texture of the mature and old forest measured at 5000 ha, an LLP should be at least 5000 ha, but could also be much larger.
- Planning teams can design the strategic landscape map starting with the largest, most difficult patches to locate, those that will have an influence on landscape pattern for the longest period of time and/or those LLPs that require special considerations.
- LLPs should only be identified if the planning team determines that spatially explicit management direction needs to be identified in the Long Term Management Direction. For example:
- Scoping analysis suggests the need for representation.
- In forests that will require a significant change in the texture of mature and old forest. LLPs that can be used to maintain high concentrations of mature forest to meet the 500 ha scale mature forest texture could be identified. LLPs are not required for the texture of the mature and old forest pattern indicator in forests where the current value of this indicator is close to the SRNV or there is a long management history of silviculture systems that maintain mature forest canopies.
- Areas that have a specific management intent that is identified through existing procedures (e.g. deer yards) can be indicated on the strategic landscape map to assist in application of the Stand and Site Guide (see this guide for identification of these LLPs).
- Teams can identify LLPs that have objectives for emphasizing moose or deer habitat using the standards and guidelines of Section 3.0 of the ‘Forest Management Guide for Conserving Biodiversity at the Stand and Site Scales’.
- It is assumed that the remaining areas not identified as LLPs will be comprised of harvest and retention decisions to complete the landscape mosaic. Not all areas of harvest or retention will be identified as, or incorporated into, the LLPs. These areas also contribute to meeting the overall landscape objectives for the unit.
Once the planning team determines the appropriate level of identification, each LLPrequires the following documentation (guideline):
- Where: Identification of the LLP using a system of numbering.
- What and Why: What targets are met by the LLP (indicate landscape indicators(s) or specific fine filter objective).
- When: When will these areas be managed (use 20 year periods). The strategic landscape map should identify prioritized management actions for spatially explicit indicators (i.e. pattern and habitat) over a length of time sufficient to demonstrate movement into and maintenance within desired ranges of variation.
- How (For LLPs within the 20 year planning period): Describe what management actions will be taken in the LLP including a description of anticipated silviculture. In cases where an LLP is managed to create specific fine filter conditions the stated DFFC must produce these conditions (e.g. a LLP managed for deer habitat must have a Desired Future Forest Condition that provides deer habitat). Describe how the LLP was taken into account in strategic modelling of proposed management strategy (e.g. available for harvest, deferred harvest, additional residual, specific silviculture, etc.).
- Roads (For LLPs within the 20 year planning period): Description of the expected length of time that planned or existing roads within the LLP will be required to carry out management actions. This documentation does not replace or direct road access planning; however, it can be used as input to the development of a roads strategy.
4 Monitoring, evaluating and reviewing the Landscape Guide
Monitoring, evaluating and reviewing the Landscape Guide will consider effectiveness, efficiency and effects. Effectiveness evaluates if the Landscape Guide is contributing to biodiversity conservation as intended relative to a natural reference condition. On the other hand, efficiency and effects look at the application of this guide on forest management planning in reference to previous forest management guides. More detailed information about effectiveness monitoring can be found in Effectiveness Monitoring of Forest Management Guides: Strategic Direction (Rempel et al. 2009)
4.1 Effectiveness: Evaluating the effectiveness of the Landscape Guide
The CFSA implicitly states that emulation of natural disturbance and landscape patterns is an effective approach to ensuring long-term health of forest ecosystems. This approach, however, is still a hypothesis, and the direction provided in the Landscape Guide is the implementation of this policy. In essence, the hypothesis predicts that by emulating the structure, composition and pattern of natural forest ecosystems through forest management, the natural patterns of biodiversity and ecological processes will be maintained in managed areas. Landscape Guide indicators were developed for structure, composition and pattern (section 3). Each element of guide direction results in expected outcomes that arise from the “emulation of natural disturbance hypothesis”. Some of these expected outcomes are more uncertain than others. The Effectiveness Monitoring of Forest Management Guides: Strategic Direction (Rempel et al. 2009) and its associated work plans translate key elements of guide direction into explicit hypotheses and predictions, and to identify those key predictions with the highest level of uncertainty that require effectiveness monitoring.
The CFSA requires determination of sustainability in terms of conservation of biodiversity and ecological processes. The response of the forest ecosystem to forest management and natural disturbance can be measured at the levels of population trends, community organization and functional properties. These three classes of response are used to organize a strategy to monitor the effectiveness of forest management direction given in the guides in terms of conserving both biodiversity and ecological processes (see section 4.1).
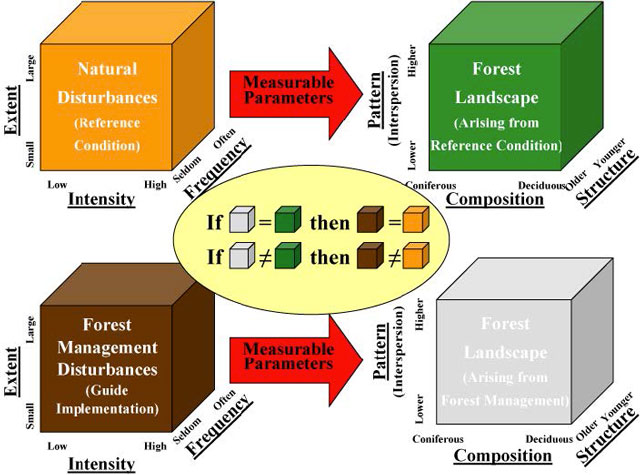
Evaluating the effectiveness of the Landscape Guide is based on the prediction that forest management will result in landscapes that are similar to those created from natural disturbance in terms of their community structure, population trends and ecological processes. This prediction will be evaluated by comparing forest landscapes represented by the grey box to those represented by the green box respectively (Figure 12). The community structure component of the effectiveness monitoring plan will require an evaluation of vegetation and wildlife communities between the managed (grey box) and reference (green box) landscapes. This comparison will be assessed by finding landscapes that are similar to both the managed (grey box) and reference (green box) landscapes and measuring Landscape Guide indicators and wildlife abundance. Following this evaluation, we could assess outcomes of forest management planning following Landscape Guide direction for structure, composition and pattern (described as milestones in section 2.4.1).
The Landscape Guide will take several years to implement across Ontario and changes in many Landscape Guide indicators will occur over the long term. Predicted changes in wildlife abundance (population trends) (based on the community structure evaluation) can be made by evaluating predicted landscape changes described as milestones in section 4 of the guide. For example, if we expect an increase in the amount of young jack pine in the GLSL North Landscape Guide region then we should expect to see an increase in the abundance and distribution of species that require young forest as habitat, such as the spruce grouse and hermit thrush. The population trends monitored at the Landscape Guide region level (Figure 1) can then be used to distinguish wildlife responses to factors related to Landscape Guide direction from other non-guide factors (e.g. winter habitat for migratory songbirds, insects, etc.). OMNR has a lead role in designing scientific studies to evaluate the effectiveness of forest management guides (EA condition 31) and monitoring wildlife populations to support guide effectiveness monitoring (EA condition 30). This component of the effectiveness monitoring plan integrates and expands existing monitoring programs housed at the Ontario Terrestrial Assessment Program (ONTAP).
The ecological processes component of the plan will require an evaluation of ecological processes between the managed (grey box) and reference (green box) landscapes. This component of the monitoring plan explicitly addresses the mandate to assess sustainability in terms of how well ecological processes are conserved and refers to a broad class of potential monitoring projects, and principally relates pattern to process through indicators. Some examples of projects currently underway include: evaluating regeneration success (maintaining primary production of conifer and deciduous trees), habitat-selection dynamics of moose (including response to enhanced habitat management to resemble large, medium intensity burns), habitat selection and predator-prey dynamics involving caribou, moose, and wolves, and predator-prey dynamics involving marten and small mammals.
4.2 Effects: Identifying effects on other values
Implementation of the Landscape Guide in forest management plans may have a positive, negative or neutral effect on other values relative to previous forest management guides. Such effects are part of the main uncertainties of Landscape Guide direction and will be considered by OMNR during the future review of the Landscape Guide. The following is a partial list of potential effects of Landscape Guide implementation that will be monitored as part of the guide effectiveness monitoring:
- Changes in forest access road density and/or distribution.
- Changes in available harvest area.
- Planning team effort required to learn and implement the Landscape Guide.
- Changes in wildlife habitat for wildlife species valued by stakeholders.
- Changes in wildlife habitat for wildlife species valued by stakeholders relative to distance from forest access road network.
- Changes in forest access road networks relative to water bodies.
4.3 Efficiency: Reviewing the Landscape Guide
OMNR will review the Landscape Guide no later than 2014 to evaluate if a revision is required. This review will consider, but not be limited to, revisions to the guide based on:
- Effectiveness of the Landscape Guide direction. What have we learned from the results of relevant and appropriate monitoring programs?
- Efficiency and Effects: What are the advantages and disadvantages of the Landscape Guide to previous forest management guides? Specifically this will consider the efficiency of the Landscape Guide along with effects on other values.
- New Science and Information: What applicable scientific research and advances in analytical and operational technology have occurred? For example, the first set of SRNV, developed for each Landscape Guide region, will be used for 10 year forest management plans commencing in 2011 and subsequent FMPs. Planned review of Landscape Guide ranges will start in 2012 in anticipation of the next set of 10 year forest management plans which will start planning in 2014 for April 2017 approval.
5 Literature cited
Aird, P. L. 1985. In Praise of Pine: The Eastern White Pine and Red Pine Timber Harvest from Ontario’s Crown Forest. Can. For. Serv., Petawawa National Forestry Institute, Report No. PI-X-52.
ArborVitae Environmental Services Ltd., CMC Ecological Consulting, and Callaghan and Associates Inc. 2000, Review of Forest Management Guides. Report Submitted to the Provincial Forest Technical Committee.
Baker, J. A. 2000. Adaptive Management at the Landscape Level. Pages 310-322 in A. H. Perera, D. L. Euler, and I. D. Thompson, editors. Ecology of a managed terrestrial landscape: patterns and processes of forest landscapes in Ontario. University of British Columbia Press, Vancouver, British Columbia, Canada.
Bellhouse, TJ and BJ Naylor. 1997. Habitat relationships of wildlife in central Ontario. OMNR, Southcentral Science and Technology, Technical Report No. 53. Queen’s Printer for Ontario.
Bunnell, P. 2003 The adaptive cycle in a forest: Resilience Alliance (3.1) URL: www.resalliance.org.
Bush, P.G. 1999. Influence of landscape-scale forest structure on the presence of pileated woodpeckers (Dryocopus pileatus) in central Ontario forests. MScF Thesis, Lakehead Univ. Thunder Bay. 87pp.
Carleton, T. J. 2000. Vegetation responses to the managed forest landscape of central and northern Ontario. Pages 179--197 in A. H. Perera, D. L. Euler, and I. D. Thompson, editors. Ecology of a managed terrestrial landscape: patterns and processes of forest landscapes in Ontario. University of British Columbia Press, Vancouver, British Columbia, Canada.
Carleton T.J. and P. MacLellan. 1994. Woody vegetation responses to fire versus clear-cut logging: a comparative survey in the central Canadian boreal forest. Ecoscience 1: 141-152.
Chapin, T.G., Harrison, D.J., and Katnik, D.D. 1998. Influence of landscape pattern on habitat use by American marten in an industrial forest. Conservation Biology. 12: 1327–1337.
Chapin, F.S.III, Lovecraft, Amy L., Zavaleta, Erika S., Nelson, Joanna, Kofinas, Gary P., Trainor, Sarah F., Huntington, Henry P., Robards, Martin, Naylor, Roamond L.. 2006. Policy Strategies to address sustainability of Alaskan boreal Forests in response to a directionally changing climate. Proceedings of the National Academy of Sciences of the U.S. Vol. 103 Issue 45, p 16637-16643.
Colombo, S.J., W.C. Parker, N. Luckai, Q. Dang, and T. Cai. 2005. The effects of forest management on carbon storage in Ontario’s forests. Ont. Min. Nat. Res., Appl. Res. Dev. Br., Sault Ste. Marie, ON. Climate Change Res. Rep. CCRR-03. 126 p.
Colombo, S.J., 2008. Ontario’s Forests and Forestry in a Changing Climate. Climate Change Research Report CCRR-12. Queen’s Printer for Ontario.
Costello, C.A., M. Yamasaki, P.J. Pekins, W.B. Leak, and C.D. Neefus. 2000. Songbird response to group selection harvests and clearcuts in a New Hampshire northern hardwood forest. Forest Ecology and Management 127:41-54.
Crawford, S., S. Matchett and K. Reid. 2005. Decision Analysis/Adaptive Management (DAAM) for Great Lakes fisheries: a general review and proposal. Draft discussion paper presented at IAGLR (International Association for Great Lakes Research) 2005 University of Michigan, Ann Arbor, Michigan USA. 54+pp.
D’Eon RG and WR Watt. A Forest Suitability Matrix for Northeastern Ontario. 1994. NEST Technical Manual TM-004. Queen’s Printer for Ontario.
Drapeau, P. et al. 2000. Landscape-scale disturbances and changes in bird communities of boreal mixed-wood forests. Ecological Monographs 70: 423–444.
Drolet, B., Desrociiers, A. and M.J. Fortin. 1999. Are songbirds affected by landscape structure in exploited boreal forest? Condor 101: 699-704.
Elkie 2005. A review of the original baseline and meridian surveys of Northwest Ontario. in prep
Elkie, P., A. Smiegielski, M. Gluck, J. Elliott, R. Rempel, R. Kushneriuk, B. Naylor, J. Bowman, B. Pond and Derek Hatfield. 2009a. Ontario’s Landscape Tool. Ontario Ministry of Natural Resources. Forest Policy Section. Sault Ste. Marie Ontario.
Elkie, P., M. Gluck, J. Boos, J. Bowman, C. Daniel, J. Elliott, D. Etheridge, D. Heaman, G. Hooper, R. Kushneriuk, G. Lucking, S. Mills, B. Naylor, F. Pinto, B. Pond, R. Rempel, K. Ride, A. Smiegielski, G. Watt, M. Woods. 2009b. Science and Information in support of the Forest Management Guide for Landscapes: Package “A” Simulations, Rationale and Inputs. Ontario Ministry of Natural Resources. Forest Policy Section.
ESSA Technologies Ltd. 2005. TELSA - Tool for Exploratory Landscape Scenario Analyses: User’s Guide Version 3.3. Prepared by ESSA Technologies Ltd., Vancouver, BC. 236 pp.
P. Elkie, M. Gluck, J. Boos, J. Bowman, C. Daniel, J. Elliott, D. Heaman, G. Hooper, R. Kushneriuk, G. Lucking, S. Mills, B. Naylor, F. Pinto, B. Pond, R. Rempel, K. Ride, A. Smiegielski, G. Watt, M. Woods. 2009c. Science and Information in support of the Forest Management Guide for Landscapes Package B – GLSL – North - Results and Tools for Target Setting and Forest Management Planning Ontario Ministry of Natural Resources, Forest Policy Section.
P. Elkie, M. Gluck, J. Boos, J. Bowman, C. Daniel, J. Elliott, D. Heaman, G. Hooper, R. Kushneriuk, G. Lucking, S. Mills, B. Naylor, F. Pinto, B. Pond, R. Rempel, K. Ride, A. Smiegielski, G. Watt, M. Woods. 2009d. Science and Information in support of the Forest Management Guide for Landscapes Package B – GLSL – South - Results and Tools for Target Setting and Forest Management Planning Ontario Ministry of Natural Resources, Forest Policy Section.
Fahrig, L. 2002. Effect of habitat fragmentation on the extinction threshold: a synthesis. Ecological Applications 12: 346-353.
Fahrig, L. 2003. Effects of habitat fragmentation on biodiversity. Annual Reviews of Ecology and Systematics 34: 487-515.
Ferguson. S.H and P.C. Elkie. 2004. Habitat requirements of boreal forest caribou during the travel seasons. Basic and Applied Ecology 5 (2004) 465-474.
Franklin, J. F., 1993. Preserving biodiversity: species, ecosystems or landscapes. Ecological 1 Applications, 3, 202-205.
Fryxell J.M., I. Thompson and J Baker 2008. Population Ecology of Marten (Martes Americana) In the Boreal Forests of Northern Ontario. Final report for NSERC, Forest Ecosystem Research Cooperative Inc, Canadian Forest Service, and Ontario Ministry of Natural Resources.
Gluck, M.J. and R.S. Rempel. 1996. Structural characteristics of post-wildfire and clear-cut landscapes. Environmental Assessment and Monitoring. 39:435-450.
Goodwin, B. 2003. Is landscape connectivity a dependent or independent measure? Landscape Ecology 18 (7) 687 - 699.
Gunderson, L.H. and C. S. Holling, eds. 2002 Panarchy: Understanding Transformations in Human and Natural Systems. Island Press. 507 pp.
Hanley, T.A., and C.L. Rose. 1987. Influence of overstory on snow depth and density in hemlock-spruce stands: implications for deer management in southeastern Alaska. USDA For. Serv., PNW-RN-459. 11 p.
Hearnden, K.W., S.V. Millson, and W.C. Wilson. 1992. A Report on the status of Forest Regeneration. Ont. Min. Natur. Resourc. Independent Forest Audit Committee. Queen’s Printer for Ontario. Toronto, ON. 117 pp.
Holling, C.S. 1978 Adaptive Environmental Assessment and Management. John Wiley & Sons, Chichester.
Holloway, G., B. Naylor, and W. Watt, Editors. 2004. Habitat Relationships of wildlife in Ontario – revised habitat suitability models for the Great Lakes-St. Lawrence and Boreal East Forests. OMNR, Science and Information branch, Southern Science and Information and Northeast Science and Information. Joint Technical Report No. 1. Queen’s Printer for Ontario. 120 pp.
Howard, R.A. 1966. Decision analysis: applied decision theory. pp. 55-71. In: D.B. Hertz & J. Melese (ed..) Proceedings of the Fourth International Conference on Operational Research, Wiley-Interscience.
Hundertmark, K.J. 1998. Home range, dispersal and migration. In Ecology and management of the NorthAmerican moose. Franzmann, A.W. and C.C. Schwartz, Eds. Smithsonian Inst. Press. Wash. and London. pp. 303-335.
Hunter, ML 1990. Wildlife, forests, and forestry: principles of managing forests for biological diversity. Prentice Hall, Inc. Englewood Cliffs, NJ 370 pp.
IPCC. 2007. Climate Change 2007: Mitigation. Contribution of Working Group III to the Fourth Assessment Report of the Intergovernmental Panel on Climate Change [B. Metz, O.R. Davidson, P.R. Bosch, R. Dave, L.A. Meyer (eds)], Cambridge University Press, Cambridge, United Kingdom and New York, NY. 851 p.
Jackson, S. M., F. Pinto, J. R. Malcolm, and E. R. Wilson. 2000. A comparison of pre-settlement (1857) and current (1981-1995) forest composition in central Ontario. Canadian Journal of Forest Research 30:605-612.
Johnson, E.A, K. Miyanishi, and S.R.J. Bridge. 2001. Wildfire regime in the boreal forest and the idea of suppression and fuel buildup. Conservation Biology 15(6): 1554-1557.
Jones, M. & T. Nudds. 2003. Draft principles of Decision Analysis and Adaptive Management, Prepared for the Saugeen Ojibway/Canada/Ontario Plenary. 14 February 2003. 1 pp.
Karr, James R. 1991. “Biological integrity: A long-neglected aspect of water resource management.” Ecological Applications 1:66–84.
Karr, James R. (1996). “Ecological Integrity and Ecological Health Are Not the Same.” In Engineering Within Ecological Constraints, ed.. Peter C. Schulze. Washington, DC: National Academy Press
King, D.I., R.M. DeGraaf, C.R. Griffin. 2001. Productivity of early successional shrubland birds in clearcuts and groupcuts in an eastern deciduous forest. Journal of Wildlife Management 65:345-350.
Lee K.N. 1993. Compass and Gyroscope. Island Press.
Lindenmayer, D.B., Margules, C.R., Botkin, D.B. 2000. Indicators of biodiversity for ecologically sustainable forest management. Conservation Biology 14 (4): 941-950.
Lindenmayer, D.B. and J.F.Franklin, 2002. Conserving Forest Biodiversity: A Comprehensive Multiscaled Approach. Island Press. 352 pp.
Malcolm, J.R, B.D. Campbell, B.G. Kuttner, and A. Sugar 2004. Potential indicators of the impacts of forest management on wildlife habitat in northeastern Ontario: A multivariate application of wildlife habitat suitability matrices Forestry Chronicle 80:91-106.
Mattfeld, G.F. 1974. The energetics of winter foraging by white-tailed deer. A perspective on winter deer concentration. State University of New York, Ph. D. Thesis. 306 p.
McCann, K.S. 2007. Protecting Biostructure. Nature. Vol. 466: 29-30.
McGarigal K, and B.J. Marks 1995. fragstats: spatial pattern analysis program for quantifying landscape structure. Program documentation. Gen Tech Rep US Dep Agric For Serv Pac Northwest Res Stn 351, Portland.
McGarigal, K. and W.C. McComb. 1995. Relationships between landscape structure and breeding birds in the Oregon Coast Range. Ecological Monographs 65:3 pp. 235-260 Naylor, B.J. 1998a. Integrating timber and wildlife habitat management. Section 8.0 In: OMNR, 1998. A silvicultural guide for the Great Lakes-St. Lawrence conifer forest in Ontario. Version 1.1. OMNR, Queen’s Printer for Ontario, Toronto.
Naylor, B., S. Mills, and L. Landriault. 2005. Evaluating the importance of marten cores to trapper harvests: final report for phase I. Forest Ecosystem Science Co-operative Technical Report.
OMNR 1980. Moose Management Policy. Queen’s Printer for Ontario.
OMNR 1988. Timber Management Guidelines for the Provision of Moose Habitat. Queen’s Printer for Ontario.
OMNR 1990. Featured Species Policy. Wildlife Branch Policy No. 6.04.01.
OMNR 1996a. Forest Management Guidelines for the Provision of Marten Habitat. Queen’s Printer for Ontario. 30 p.
OMNR 1996b. Forest Management Guide for the Provision of Pileated Woodpecker Habitat. Queen’s Printer for Ontario.
OMNR 1997. Timber Management Guidelines for the Provision of White-Tailed Deer Habitat. Queen’s Printer for Ontario.
OMNR 1998. Selected Wildlife and Habitat Features: Inventory Manual. Queen’s Printer for Ontario.
OMNR 2000 Proposed architecture for ecological land classification in Ontario. Final Draft – October 2000.
OMNR. 2001. Forest management guide for natural disturbance pattern emulation, Version 3.1. Ont. Min. Nat. Res., Queen’s Printer for Ontario, Toronto. 40 p.
OMNR 2002. State of the Forest Report, 2001. Toronto: Queen’s Printer for Ontario.
OMNR. 2003. Old growth policy for Ontario’s Crown forests. OMNR Forest Policy Section. Queen’s Printer for Ontario.
OMNR 2005. Our Sustainable Future. Ministry of Natural Resources. Strategic Directions. Queen’s Printer for Ontario. 29 pp.
OMNR 2009. Effectiveness Monitoring of Forest Management Guidelines: Strategic Direction. Draft Document.
Ontario Forest Accord 1999.
Perera, A.H. and D.J.B. Baldwin. 2000. Spatial patterns in the managed forest landscape of Ontario. Pages 74-99.In: A.H. Perera, D.L. Euler and I.D. Thompson (editors). Ecology of a Managed Terrestrial Landscape: Patterns and Processes in Forest Landscapes of Ontario. UBC Press, Toronto.
Perera, A.H., L J. Buse, and M.G. Weber (eds), 2004. Emulating Natural Forest Landscape Disturbances: Concepts and Applications. Columbia University Press. 352 pages.
Pinto, F. and S.M. Romaniuk. 2002. Presettlement forest cover in northeastern Ontario. Pp. 59-61 in Emulating Natural Forest Landscape Disturbances: Concepts and Applications Popular Summaries. Buse, L.J. and A.H. Perera, comp. Sault Ste. Marie, ON. May 11-16, 2002. Ont. Min. Nat. Resour., Ont. For. Res. Inst., For. Res. Inf. Pap. No. 149. 100 p.
Podur, Justin P, D. L. Martell, and K. Knight. 2002. Statistical quality control analysis of forest fire activity in Canada. Can. J. For. Res. 32(2): 195-205.
Quinn, N.W.S. 2004. The presettlement hardwood forests and wildlife of Algonquin Provincial
Park: A synthesis of historic evidence and recent research. Forestry Chronicle 80: 705-717.
Rempel, R.S., P. Elkie, A. R. Rodgers, and M. J. Gluck. 1997. Timber-management and natural- disturbance effects on moose habitat: landscape evaluation. J. Wildl. Manage. 61:517-524.
Rempel, R. S., J. Baker, P. C. Elkie, M. J. Gluck, J. Jackson, R. S. Kushneriuk, T. Moore and A. H. Perera. 2007. Forest policy scenario analysis: sensitivity of forest songbirds to changes in mature forest cover amount, composition, and configuration. Avian Conservation and Ecology - Écologie et conservation des oiseaux XX(YY): ZZ. [online] URL: http://www.ace-eco.org/volXX/issYY/artZZ/ [link inactive].
Rempel, R.S., J. Baker, G. Brown, J. Churcher, M. Gluck and B. Naylor. 2009. Effectiveness Monitoring of Forest Management Guides: Strategic Direction. Draft OMNR document.
Renecker. L.A. and C.C. Schwartz. 1998. Food Habits and feeding behaviour. In Ecology and management of the NorthAmerican moose. Franzmann, A.W. and C.C. Schwartz, Eds. Smithsonian Inst. Press. Wash. and London. pp 403-439.
Rowe, J.S. and J.W. Sheard. 1981 Ecological Land Classification: a survey approach. Environmental Management 5:451-64.
Spittlehouse, D.L. 2005. Integrating climate change adaptation into forest management. The Forestry Chronicle 81:91-95.
Stankey, George H.; Clark, Roger N.; Bormann, Bernard T. 2005. Adaptive management of natural resources: theory, concepts, and management institutions. Gen. Tech. Rep. PNW-GTR-654. Portland, OR: U.S. Department of Agriculture, Forest Service, Pacific Northwest Research Station. 73 p.
Suffling, R. B. Smith, and J.D. Molin. 1982. Estimating past forest age distributions and disturbance rates in north-western Ontario: a demographic approach. Journal of Environmental Management 14: 45-56.
Ter-Mikaelian, M.T., S.J. Colombo, and J. Chen. 2008. Fact and fantasy about forest carbon. For. Chron. 84: 166-171.
Thompson, I.D., Simard J.W. and R.D. Titman, 2006. Historical Changes in White Pine (Pinus strobus L.) Density in Algonquin Park, Ontario, During the 19th Century. Natural Areas Journal 26(1): 61-71.
Voigt, D.R., G. Deyne, M. Malhiot, B. Ranta, B. Snider, R. Stefanski, and M. Strickland. 1992. White-tailed deer in Ontario: background to a policy. Ont. Min. Nat. Res., Wildl. Policy Br. Draft Document. 83 p.
Walters C. 1986. Adaptive Management of Renewable Resources. Macmillan Publishing Co., New York.
Appendix 1. Landscape Guide Milestones for Landscape Guide Region GLSL North
Table A1. Landscape Guide Region GLSL North – Milestones for the Algoma Forest Management Unit
| CFSA Objective Category | Landscape Guide Indicator Group | Landscape Guide Indicator | Measurement (units) | Milestones: Directional Statement | Milestones: Short (10 years) | Milestones: Medium (20 years) | Milestones: Long (100 years) |
|---|---|---|---|---|---|---|---|
| Structure and Composition | Landscape classes | Tolerant hardwood | Area (ha) | Decrease towards the simulated range of natural variation (SRNV) | Decrease | Decrease | Decrease |
| Structure and Composition | Landscape classes | Intolerant hardwood | Area (ha) | Decrease towards and maintain within the SRNV | Decrease | Decrease | Maintain |
| Structure and Composition | Landscape classes | White pine mixedwood | Area (ha) | Increase towards the SRNV | Increase | Increase | Increase |
| Structure and Composition | Landscape classes | Mixedwood | Area (ha) | Decrease towards and maintain within the SRNV | Decrease | Decrease | Maintain |
| Structure and Composition | Landscape classes | Mixed pines | Area (ha) | Increase towards the SRNV | Increase | Increase | Increase |
| Structure and Composition | Landscape classes | Spruce-fir- cedar | Area (ha) | Move towards a range based on the SRNV and the PIC | Decrease | Decrease | Maintain |
| Structure and Composition | Old growth forest | Old growth by Forest Management Plan Forest Unit or appropriate grouping | Area (ha) | Move towards and/or maintain within the SRNV | Move towards or maintain as applicable | Move towards or maintain as applicable | Move towards or maintain as applicable |
| Structure and Composition | Red and white pine forest | All ages red and white pine forest units | Area (ha) | Increase towards the SRNV | Increase | Increase | Increase |
| Pattern | Texture of the mature and old forest | Texture of the mature and old forest | 500 ha hexagon histogram | Move towards and/or maintain within the SRNV | Move towards mean | Move towards mean | N/A |
| Pattern | Texture of the mature and old forest | Texture of the mature and old forest | 5000 ha hexagon histogram | Move towards and/or maintain within the SRNV | Move towards mean | Move towards mean | N/A |
| Pattern | Young forest patch size | Young forest patch size | Patch size frequency histogram | Move towards and/or maintain within the SRNV | Move towards mean | Move towards mean | N/A |
Table A2. Landscape Guide Region GLSL North – Milestones for Northshore Forest Management Unit
| CFSA Objective Category | Landscape Guide Indicator Group | Landscape Guide Indicator | Measurement (units) | Milestones: Directional Statement | Milestones: Short (10 years) | Milestones: Medium (20 years) | Milestones: Long (100 years) |
|---|---|---|---|---|---|---|---|
| Structure and Composition | Landscape classes | Tolerant hardwood | Area (ha) | Increase towards and maintain within the simulated range of natural variation (SRNV) | Increase | Increase | Maintain |
| Structure and Composition | Landscape classes | Intolerant hardwood | Area (ha) | Decrease towards the SRNV | Decrease | Decrease | Decrease |
| Structure and Composition | Landscape classes | White pine mixedwood | Area (ha) | Increase towards the SRNV | Increase | Increase | Increase |
| Structure and Composition | Landscape classes | Mixedwood | Area (ha) | Maintain within the SRNV | Maintain | Maintain | Maintain |
| Structure and Composition | Landscape classes | Mixed pines | Area (ha) | Increase and maintain within the SRNV | Increase | Increase | Maintain |
| Structure and Composition | Landscape classes | Spruce-fir- cedar | Area (ha) | Increase towards the SRNV | Increase | Increase | Increase |
| Structure and Composition | Old growth forest | Old growth by Forest Management Plan Forest Unit or appropriate grouping | Area (ha) | Move towards and/or maintain within the SRNV | Move towards or maintain as applicable | Move towards or maintain as applicable | Move towards or maintain as applicable |
| Structure and Composition | Red and white pine forest | All ages red and white pine forest units | Area (ha) | Increase towards the SRNV | Increase | Increase | Increase |
| Pattern | Texture of the mature and old forest | Texture of the mature and old forest | 500 ha hexagon histogram | Move towards and/or maintain within the SRNV | Move towards mean | Move towards mean | N/A |
| Pattern | Texture of the mature and old forest | Texture of the mature and old forest | 5000 ha hexagon histogram | Move towards and/or maintain within the SRNV | Move towards mean | Move towards mean | N/A |
| Pattern | Young forest patch size | Young forest patch size | Patch size frequency histogram | Move towards and/or maintain within the SRNV | Move towards mean | Move towards mean | N/A |
Table A3. Landscape Guide Region GLSL North – Milestones for Spanish Forest Management Unit
| CFSA Objective Category | Landscape Guide Indicator Group | Landscape Guide Indicator | Measurement (units) | Milestones: Directional Statement | Milestones: Short (10 years) | Milestones: Medium (20 years) | Milestones: Long (100 years) |
|---|---|---|---|---|---|---|---|
| Structure and Composition | Landscape classes | Tolerant hardwood | Area (ha) | Increase towards the simulated range of natural variation (SRNV) | Increase | Increase | Increase |
| Structure and Composition | Landscape classes | Intolerant hardwood | Area (ha) | Decrease and maintain towards the SRNV | Decrease | Decrease | Maintain |
| Structure and Composition | Landscape classes | White pine mixedwood | Area (ha) | Increase towards the SRNV | Increase | Increase | Increase |
| Structure and Composition | Landscape classes | Mixedwood | Area (ha) | Decrease towards the SRNV | Decrease | Decrease | Decrease |
| Structure and Composition | Landscape classes | Mixed pines | Area (ha) | Maintain within the SRNV | Maintain | Maintain | Maintain |
| Structure and Composition | Landscape classes | Spruce-fir- cedar | Area (ha) | Maintain within the SRNV | Maintain | Maintain | Maintain |
| Structure and Composition | Old growth forest | Old growth by Forest Management Plan Forest Unit or appropriate grouping | Area (ha) | Move towards and/or maintain within the SRNV | Move towards or maintain as applicable | Move towards or maintain as applicable | Move towards or maintain as applicable |
| Structure and Composition | Red and white pine forest | All ages red and white pine forest units | Area (ha) | Increase towards the SRNV | Increase | Increase | Increase |
| Pattern | Texture of the mature and old forest | Texture of the mature and old forest | 500 ha hexagon histogram | Move towards and/or maintain within the SRNV | Move towards mean | Move towards mean | N/A |
| Pattern | Texture of the mature and old forest | Texture of the mature and old forest | 5000 ha hexagon histogram | Move towards and/or maintain within the SRNV | Move towards mean | Move towards mean | N/A |
| Pattern | Young forest patch size | Young forest patch size | Patch size frequency histogram | Move towards and/or maintain within the SRNV | Move towards mean | Move towards mean | N/A |
Table A4. Landscape Guide Region GLSL North – Milestones for Sudbury Forest Management Unit
| CFSA Objective Category | Landscape Guide Indicator Group | Landscape Guide Indicator | Measurement (units) | Milestones: Directional Statement | Milestones: Short (10 years) | Milestones: Medium (20 years) | Milestones: Long (100 years) |
|---|---|---|---|---|---|---|---|
| Structure and Composition | Landscape classes | Tolerant hardwood | Area (ha) | Increase towards the simulated range of natural variation (SRNV) | Increase | Increase | Increase |
| Structure and Composition | Landscape classes | Intolerant hardwood | Area (ha) | Decrease and maintain within the SRNV | Decrease | Decrease | Maintain |
| Structure and Composition | Landscape classes | White pine mixedwood | Area (ha) | Increase towards the SRNV | Increase | Increase | Increase |
| Structure and Composition | Landscape classes | Mixedwood | Area (ha) | Decrease towards the SRNV | Decrease | Decrease | Decrease |
| Structure and Composition | Landscape classes | Mixed pines | Area (ha) | Increase and maintain within the SRNV | Increase | Increase | Maintain |
| Structure and Composition | Landscape classes | Spruce-fir- cedar | Area (ha) | Increase towards the SRNV | Increase | Increase | Increase |
| Structure and Composition | Old growth forest | Old growth by Forest Management Plan Forest Unit or appropriate grouping | Area (ha) | Move towards and/or maintain within the SRNV | Move towards or maintain as applicable | Move towards or maintain as applicable | Move towards or maintain as applicable |
| Structure and Composition | Red and white pine forest | All ages red and white pine forest units | Area (ha) | Increase towards the SRNV | Increase | Increase | Increase |
| Pattern | Texture of the mature and old forest | Texture of the mature and old forest | 500 ha hexagon histogram | Move towards and/or maintain within the SRNV | Move towards mean | Move towards mean | N/A |
| Pattern | Texture of the mature and old forest | Texture of the mature and old forest | 5000 ha hexagon histogram | Move towards and/or maintain within the SRNV | Move towards mean | Move towards mean | N/A |
| Pattern | Young forest patch size | Young forest patch size | Patch size frequency histogram | Move towards and/or maintain within the SRNV | Move towards mean | Move towards mean | N/A |
Table A5. Landscape Guide Region GLSL North – Milestones for Nipissing Forest Management Unit
| CFSA Objective Category | Landscape Guide Indicator Group | Landscape Guide Indicator | Measurement (units) | Milestones: Directional Statement | Milestones: Short (10 years) | Milestones: Medium (20 years) | Milestones: Long (100 years) |
|---|---|---|---|---|---|---|---|
| Structure and Composition | Landscape classes | Tolerant hardwood | Area (ha) | Increase towards the simulated range of natural variation (SRNV) | Increase | Increase | Increase |
| Structure and Composition | Landscape classes | Intolerant hardwood | Area (ha) | Decrease towards and maintain within the SRNV | Decrease | Decrease | Maintain |
| Structure and Composition | Landscape classes | White pine mixedwood | Area (ha) | Increase towards the SRNV | Increase | Increase | Increase |
| Structure and Composition | Landscape classes | Mixedwood | Area (ha) | Decrease towards the SRNV | Decrease | Decrease | Decrease |
| Structure and Composition | Landscape classes | Mixed pines | Area (ha) | Increase towards the SRNV | Increase | Increase | Increase |
| Structure and Composition | Landscape classes | Spruce-fir- cedar | Area (ha) | Decrease towards and maintain within the SRNV | Decrease | Decrease | Maintain |
| Structure and Composition | Old growth forest | Old growth by Forest Management Plan Forest Unit or appropriate grouping | Area (ha) | Move towards and/or maintain within the SRNV | Move towards or maintain as applicable | Move towards or maintain as applicable | Move towards or maintain as applicable |
| Structure and Composition | Red and white pine forest | All ages red and white pine forest units | Area (ha) | Increase towards the SRNV | Increase | Increase | Increase |
| Pattern | Texture of the mature and old forest | Texture of the mature and old forest | 50 ha hexagon histogram | Move towards and/or maintain within the SRNV | Move towards mean | Move towards mean | N/A |
| Pattern | Texture of the mature and old forest | Texture of the mature and old forest | 500 ha hexagon histogram | Move towards and/or maintain within the SRNV | Move towards mean | Move towards mean | N/A |
| Pattern | Young forest patch size | Young forest patch size | Patch size frequency histogram | Move towards and/or maintain within the SRNV | Move towards mean | Move towards mean | N/A |
Table A6. Landscape Guide Region GLSL North – Milestones for Temagami Forest Management Unit
| CFSA Objective Category | Landscape Guide Indicator Group | Landscape Guide Indicator | Measurement (units) | Milestones: Directional Statement | Milestones: Short (10 years) | Milestones: Medium (20 years) | Milestones: Long (100 years) |
|---|---|---|---|---|---|---|---|
| Structure and Composition | Landscape classes | Tolerant hardwood | Area (ha) | Increase towards the simulated range of natural variation (SRNV) | Increase | Increase | Increase |
| Structure and Composition | Landscape classes | Intolerant hardwood | Area (ha) | Decrease towards the SRNV | Decrease | Decrease | Decrease |
| Structure and Composition | Landscape classes | White pine mixedwood | Area (ha) | Increase towards the SRNV | Increase | Increase | Increase |
| Structure and Composition | Landscape classes | Mixedwood | Area (ha) | Decrease towards the SRNV | Decrease | Decrease | Decrease |
| Structure and Composition | Landscape classes | Mixed pines | Area (ha) | Maintain within the SRNV | Maintain | Maintain | Maintain |
| Structure and Composition | Landscape classes | Spruce-fir- cedar | Area (ha) | Maintain within the SRNV | Maintain | Maintain | Maintain |
| Structure and Composition | Old growth forest | Old growth by Forest Management Plan Forest Unit or appropriate grouping | Area (ha) | Maintain within the SRNV | Maintain | Maintain | Maintain |
| Structure and Composition | Red and white pine forest | All ages red and white pine forest units | Area (ha) | Increase towards the SRNV | Increase | Increase | Increase |
| Pattern | Texture of the mature and old forest | Texture of the mature and old forest | 500 ha hexagon histogram | Move towards and/or maintain within the SRNV | Move towards mean | Move towards mean | N/A |
| Pattern | Texture of the mature and old forest | Texture of the mature and old forest | 5000 ha hexagon histogram | Move towards and/or maintain within the SRNV | Move towards mean | Move towards mean | N/A |
| Pattern | Young forest patch size | Young forest patch size | Patch size frequency histogram | Move towards and/or maintain within the SRNV | Move towards mean | Move towards mean | N/A |
Appendix 2. Landscape Guide Milestones for Landscape Guide Region GLSL South
Table A7. Landscape Guide Region GLSL South – Milestones for the French/Severn Forest Management Unit
| CFSA Objective Category | Landscape Guide Indicator Group | Landscape Guide Indicator | Measurement (units) | Milestones: Directional Statement | Milestones: Short (10 years) | Milestones: Medium (20 years) | Milestones: Long (100 years) |
|---|---|---|---|---|---|---|---|
| Structure and Composition | Landscape classes | Tolerant hardwood | Area (ha) | Decrease towards the Simulated Range of Natural Variation (SRNV) | Decrease | Decrease | Decrease |
| Structure and Composition | Landscape classes | Intolerant hardwood | Area (ha) | Decrease and maintain the SRNV | Decrease | Decrease | Maintain |
| Structure and Composition | Landscape classes | White pine mixedwood | Area (ha) | Maintain within the SRNV | Maintain | Maintain | Maintain |
| Structure and Composition | Landscape classes | Mixedwood | Area (ha) | Maintain within the SRNV | Maintain | Maintain | Maintain |
| Structure and Composition | Landscape classes | Mixed pines | Area (ha) | Maintain within the SRNV | Maintain | Maintain | Maintain |
| Structure and Composition | Landscape classes | Spruce-fir- cedar | Area (ha) | Increase and maintain within the SRNV | Increase | Increase | Maintain |
| Structure and Composition | Old growth forest | Old growth by Forest Management Plan Forest Unit or appropriate grouping | Area (ha) | Move towards and/or maintain within the SRNV | Move towards or maintain as applicable | Move towards or maintain as applicable | Move towards or maintain as applicable |
| Structure and Composition | Red and white pine forest | All ages red and white pine forest units | Area (ha) | Move towards and/or maintain within the SRNV | Increase | Increase | Increase |
| Structure and Composition | Young forest | Pre-sapling development stage | Area (ha) | Increase towards the SRNV | Increase | Increase | Increase |
| Structure and Composition | Young forest | Pre-sapling + Sapling & T- stage development stages combined | Area (ha) | Increase and maintain within the SRNV | Increase | Increase | Maintain |
| Pattern | Texture of the mature and old forest | Texture of the mature and old forest | 50 ha hexagon histogram | Move towards and/or maintain within the SRNV | Move towards mean | Move towards mean | N/A |
| Pattern | Texture of the mature and old forest | Texture of the mature and old forest | 500 ha hexagon histogram | Move towards and/or maintain within the SRNV | Move towards mean | Move towards mean | N/A |
| Pattern | Young forest patch size | Young forest patch size | Patch size frequency histogram | Move towards and/or maintain within the SRNV | Move towards mean | Move towards mean | N/A |
Table A8. Landscape Guide Region GLSL South – Milestones for the Algonquin Park Forest
| CFSA Objective Category | Landscape Guide Indicator Group | Landscape Guide Indicator | Measurement (units) | Milestones: Directional Statement | Milestones: Short (10 years) | Milestones: Medium (20 years) | Milestones: Long (100 years) |
|---|---|---|---|---|---|---|---|
| Structure and Composition | Landscape classes | Tolerant hardwood | Area (ha) | Decrease towards the Simulated Range of Natural Variation (SRNV) | Decrease | Decrease | Decrease |
| Structure and Composition | Landscape classes | Intolerant hardwood | Area (ha) | Decrease and maintain the SRNV | Decrease | Decrease | Maintain |
| Structure and Composition | Landscape classes | White pine mixedwood | Area (ha) | Increase and maintain within the SRNV | Increase | Increase | Maintain |
| Structure and Composition | Landscape classes | Mixedwood | Area (ha) | Maintain within the SRNV | Maintain | Maintain | Maintain |
| Structure and Composition | Landscape classes | Mixed pines | Area (ha) | Maintain within the SRNV | Maintain | Maintain | Maintain |
| Structure and Composition | Landscape classes | Spruce-fir- cedar | Area (ha) | Increase toward the SRNV | Increase | Increase | Increase |
| Structure and Composition | Old growth forest | Old growth by Forest Management Plan Forest Unit or appropriate grouping | Area (ha) | Move towards and/or maintain within the SRNV | Move towards or maintain as applicable | Move towards or maintain as applicable | Move towards or maintain as applicable |
| Structure and Composition | Red and white pine forest | All ages red and white pine forest units | Area (ha) | Increase towards the SRNV | Increase | Increase | Increase |
| Structure and Composition | Young forest | Pre-sapling development stage | Area (ha) | Increase towards the SRNV | Increase | Increase | Increase |
| Structure and Composition | Young forest | Pre-sapling + Sapling & T- stage development stages combined | Area (ha) | Increase and maintain within the SRNV | Increase | Increase | Maintain |
| Pattern | Texture of the mature and old forest | Texture of the mature and old forest | 50 ha hexagon histogram | Move towards and/or maintain within the SRNV | Move towards mean | Move towards mean | N/A |
| Pattern | Texture of the mature and old forest | Texture of the mature and old forest | 500 ha hexagon histogram | Move towards and/or maintain within the SRNV | Move towards mean | Move towards mean | N/A |
| Pattern | Young forest patch size | Young forest patch size | Patch size frequency histogram | Move towards and/or maintain within the SRNV | Move towards mean | Move towards mean | N/A |
Table A9. Landscape Guide Region GLSL South – Milestones for Bancroft Minden Forest
| CFSA Objective Category | Landscape Guide Indicator Group | Landscape Guide Indicator | Measurement (units) | Milestones: Directional Statement | Milestones: Short (10 years) | Milestones: Medium (20 years) | Milestones: Long (100 years) |
|---|---|---|---|---|---|---|---|
| Structure and Composition | Landscape classes | Tolerant hardwood | Area (ha) | Decrease towards the Simulated Range of Natural Variation (SRNV) | Decrease | Decrease | Decrease |
| Structure and Composition | Landscape classes | Intolerant hardwood | Area (ha) | Decrease towards and maintain within the SRNV | Decrease | Decrease | Maintain |
| Structure and Composition | Landscape classes | White pine mixedwood | Area (ha) | Increase towards the SRNV | Increase | Increase | Increase |
| Structure and Composition | Landscape classes | Mixedwood | Area (ha) | Maintain within the SRNV | Maintain | Maintain | Maintain |
| Structure and Composition | Landscape classes | Mixed pines | Area (ha) | Increase towards the SRNV | Increase | Increase | Increase |
| Structure and Composition | Landscape classes | Spruce-fir- cedar | Area (ha) | Increase toward and maintain the SRNV | Increase | Increase | Maintain |
| Structure and Composition | Old growth forest | Old growth by Forest Management Plan Forest Unit or appropriate grouping | Area (ha) | Move towards and/or maintain within the SRNV | Move towards or maintain as applicable | Move towards or maintain as applicable | Move towards or maintain as applicable |
| Structure and Composition | Red and white pine forest | All ages red and white pine forest units | Area (ha) | Increase towards the SRNV | Increase | Increase | Increase |
| Structure and Composition | Young forest | Pre-sapling development stage | Area (ha) | Increase towards the SRNV | Increase | Increase | Increase |
| Structure and Composition | Young forest | Pre-sapling + Sapling & T- stage development stages combined | Area (ha) | Increase and maintain within the SRNV | Increase | Increase | Maintain |
| Pattern | Texture of the mature and old forest | Texture of the mature and old forest | 50 ha hexagon histogram | Move towards and/or maintain within the SRNV | Move towards mean | Move towards mean | N/A |
| Pattern | Texture of the mature and old forest | Texture of the mature and old forest | 500 ha hexagon histogram | Move towards and/or maintain within the SRNV | Move towards mean | Move towards mean | N/A |
| Pattern | Young forest patch size | Young forest patch size | Patch size frequency histogram | Move towards and/or maintain within the SRNV | Move towards mean | Move towards mean | N/A |
Table A10. Landscape Guide Region GLSL South – Milestones for Mazinaw Lanark Forest
| CFSA Objective Category | Landscape Guide Indicator Group | Landscape Guide Indicator | Measurement (units) | Milestones: Directional Statement | Milestones: Short (10 years) | Milestones: Medium (20 years) | Milestones: Long (100 years) |
|---|---|---|---|---|---|---|---|
| Structure and Composition | Landscape classes | Tolerant hardwood | Area (ha) | Decrease towards the Simulated Range of Natural Variation (SRNV) | Decrease | Decrease | Decrease |
| Structure and Composition | Landscape classes | Intolerant hardwood | Area (ha) | Maintain within the SRNV | Maintain | Maintain | Maintain |
| Structure and Composition | Landscape classes | White pine mixedwood | Area (ha) | Increase towards and maintain within the SRNV | Increase | Increase | Maintain |
| Structure and Composition | Landscape classes | Mixedwood | Area (ha) | Maintain within the SRNV | Maintain | Maintain | Maintain |
| Structure and Composition | Landscape classes | Mixed pines | Area (ha) | Increase towards the SRNV | Increase | Increase | Increase |
| Structure and Composition | Landscape classes | Spruce-fir- cedar | Area (ha) | Increase toward and maintain within the SRNV | Increase | Increase | Maintain |
| Structure and Composition | Old growth forest | Old growth by Forest Management Plan Forest Unit or appropriate grouping | Area (ha) | Move towards and/or maintain within the SRNV | Move towards or maintain as applicable | Move towards or maintain as applicable | Move towards or maintain as applicable |
| Structure and Composition | Red and white pine forest | All ages red and white pine forest units | Area (ha) | Increase towards the SRNV | Increase | Increase | Increase |
| Structure and Composition | Young forest | Pre-sapling development stage | Area (ha) | Increase towards the SRNV | Increase | Increase | Increase |
| Structure and Composition | Young forest | Pre-sapling + Sapling & T- stage development stages combined | Area (ha) | Increase and maintain within the SRNV | Increase | Increase | Maintain |
| Pattern | Texture of the mature and old forest | Texture of the mature and old forest | 50 ha hexagon histogram | Move towards and/or maintain within the SRNV | Move towards mean | Move towards mean | N/A |
| Pattern | Texture of the mature and old forest | Texture of the mature and old forest | 500 ha hexagon histogram | Move towards and/or maintain within the SRNV | Move towards mean | Move towards mean | N/A |
| Pattern | Young forest patch size | Young forest patch size | Patch size frequency histogram | Move towards and/or maintain within the SRNV | Move towards mean | Move towards mean | N/A |
Table A11. Landscape Guide Region GLSL South – Milestones for Ottawa Valley Forest
| CFSA Objective Category | Landscape Guide Indicator Group | Landscape Guide Indicator | Measurement (units) | Milestones: Directional Statement | Milestones: Short (10 years) | Milestones: Medium (20 years) | Milestones: Long (100 years) |
|---|---|---|---|---|---|---|---|
| Structure and Composition | Landscape classes | Tolerant hardwood | Area (ha) | Decrease towards the Simulated Range of Natural Variation (SRNV) | Decrease | Decrease | Decrease |
| Structure and Composition | Landscape classes | Intolerant hardwood | Area (ha) | Decrease towards and maintain within the SRNV | Decrease | Decrease | Maintain |
| Structure and Composition | Landscape classes | White pine mixedwood | Area (ha) | Increase towards and maintain within the SRNV | Increase | Increase | Maintain |
| Structure and Composition | Landscape classes | Mixedwood | Area (ha) | Decrease towards and maintain within the SRNV | Decrease | Decrease | Maintain |
| Structure and Composition | Landscape classes | Mixed pines | Area (ha) | Maintain within the SRNV | Maintain | Maintain | Maintain |
| Structure and Composition | Landscape classes | Spruce-fir- cedar | Area (ha) | Increase toward and maintain within the SRNV | Increase | Increase | Maintain |
| Structure and Composition | Old growth forest | Old growth by Forest Management Plan Forest Unit or appropriate grouping | Area (ha) | Move towards and/or maintain within the SRNV | Move towards or maintain as applicable | Move towards or maintain as applicable | Move towards or maintain as applicable |
| Structure and Composition | Red and white pine forest | All ages red and white pine forest units | Area (ha) | Maintain within the SRNV | Maintain | Maintain | Maintain |
| Structure and Composition | Young forest | Pre-sapling development stage | Area (ha) | Increase towards the SRNV | Increase | Increase | Increase |
| Structure and Composition | Young forest | Pre-sapling + Sapling & T- stage develop- ment stages combined | Area (ha) | Increase and maintain within the SRNV | Increase | Increase | Maintain |
| Pattern | Texture of the mature and old forest | Texture of the mature and old forest | 50 ha hexagon histogram | Move towards and/or maintain within the SRNV | Move towards mean | Move towards mean | N/A |
| Pattern | Texture of the mature and old forest | Texture of the mature and old forest | 500 ha hexagon histogram | Move towards and/or maintain within the SRNV | Move towards mean | Move towards mean | N/A |
| Pattern | Young forest patch size | Young forest patch size | Patch size frequency histogram | Move towards and/or maintain within the SRNV | Move towards mean | Move towards mean | N/A |
Footnotes
- footnote[1] Back to paragraph Or in the applicable documentation table for objective achievement described in the forest management planning manual.
- footnote[2] Back to paragraph The Nipissing Forest management unit is an exception in that it uses the 50 and 500 ha measurement scales