Microorganisms and soil processes
Learn about the important role microscopic animals and microbes play in soil processes. Microorganisms include fungi, bacteria, actinomycetes and algae.
There are more organisms in one tablespoon of healthy soil than there are people on the earth. Soil organisms are an intimate and integral part of a soil. These organisms contribute significantly to soil fertility and structure. Virtually all topsoil has passed through the gut of either microorganisms or macroorganisms.
Microorganisms include fungi, bacteria, actinomycetes and algae. These microscopic animals and microbes play an important role in soil processes.
| Microorganism | Importance |
|---|---|
| Fungi |
|
| Bacteria |
|
| Actinomycetes |
|
| Algae |
|
Macroorganisms include protozoa, nematodes, earthworms, arthropods (insects, spiders) and rodents.
| Macroorganisms | Importance |
|---|---|
| Arthropods (examples: mites, spiders, insects) |
|
| Earthworms |
|
| Rodents (examples: mice, groundhogs, chipmunks) |
|
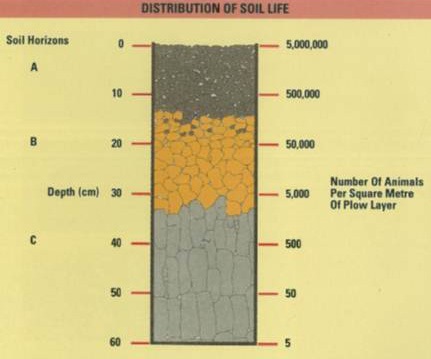
Animals and microbes are not evenly distributed through the soil (Figure 1). Populations decrease quickly just a few centimeters below the soil surface. Intensive tillage can severely impact these populations in a soil's top 20 cm.