Labour market report, February 2018
Employment in Ontario increased in February. Get the details in this report.
Quick facts
In February 2018, there were 11.8 million people in Ontario aged 15 years or older, 7.6 million, or (64%), were either working or actively looking for work. Of this population, 7.2 million, or 61%, were employed and 82% of them had a full time job.
Ontario’s unemployment rate was 5.5%, with 414,500 unemployed people
Employment declined in February
Employment in Ontario increased by 15,700 net jobs in February, following a decline of 50,900 in January.
Chart 1 shows employment in Ontario from January 2013 to February 2018.
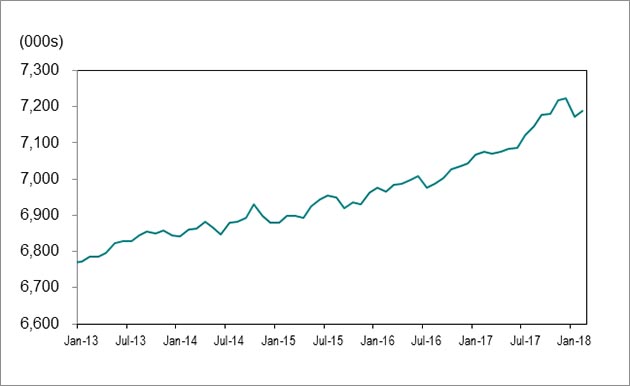
Source: Statistics Canada, Labour Force Survey, Table 282-0087, (seasonally adjusted data).
Full-time vs. part-time
There was a gain in part-time jobs (18,100) in February. Full-time jobs declined by 2,500.
Employment increase/decrease by age
Youth employment (those aged 15 to 24) was unchanged in February, following a decline of 25,800 jobs in January.
People ages 25 to 54 saw an increase in employment of 25,900 in February compared to January. Those aged 55 and older lost 10,600 jobs.
Employment in Canada rose by 15,400 in February, following a decline of 88,000 jobs in January.
Unemployment rate remained at 5.5%
Chart 2 shows unemployment rates, Ontario and Canada, January 2013 to February 2018.
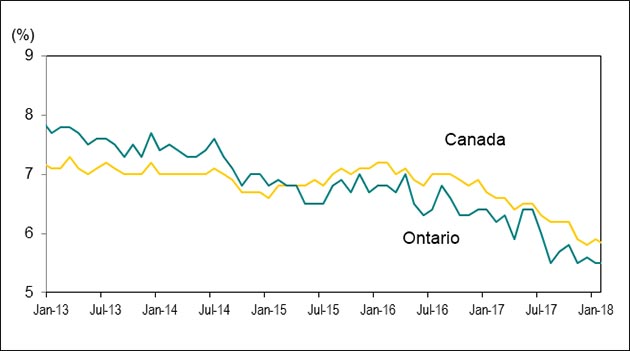
Source: Statistics Canada, Labour Force Survey, Table 282-0087, (seasonally adjusted data).
Ontario’s unemployment rate remained at 5.5% in February, matching last month and November 2017 as the lowest unemployment rate since July 2000 (5.4%).
Canada’s unemployment rate declined to 5.8% in February from 5.9% in January.
Unemployment rate by age
The unemployment rate for people ages 15 to 24 increased to 11.8% in February from 11.4% in January.
The unemployment rates for people ages 25 to 54 decreased to 4.4% in February from 4.6% in January and from 4.5% to 4.3% for those 55 and older.
Lowest and highest unemployment rates
Chart 3 shows Census Metropolitan Areas (CMAs) with highest and lowest unemployment rates in Canada, February 2018.
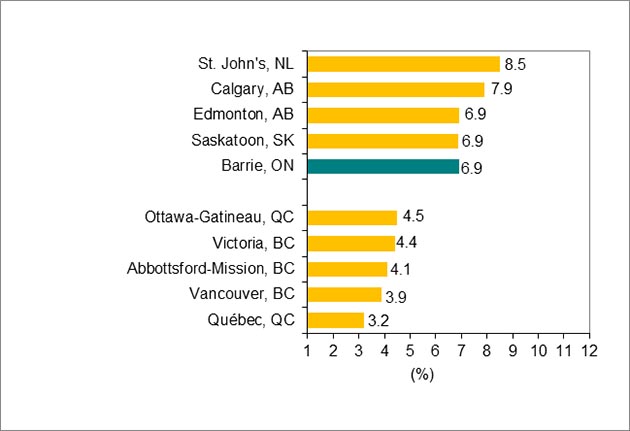
Source: Statistics Canada, Labour Force Survey, Table 282-0135, (seasonally adjusted data to reduce volatility caused by small sample size).
Québec City (3.2%) recorded the lowest unemployment rate in Canada in February, while St. John’s, Newfoundland (8.5%) recorded the highest rate.
Barrie (6.9%) recorded the highest unemployment rate in Ontario in February, while Oshawa (4.8%) had the lowest rate.
Year-over-year comparisons
Over the first two months of 2018, employment in Ontario increased by an estimated 81,900 jobs for adults 25 years and older compared to a year earlier.
Employment increase and decrease by education level
Chart 4 shows Ontario employment change by highest level of education attained, aged 25 and older, February 2017 to February 2018, year-to-date.
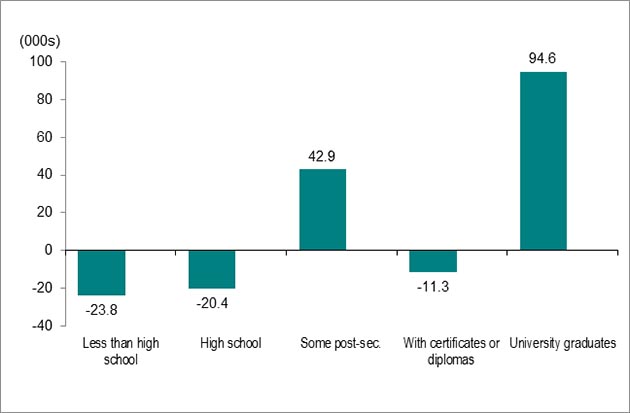
Source: Statistics Canada, Labour Force Survey, Table 282-0003, unadjusted data.
Adults with a university degree led gains, with 94,600 net new jobs.
Individuals with some postsecondary education (PSE) recorded job gains of 42,900, while employment for those with certificates or diplomas decreased by 11,300.
People with less than high school education and those with high school education recorded job losses of 23,800 and 20,400, respectively.
Unemployment rate by education level
The unemployment rate for adults aged 25 and older with PSE credentials was 4.0% over the first two months of 2018, down from 4.4% a year earlier.
The unemployment rate for adults without PSE credentials was 6.3%, down from 7.1% compared to the first two months of 2017.
Employment increase and decrease by occupation
Chart 5 shows Ontario employment change by occupation, February 2017 to February 2018, year-to-date.
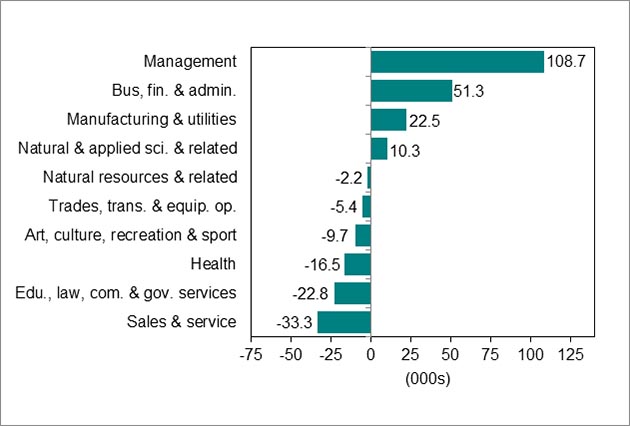
Source: Statistics Canada, Labour Force Survey, Table 282-0041, unadjusted data.
Six of the ten major occupational groups in Ontario recorded employment losses over the first two months of 2018 compared to a year earlier, despite overall year-over-year job gains.
Learn more about the National Occupation Classification (NOC) system.
These occupations gained the most jobs:
- management (108,700)
- business, finance and administration (51,300)
- manufacturing and utilities (22,500)
These occupations lost jobs:
- sales and service (33,300)
- education, law and social, community and government services (22,800)
- health (16,500)
Long-term unemployment decreased
Chart 6 shows Ontario’s long-term unemployed (27 weeks or more) as a percentage of total unemployment, February 2010 to February 2018, year-to-date.
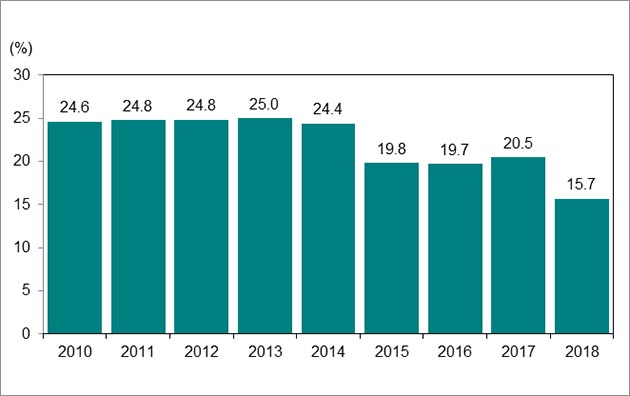
Source: Labour Force Survey, Table 282-0047, unadjusted data.
Over the first two months of 2018, an average of 65,800 people were long-term unemployed, or unemployed for 27 weeks or longer. This was down from 98,200 a year earlier.
Long-term unemployed individuals accounted for 15.7% of the total number of unemployed people over the first two months of 2018. This compared with 20.5% a year earlier.
The percentage of long-term unemployed individual is still higher compared to pre-recession level in February 2008 when 12.5% of all unemployed people were long-term unemployed.
Average time in long-term unemployment
The average time in unemployment decreased to 17.7 weeks over the first two months of 2018 from 20.2 weeks a year earlier.
Download data
Source: Statistics Canada, Labour Force Survey
February 2018 Labour Market Report:
- CSV, Chart 1, employment in Ontario from February 2013 to February 2018, 15Kb
- CSV, Chart 2, unemployment rates, Ontario and Canada, February 2013 to February 2018, 15Kb
- CSV, Chart 3, Census Metropolitan Areas (CMAs) highest and lowest unemployment rates, 15Kb
- CSV, Chart 4, Ontario employment change by highest level of education, aged 25 and older, 15Kb
- CSV, Chart 5, Ontario employment change by occupation, 15Kb
- CSV, Chart 6, Ontario’s long-term unemployed, 15Kb