Applying the Lakeshore Capacity Model
Applying the lakeshore capacity model (4.0)
Elements of the model (4.1)
The Ontario government’s Lakeshore Capacity Model quantifies the linkages between the natural contributions of phosphorus to a lake, the contributions of phosphorus to a lake from shoreline development, the water balance of a watershed, the size and shape of a lake and the resultant phosphorus concentration. A schematic of the model is given in Figure 3.
Figure 3. Ontario government’s Lakeshore Capacity Model
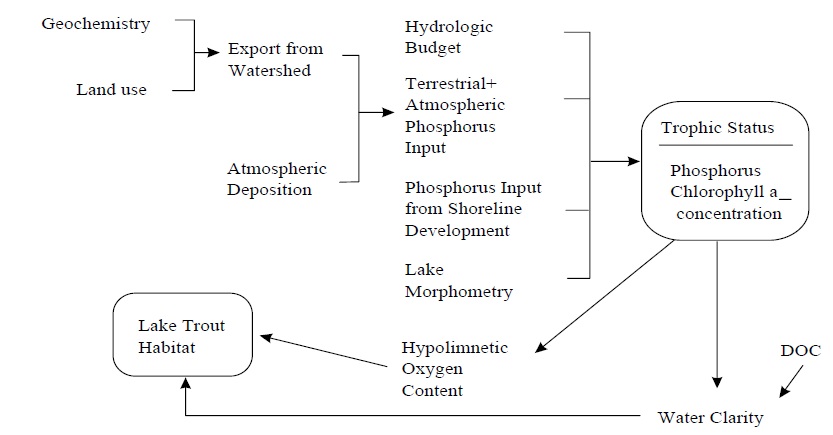
The model allows the user to calculate how the water quality of a lake will be affected by the addition or removal of shoreline developments (such as permanent homes, seasonal cottages, resorts, campsites) and point source discharges (such as sewage treatment plants). It can calculate the natural, undeveloped condition of a lake, the amount of development (in terms of number of dwellings) the lake could sustain without changing its total phosphorus concentration past a given point, and the difference between existing conditions and that tolerance point. The model also allows the user to theoretically modify the land-use and development parameters of upstream lakes to estimate the effect of potential development on downstream lakes in the watershed.
How the model was developed (4.2)
The Dillon-Rigler model, published in 197517, was the first model to specifically address the relationship between the eutrophication of Ontario’s Precambrian Shield lakes and the density of development along their shorelines. Its rapid acceptance by the international scientific community led to the development of the Ontario government’s Lakeshore Capacity Study (1976-1980) in the belief that substantial predictive relationships might be developed for other responses of lakes to shoreline development. The Lakeshore Capacity Study was coordinated by the Ministry of Municipal Affairs and Housing and published in 198618. It produced predictive models for land-use (MMAH), fisheries exploitation and wildlife (MNR), microbiology and water quality (MOE), as well as a capacity model that integrated all of these components (MMAH). Although several of these models were very useful, MOE's water quality model was the only one that management agencies adopted for routine use.
MOE's Lakeshore Capacity Model is based on the total phosphorus concentration or trophic status of a lake. It provides an accurate and quantitative linkage between the level of shoreline development and the level of phosphorus in a lake. This output can subsequently be used to predict the impacts of development on water clarity and deepwater oxygen content.
Over time, resource managers in MOE's regional offices, other government agencies in Canada and the United States, and the scientific and consulting communities have adopted the Lakeshore Capacity Model as an assessment tool. Although the model was accepted as a useful planning approach, the Ontario government never formalized its implementation. As a consequence, resource managers developed their own modifications to the model to address local concerns and interpretations. By the early 1990s, it became apparent that these informal implementation arrangements were no longer suitable; significant variations of the model were in use across the province, leading to a fragmented approach to water quality protection and confusion among stakeholders.
With the MOE's corporate adoption of watershed planning in 1993, a process leading to the formalization of lakeshore capacity assessment in policy commenced. This handbook is a result of this process. It was developed to give clear and consistent guidance to municipal planning authorities (as well as developers and lake residents),and to provide effective succession training to ministry staff, municipal staff and consultants.
Assumptions built into the model (4.3)
The Lakeshore Capacity Model includes several assumptions and coefficients. These numeric data represent the unknown and variable conditions in a lake or watershed. In the past, resource managers often adapted these variables to fit local conditions or to achieve certain management goals.
The mathematical assumptions in the Lakeshore Capacity Model have been refined over the past 25 years. Those presented herein reflect the current position of the MOE, and are based on the recent peer-reviewed scientific evidence. They also reflect MOE's commitment to a precautionary approach, as outlined in the Ministry’s Statement of Environmental Values. This approach supports the use of conservative assumptions to protect the environment when there is uncertainty in the science. Resource materials related to the assumptions are listed in Appendix B, Lakeshore capacity assessment resources.
Definition of shoreline development
The original Lakeshore Capacity Study (1986) defined shoreline development as the total number of units to be situated within 300 metres of the lake or any inflowing stream of the lake. Herein, the definition of development is broadened to include any activity which, through the creation of additional lots or units or through changes in land and water use, has the potential to adversely affect water quality and aquatic habitat. Development includes the addition of permanent residences, seasonal or extended seasonal use cottages, resorts, trailer parks, campgrounds and camps, and the conversion of forests to agricultural or urban land. It also recommended that consideration be given to any proposed large-scale alterations in land use (e.g., clearcutting of forest, dredging or filling of lowland areas) which may affect the TP input from the terrestrial watershed.
A watershed represents the total land area that contributes drainage to a lake. In some cases, significant portions of the watershed may be situated numerous kilometres from the lake they drain into. For management purposes, the 300 metre distance from the shoreline of the lake or any inflowing stream of the lake will continue to be used as the primary influence area. This 300 metre zone is immediately adjacent to the lake and is therefore considered sensitive in terms of lake water quality protection. On a case-by-case basis, large-scale developments (e.g., subdivisions) or any other significant land use activities which may affect the TP input from the terrestrial watershed beyond 300 metres may also be considered.
Phosphorus loadings to septic systems
Since the Lakeshore Capacity Model was first developed in the 1970s, the water usage rates for recreational lakes have increased due, in part, to the increased use of washing machines and dishwashers. These changes have been partially offset by decreases in the phosphorus content of detergents. The model now assumes that 0.66 kilograms of phosphorus is contributed per capita per year to septic systems (Paterson et al. 2006, Appendix B). This loading is considered to be the most appropriate coefficient in cases where detailed site-specific measurements haven't been made.
In general, reduced phosphorus loading rates should only be used for calculating lakeshore capacity where:
- The sewage effluent is received and treated in a municipally or provincially operated system designed to produce lower per unit phosphorus loading levels; if this system discharges into the lake being modeled, its total phosphorus load should be accounted for as a point source when modeling;
- The sewage effluent is transported, treated and discharged outside the catchment area of the lake in accordance with regulatory requirements.
Other sources of phosphorus from shoreline development
The Lakeshore Capacity Model focuses on phosphorus from septic systems as the major, human contributor to lake loadings. In recent years, as lake developments have become more urban with extensive cleared areas, gardens and turf grass, overland runoff has also been recognized as an additional contributor of phosphorus.
The model assumes an overland run-off loading to lakes of 0.04 kilograms of phosphorus per lot per year. This is calculated by multiplying the export coefficient for phosphorus from pasture land (9.8 mg/m2/yr; Dillon et al. 1986, Appendix B) by the mean size of lots in the District of Muskoka and the County of Haliburton (3798 m2, n>1000; Paterson et al. 2006, Appendix B). Additional sources of phosphorus such as sewage treatment plants, golf courses, intensive agriculture or timber harvesting, and lake sediments may also contribute significant nutrient loads to lakes. In cases where these loads have been quantified through direct measurement, they may be input into the Lakeshore Capacity Model as additional loads.
Retention of phosphorus from septic systems
The degree to which septic system phosphorus may be retained in watershed soils has been the subject of considerable scientific debate over the past two decades. While the Ontario Ministry of the Environment has recognized that the degree of retention may vary with soil type and grain size19, it has consistently held the position that all of the P deposited in septic systems will eventually migrate to lake ecosystems. This reflects the predominance of thin, organic or sandy soils and tills on the Precambrian Shield, the fractured nature of the bedrock, and the predominance of aging septic systems that were designed for hydraulic purposes (i.e., to ensure fast infiltration) rather than for nutrient retention. Furthermore, at the time of model development, there was no scientific evidence that phosphorus could be retained in watershed soils over the long-term.
Subsequent studies, however, have shown that the movement of phosphorus from septic tank- tile bed systems may be retained to some degree in certain soil types20,21. In response to this new science, the Ministry has developed criteria (Section 5.2) that can be used to assess the likelihood of P retention at a site over the long-term (i.e., decades). These criteria were developed after organizing technical workshops on the topic, liaising with technical experts, reviewing relevant peer-review studies from Ontario and elsewhere, and following the completion of technical reports by Dr. W.D. Robertson (Department of Earth Sciences, University of Waterloo) examining the fate of P in septic system plumes at sites on the Precambrian Shield.
A review of the peer-reviewed literature and the Robertson reports indicates that eight septic system plumes located within the Precambrian Shield in Ontario have been the subject of detailed field studies22. Of these, significant (> 90%), long-term (decadal-scale) retention of P has been demonstrated at half of the sites (Muskoka, Harp, Lake Joseph and Nobel). However, the Harp site was not investigated in detail because of monitoring difficulties (Zanini et al. 1998)23, and the Nobel plume is described by Robertson (2003) as distinct from the other sites because its septic system receives only "blackwater". Thus, only two of the aforementioned sites (one quarter of the sites on the Precambrian Shield in Ontario with detailed monitoring networks) provide field evidence of significant, long-term retention of P.
It is worth noting that the two sites showing long-term P retention (Muskoka, Lake Joseph) have native soils in excess of six meters. In contrast, all of the monitoring sites that have native soils of less than three meters show elevated concentrations of phosphate in groundwater (Delawana, Sturgeon Bay), have uncertainty in how they were monitored (Harp), or have uncertainty regarding the location of the P plume (Killarney). Poor attenuation at these sites, and the apparent loss of the plume core zone at the Killarney site, has been attributed to a variety of factors including the presence of thin soils, reducing conditions that develop in saturated soils, or chemical interference from water treatment apparatus. The above findings remind us that we must be cautious on the issue of P retention, and that failure to do so may place sensitive lakes at an unacceptable level of risk.
Thus, the recommended approach for applying phosphorus retention factors reflects the type of information that is available on the factors that influence the movement of phosphorus in soils. There are two basic approaches:
Use of phosphorus retention factors
- In areas of the province where soils are thin or absent, and bedrock is exposed or fractured, site-specific information may show that very little phosphorus is retained, and modelers should use a 100 per cent loading coefficient within 300 m of the shoreline or inflowing tributary.
- At sites where deeper native soils are present, planning authorities or development proponents may consider undertaking detailed site-specific studies to assess phosphorus distribution, migration velocity and long-term retention. This information should be made available to the local planning authority for review and consideration (see Section 5.2). In such cases, MOE will provide interpretation and guidance on the requirements of site-specific studies. Following approval, the resulting retention factor may be used in the model to reduce the input of P loading from septic systems.
Site engineering and vegetated buffers as nutrient sinks
In urban areas, techniques such as stormwater detention ponds, constructed wetlands and infiltration areas can be used to reduce the concentration of nutrients in overland runoff. For lakeshore properties, techniques such as shoreline naturalization and vegetated buffer strips have been accepted in many jurisdictions as sound management practices. However, there is not enough information to reliably predict the level of nutrient control that may be achieved through such techniques, or their long-term effectiveness at reducing phosphorus loading. Accordingly, the Lakeshore Capacity Model makes no allowances for mitigation of overland runoff through site engineering and vegetated buffers. It is recommended, however, that further studies be done to quantify the effectiveness and longevity of such techniques.
Rivers, wetlands and phosphorus transport
The Lakeshore Capacity Model assumes that all the phosphorus leaving one lake will be transported downstream to the next lake. Questions have been raised about the potential for phosphorus retention in wetlands and river channels. Evidence to date doesn't support the idea of phosphorus retention in either wetlands or river channels on a long-term basis. In both rivers and riverine wetlands, phosphorus retention is seasonal, with retention in the summer and export during high flow periods in the spring and fall. Accordingly, the current model doesn't include the possibility of phosphorus retention along river systems between lakes. This assumption may be revisited in the future as more information is gathered.
Usage rate of shoreline properties
One of the critical unknown variables in the Lakeshore Capacity Model is the usage rate of shoreline properties: how many days a year a property is occupied and by how many people. Usage rates vary dramatically with factors such as distance to major population centres and rate of conversion of seasonal residences to permanent use. Some indication of current usage rates may be obtained from surveys, tax records, lake residents' associations, topographic maps or aerial photos, although uncertainties are associated with all these information sources. Estimating future usage rates is more difficult. Estimating usage rates for uses other than year-round residences and seasonal cottages (such as resorts) is also challenging. The current MOE position is that the provincial standard usage rates should remain in effect (Table 3).
| Type of shoreline residence | Usage rate (capita years per year) |
|---|---|
| Seasonal | 0.69 |
| Extended seasonal | 1.27 |
| Permanent | 2.56 |
Usage rates can be modified based on local survey data. MOE also recommends that lake managers develop and update registries of development for each lake. In cases where usage rates are unknown and where there is no winter road access, MOE recommends using the seasonal rate of 0.69 capita years per year as a default. The extended seasonal rate of 1.27 capita years per year should be used for other non-permanent developments that have reliable year-round access.
MOE also recommends that specific phosphorus loading and/or usage rates be used for youth camps, resorts, permanent trailer parks, and campgrounds/tent trailers/RV parks:
Phosphorus loading / usage rates
Youth camps
Each camper = 125 g per year
Resorts (serviced, housekeeping cabins or meal plan)
Each resort unit = 1.18 capita years per year; or
Each guest = 308 g per year; or
If staff are considered, the resort contribution can be estimated using the extended seasonal usage figure of 1.27 capita years per year per unit
Trailer parks
Each site or hook up = 0.69 capita years per year
Campgrounds / Tent trailers / RV parks
With septic system to service pump outs, comfort and wash stations: Each campsite = 0.37 capita years per year
With vaulted (i.e., pumped out) outhouses and grey water treatment only: Each campsite = 0.175 capita years per year
To allocate remaining development (existing vacant lots plus new severances) where usage patterns are known, managers should use a hybrid usage factor: the existing ratio of seasonal / extended seasonal / permanent residences, and their respective standard usage factors.
Watershed-based planning issues
Lakeshore capacity assessment is consistent with watershed planning in that it considers phosphorus loading on a watershed basis. All lakes in a watershed have to be taken into account and modeled to make accurate predictions. Failure to model all lakes in a watershed may result in: 1) an overestimate of the concentration of phosphorus in the target lake because, with no accounting for retention by upstream lakes, the phosphorus export from the entire watershed will be added to the target lake; or 2) an underestimate of the P concentration in the target lake because the phosphorus load from nutrient-rich lakes upstream is not considered. In practice, lakes that are less than 25 hectares in size aren't considered unless they have significant shoreline development. Wetlands aren't modeled as separate water bodies.
Watershed-based planning can be applied in three different ways, depending upon the situation:
Application of watershed-based planning
- First time modeling, no lakes known to be at capacity
All upstream sources of phosphorus must be accounted for in a lake’s budget. Development capacity must allow for human sources of phosphorus from upstream. In this case, the watershed includes all lakes greater than 25 hectares in size, and smaller lakes with significant development, up to the headwaters of that catchment.
- Risk-based decision making
When a lake is getting close to capacity, managers should review the implications of further upstream development, taking into consideration the amount of sampling that has been done:
- How much development capacity is left upstream?
- What type of development is planned for the future?
- How much will full development upstream drive a target lake past its water quality objective?
- What resource is at risk if an objective is exceeded (e.g., clarity, dissolved oxygen)?
- When a lake reaches capacity
In this situation, MOE recommends using a less restrictive definition of a watershed as a balance between environmental protection and economic development. In this case, the watershed includes the lake that has reached capacity and extends upstream to the point where cumulative in-lake retention of phosphorus exceeds 80 per cent.
Lakeshore capacity assessment should be based on phosphorus loadings for the entire watershed so that phosphorus offset trading, remediation and mitigation can be incorporated if they become established practices in the future.
Comparisons between modeled estimates and measured water quality values
There will always be some discrepancy between modeled estimates and measured water quality values. This can occur because current development may not yet be expressed as changes in trophic status due to the lag time that exists between construction and phosphorus loading. Discrepancies may also result from use of inappropriate coefficients, inaccurate water quality data, or an insufficient sampling period (Table 4).
| Common reasons for over-prediction of measured TP | Common reasons for under-prediction of measured TP |
|---|---|
|
|
MOE recommends that total phosphorus be used as the parameter for comparison of model results with measured values. The sampling period must be long enough to enable the long-term mean to be estimated to within 20 per cent with 95 per cent confidence. In most cases, this means that at least two years of spring overturn measurements or one year with at least five measurements of volume-weighted phosphorus concentrations should be used (see Section 6.2, Table 5). Measurements should be summarized using an arithmetic mean for comparison purposes.
If the modeled estimates and measured values are within 20 per cent of each other, then they aren't considered to be significantly different. If the modeled estimates and measured values differ by more than 20 per cent, then lake managers should inspect the measured record for quality and the data used in the model for accuracy, consider alternative coefficients that may be more accurate, and consult other water quality measurements (i.e., Secchi depth and oxygen-temperature profile records).
Following a review of the model coefficients and monitoring data, predicted and measured values may still differ by more than 20 per cent. A test of the Lakeshore Capacity Model across many watersheds in Ontario suggests that, in general, the following lake types may not model well, because they fall beyond the calibration and test range of the model:
- Shallow lakes (lakes with mean depth < 5 metres): The lakeshore capacity model was calibrated on Precambrian Shield lakes that thermally stratify during the ice-free season. The model assumes a constant to estimate the rate of loss of phosphorus to lake sediments (i.e., the settling velocity, or mass transfer coefficient). This constant is modified depending on whether or not a lake’s hypolimnion is oxic or anoxic in late summer. For shallow lakes, the default values may overestimate the loss of phosphorus to sediments, as it does not account for P re-suspension during wind events.
- Tea-stained lakes (dissolved organic carbon concentrations > 10 mg/L): The model has not been calibrated for lakes that are highly coloured due to humic and fulvic acids. These lakes are common in northern Ontario, and may have relatively high background phosphorus concentrations.
- Lakes with small surface areas (< 25 ha): For very small lakes, minor differences in surface area can have a large impact on the model output. For example, the difference in surface area between a 25 and 20 ha lakes is small in absolute terms, but represents a 20% difference in relative size. This change in the model input may result in a significant increase in predicted P.
What if the model fails?
The Ministry recommends that the Lakeshore Capacity model be used to manage the effects of shoreline development and land-use change on P concentrations in Precambrian Shield lakes. As outlined in Appendix A, this approach allows resource managers and planning authorities to assess changes relative to lake-specific PWQOs for phosphorus, to assess future risks from the cumulative effects of development, and to protect the trophic diversity of lakes across the province. However, in some cases the model may not predict phosphorus concentrations within acceptable limits, putting into question its applicability. In these cases, it is recommended that the interim PWQO for phosphorus be followed as a guideline (Section 2.2).
In both cases, a total phosphorus concentration of 20 µg/L will be used as the upper limit to protect against nuisance algal blooms. In situations where a lake is naturally above 20 µg/L (e.g., highly coloured, tea-stained lakes), Regional MOE staff may use discretion to allow a limited amount of new development (e.g., < 10 lots), provided the lake is not sensitive, and downstream lakes are not designated at-capacity.
Changes to model assumptions
Over the past 30 years, some of the original assumptions and coefficients of the Lakeshore Capacity Model have been modified based on new scientific evidence. With the shift to municipalities for many responsibilities in land-use planning and in recognition of the need for a stable planning environment, questions have been raised about how best to continue with the process of updating assumptions. MOE recommends establishing a working group with representation from MOE, MNR, MMAH, municipalities and the private sector to periodically review major scientific advances and to discuss challenges to the model. Based on this information, the workgroup would consider if changes to the model are warranted.
Overview of the Lakeshore Capacity Model (4.4)
The Lakeshore Capacity Model will assess the lakeshore capacity of a specific lake. The model was developed and calibrated for Precambrian Shield lakes in south-central Ontario, but has been tested and used in lakes across the entire Precambrian Shield. At the end of the assessment process, the user will have had the opportunity to determine the amount of development — whether seasonal, permanent, resort or point source that each lake in a watershed could accommodate while adhering to its water quality targets.
Using the Lakeshore Capacity Model to assess the development capacity of a lake
- Modeling begins at the top of the watershed and continues downstream until the target lake is reached. The model is used to track phosphorus sources and the transport of phosphorus from one lake to the next downstream lake.
- The model calculates the total phosphorus (TP) concentration of a lake by calculating what the TP concentration would have been without shoreline development (the predevelopment concentration) and adding this amount to the current estimated TP contribution from shoreline development.
- The model can also be used to calculate the response of water quality to increases in shoreline development as well as the amount of additional development the target lake could tolerate while still adhering to its desired water quality targets. The model will also illustrate how changes in the upper watershed would influence the quality of water in downstream lakes.
- The user can compare the model results with the provincial water quality objectives for total phosphorus. The user can then determine the amount of development that could occur while still enabling these objectives to be met.
- The model translates water quality objectives (as µg/L phosphorus) into total allowable phosphorus load. The total allowable phosphorus load can either be expressed in kilograms or as the number of allowable cottages, permanent residences or resort units.
The Lakeshore Capacity Model is an assessment tool that is intended to be used by resource managers to predict the response of water quality to shoreline development. The municipal bodies surrounding the lake or the watershed are responsible for implementing the model predictions and allocating lakeshore capacity after the assessment has been completed.
Land use planning applications and best management practices (5.0)
Why use best management practices? (5.1)
Best management practices (BMPs) are practices that can help to reduce the migration of phosphorus from septic system effluents to water bodies, thereby reducing the effects of shoreline development on lake water quality. Coupled with lakeshore capacity assessment, BMPs will help municipalities maintain good lake water quality. On their own, BMPs can help to reduce the adverse effects of shoreline development on inland lakes.
Best management practices can take many forms. One category involves practices that can be implemented during the planning and construction phase of shoreline development and especially during the design and construction of septic systems. Other practices relate to the ongoing maintenance of a septic system and other operating practices of the cottage or homeowner. An overview of BMPs that lessen phosphorus migration is provided below. Sources of more detailed information on BMPs are listed in Appendix B.
As noted in Section 4.3, BMPs such as shoreline naturalization and vegetated buffer strips have been accepted in many jurisdictions as sound management practices for lakeshore properties. However, there is insufficient information on these techniques to reliably predict the level of nutrient control that may be achieved or their long-term effectiveness at reducing phosphorus loading. This is why the Lakeshore Capacity Model makes no allowances for mitigation of overland runoff through site engineering and vegetated buffers.
Involving residents and cottagers' associations in the voluntary adoption and promotion of BMPs is a useful way to introduce the notion of lake stewardship (caring for lakes). Where they exist, conservation authorities often have programs or communications materials that promote the use of BMPs.
Development and planning considerations (5.2)
This Handbook is a beneficial planning tool for approval authorities (municipalities, planning boards and MMAH) to use when reviewing planning applications adjacent to water bodies. A qualified consultant will likely undertake the modeling and provide interpretations and recommendations. This will assist decision makers when reviewing planning applications involving shoreline development.
Shoreline setbacks "in general"
The Ontario Building Code (OBC) sets a province-wide uniform standard requiring that there be a minimum of 15 metres clearance between a Class 4 or 5 Sewage System and any lakes, pond, spring, river or stream (as well as other water sources such as wells or reservoirs). This requirement is intended to mitigate pathogens that are harmful to humans from entering water bodies. There are no requirements in the building code that apply specifically to phosphorus.
To address possible impacts of development on fish habitat, municipalities may enact zoning bylaws setting out setbacks or other zoning provisions. These could, for example, set out setbacks greater than 15 metres or zone the shoreline to restrict locating of buildings or structures. Such bylaws would be established through the planning process under the Planning Act.
Throughout the Precambrian Shield soil cover is typically thin and fractured bedrock is common. For lakes in this environment, irrespective of whether or not they are at capacity for shoreline development, MOE and MNR recommends a minimum of 30 metre setback or a 30 metre non- development zone from water bodies. If natural heritage features are identified on or adjacent to a lot then additional appropriate setbacks or restrictive development zones might be required. Cottagers and lake residents are encouraged to provide as great a setback as possible to minimize the impact of development on lakes.
Vegetation and site preparation
Phosphorus is an essential element required to support plant growth. What is not broadly accepted scientifically, however, is the amount of phosphorus that is removed permanently by a vegetative buffer that may exist at the shoreline of the proposed lot. Because of this uncertainty, further studies should be completed to quantify the effectiveness and longevity of such techniques. Thus, as a default in Lakeshore Capacity modeling, the Handbook does not consider a retention rate for phosphorus for vegetative buffers. However, the model is flexible and a coefficient of this nature could be added in the future if new science supports its use; a vegetated buffer is still considered to be a Best Management Practice. For example, MNR recommends that generally 30 metres of natural vegetation be maintained or rehabilitated adjacent to fish habitat for its protection (Natural Heritage Reference Manual, 2nd Edition).
Where natural vegetation exists at the juncture of land and water, it should be maintained. Where this doesn't occur naturally, or has been removed, a vegetative buffer (riparian zone) of shrubs and ground cover can be planted along a shoreline bank. Preserving aquatic vegetation and retaining shoreline woodlots will also help to reduce phosphorus loadings. To capture and infiltrate runoff, infiltration trenches with filter fabric and crushed stone may be placed along the drip line of the cottage or house instead of traditional gutters and downspouts.
Septic system design
Cottagers and lake residents may take measures they consider will lessen the impact of their on-site sewage treatment on the environment as long as these measures do not impact negatively on any of the approved and OBC-required features of the sewage system. For example, acidic sites on non-calcareous sands (sands with low % calcium carbonate), may provide better phosphorus retention than sites on calcareous sands. Another example is the use of a siphon or pump to reduce phosphorus loading by providing an even distribution of septic tank effluents to the tile bed. Until a technology is proven effective over the long term, however, the phosphorus removal rate cannot be factored into the lakeshore capacity modeling.
What is a lake at capacity?
Lakes can be modeled to determine what their carrying capacities are with respect to phosphorus loading from shoreline development. Modeling takes into account vacant lots of record, incorporates assumptions that are inherent in the calculation of 'background' or 'undeveloped' conditions, and can be predictive with respect to any remaining capacity of the lake. See section 2.0 for a discussion on the link between phosphorus, dissolved oxygen, water quality, and lakeshore capacity. (See also Appendix A and references in Appendix B).
As set out in Section 2.2, the revised Provincial Water Quality Objectives (PWQO) for lakes on the Precambrian Shield allows a 50 per cent increase in phosphorus concentration from a modeled baseline of water quality in the absence of human influence. Based on this test, a lake would be 'at capacity' with respect to phosphorus if the modeling process determined that the existing development, including vacant lots of record, exceeded the modeled 'background' or 'undeveloped' concentration of (total) phosphorus, plus 50%.
In some cases, a lake may be considered to be 'at capacity' based on modeling results, but be 'below capacity' based on measured phosphorus concentrations, or vice versa. Because of natural variability in phosphorus concentrations over time, and inaccuracies in some model coefficients when applied to lakes across the Precambrian Shield, there is some error associated with the model predictions. Thus, we recommend that in cases where the predicted value is within 10% of the revised PWQO for total phosphorus (i.e., between background + 40% and background + 60%), that some flexibility be allowed when making management decisions. For example, further consideration should be given to a lake’s sensitivity24 to anthropogenic development and to other potential threats to water quality. If a lake has a history of nuisance algal blooms, or has undergone noticeable aesthetic changes in recent years (e.g., changes to water clarity), these observations should be considered as part of the overall management strategy for a lake.
The PWQO for dissolved oxygen allows for the establishment of more stringent criteria for the protection of specific, biologically-sensitive communities. A small percentage of all lakes provide suitable lake trout habitat. Low concentrations of dissolved oxygen in deeper water impair lake trout respiration, and therefore its metabolism, which compromises its ability to swim, feed, grow, and avoid predators. Studies have shown that juvenile lake trout need at least 7 milligrams (mg) of dissolved oxygen per Litre (L) of water to thrive and reproduce. The Ministry of Natural Resources consequently adopted a criterion of 7 mg/L dissolved oxygen measured as mean volume-weighted hypolimnetic concentration at the end-of-summer, to protect lake trout habitat. This is considered to be a scientifically established standard (for purposes of the PPS, 2005). For more information on this criterion, and how it is measured, please see references in Appendix B.
To protect natural heritage features, including fish habitat, policy 2.1.6. of the PPS (2005) includes direction that development and site alteration shall not be permitted on adjacent lands to the natural heritage features and areas unless the ecological function of the adjacent lands has been evaluated and it has been demonstrated that there will be no negative impacts on the natural features or on their ecological functions. Further to this, policy 2.1.5. of the PPS (2005) provides that development and site alteration shall not be permitted in fish habitat except in accordance with provincial and federal requirements. Provincial and federal requirements are defined in the PPS (2005) as legislation and policies administered by the federal and provincial governments for the purpose of protection of fish and fish habitat, and related, scientifically- established standards such as water quality criteria for protecting lake trout populations.
Requirements and restrictions for development on lakes at capacity
The following applies to lakes that have been modeled to be at-capacity for phosphorus (i.e., phosphorus concentrations exceed 'background' or 'undeveloped' concentrations + 50%), or have modeled or measured dissolved oxygen concentrations that are less than MNR's criterion for lake trout lakes (i.e., less than 7 mg/L dissolved oxygen, measured as mean volume-weighted hypolimnetic dissolved oxygen concentration at end-of-summer). Where these circumstances exist, new lot creation and other planning approvals should only be allowed:
- to separate existing habitable dwellings, each of which is on a lot that is capable of supporting a Class 4 sewage system, provided that the land use would not change and there would be no net increase in phosphorus loading to the lake;
- where all new tile fields would be located such that they would drain into a drainage basin which is not at capacity; or
- where all new tile fields would be set back at least 300 metres from the shoreline of lakes, or such that drainage from the tile fields would flow at least 300 metres to the lake25; and,
The following additional site-specific criteria can be applied where new development is proposed on at-capacity lakes and where certain municipal planning tools and agreements are in place such as a Development Permit System under the Planning Act, and/or site plan control under the Planning Act, and site alteration and tree-cutting by-laws under the Municipal Act:
- where a site-specific soils investigation prepared by a qualified professional26 has been completed showing the following site conditions:
- the site where the septic tile-bed is to be located, and the region below and 15 metres down-gradient of this site, toward the lakeshore or a permanently-flowing tributary, across the full width of the tile bed, consist of deep (more than three metres), native and undisturbed, non-calcareous (<1% CaCO3 equivalent by weight) overburden with acid-extractable concentrations of iron and aluminum of >1% equivalent by weight (following Robertson 2005, 2006, Appendix B). Soil depth shall be assessed with test pits and/or boreholes at several sites. Samples for soils chemistry should be taken at a depth adjacent to, or below, the proposed tile bed; and
- an unsaturated zone of at least 1 ½ metres depth exists between the tile bed and the shallowest depth (maximum) extent of the water table. The position of the water table shall be assessed with test pits during the periods of maximum soils saturation (e.g., in the spring, following snowmelt, or late fall)
Given that some relevant measures are not applicable law under the Ontario Building Code, agreements pursuant to the Planning Act that are registered on title will be needed to ensure the following for each lot created:
- design of the septic system shall include pump-dosing or equivalent technology to uniformly distribute septic effluent over the tile bed;
- no add-on system components such as water-softening apparatus, to ensure the proper functioning of the septic tank-tile bed system over the long-term;
- provision of a 30-metres minimum undisturbed shoreline buffer and soils mantle, with the exception of a pervious pathway;
- preparation of a stormwater management report and a construction mitigation plan (including phosphorus attenuation measures such as directing runoff and overland drainage from driveways, parking areas, other hard surfaces to soak away pits, infiltration facilities);
- location of the tile bed, in accordance with the recommendations of the site-specific soils investigation;
- long-term monitoring – for research purposes – of the sewage disposal system and reports to the planning approval authority and the Ministry of Environment. Monitoring would commence from the time of installation of the sewage treatment systems and proceed for at least 10 years. This monitoring will, at a minimum, include:
- sampling locations immediately below the tile bed, down-gradient of the tile bed, and at least one site up-gradient of the tile bed;
- collection of groundwater samples by a certified professional. All samples should be field filtered (0.45 µm) prior to atmospheric exposure. Samples for PO43- (or TP) and Fe should be acidified in the field (pH < 2) with HCl or H2SO4, and analysed within two weeks of collection; and
- chemical analyses should also include pH, chloride, total or dissolved phosphorus, nitrate, ammonium and iron;
- sampling to occur annually (mid-summer) for the first five years, and once (mid-summer) every five years thereafter
BMPs for maintenance and operation (5.3)
Inspection and Regulation
Septic systems are regulated by provisions in the Building Code. Systems are required to perform based on the standard or requirements in place when the system was approved for use. If a system is not performing to the standard required of it and an inspector believes the system presents a health hazard, remedial steps may be required of the owner to bring the septic system into compliance.
Septic system operation and maintenance
Septic systems contained on one lot with a designed sewage flow of not more than 10,000 litres per day are regulated through the Building Code Act (1992) and the Building Code, which are administered by the Ministry of Municipal Affairs and Housing. The Building Code contains technical requirements that must be met when constructing a new septic system, or when extending, repairing or altering an existing system. The Code also mandates that owners of septic systems operate and maintain their systems in accordance with requirements to which they were designed. Under the act, enforcement bodies have the authority to determine whether existing systems are unsafe, to issue orders where unsafe conditions are found and, in extreme conditions, to remediate dangerous situations at the owner’s expense.
All household sewage waste should be discharged into its septic tank. Wastewater (grey water) from laundry and saunas shouldn't be discharged directly into the drain field as the detergent and soap scum will quickly clog soil pores and cause the septic system to fail.
Starters shouldn't be added to septic systems as enough bacteria are available in the wastes that are flushed into the septic tank. Septic systems should be pumped out every three to five years to remove solids and scum. While the tank is being pumped out, the cover should be removed to make sure that all solids are pumped out. Pumping through the inspection port may clog the outlet baffle with scum and grease.
Water conservation
Excessive water use is the most common cause of septic failure. Residents should be encouraged to reduce as much as possible the amount of water they use for bathing, laundry and flushing the toilet.
Shoreline vegetation
Surface waters can be contaminated by soil particles that have been washed or blown into the water. In addition to reducing water clarity, these particles may also carry phosphorus into the water. Residents can minimize soil erosion by retaining a vigorously growing filter zone (or buffer) of native grasses, trees and shrubs beside the lake and along any streams that empty into the lake. Residents can also reduce erosion by maintaining native vegetation throughout their properties to minimize areas of exposed soil. The use of native vegetation as a ground cover instead of a lawn is especially beneficial as it doesn't require the application of pesticides and phosphorus-rich fertilizers that can add to water quality problems. Minimizing the amount of impermeable surfaces such as concrete or asphalt will reduce stormwater runoff and its erosive effects.
Phosphorus abatement technologies (5.4)
In recent years, interest has grown in the potential to reduce phosphorus loadings to inland lakes by using technologies such as different filter media for septic systems. Currently, approval of conventional septic systems is carried out under the Ontario Building Code. This statute sets out septic system requirements including distance from water and size.
The Lakeshore Capacity Model takes into account the phosphorus load from conventional sewage treatment systems. The model allows for the phosphorus load to be varied if phosphorus abatement or phosphorus removal technologies are used. Currently, the Ontario government hasn't acknowledged any technologies as being suitable to be installed with, or instead of, small-scale subsurface sewage treatment systems for individual dwellings, cottages or other small buildings.
17 Dillon. P.J. and F.H. Rigler. 1975. A simple method for predicting the capacity of a lake for development based on lake trophic status. J. Fish. Bd. Can. 32: 1519-1531.
18 Ontario Ministry of Municipal Affairs and Housing (Research and Special Projects Branch). 1983-1986.
Lakeshore Capacity Study. Queen’s Printer for Ontario:
- Committee Report
- Land use (Downing, J.C. 1986. Ministry of Municipal Affairs and Housing)
- Fisheries (McCombie, A.M. 1983. Ministry of Natural Resources)
- Microbiology (Burger, C.A. 1983. Ministry of the Environment)
- Trophic Status (Dillon, P.J., Nicholls, K.H., Scheider, W.A, Yan, N.D. and Jeffries, D.S. 1986. Ministry of the Environment)
- Wildlife (Euler, D.L. 1983. Ministry of Natural Resources)
- Integration (Teleki, G. 1986. Ministry of Municipal Affairs and Housing)
19 Dillon, P.J., K.H. Nicholls, W.A. Scheider, N.D. Yan, and D.S. Jeffries. 1986. Lakeshore Capacity Study – Trophic Status. Ont. Min. Muncip. Affairs Tech. Report. Table 29.
20 Robertson W.D., S.L. Schiff and C.J. Ptacek, 1998. Review of phosphate mobility and persistence in 10 septic system plumes. Groundwater. 36: 1000-1010.
21 Robertson, W.D. 2003. Enhances attenuation of septic system phosphate in noncalcareous sediments. Groundwater. 41: 48-56.
22 References in footnotes 19 and 20, and: Robertson, W.D. Robertson. 2005. 2004 Survey of phosphorus concentrations in five central Ontario septic system plumes. Technical Report prepared for the Ontario Ministry of the Environment, Dorset Environmental Science Centre. 24 pp.; and Robertson, W.D. 2006. Phosphorus distribution in a septic system plume on thin soil terrain in Ontario cottage country. Technical Report prepared for the Ontario Ministry of the Environment, Dorset Environmental Science Centre. 16 pp.
23 Zanini, L., Roberston, W.D., Ptacek, C.J., Schiff, S.L., and Mayer, T. 1998. Phosphorus characterization in sediments impacted by septic effluent at four sites in central Canada. Journal of Contaminant Hydrology. 33: 405-429.
24 Sensitivity can be broadly defined as the degree of change in phosphorus (P), relative to background conditions, that a lake experiences with shoreline development. The relative sensitivities of lakes within a watershed can be tested by adding a set P load to all lakes, standardized to lake area, and comparing the resultant changes in predicted P concentrations.
25 Sewage effluent travels from the infiltration bed to the receiving water body in both the unsaturated and saturated zone of the sub-surface. Most commonly, the effluent pathway within the unsaturated zone is considered to be directly downward. After reaching the water table, effluent is transported with local groundwater along the groundwater gradient, which is generally in the direction of the shortest linear distance to the receiving water body. The effluent pathway may vary from the above definition under the following circumstances: 1) the effluent flow path may vary from vertical in the vadose zone if site conditions promote horizontal flow. These conditions may include topographic influences or hydraulic variations in subsurface stratigraphy. The potential for horizontal flow should be evaluated on a site specific basis; and 2) the effluent flow path in the saturated zone may vary from the shortest distance to the receiving water body. This may occur because of topographic or bedrock structural features (e.g., orientation of dominant fracture patterns). In such cases, the inference of a groundwater flow direction that is not directly to the receiving water body must be supported by hydrogeological data. This may require the identification of the groundwater gradient through measured potentiometric surface elevations at several piezometers and, or characterization of structural geology.
26 Qualified professional is defined here as a licensed member of the Association of Professional Geoscientists of Ontario or the Professional Engineers of Ontario who is qualified to practice geoscience.