Appendix A – Statistical charts
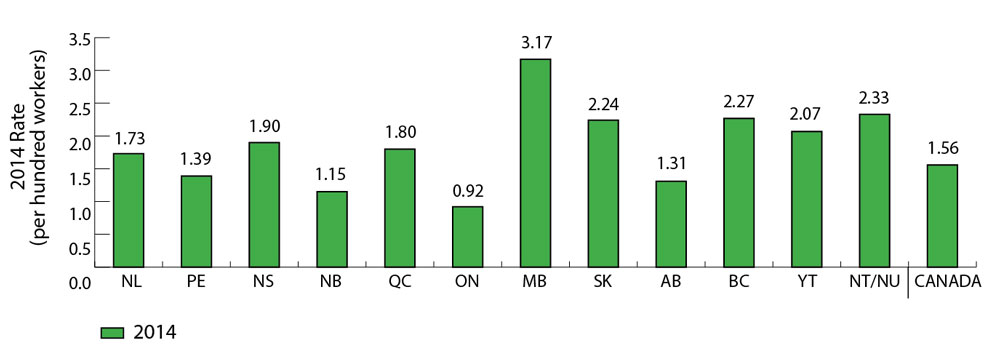
Figure 1: Allowed lost-time injury rate (provinces and territories of Canada)
| 2005 | 2006 | 2007 | 2008 | 2009 | 2010 | 2011 | 2012 | 2013 | 2014 | |
|---|---|---|---|---|---|---|---|---|---|---|
| NL | 2.52 | 2.36 | 2.25 | 2.15 | 2.07 | 2.03 | 1.99 | 1.76 | 1.78 | 1.73 |
| PE | 1.42 | 1.35 | 1.37 | 1.35 | 1.33 | 1.21 | 1.28 | 1.35 | 1.22 | 1.39 |
| NS | 3.03 | 2.80 | 2.72 | 2.59 | 2.33 | 2.21 | 2.08 | 2.01 | 1.92 | 1.90 |
| NB | 1.42 | 1.33 | 1.36 | 1.36 | 1.29 | 1.35 | 1.26 | 1.18 | 1.13 | 1.15 |
| QC | 2.88 | 2.69 | 2.44 | 2.32 | 2.02 | 1.97 | 1.93 | 1.85 | 1.82 | 1.80 |
| ON | 1.79 | 1.61 | 1.53 | 1.45 | 1.20 | 1.15 | 1.05 | 1.01 | 0.95 | 0.92 |
| MB | 4.75 | 4.65 | 4.31 | 4.08 | 3.54 | 3.37 | 3.27 | 3.33 | 3.12 | 3.17 |
| SK | 3.95 | 3.93 | 3.72 | 3.57 | 3.33 | 3.15 | 2.90 | 2.81 | 2.57 | 2.24 |
| AB | 2.23 | 2.24 | 1.98 | 1.73 | 1.51 | 1.42 | 1.49 | 1.39 | 1.34 | 1.31 |
| BC | 3.09 | 3.12 | 3.06 | 2.96 | 2.35 | 2.27 | 2.33 | 2.34 | 2.30 | 2.27 |
| YT | 2.33 | 2.63 | 2.90 | 2.73 | 2.38 | 2.12 | 2.28 | 2.14 | 1.87 | 2.07 |
| NT/NU | 2.74 | 2.71 | 2.73 | 2.51 | 2.17 | 2.45 | 2.37 | 2.13 | 2.21 | 2.33 |
| Canada | 2.56 | 2.39 | 2.24 | 2.12 | 1.82 | 1.76 | 1.72 | 1.65 | 1.60 | 1.56 |
Source: Association of Workers Compensation Boards of Canada (AWCBC), accompanying notes available on AWCBC website.
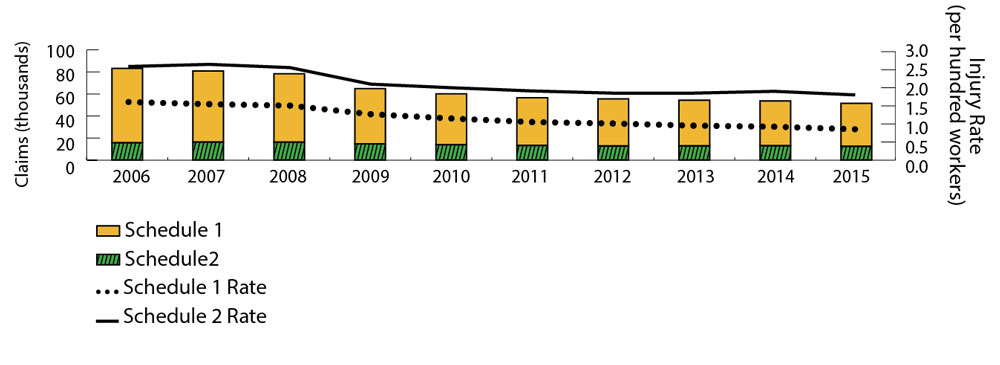
Figure 2: Workplace Safety and Insurance Board allowed lost-time injury claims/rates (year of injury/illness)
| 2006 | 2007 | 2008 | 2009 | 2010 | 2011 | 2012 | 2013 | 2014 | 2015 | |
|---|---|---|---|---|---|---|---|---|---|---|
| Schedule 1 | 67,406 | 64,531 | 61,992 | 50,104 | 46,160 | 43,371 | 42,702 | 41,508 | 40,585 | 38,953 |
| Schedule 2 | 15,778 | 16,339 | 16,268 | 14,739 | 14,040 | 13,301 | 12,823 | 12,922 | 13,103 | 12,617 |
| Total | 83,184 | 80,870 | 78,260 | 64,843 | 60,200 | 56,672 | 55,525 | 54,430 | 53,688 | 51,570 |
| Schedule 1 Rate (per hundred workers) | 1.61 | 1.55 | 1.51 | 1.27 | 1.15 | 1.05 | 1.01 | 0.95 | 0.92 | 0.85 |
| Schedule 2 Rate (per hundred workers) | 2.59 | 2.65 | 2.56 | 2.10 | 2.00 | 1.91 | 1.85 | 1.85 | 1.90 | 1.80 |
Source: Workplace Safety and Insurance Board By the Numbers 2015, Schedule 1 and Schedule 2.
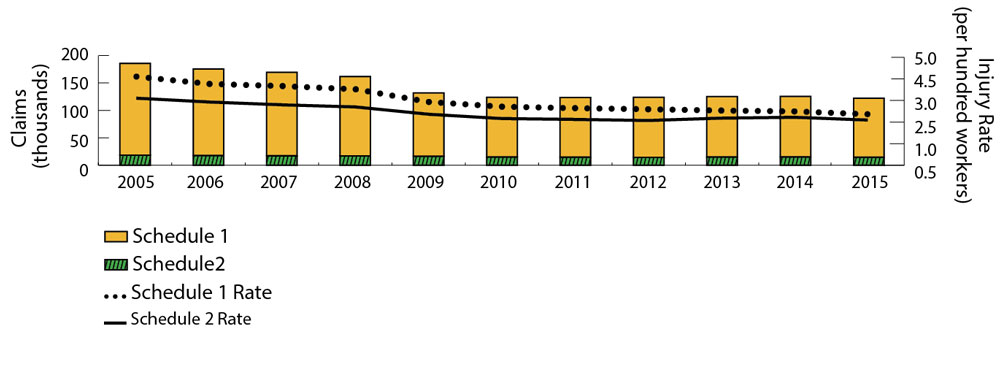
Figure 3: Workplace Safety and Insurance Board allowed no lost-time injury claims/rates (year of injury/illness)
| 2006 | 2007 | 2008 | 2009 | 2010 | 2011 | 2012 | 2013 | 2014 | 2015 | |
|---|---|---|---|---|---|---|---|---|---|---|
| Schedule 1 | 167,382 | 157,487 | 144,489 | 115,340 | 108,660 | 108,954 | 109,648 | 110,120 | 110,196 | 107,504 |
| Schedule 2 | 18,355 | 17,816 | 17,182 | 16,503 | 15,192 | 15,192 | 14,371 | 15,208 | 15,328 | 14,629 |
| Total | 185,737 | 169,638 | 161,671 | 131,843 | 123,852 | 123,675 | 124,019 | 125,328 | 125,524 | 122,133 |
| Schedule 1 Rate (per hundred workers) | 4.11 | 3.77 | 3.52 | 2.93 | 2.71 | 2.64 | 2.59 | 2.53 | 2.49 | 2.36 |
| Schedule 2 Rate (per hundred workers) | 3.11 | 2.93 | 2.70 | 2.36 | 2.16 | 2.12 | 2.18 | 2.18 | 2.22 | 2.09 |
Source: Workplace Safety and Insurance Board By the Numbers 2015, Schedule 1 and Schedule 2.
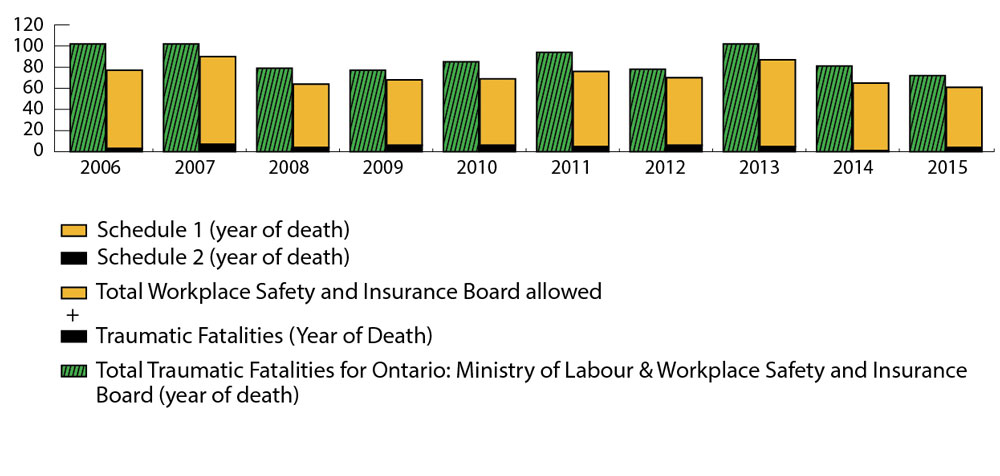
Figure 4: Traumatic fatalities (year of death)
| 2006 | 2007 | 2008 | 2009 | 2010 | 2011 | 2012 | 2013 | 2014 | 2015 | |
|---|---|---|---|---|---|---|---|---|---|---|
| Schedule 1 (year of death) | 74 | 83 | 60 | 62 | 63 | 71 | 64 | 82 | 64 | 57 |
| Schedule 2 (year of death) | 3 | 7 | 4 | 6 | 6 | 5 | 6 | 5 | 1 | 4 |
| Total WSIB allowed Traumatic Fatalities (year of death) | 77 | 90 | 64 | 68 | 69 | 76 | 70 | 87 | 65 | 61 |
| Total Traumatic Fatalities for Ontario: Ministry of Labour and WSIB (year of death) | 102 | 102 | 79 | 77 | 85 | 94 | 78 | 102 | 81 | 72 |
Source: Workplace Safety and Insurance Board (WSIB) By the Numbers 2015, Schedule 1 and Schedule 2 and Workplace Safety and Insurance Board Day of Mourning Fatalities Report: 2006 to 2015.
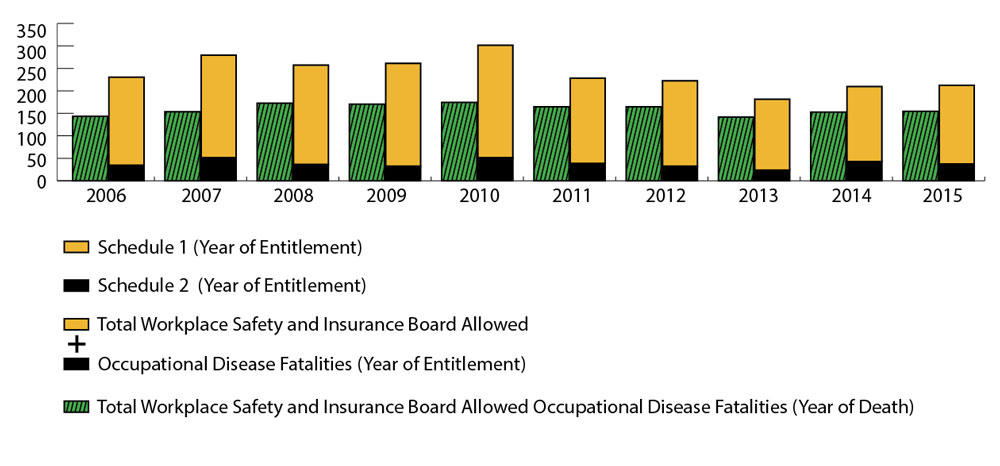
Figure 5: Allowed occupational disease fatalities
| 2006 | 2007 | 2008 | 2009 | 2010 | 2011 | 2012 | 2013 | 2014 | 2015 | |
|---|---|---|---|---|---|---|---|---|---|---|
| Schedule 1 (year of entitlement) | 196 | 228 | 221 | 229 | 250 | 190 | 190 | 158 | 167 | 175 |
| Schedule 2 (year of entitlement) | 34 | 51 | 36 | 32 | 51 | 38 | 32 | 23 | 42 | 37 |
| Total WSIB allowed Occupational Disease Fatalities (year of entitlement) | 230 | 279 | 257 | 261 | 301 | 228 | 222 | 181 | 209 | 212 |
| Total WSIB Allowed Occupational Disease Fatalities (year of death) | 143 | 153 | 172 | 170 | 174 | 164 | 164 | 141 | 152 | 154 |
Sources: Workplace Safety and Insurance Board (WSIB) By the Numbers 2015, Schedule 1 and Schedule 2 and Workplace Safety and Insurance Board Day of Mourning Fatalities Report: 2006 to 2015.
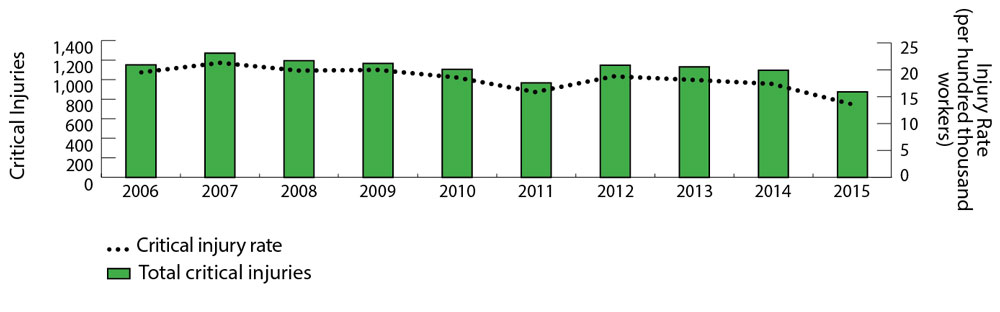
Figure 6: Ministry of Labour reported critical injuries and critical injury rate (year of injury)
| 2006 | 2007 | 2008 | 2009 | 2010 | 2011 | 2012 | 2013 | 2014 | 2015 | |
|---|---|---|---|---|---|---|---|---|---|---|
| Total Critical Injuries | 1,150 | 1,270 | 1,194 | 1,166 | 1,104 | 966 | 1,147 | 1,130 | 1,095 | 873 |
| Critical Injury Rate | 19.49 | 21.22 | 19.81 | 19.93 | 18.56 | 15.91 | 18.76 | 18.12 | 17.40 | 13.75 |
Source: Ministry of Labour Data Systems 2006 to 2015 and Ministry of Labour calculation based on Statistics Canada Labour Force Survey 2006 to 2015.
Note: Critical injury rates are calculated by the Ministry of Labour based on the number of reported critical injuries divided by the number of people employed under provincial jurisdiction.
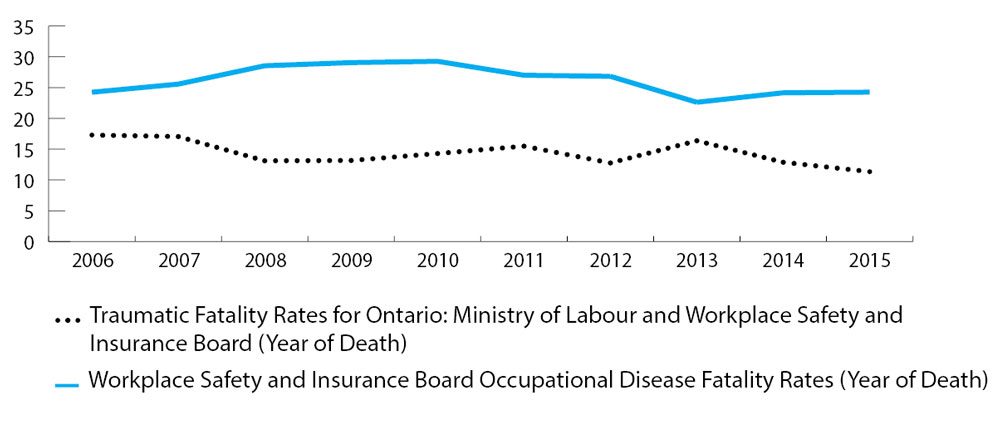
Figure 7: Traumatic and occupational disease fatality rates (year of death)
| 2006 | 2007 | 2008 | 2009 | 2010 | 2011 | 2012 | 2013 | 2014 | 2015 | |
|---|---|---|---|---|---|---|---|---|---|---|
| Traumatic Fatality Rates for Ontario (per million workers): Ministry of Labour and WSIB (Year of Death) | 17.29 | 17.04 | 13.11 | 13.16 | 14.29 | 15.48 | 12.76 | 16.36 | 12.87 | 11.34 |
| WSIB Occupational Disease Fatality Rates (Year of Death) | 24.24 | 25.56 | 28.54 | 29.05 | 29.26 | 27.00 | 26.82 | 22.61 | 24.15 | 24.24 |
Sources: Workplace Safety and Insurance Board Day of Mourning Fatalities Report: 2006 to 2015 and Ministry of Labour calculation based on Statistics Canada Labour Force Survey 2006 to 2015.
Note: Fatality rates are calculated by the Ministry of Labour based on the number of reported fatalities divided by the number of people employed under provincial jurisdiction.
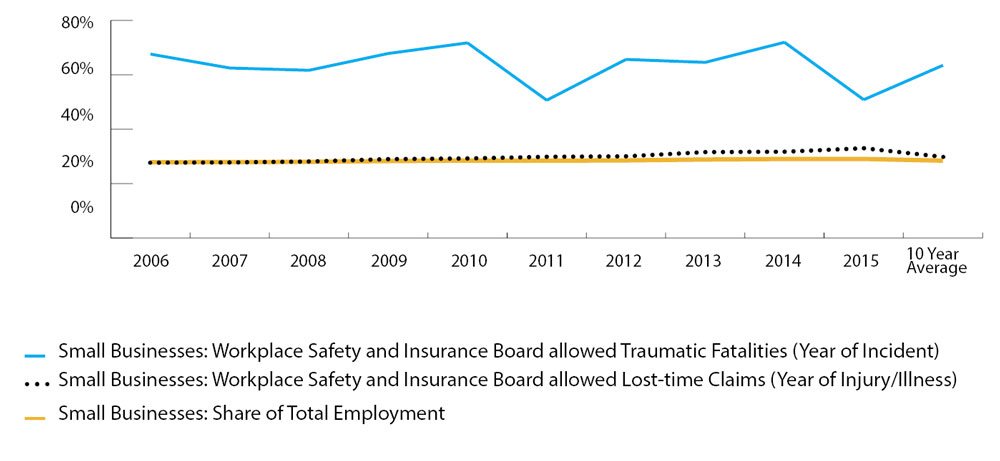
Figure 8: Small businesses: traumatic fatalities, allowed lost-time injury claims and employment as share of total fatalities, allowed lost-time claims and employment (schedule 1)
| 2006 | 2007 | 2008 | 2009 | 2010 | 2011 | 2012 | 2013 | 2014 | 2015 | 10 Year Average | |
|---|---|---|---|---|---|---|---|---|---|---|---|
| WSIB allowed Traumatic Fatalities | 67.57% | 62.50% | 61.67% | 67.80% | 71.67% | 50.75% | 65.63% | 64.56% | 71.88% | 50.94% | 63.49% |
| WSIB allowed Lost-time Claims | 27.82% | 27.92% | 28.24% | 29.07% | 29.32% | 29.89% | 30.05% | 31.52% | 31.65% | 32.87% | 29.84% |
| Share of Total Employment | 28.01% | 28.05% | 28.10% | 28.33% | 28.47% | 28.44% | 28.52% | 28.77% | 28.91% | 28.92% | 28.45% |
Sources: Workplace Safety and Insurance Board (WSIB) data 2006 to 2015 and CANSIM table 282-0042.
Data limitations and methodology in this report
The occupational health and safety data in this report is limited:
- Ministry of Labour enforcement data may be subject to change as a result of ongoing enforcement activities and investigation of events.
- Statistics recorded by the Ministry of Labour and the Workplace Safety and Insurance Board are not directly comparable. Each organization tracks incidents based on its organizational mandate and legislative obligations. For example, a fatality or injury that is reported to the Ministry of Labour may not be reported to the Workplace Safety and Insurance Board, creating differences in the number of incidents recorded.
- Critical injuries include only those that have been reported to the ministry and not necessarily critical injuries as defined by the Occupational Health and Safety Act (OHSA). The Ministry of Labour investigates workers covered by the OHSA. Critical injuries in the ministry’s data systems may include non-workers, as this is required to be reported. This represents data that was reported to the ministry and may not represent what actually occurred at the workplace.
- The Ministry of Labour tracks and reports fatalities at workplaces covered by the Occupational Health and Safety Act. This excludes death from natural causes, death of non-workers at a workplace, suicides, death as a result of a criminal act or a traffic accident (unless the OHSA is also implicated) and death from occupational exposures that occurred many years ago.
- Some statistics may exclude certain individuals not covered under the Workplace Safety and Insurance Act, 1997.
- Statistics may be affected by a lag between the date of the incident and the assessment of whether it was work-related.
- Many factors influence workplace safety, such as societal, workforce and workplace trends. Therefore, improvements in rates of occupational illness, injury and fatality cannot be attributed solely to the activities in this report.