2016-17 Third Quarter Finances
February 2017
The Third Quarter Financial Report contains information on Ontario's fiscal outlook for 2016-2017, as of December 31 2016.
Introduction
The Ontario Quarterly Finances contains updated information about Ontario's 2016–17 fiscal outlook, including updated information about the major components of revenue and expense as set out in the 2016 Budget.
Section A: 2016–17 fiscal outlook
The government is projecting a deficit of $1.9 billion in 2016–17, an improvement of $2.4 billion compared to the 2016 Budget. This marks the eighth year in a row that the government is projected to beat its deficit target.
The strength of Ontario's economy, together with the government's approach to fiscal management, is supporting strategic investments while allowing the government to continue to beat its deficit targets. New investments being reported in the 2016–17 Third Quarter Finances include: additional funding requirements for drug benefits and supporting additional capacity for malignant hematology treatment, including stem cell transplants.
Ontario's economic growth outlook remains largely consistent with the forecast in the 2016 Ontario Economic Outlook and Fiscal Review. Steady growth in the U.S. economy, along with the ongoing impacts of a more competitive Canadian dollar and low oil prices, continues to support Ontario's economic growth. However, there are risks to the economic growth outlook. Notably, interest rates have started to rise, which may dampen overall economic activity.
The government is projecting a net debt-to-GDP ratio of 38.3 per cent for 2016–17, an improvement compared to the 2016 Budget projection of 39.6 per cent.
Accounting treatment for jointly sponsored pension plans
In preparing the Public Accounts of Ontario 2015–2016, the Province's professional accounting staff and the Auditor General's Office engaged in discussions about the appropriate interpretation of public-sector accounting standards in relation to accounting for jointly sponsored pension plans.
In the Public Accounts of Ontario 2015–2016, the government adopted the Auditor General's accounting interpretation for the treatment of net pension assets for 2015–16 through a time-limited regulatory amendment (the "Pension Adjustment"). Consistent with this treatment, the 2016 Ontario Economic Outlook and Fiscal Review took a cautious approach to forecasting the Pension Adjustment, which resulted in an impact over the outlook, including $2.2 billion in additional expense in 2016–17.
To confirm the appropriate interpretation of public-sector accounting standards, the government established an independent Pension Asset Expert Advisory Panel in November 2016.
The Panel recently released its report, including a recommendation that jointly sponsored net pension assets be recognized on the Province's financial statements. The government has accepted the Panel's advice. As a result, the Pension Adjustment for the Ontario Public Service Employees' Union Pension Plan and the Ontario Teachers' Pension Plan has been reversed. The reversal aligns with the treatment originally included in the 2016 Budget plan, and is consistent with how the standard has been applied to these plans over the past 15 years.2016–17 In-year fiscal performance
| Item | 2016–17 Budget Plan |
2016–17 Current Outlook |
2016–17 In-Year Change |
|---|---|---|---|
| Revenue | 130,589 | 133,113 | 2,524 |
| Expense - Programs | 122,139 | 123,258 | 1,118 |
| Expense - Interest on Debt | 11,756 | 11,375 | (381) |
| Total Expense | 133,895 | 134,633 | 737 |
| Surplus/(Deficit) Before Reserve | (3,306) | (1,520) | 1,786 |
| Reserve | 1,000 | 400 | (600) |
| Surplus/(Deficit) | (4,306) | (1,920) | 2,386 |
Note: Numbers may not add due to rounding.
Total revenue is projected to be $133.1 billion, an improvement of $2.5 billion compared to the 2016 Budget. This increase is largely due to higher-than-expected revenues arising from processing of 2015 income tax returns and the housing market. This is partially offset by lower Government of Canada Transfers for home care and infrastructure than anticipated in the 2016 Budget. In addition, proceeds from Ontario's first cap-and-trade auction, which is scheduled for March 2017, will be accounted for in the 2017–18 fiscal year rather than in 2016–17, based on the expected date of certification and settlement of proceeds.
The outlook for Provincial program expense is $123.3 billion, an increase of $1.1 billion compared to the 2016 Budget projection — reflecting strategic investments in areas such as health care and electricity cost relief that took effect on January 1, 2017.
Interest on debt expense for 2016–17 is forecast to be $11.4 billion, $0.4 billion lower than forecast in the 2016 Budget due to a combination of lower-than-forecast borrowing requirements and interest rates. This is unchanged from what was reported in the 2016< Ontario Economic Outlook and Fiscal Review.
The 2016–17 outlook maintains a $0.4 billion reserve to protect the fiscal outlook against unforeseen adverse changes in the Province's revenue and expense that could arise before year-end.
Further details on the Province's fiscal plan will be provided in the upcoming 2017 Budget.
Section B: Details of in-year changes
Revenue
The 2016–17 revenue outlook, at $133.1 billion, is $2.5 billion higher than the 2016 Budget forecast. This is due to the following developments:
- Corporations Tax revenues are $1,041 million above the 2016 Budget projection based on higher revenues indicated by 2015 tax returns processed since the 2016 Budget. Tax reassessments for years prior to 2015 also boost the outlook in 2016–17.
- Sales Tax revenues are $803 million higher than projected in the 2016 Budget estimate, largely due to higher 2015 Harmonized Sales Tax (HST) entitlement estimates. This estimate increased largely due to strong 2015 performance in the Ontario housing market, which increased Ontario's share of the HST revenue pool.
- Personal Income Tax and Ontario Health Premium revenues combined are $728 million higher, largely due to stronger 2015 revenues indicated through processing of tax returns.
- Land Transfer Tax is $514 million above the 2016 Budget projection, reflecting the ongoing gains in Ontario housing resales and prices.
- All Other Tax revenues combined are down $118 million, mainly due to lower revenues from Employer Health Tax and Fuel Tax, partially offset by higher revenues from Education Property Tax.
- Government of Canada Transfers are $176 million lower, mainly due to lower transfers for home care and infrastructure than anticipated in the 2016 Budget. Funding announced since the 2016 Budget for affordable housing, postsecondary education, clean water and wastewater projects, and support for prevention initiatives in First Nation communities is included in the outlook.
- Income from Government Business Enterprises is $185 million higher, reflecting stronger 2016–17 year-to-date performances of the Ontario Lottery and Gaming Corporation and Liquor Control Board of Ontario.
- Other Non-Tax Revenue is $453 million lower, mainly reflecting a shift in reporting of $478 million in projected cap-and-trade auction proceeds for the March 2017 auction from 2016–17 to 2017–18, based on the expected date of certification and settlement of proceeds, and small changes in 2016–17 to net revenue impacts from the multi-year asset optimization strategy. These are partially offset by higher projected revenue related to recoveries of prior-year expenditures based on 2015–16 results.
There are still risks to the revenue outlook that could result in changes by the time of the 2017 Budget. These include potential revisions to the economic outlook, tax receipts from provincially administered taxes and updates from government ministries, business enterprises and consolidated business organizations.
In addition, beginning in the 2017 Budget, the reported revenues related to electricity sector business enterprises will reflect a change in the basis of consolidation from Generally Accepted Accounting Principles in the United States (US GAAP) to International Financial Reporting Standards (IFRS) effective April 1, 2016, consistent with the Auditor General's recommendation. The impact of this change is not expected to be significant for 2016–17.
Expense
The 2016–17 total expense outlook is $134.6 billion, $0.7 billion higher than the 2016 Budget forecast. Since the 2016 Ontario Economic Outlook and Fiscal Review, the following program expense changes have occurred and have been accommodated within the fiscal plan.
Key changes to program expense with offsets from the contingency funds include:
- Criminal Justice System Reforms: an investment of $10.4 million for immediate actions to modernize the correctional services system, including improving conditions of confinement, providing appropriate alternatives to segregation, improving mental health capacity, reducing time to trial and enhancing the bail and remand system.
- First Nations Policing Wage Parity: an investment of $6.5 million to support wage parity for the Nishnawbe-Aski Police Service for First Nations Constables employed under the Ontario First Nations Policing Agreement.
- International Disaster Relief Program: a one-time contribution to the Canadian Red Cross of $0.3 million to support disaster relief efforts in Haiti, following Hurricane Matthew.
Other key changes to program expense include:
- Ontario Drug Benefit Program: an additional $106.0 million to address funding requirements for the Ontario Drug Benefit program.
- Malignant Hematology including Stem Cell Transplants: an investment of $95.4 million to support additional capacity to provide stem cell transplants in Ontario, which require specialized facilities and staffing, including creating a new unit at Sunnybrook Health Sciences Centre, as well as OHIP out-of-country costs for stem cell transplants that cannot be accommodated in Ontario.
- Prevention Initiatives in First Nation Communities: a one-time flow-through of federal funding of $5.8 million to support mental health and suicide prevention programming for children and youth in 132 First Nation communities.
Interest on debt expense for 2016–17 is forecast to be $11.4 billion, $0.4 billion lower than forecast in the 2016 Budget due to a combination of lower-than-forecast borrowing requirements and interest rates. This is unchanged from what was reported in the 2016 Ontario Economic Outlook and Fiscal Review.
Fiscal prudence
The 2016–17 outlook maintains a $0.4 billion reserve, $0.6 billion lower than in the 2016 Budget and unchanged from the 2016 Ontario Economic Outlook and Fiscal Review. Maintaining the reserve at this level protects the fiscal outlook against unforeseen adverse changes in the Province's revenue and expense that may occur before year-end.
The current outlook also maintains contingency funds of $0.6 billion to help mitigate expense risks – particularly in cases where health and safety may be compromised or services to the most vulnerable are jeopardized – that may otherwise adversely affect Ontario's fiscal performance.
Section C: Ontario's economic outlook
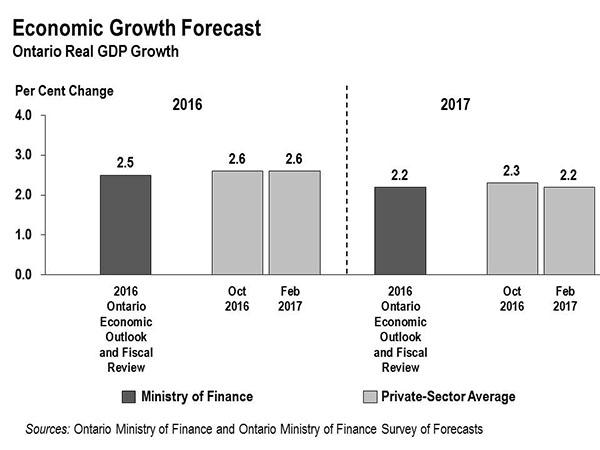
Ontario's economic growth outlook remains consistent with the 2016 Ontario Economic Outlook and Fiscal Review forecast. As of February 8, 2017, private-sector forecasters, on average, project Ontario real GDP to increase by 2.6 per cent in 2016 and 2.2 per cent in 2017, both similar to the time of the 2016 Ontario Economic Outlook and Fiscal Review.
There are risks to the economic outlook. Notably, interest rates have started to rise, which may dampen overall economic activity.
Section D: Economic performance
Despite an uncertain global environment, Ontario's economy continues to grow. Real GDP advanced by 0.7 per cent in the third quarter of 2016, led by growth in exports, household spending and housing investment. Over the first three quarters of 2016, Ontario's real GDP growth outpaced that of all G7 countries.
The strength in Ontario's economy has supported steady employment gains. A total of 76,400 net new jobs were added in 2016, accelerating from the growth recorded in the previous two years. The unemployment rate has also shown a marked improvement. As of January 2017, the unemployment rate was 6.4 per cent, below the national average for the 22nd consecutive month.
Other key economic indicators also advanced strongly in 2016. For example, in the business sector, manufacturing sales and wholesale trade grew faster than the average of the other provinces. On the consumer side, there were also strong gains in retail sales and housing market activity in 2016.
Ontario's economic performance
| Item | Quarterly 2016Q1 |
Quarterly 2016Q2 |
Quarterly 2016Q3 |
Quarterly 2016Q4 |
Annual 2015 |
Annual 2016 Year-to-date |
|---|---|---|---|---|---|---|
| Gross Domestic Product - Real GDP | 0.9 | 0.2 | 0.7 | N/A | 2.5 | N/A |
| Gross Domestic Product - Nominal GDP | 1.3 | 0.4 | 1.0 | N/A | 4.9 | N/A |
| Labour Market - Employment (Change in 000s) | 34.8 | 15.8 | (10.8) | 53.3 | 45.3 | 76.4 |
| Labour Market - Labour Force (Change in 000s) | 32.4 | 6.0 | (14.5) | 38.1 | 7.5 | 63.4 |
| Labour Market - Unemployment Rate (%) | 6.7 | 6.6 | 6.6 | 6.3 | 6.8 | 6.5 |
| Other Key Economic Indicators - Retail Sales1 | 1.4 | (0.2) | 0.9 | N/A | 4.2 | 4.8 |
| Other Key Economic Indicators - Housing Starts | 5.6 | (3.3) | (0.4) | 1.4 | 18.6 | 6.8 |
| Other Key Economic Indicators - MLS Home Resales | 2.8 | 4.0 | 1.0 | 1.6 | 9.5 | 9.4 |
| Other Key Economic Indicators - Manufacturing Sales2 | 2.3 | (2.3) | 0.9 | N/A | 1.7 | 4.3 |
| Other Key Economic Indicators - Wholesale Trade3 | 1.9 | 0.3 | 1.5 | N/A | 6.5 | 6.4 |
| Other Key Economic Indicators - Consumer Price Index4 | 1.7 | 1.9 | 1.6 | 2.0 | 1.2 | 1.8 |
[1], [2], [3] Data available until November 2016.
[4] Per cent change from a year earlier; data not seasonally adjusted.
N/A = Data not available.
Sources: Statistics Canada, Ontario Ministry of Finance, Canada Mortgage and Housing Corporation and Canadian Real Estate Association.
Section E: Details of Ontario's finances
Revenue
| Item | 2016–17 Budget Plan |
2016–17 Current Outlook |
2016–17 In-Year Change |
|---|---|---|---|
| Taxation Revenue - Personal Income Tax | 32,167 | 32,842 | 675 |
| Taxation Revenue - Sales Tax1 | 23,976 | 24,779 | 803 |
| Taxation Revenue - Corporations Tax | 12,050 | 13,091 | 1,041 |
| Taxation Revenue - Education Property Tax2 | 5,834 | 5,914 | 80 |
| Taxation Revenue - Employer Health Tax | 6,007 | 5,896 | (111) |
| Taxation Revenue - Ontario Health Premium | 3,604 | 3,657 | 53 |
| Taxation Revenue - Gasoline Tax | 2,522 | 2,554 | 32 |
| Taxation Revenue - Land Transfer Tax | 2,051 | 2,565 | 514 |
| Taxation Revenue - Tobacco Tax | 1,221 | 1,168 | (53) |
| Taxation Revenue - Fuel Tax | 790 | 721 | (69) |
| Taxation Revenue - Beer and Wine Tax | 611 | 600 | (11) |
| Taxation Revenue - Electricity Payments-In-Lieu of Taxes | 515 | 515 | ― |
| Taxation Revenue - Other Taxes | 471 | 485 | 14 |
| Total Taxation Revenue | 91,819 | 94,787 | 2,968 |
| Government of Canada - Canada Health Transfer | 13,858 | 13,893 | 35 |
| Government of Canada - Canada Social Transfer | 5,128 | 5,141 | 13 |
| Government of Canada - Equalization | 2,304 | 2,304 | ― |
| Government of Canada - Infrastructure Programs | 1,017 | 940 | (77) |
| Government of Canada - Labour Market Programs | 989 | 989 | ― |
| Government of Canada - Social Housing | 434 | 434 | ― |
| Government of Canada - Other Federal Payments | 914 | 767 | (147) |
| Total Government of Canada | 24,644 | 24,468 | (176) |
| Government Business Enterprises - Ontario Lottery and Gaming Corporation | 1,953 | 2,118 | 165 |
| Government Business Enterprises - Liquor Control Board of Ontario | 2,025 | 2,045 | 20 |
| Government Business Enterprises - Ontario Power Generation Inc./Hydro One Ltd./ Brampton Distribution Holdco Inc. |
1,049 | 1,049 | ― |
| Total Government Business Enterprises | 5,027 | 5,212 | 185 |
| Other Non-Tax Revenue - Reimbursements | 983 | 983 | ― |
| Other Non-Tax Revenue - Vehicle and Driver Registration Fees | 1,751 | 1,751 | ― |
| Other Non-Tax Revenue - Electricity Debt Retirement Charge | 625 | 625 | ― |
| Other Non-Tax Revenue - Power Supply Contract Recoveries | 643 | 643 | ― |
| Other Non-Tax Revenue - Sales and Rentals | 2,421 | 2,346 | (75) |
| Other Non-Tax Revenue - Cap-and-Trade Proceeds | 478 | ― | (478) |
| Other Non-Tax Revenue - Other Fees and Licences | 987 | 987 | ― |
| Other Non-Tax Revenue - Net Reduction of Power Purchase Contract Liability | 129 | 129 | ― |
| Other Non-Tax Revenue - Royalties | 287 | 287 | ― |
| Other Non-Tax Revenue - Miscellaneous Other Non-Tax Revenue | 795 | 895 | 100 |
| Total Other Non-Tax Revenue | 9,099 | 8,646 | (453) |
| Total Revenue | 130,589 | 133,113 | 2,524 |
[1] Sales Tax revenue is net of the Ontario Sales Tax Credit and the energy component of the Ontario Energy and Property Tax Credit.
[2] Education Property Tax revenue is net of the property tax credit component of the Ontario Energy and Property Tax Credit and the Ontario Senior Homeowners' Property Tax Grant.
Note: Numbers may not add due to rounding.
Total expense
| Ministry Expense | 2016–17 Budget Plan |
2016–17 Current Outlook |
2016–17 In-Year Change |
|---|---|---|---|
| Aboriginal Affairs1 | 77.0 | 79.9 | 3.0 |
| Agriculture, Food and Rural Affairs2 | 915.9 | 915.9 | ― |
| Attorney General | 1,867.8 | 1,867.8 | ― |
| Board of Internal Economy | 219.9 | 219.9 | ― |
| Children and Youth Services | 4,346.1 | 4,454.6 | 108.5 |
| Citizenship, Immigration and International Trade | 220.8 | 176.8 | (44.0) |
| Community and Social Services3 | 11,467.5 | 11,470.8 | 3.3 |
| Community Safety and Correctional Services | 2,649.5 | 2,665.4 | 15.9 |
| Economic Development, Employment and Infrastructure / Research and Innovation4 | 1,177.0 | 1,176.4 | (0.7) |
| Education5 | 25,635.8 | 25,672.3 | 36.6 |
| Energy6 | 322.1 | 322.0 | (0.0) |
| Environment and Climate Change7 | 531.4 | 531.4 | ― |
| Executive Offices8 | 44.0 | 45.2 | 1.2 |
| Finance9 | 963.1 | 968.6 | 5.5 |
| Francophone Affairs, Office of | 5.7 | 5.7 | ― |
| Government and Consumer Services | 607.6 | 605.6 | (2.0) |
| Health and Long-Term Care10 | 51,785.2 | 52,132.8 | 347.6 |
| Labour | 309.5 | 309.3 | (0.2) |
| Municipal Affairs and Housing11 | 900.0 | 900.0 | ― |
| Natural Resources and Forestry12 | 750.6 | 750.1 | (0.6) |
| Northern Development and Mines | 790.7 | 790.7 | ― |
| Tourism, Culture and Sport13 | 1,250.8 | 1,290.1 | 39.3 |
| Training, Colleges and Universities | 7,876.8 | 8,096.6 | 219.8 |
| Transportation14 | 3,850.9 | 3,849.6 | (1.4) |
| Treasury Board Secretariat15 | 316.9 | 347.7 | 30.8 |
| Interest on Debt16 | 11,756.0 | 11,375.0 | (381.0) |
| Other Expense17 | 4,056.8 | 4,412.6 | 355.7 |
| Year-End Savings18 | (800.0) | (800.0) | ― |
| Total Expense | 133,895.4 | 134,632.8 | 737.4 |
[1], [2], [3], [4], [5], [6], [7], [8], [9], [10], [11], [12], [13], [14], [15], [17] Details on other ministry expense can be found in the Details of Other Expense table.
[16] Interest on debt is net of interest capitalized during construction of tangible capital assets of $183 million in 2016–17.
[18] As in past years, the Year-End Savings provision reflects efficiencies through in-year expenditure management and underspending due to factors such as program management, and changes in project startups and implementation plans.
Notes: Numbers may not add due to rounding.
The impact of ministry restructuring since the 2016 Budget will be reflected in future updates.
Details of other expense
| Ministry Expense | 2016–17 Budget Plan |
2016–17 Current Outlook |
2016–17 In-Year Change |
|---|---|---|---|
| Aboriginal Affairs - Green Investment Fund Initiatives | – | 5.0 | 5.0 |
| Aboriginal Affairs - One-Time Investments including Settlements | – | 0.4 | 0.4 |
| Agriculture, Food and Rural Affairs - Time-Limited Investments in Infrastructure | – | 116.4 | 116.4 |
| Agriculture, Food and Rural Affairs - Time-Limited Investments | – | 3.1 | 3.1 |
| Community and Social Services - Time-Limited Investments in Affordable and Supportive Housing | – | 23.0 | 23.0 |
| Economic Development, Employment and Infrastructure / Research and Innovation - Green Investment Fund Initiatives | – | 99.0 | 99.0 |
| Economic Development, Employment and Infrastructure / Research and Innovation - Federal-Provincial Infrastructure Programs | 618.7 | 316.3 | (302.4) |
| Education - Teachers' Pension Plan | (452.0) | (452.0) | – |
| Energy - Green Investment Fund Initiatives | – | 108.0 | 108.0 |
| Energy - Strategic Asset Management and Transformation Related to Hydro One | 70.9 | 70.9 | – |
| Energy - 8% Provincial Rebate for Electricity Consumers | – | 300.0 | 300.0 |
| Environment and Climate Change - Green Investment Fund Initiatives | – | 1.0 | 1.0 |
| Executive Offices - Time-Limited Assistance | – | 1.0 | 1.0 |
| Finance - Ontario Municipal Partnership Fund | 505.0 | 505.0 | – |
| Finance - Power Supply Contract Costs | 643.1 | 643.1 | – |
| Health and Long-Term Care - Time-Limited Investments in Affordable and Supportive Housing | – | 4.7 | 4.7 |
| Municipal Affairs and Housing - Green Investment Fund Initiatives | – | 92.0 | 92.0 |
| Municipal Affairs and Housing - Time-Limited Investments in Municipal, Social and Affordable Housing | 160.3 | 543.6 | 383.3 |
| Municipal Affairs and Housing - Time-Limited Investments | – | 0.9 | 0.9 |
| Natural Resources and Forestry - Emergency Forest Firefighting | 69.8 | 134.8 | 65.0 |
| Tourism, Culture and Sport - Time-Limited Investments to Support 2015 Pan/Parapan American Games | 88.6 | 88.6 | – |
| Transportation - Green Investment Fund Initiatives | – | 20.0 | 20.0 |
| Treasury Board Secretariat - Capital Contingency Fund | 100.0 | 97.3 | (2.8) |
| Treasury Board Secretariat - Operating Contingency Fund | 1,100.0 | 537.9 | (562.1) |
| Treasury Board Secretariat - Employee and Pensioner Benefits | 1,152.5 | 1,152.5 | – |
| Total Other Expense | 4,056.8 | 4,412.6 | 355.7 |
Notes: Numbers may not add due to rounding. The impact of ministry restructuring since the 2016 Budget will be reflected in future updates.
2016–17 Infrastructure expenditures
| Sector | 2016–17 Current Outlook Investment in Capital Assets1 |
2016–17 Current Outlook Transfers and Other Infrastructure Expenditures2 |
2016–17 Current Outlook Total Infrastructure Expenditures3 |
|---|---|---|---|
| Transportation - Transit | 4,701 | 660 | 5,361 |
| Transportation - Provincial Highways | 2,108 | 43 | 2,150 |
| Transportation - Other Transportation, Property and Planning | 603 | 186 | 788 |
| Health - Hospitals | 2,621 | 263 | 2,884 |
| Health - Other Health | 60 | 248 | 308 |
| Education | 2,390 | 171 | 2,561 |
| Postsecondary - Colleges and Other | 704 | 13 | 716 |
| Postsecondary - Universities | – | 375 | 375 |
| Social | 12 | 801 | 814 |
| Justice | 58 | 200 | 257 |
| Other Sectors4 | 436 | 745 | 1,181 |
| Total | 13,693 | 3,703 | 17,396 |
[1] Includes $183 million in interest capitalized during construction.
[2] Includes transfers to municipalities, universities and non-consolidated agencies.
[3] Includes third-party investments in hospitals, colleges and schools; and provisional federal contributions to provincial infrastructure investments.
[4] Includes government administration, natural resources, culture and tourism sectors.
Note: Numbers may not add due to rounding.
Review of selected financial and economic statistics
| Item | 2012–13 | 2013–14 | 2014–15 | Actual 2015–162 |
Current Outlook 2016–173 |
|---|---|---|---|---|---|
| Revenue | 113,369 | 115,911 | 118,546 | 128,377 | 133,113 |
| Expense - Programs | 112,248 | 115,792 | 118,225 | 120,925 | 123,258 |
| Expense - Interest on Debt1 | 10,341 | 10,572 | 10,635 | 10,967 | 11,375 |
| Total Expense | 122,589 | 126,364 | 128,861 | 131,891 | 134,633 |
| Surplus/(Deficit) Before Reserve | (9,220) | (10,453) | (10,314) | (3,514) | (1,520) |
| Reserve | – | – | – | – | 400 |
| Surplus/(Deficit) | (9,220) | (10,453) | (10,314) | (3,514) | (1,920) |
| Net Debt | 252,088 | 267,190 | 284,576 | 294,564 | 304,875 |
| Accumulated Deficit | 167,132 | 176,634 | 187,511 | 192,028 | 193,948 |
| Gross Domestic Product (GDP) at Market Prices | 680,084 | 695,349 | 727,962 | 763,276 | 796,860 |
| Primary Household Income | 459,111 | 472,921 | 490,023 | 511,781 | 531,545 |
| Population – July (000s) | 13,414 | 13,556 | 13,685 | 13,797 | 13,983 |
| Net Debt per Capita (dollars) | 18,793 | 19,710 | 20,795 | 21,350 | 21,803 |
| Household Income per Capita (dollars) | 34,226 | 34,886 | 35,807 | 37,094 | 38,014 |
| Interest on Debt as a Per Cent of Revenue | 9.1 | 9.1 | 9.0 | 8.5 | 8.5 |
| Net Debt as a Per Cent of GDP | 37.1 | 38.4 | 39.1 | 38.6 | 38.3 |
| Accumulated Deficit as a Per Cent of GDP | 24.6 | 25.4 | 25.8 | 25.2 | 24.3 |
[1] Interest on debt is net of interest capitalized during construction of tangible capital assets of $134 million in 2013–14, $202 million in 2014–15, $165 million in 2015–16 and $183 million in 2016–17.
[2], [3] The 2015–16 actuals and the 2016–17 outlook reflect recognizing jointly sponsored net pension assets for the Ontario Public Service Employees' Union Pension Plan (OPSEUPP) and Ontario Teachers' Pension Plan (OTPP) on the Province's financial statements, consistent with the 2016 Budget.
Note: Numbers may not add due to rounding.
Sources: Ontario Ministry of Finance and Statistics Canada.
Section F: Ontario's 2016–17 borrowing program
Borrowing program
| Item | 2016–17 Budget Plan |
2016–17 Current Outlook |
2016–17 In-Year Change |
|---|---|---|---|
| Deficit/(Surplus) | 4.3 | 1.9 | (2.4) |
| Investment in Capital Assets | 11.2 | 11.7 | 0.6 |
| Non-Cash Adjustments | (5.8) | (5.2) | 0.6 |
| Other Net Loans/Investments | (0.9) | (0.9) | – |
| Debt Maturities | 21.5 | 20.9 | (0.5) |
| Debt Redemptions | 0.1 | 0.0 | – |
| Total Funding Requirement | 30.3 | 28.5 | (1.8) |
| Canada Pension Plan Borrowing | (0.1) | (0.1) | – |
| Decrease/(Increase) in Short-Term Borrowing | (1.0) | – | 1.0 |
| Increase/(Decrease) in Cash and Cash Equivalents | (2.7) | (2.5) | 0.2 |
| Preborrowing from 2015–16 | – | (2.0) | (2.0) |
| Preborrowing in 2016–17 for 2017–18 | – | 0.8 | 0.8 |
| Total Long-Term Public Borrowing Requirement | 26.4 | 24.6 | (1.8) |
Note: Numbers may not add due to rounding.
Borrowing program status (as at February 10, 2017)
| Item | Completed | % | Remaining | Total |
|---|---|---|---|---|
| Province | 24.6 | 103.3 | 0.0 | 24.6 |
| Ontario Electricity Financial Corporation | 0.0 | 0.0 | 0.0 | 0.0 |
| Total | 24.6 | 103.3 | 0.0 | 24.6 |
Notep: Numbers may not add due to rounding.
Long-Term Public Borrowing completed as at February 10, 2017, including $800 million in pre-borrowing for 2017–18, totalled $24.6 billion, as follows:
| Item | ($ Billions) |
|---|---|
| Domestic Issues | 17.6 |
| Global/US Dollar/Other Issues | 7.0 |
| Total | 24.6 |
The completed long term borrowing of $24.6 billion, including the $800 million pre-borrowed for 2017–18, is 103.3 per cent of the borrowing outlook of $23.8 billion presented in the 2016 Ontario Economic Outlook and Fiscal Review.
Over the remainder of the 2016–17 fiscal year, taking advantage of the continued demand for its debt, the Province will pre-borrow over and above the $800 million already pre-borrowed when presented with favourable market conditions.
Ministry of Finance
For general inquiries regarding the 2016–17 Third Quarter Finances, please call:
Toll-free English & French inquiries:
Teletypewriter:
© Queen's Printer for Ontario, 2017
Chart description
Chart: Economic Growth Forecast
The bar chart shows forecasts for Ontario real GDP growth for 2016 and 2017. In the 2016< Ontario Economic Outlook and Fiscal Review, the Ontario Ministry of Finance planning assumption for real GDP growth was 2.5 per cent in 2016 and 2.2 per cent in 2017. The current private-sector forecast average for Ontario real GDP growth is 2.6 per cent in 2016 and 2.2 per cent in 2017.