2016 Energy Consumption and Greenhouse Gas (GHG) Emission Report
Learn about our progress meeting energy conservation targets and reducing greenhouse-gas emissions.
Executive summary
In support of the 2007 Go Green Action Plan (GGAP), the Ministry of Infrastructure (MOI) has committed to reducing greenhouse gas (GHG) emissions through energy conservation measures. The GGAP outlined overall Ontario Public Service (OPS) targets for energy generation emissions (nuclear, hydro, natural gas, renewable energy), vehicle emissions and OPS building related emissions. Ontario has met this target through innovations like extensive energy retrofits in government-owned buildings and staff energy conservation measures. To help achieve the overall GGAP targets, MOI committed to a building related emissions reduction of 27% by 2020 (over a 2006 baseline). The MOI portfolio has already achieved a previous target of 19% reductions by 2014.
Annual energy and GHG reporting requirements are outlined in the Ontario Facilities Energy Consumption Directive (Green Energy Act). Annually, the energy and GHG reporting requirement are broken into two sections:
- The 5-Year Energy Plan reporting on target buildings and initiatives progress for Ministry of Infrastructure (MOI) buildings
- The Enterprise Wide GHG Summary which includes the MOI managed portfolio as well as custodial ministries. Custodial ministries have buildings that are managed by the ministry directly and fall outside of the scope of MOI management
The 2014 GHG emission inventory for the IO-managed facilities was finalized this year with the release of the National Inventory Report in 2016 (containing 2014 emission factor data) and was verified by a certified ISO 14065 third party organization to assure that the reductions were real while also providing invaluable feedback for improvements so as to stay on track for the 2020 target.
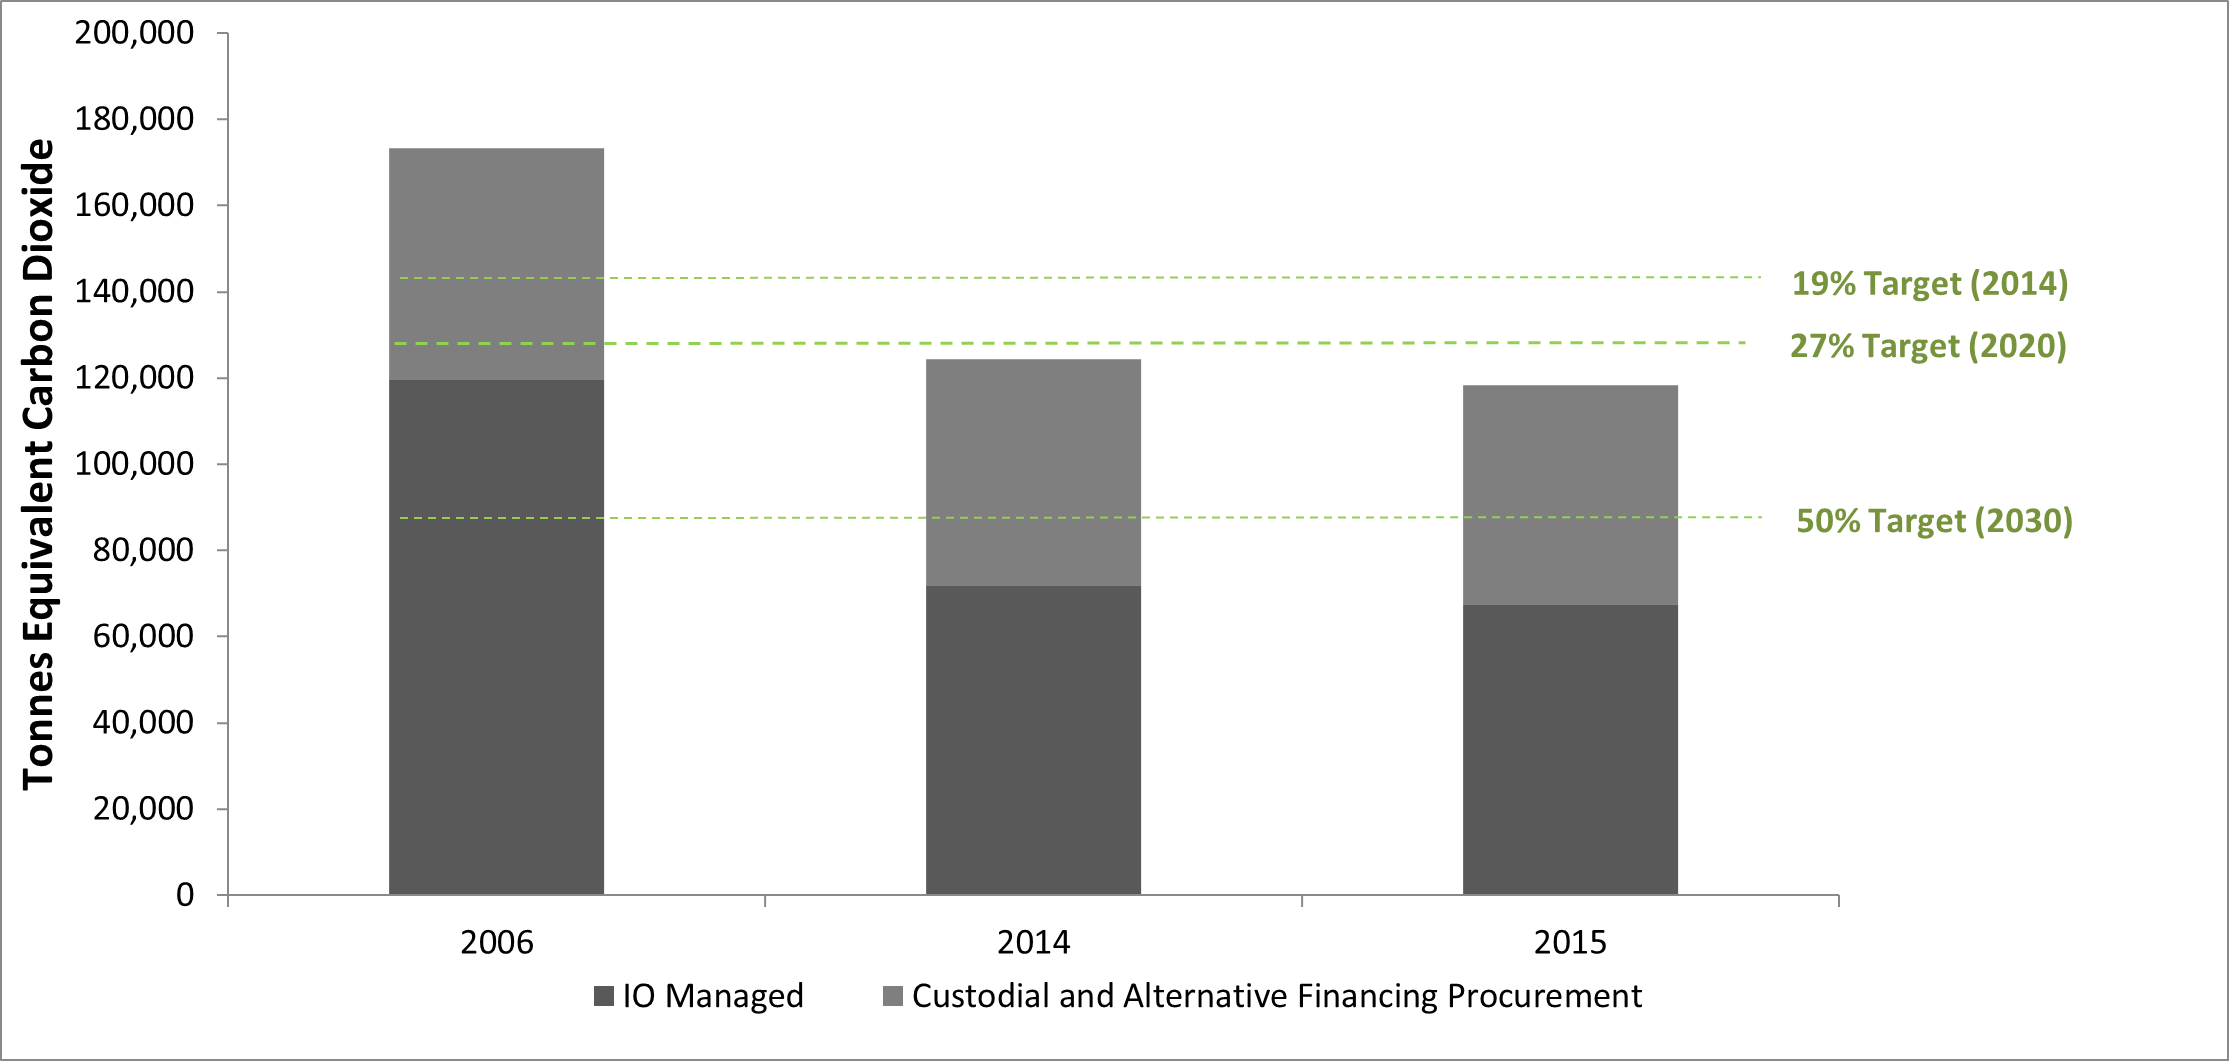
Graph 1 — Greenhouse gas emissions from IO-managed, AFP and custodial facilities compared to Government reduction targets (tCO2e)
In support of the building related GHG emissions targets for 2014 and 2020 (19% and 27% respectively), an electricity reduction target was set at 20% by 2012 (over a 2002 baseline). In order to achieve this target, Infrastructure Ontario (IO) was directed by MOI to implement building related electricity reduction initiatives. The target was achieved. Moving forward, MOI has given IO direction to implement a new target encompassing all fuel types (electricity, natural gas, propane, fuel oil, chilled water, steam). The new target is a 2% reduction year over year for all fuel types.
The progress made since committing to emission reduction targets has been positive. Energy reduction programs have reduced emissions through a variety of initiatives including major building retrofits, retro-commissioning and implemented design guidelines/standards. These energy reduction programs paired with cleaner electricity generation in Ontario (through phase out of coal and increased renewable energy), have provided an additional positive impact to the achievement of the 2014 target and future targets. Although the 2014 target was achieved, the 2020 target remains uncertain. Factors such as energy funding shortfalls, nuclear fleet refurbishments, increased natural gas generation, slow renewable generation uptake and increased instances of inclement weather could have major negative impacts on achieving the 2020 target.
In the spring of 2016, the Ontario Government released a new initiative, the 5-Year Climate Change Action Plan. In this plan, the government seeks to reduce its GHG emissions from its facilities. A new target was emphasized; 50% reduction of GHG emissions compared to 2006 by 2030. IO-managed facilities are heading in the right direction but only due to continuous efforts in the area of energy efficiency and conservation efforts. With aging buildings, investment in new technologies will improve the chances of hitting those emission targets in the future.
MOI reports GGHG emissions annually using an internally developed methodology which incorporates some elements of The World Resources Institute Greenhouse Gas Protocol (GHG Protocol). The GHG Protocol provides standards and guidance for reporting greenhouse gases. Because of the nature of government facilities, elements of the GHG protocol were adapted into an internal methodology for applicability to the MOI portfolio.
Reporting requirements
Ontario ministries are required to report on greenhouse gas emissions, energy, and water to the Ministry of Infrastructure and prepare annual energy consumption and greenhouse gas emissions reports for government-owned facilities.
Energy consumption reporting is the responsibility of the ministry that has operational control (management of day-to-day operations) of the facility. MOI, through Infrastructure Ontario (IO), is responsible for reporting on all facilities where IO has full operational control of the facility.
Reporting includes all energy used at a facility including: electricity, natural gas, purchased steam, propane, heating oil, diesel fuels; and if applicable, municipally supplied water on a building by building basis. Although each ministry is responsible for its own plan, MOI has the responsibility to report on all government facilities whether or not they fall under the scope of IO control. Ministry buildings that do not fall under the purview of MOI/IO are defined as a Custodial Ministry.
The objective of the IO energy plan is to:
- report on progress and strategies to meet and exceed Ontario Public Service (OPS) GHG reduction targets across the MOI–owned portfolio
- report on the achievement of GHG emission reduction targets:
- 19% reduction by end of 2014 over 2006 baseline
- 27% reduction by end of 2020 over 2006 baseline
- 50% reduction by the end of 2030 over 2006 baseline
This report explains the progress of the Ontario Government’s commitment to reducing emissions in the MOI building portfolio. Data in this report covers the 2015 calendar year (CY).
This report accounts for the following fuel types and scope emissions. Scope 1 emissions can be explained as fuel burned on-site (example: the operation of a boiler). Scope 2 emissions can be explained as a delivered fuel type where the energy was generated off-site and delivered to the building (example: electricity generated by a mixture of fuel types and delivered to the building).
Scope 1 emissions include:
- natural gas
- fuel oil (2)
- propane
Scope 2 emission include:
- electricity
- steam
- hot water
- chilled water
Roles and responsibilities
Infrastructure Ontario
IO manages the majority of the province’s portfolio on behalf of MOI. IO is a crown agency that oversees the day-to-day operations of the real-estate portfolio and implements ministry policies for buildings, lands, and leases.
IO has three separate GHG reporting responsibilities:
- reporting emissions publicly for MOI-owned facilities building by building, this includes:
- IO-Managed Alternative Financing Procurement (AFP)
- reporting on OPS Enterprise-wide summary status
- a 5-year energy conservation strategy
The IO-managed portfolio is spread throughout the province and includes the management of approximately 45 million square feet of buildings and structures of which approximately 10 million square feet is leased from third parties. Core Buildings are a subset of the IO-managed portfolio for which MOI has capital and operational responsibility, they represent approximately 35 million rentable square feet (Source: 2015 GREP Report). This report includes emissions reporting for 413 buildings representing approximately 16 million square feet and are buildings where MOI has a level of control that allows energy conservation measures (ECMs) to be implemented. These are designated as Target Class Facilities. Graph 2 provides an overview of the reported portfolio.
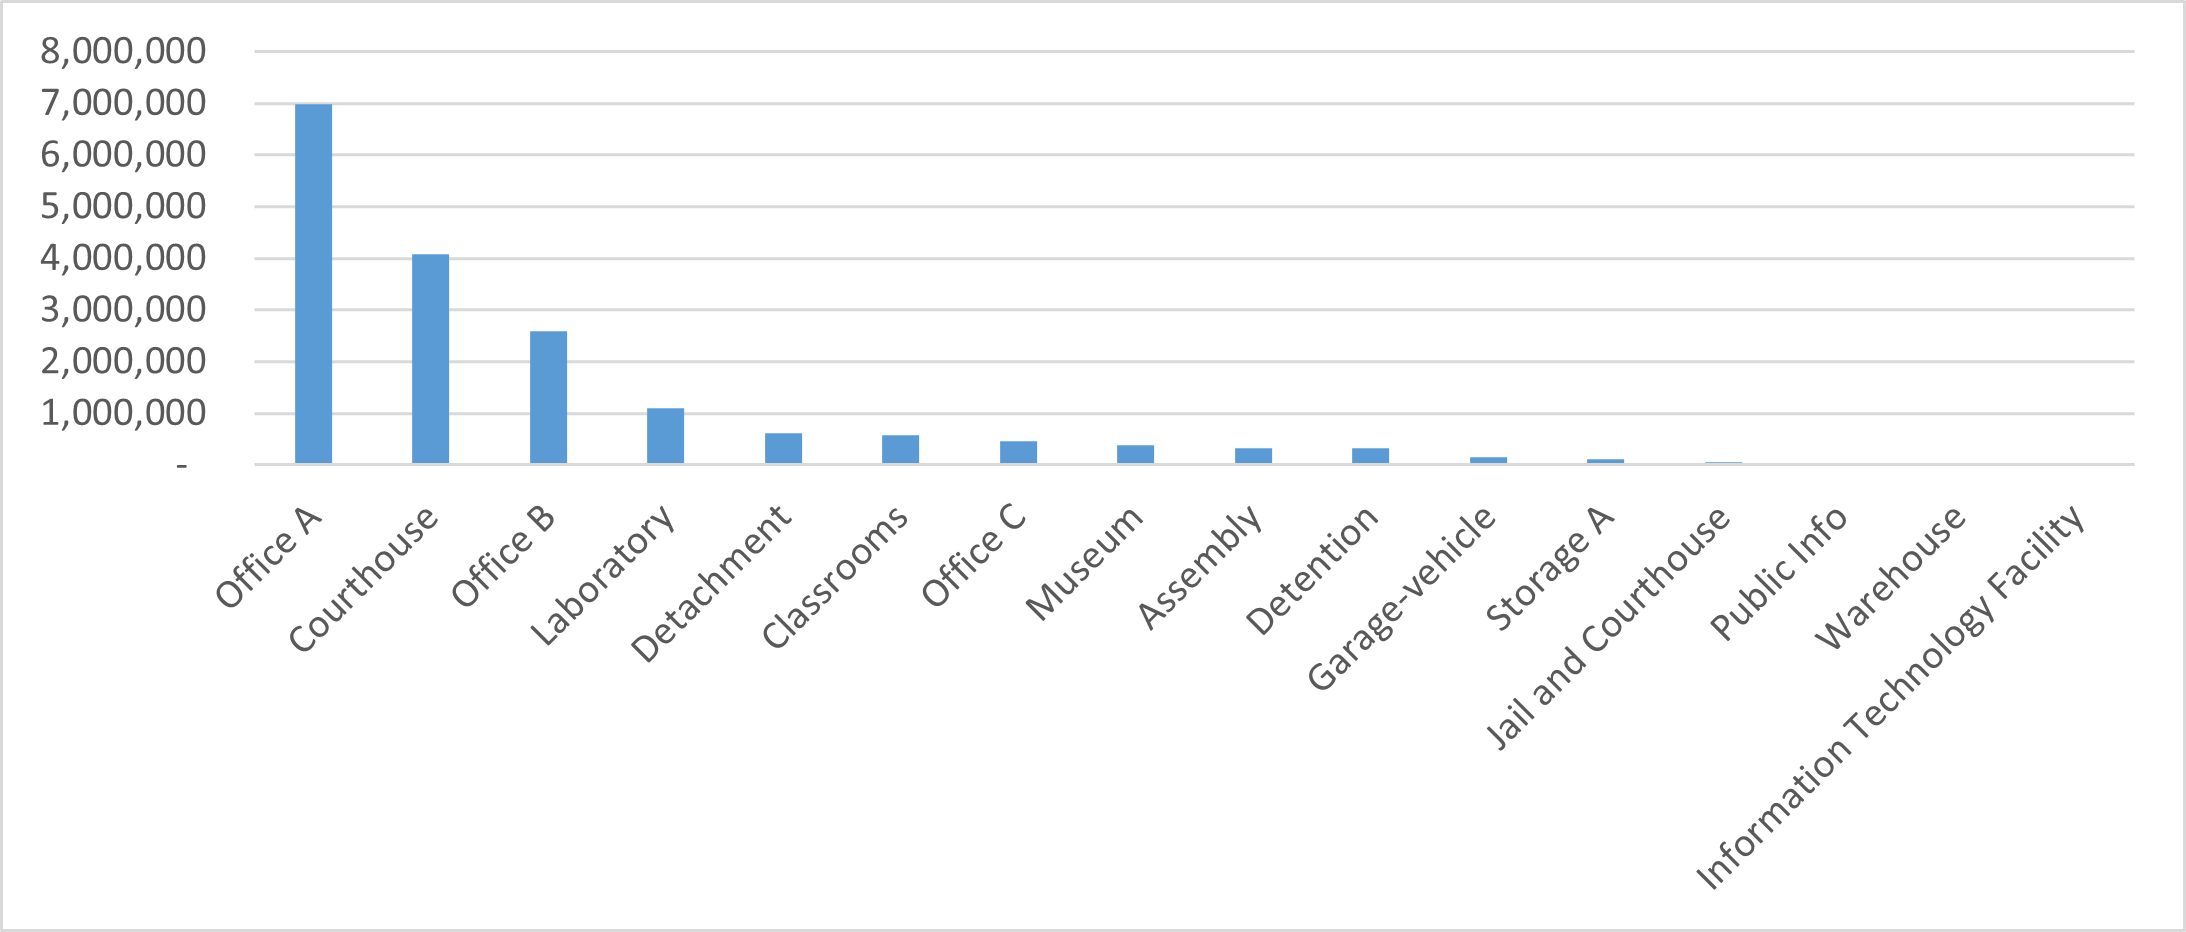
Graph 2 — Gross square feet from IO-managed portfolio (GSF) for 2015
Over 50% of the assets in IO’s portfolio are more than 40 years old (Source: DARTS 2016). These assets require significant capital investment in order to adequately maintain operations. In addition, these assets are more likely to be high energy users, with aging structures and equipment, employing outdated materials, methods and technologies. Many of IO’s older buildings are important for heritage and cultural reasons, adding additional layers of complexity to their management.
Infrastructure Ontario — Alternative Financing Procurement (AFP)
The AFP model brings together private and public sector expertise in a unique structure that transfers the risk of project cost increases and scheduling delays, typically associated with traditional project delivery.
AFP sites are required to report their GHG emissions; however IO does not have direct operational control of the facilities (managed by private service providers). As a result, reporting is presented in a separate line item to track IO’s AFP sector progress.
Custodial ministries
Custodial ministries have day-to-day operational control over their own facilities. For the CY2015, these ministries include:
- Ministry of Transportation (MTO)
- Ministry of Education (EDU)
- Ministry of Child and Youth Services (MCYS)
- Ministry of Community Safety and Correctional Services (MCSCS)
- Ministry of Natural Resources (MNR)
Custodial Ministries have two primary responsibilities:
- reporting emissions publicly for facilities managed on a day-to-day basis
- a 5-year energy conservation strategy (for each Custodial Ministry)
Infrastructure Ontario — managed buildings energy performance
The impacts from the energy reduction program from 2002–2012 are still being seen, with a steady decrease of electricity consumption continuing in 2015. Fossil fuel (natural gas, fuel oil and propane) are the main heating sources for the portfolio and fluctuate heavily depending on winter weather severity. For the CY 2015, the winter was mild in comparison with the winters in 2013 and 2014, thus showing a significant decrease in fuel used for heating. This dependency on fossil fuels for heating has not declined since the 2006 baseline. This makes the IO-managed portfolio particularly vulnerable to sharp GHG emission increases depending on the severity of the winter. Going forward to meet the 2020 GHG target, weather is a significant threat to achieving the 27% reduction in GHG emissions.
| Item | 2006 | 2014 | 2015 | 2006 vs. 2015 | 2006 vs. 2014 | 2014 vs. 2015 |
|---|---|---|---|---|---|---|
| Electricity | 314,968,824 | 244,030,072 | 230,994,590 | (27%) | (23%) | (5%) |
| Natural gas | 221,897,575 | 240,299,114 | 222,896,036 | 0% | 8% | (7%) |
| Fuel oil | 3,158,433 | 3,567,366 | 2,834,647 | (10%) | 13% | (21%) |
| District chilled water | 0 | 760,686 | 776,445 | N/A | N/A | 2% |
| Propane | 3,061,507 | 3,485,327 | 3,000,760 | (2%) | 14% | (14%) |
| District steam | 68,300,283 | 63,265,707 | 58,283,016 | (15%) | (7%) | (8%) |
| District hot water | 296,501 | 455,235 | 382,647 | N/A | N/A | (16%) |
| Total | 611,683,122 | 555,863,507 | 519,168,142 | (15%) | (9%) | (7%) |
Table 1 — IO-managed buildings energy consumption from 2006, 2014 and 2015 (ekWh)
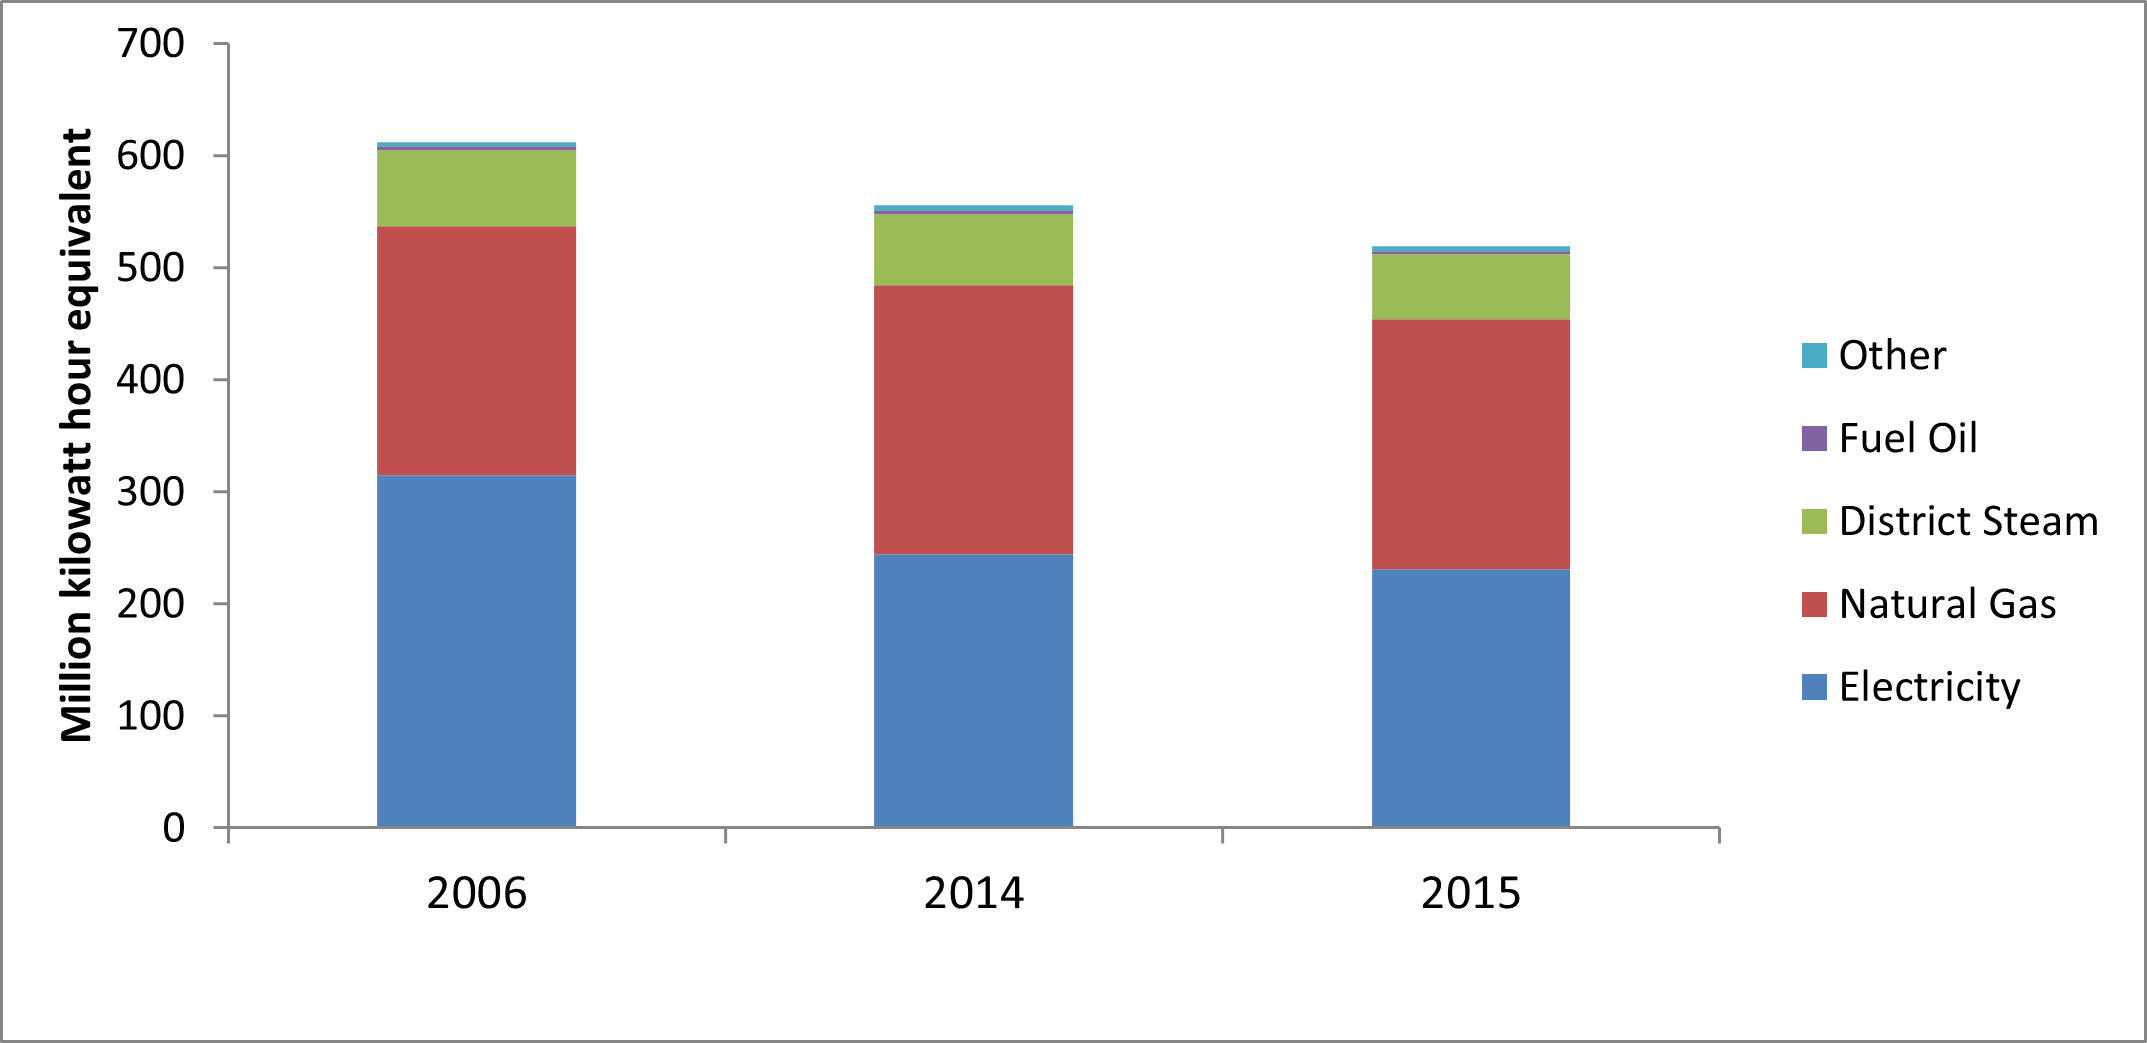
Graph 3 — IO-managed buildings energy profile for 2006, 2014 and 2015 (million ekWh)
Energy reduction strategy and programs
The IO Energy Team has developed a comprehensive strategy including several programs and initiatives that link together to form a high performing and integrated approach to energy management. The programs and initiatives outlined in this section do not (although they can) operate as singularities but work together to achieve a greater goal of energy conservation. Chart 3 outlines how this process works and shows how each of the components support one another.
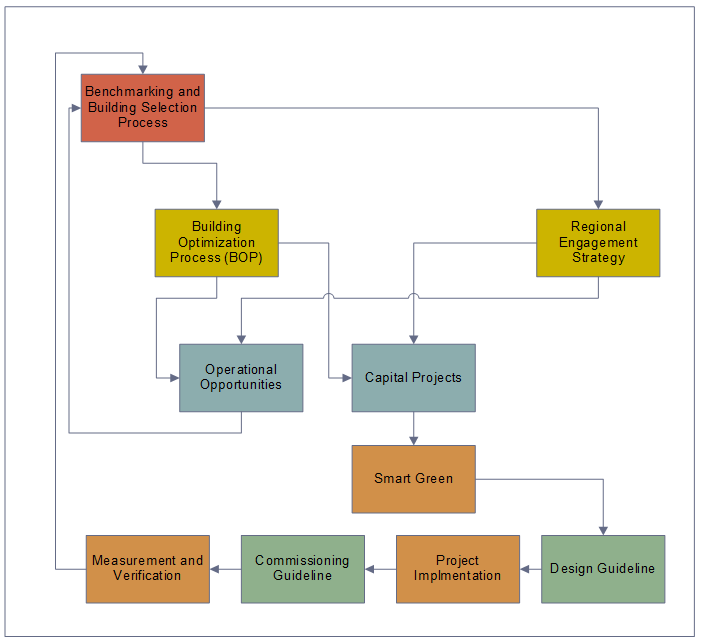
Chart 1 — IO energy strategy workflow
Benchmarking
Internal benchmarking
Infrastructure Ontario, in collaboration with their service provider CBRE, has developed a robust internal benchmarking program. The program was developed in-house and draws on the expertise of both the IO and CBRE Energy Teams. The program is weather normalized and analyses building performance while identifying and prioritizing those that need further improvement. The results of benchmarking are brought forward to facility managers as part of the Regional Engagement Strategy (section 7.6) and further investigation is assigned. Investigations often result in operational changes or proposals for capital projects.
External benchmarking
In 2013, Natural Resources Canada (NRCan) released the Energy Star Portfolio Manager (ESPM) for Canada. In support of this program IO uploaded three years’ worth of energy data for over 10 million square feet of office space at 174 buildings. IO had the IO-managed portfolio reviewed by the ESPM benchmarking program for the CY2015, for office buildings only. Currently IO’s internal benchmarking program is used as a primary benchmarking resource, but ESPM is often used as a secondary perspective that can in some cases provide additional support in prioritizing candidates for IO’s Building Optimization process.
Building Optimization Process
The Building Optimization Process (BOP) documents the process developed to help Infrastructure Ontario improve energy and water performance for buildings owned and managed by the Ontario Government. This helps service providers and IO identify improvement measures and projects. Working together, this process improves the performance of the buildings, and continues IO’s recognized leadership in high-performance building operations. This process applies to all Infrastructure Ontario-managed (MOI owned) buildings and covers all building sizes and types. Buildings are selected through a site-by-site review process analyzing energy, project, and occupancy data among many other factors. A list of scheduled buildings for BOP implementation are selected and presented to IO on an annual basis.
Regional engagement strategy
Engagement of regional facilities staff is crucial to understanding what is actually happening at the building level. For the past four years meetings have been held monthly with regional managers, service providers and the IO Energy Team. Within the past year these meetings have been expanded to include building operators and facility managers. By including staff that are actually working in the buildings, it opens up the opportunity to discuss what is actually happening inside each facility. Facilities staff are encouraged to have their voices heard and are given the opportunity to put forth ideas on best energy management practices for their buildings. Through these discussions program opportunities such as BOP are identified, which result in operational or capital building improvements.
Capital projects
Capital projects are run through the Capital Repair Program (CRP). This program develops projects to ensure health and safety, code compliance and imminent equipment breakdown. Historically energy projects were run through a separate funding stream which ran in parallel with the CRP. Due to funding restraints in 2014/15, energy funding was put on hold. Every CRP project is an opportunity to improve the performance of IO’s-managed portfolio, applying the IO Design and Commissioning Guidelines to all CRP projects captures these opportunities and participates in the enhancement of IO-managed portfolio.
Smart Green Portfolio Strategy
The Smart Green Portfolio Strategy is a high performance building portfolio strategy that utilizes advanced automation and integration to measure, monitor, and control to optimize operations and maintenance at the lowest cost and environmental impact over the building lifecycle. The strategy involves integrating relevant building systems including, but not limited to, HVAC and Lighting control and when possible integrate the Security, Elevators, Fire Protection and Life Safety systems in order to improve performance and to reduce energy consumption in a facility. Smart Green also includes the infrastructure required for centralized remote monitoring of building systems. The combination of integrated automation with centralized monitoring allows for all relevant building system information to be available to a supervisor for:
- alarm and event management
- troubleshooting
- dispatch for service or repair
- historical record keeping
- utility metering including sub-metering for individual tenants
Design guidelines
The purpose of the IO Building Systems Design Guideline is to standardize design and construction objectives and technical requirements across the full portfolio of IO-managed buildings to ensure higher performing buildings are designed and constructed in accordance with the Smart Green Portfolio strategy. It ensures consistency and unity of IO-managed sites and to integrate all relevant IO guidelines and systems, in order to achieve increased occupant comfort and satisfaction, improved operational performance, improved energy efficiency, and includes provision of technologies and tools to efficiently monitor, control and manage building systems.
Commissioning guideline
The intent of the guideline is to ensure:
- building equipment performs as specified and originally intended as per IO Design Guidelines
- installation of equipment meets contract specifications
- the commissioning of building systems/equipment and sequence of operations have been verified to on site conditions
- the total performance/integration of new equipment/systems are fully commissioned
Measurement and Verification
Measurement and Verification (M&V) plays a key role in quantifying savings from energy conservation projects. In the 2014/15 fiscal year, IO performed M&V on a variety of projects from cooling towers to lighting retrofits and received the results from analysis from two lighting projects. Through these initiatives, the M&V program has become more refined and has been integrated into the Design Guidelines as a requirement. Results from the M&V program will be used to help better inform operational decisions and future capital projects.
GHG emission performance
The GHG emissions reporting period is from 01/01/2015 to 12/31/2015 (inclusive).
Organizational boundary
A consolidation approach for the GHG emission inventory is used for all government-owned facilities. Different requirements apply to two separate classes of government-owned facilities: Target Class Facilities and Non-Target Class Facilities.
MOI manages the majority of the portfolio through Infrastructure Ontario. Where IO is responsible only for the base building elements or has no direct involvement in the operation of the Target Class Facility, reporting is the responsibility of the custodial ministry that manages that facility on a day-to-day basis.
Target Class Facilities are a subset of all government-owned facilities that have been identified as having energy conservation potential.
Non-Target Class Facilities include leased and other government-owned facilities. These are facilities where the government does not have direct operational control of the facility or it may be difficult to conserve energy due to safety considerations or programmatic impacts and constraints.
| Ministry | Custodial Target Class Facilities | Custodial Non-Target Class Facilities |
|---|---|---|
| MTO | Truck inspection stations | Patrol yards, remote airports, street lights |
| MNR | Parks | Fish hatcheries, ranger camps, forward fire stations |
| EDU | Provincial schools | All facilities included |
| MCSCS | Adult detention centres | All facilities included |
| MCYS | Youth detention centres | All facilities included |
Table 2 — Target and non-target facilities for reporting as directed by the Ontario Government
The following facilities are included in this report:
- MCSCS: 32 facilities
- MCYS: 12 facilities
- EDU: 73 facilities
- MNRF: 78 parks
- MTO: 34 sites
- IO - AFP: 26 sites. IO does not have operational control of these buildings, but maintains a responsibility to report on them. AFP hospitals are not required to report their emissions, and only fully operational AFP facilities are being reported upon. AFP sites register zero consumption for the 2006 base year and will only add to the Enterprise-wide emission inventories as more sites are added (regardless of their level of energy efficiency).
- IO-managed: 413 sites
Leased buildings are not within the boundary of this inventory.
The sources of GHG emissions from the portfolio includes:
| Scope 1 | Scope 2 |
|---|---|
| Production of heat from boilers, steam and electricity on-site from the combustion of: fuel oil, natural gas and propane | Purchased electricity, district hot water, district chilled water and district steam |
Table 3 — Sources of GHG emissions from the Inventory CY2015
The inventory excludes Scope 3 GHG emissions as they are not outlined within the Government directives. The inventory currently excludes the GHG emissions associated with backup diesel generation due to current deficiencies and inconsistencies in the data collection process. IO is developing a data collection process for future monitoring of this GHG emission source and should be finalized by the end of 2016 for implementation for next year`s GHG report.
The inventory currently does not include Scope 1 fugitive emissions, mainly from the unintentional release of gases from equipment leaks such as refrigerant in refrigeration and air conditioning equipment and CO2 emissions from fire suppressing equipment. IO is developing a data collection process for future monitoring of these GHG emission sources.
The Ontario Government uses a fixed target Base Year — which is 2006. The Ontario Government has set GHG reduction targets, using an “absolute” emissions over time. The baseline emissions are as follows:
| N/A | Total (tCO2e) | MOI-managed | MOI-AFP | MCYS | MCSCS | MTO | EDU | MNR |
|---|---|---|---|---|---|---|---|---|
| Total | 173,246 | 119,804 | 0 | 5,407 | 34,524 | 255 | 9,486 | 3,770 |
Table 4 — GHG emissions Enterprise-wide for the base year 2006 (tCO2e)
The AFP portfolio are new buildings whose GHG emissions are not included in the baseline.
Reporting methodologies
IO follows the direction from the Ontario Facilities Energy Reporting Directive, which outlines the target and on-target facilities required for reporting, and the source for emission factors. IO follows the GHG Protocol for the GHG emission calculation method. The Greenhouse Gas (GHG) Protocol was developed by World Resources Institute (WRI) and World Business Council on Sustainable Development (WBCSD). The GHG Protocol is the most commonly used GHG accounting tool for government and business leaders to quantify, and manage greenhouse gas emissions. IO follows this accounting standard as a guideline in its reporting of the enterprise GHG emissions but sets the Directive as primary guidance.
For the CY2015 reporting year, the following emission factors sources are used:
- Federal Government NIR 2016 (CY2014 grid electricity and fossil fuels)
- Ontario MOE (CY2015 grid electricity)
- Enwave (for district steam and chilled water — all years)
- IO internal calculation (for district hot water based on NIR natural gas values — all years)
- Ontario Government (all ekWh conversion factors)
The major driver of emissions savings in the last several years is a result of the phase out of coal electricity generation. The electricity grid emission factor in Ontario in 2006 was 191gCO2e/kWh and has decreased to 45.5gCO2e/kWh in the 2015 year (preliminary estimation by the MOE). Going forward into the 2020 reporting year it is not expected that there will be EF increases or decreases due to the coal power-plant phase out. Although there is some stabilization of the grid emissions factor there are variables such as the nuclear refurbishment program and inclement weather events that could impact progress negatively. It is estimated that outside variables like these could raise the electricity grid emission factor as much as 20%, putting the 2020 target at risk.
In accordance with the latest Federal government`s National Inventory Report (NIR) (2016), the 100-year Global Warming Potential (GWP) values are applied in this GHG report.
In line with the principle of continuous improvement, the underlying data and methodology for estimating emissions are revised over time; hence, total emissions in all years are subject to change as both data and methods are improved. Improvements include:
- Applying more up-to-date and accurate emission factors retroactively to previous years’ data. The Canadian Federal Government releases its NIR annually, with a two-year lag of data. These figures are seen as the most accurate. This inventory thus updated the CY2014 data to apply the latest NIR emission factors for fuel and grid electricity for Ontario. Since the NIR does not provide CY2015 emission factors, the Ontario Ministry of Energy provides a preliminary value in the meantime. Next year’s GHG report will update the CY2015 data to include the NIR’s official value at that time.
- Updating utility data (energy and water) based on delayed invoicing. Due to the nature of utility billing, there are sometimes delays in receiving the energy/water data in time for the GHG Inventory release. A small amount of data is thus estimated, but is corrected later in the year. Small differences from the previous year’s report data could change due to this correction.
Infrastructure Ontario-managed GHG emission results
The MOI-owned real estate portfolio, managed by Infrastructure Ontario (IO), makes up the majority of the targeted provincial GHG emissions; and as such, assumes a significant responsibility in achieving the targeted reductions. For CY2015, there was a 44% reductions in GHG emissions compared to 2006.
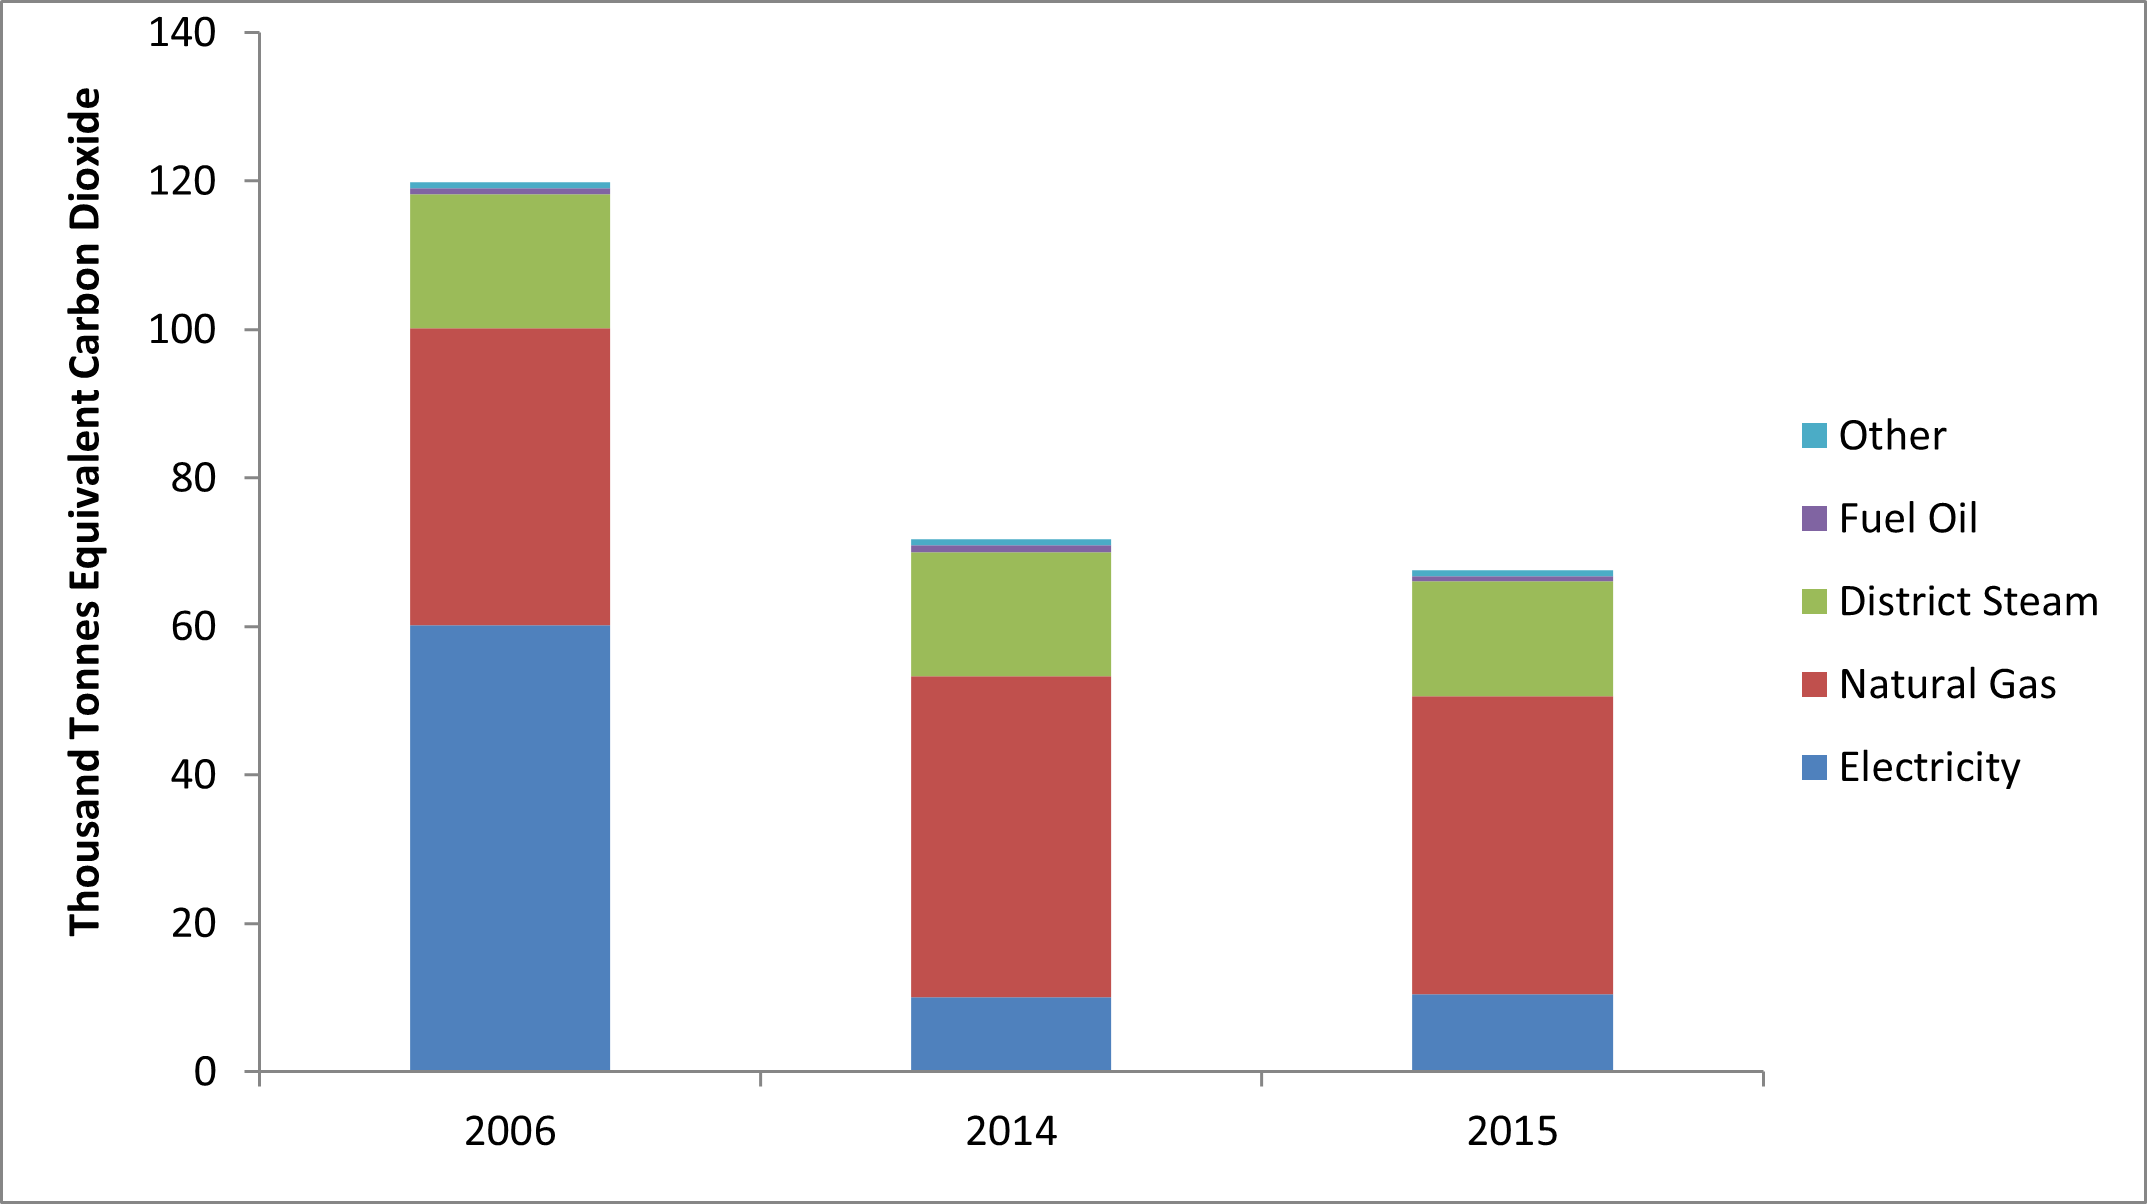
Graph 4 — IO-managed buildings Greenhouse gas emissions in 2006, 2014 and 2015 by fuel type (tCO2e)
Other fuels include: district chilled water, district hot water and propane.
| Item | 2006 | 2014 | 2015 | 2006 vs. 2015 | 2006 vs. 2014 | 2014 vs. 2015 |
|---|---|---|---|---|---|---|
| Electricity | 60,203 | 10,005 | 10,510 | (83%) | (83%) | 5% |
| Natural gas | 39,949 | 43,262 | 40,129 | 0% | 8% | (7%) |
| Fuel oil | 813 | 918 | 729 | (10%) | 13% | (21%) |
| District chilled water | 0 | 6 | 6 | N/A | N/A | 2% |
| Propane | 641 | 730 | 629 | (2%) | 14% | (14%) |
| District steam | 18,131 | 16,795 | 15,472 | (15%) | (7%) | (8%) |
| District hot water | 67 | 102 | 86 | N/A | N/A | (16%) |
| Total | 119,804 | 71,818 | 67,561 | (44%) | (40%) | (6%) |
Table 5 — IO-managed buildings Greenhouse gas emissions in 2006, 2014 and 2015 by energy type (tCO2e)
Enterprise-wide GHG emission results
Enterprise-wide reductions of for CY2015 was 32% compared to 2006. The biggest reductions are found in electricity consumption, in combination with the cleaning of the electricity grid from 2006-2015. The CY2014 data was also finalized this year and reviewed by a third-party organization with data assurance.
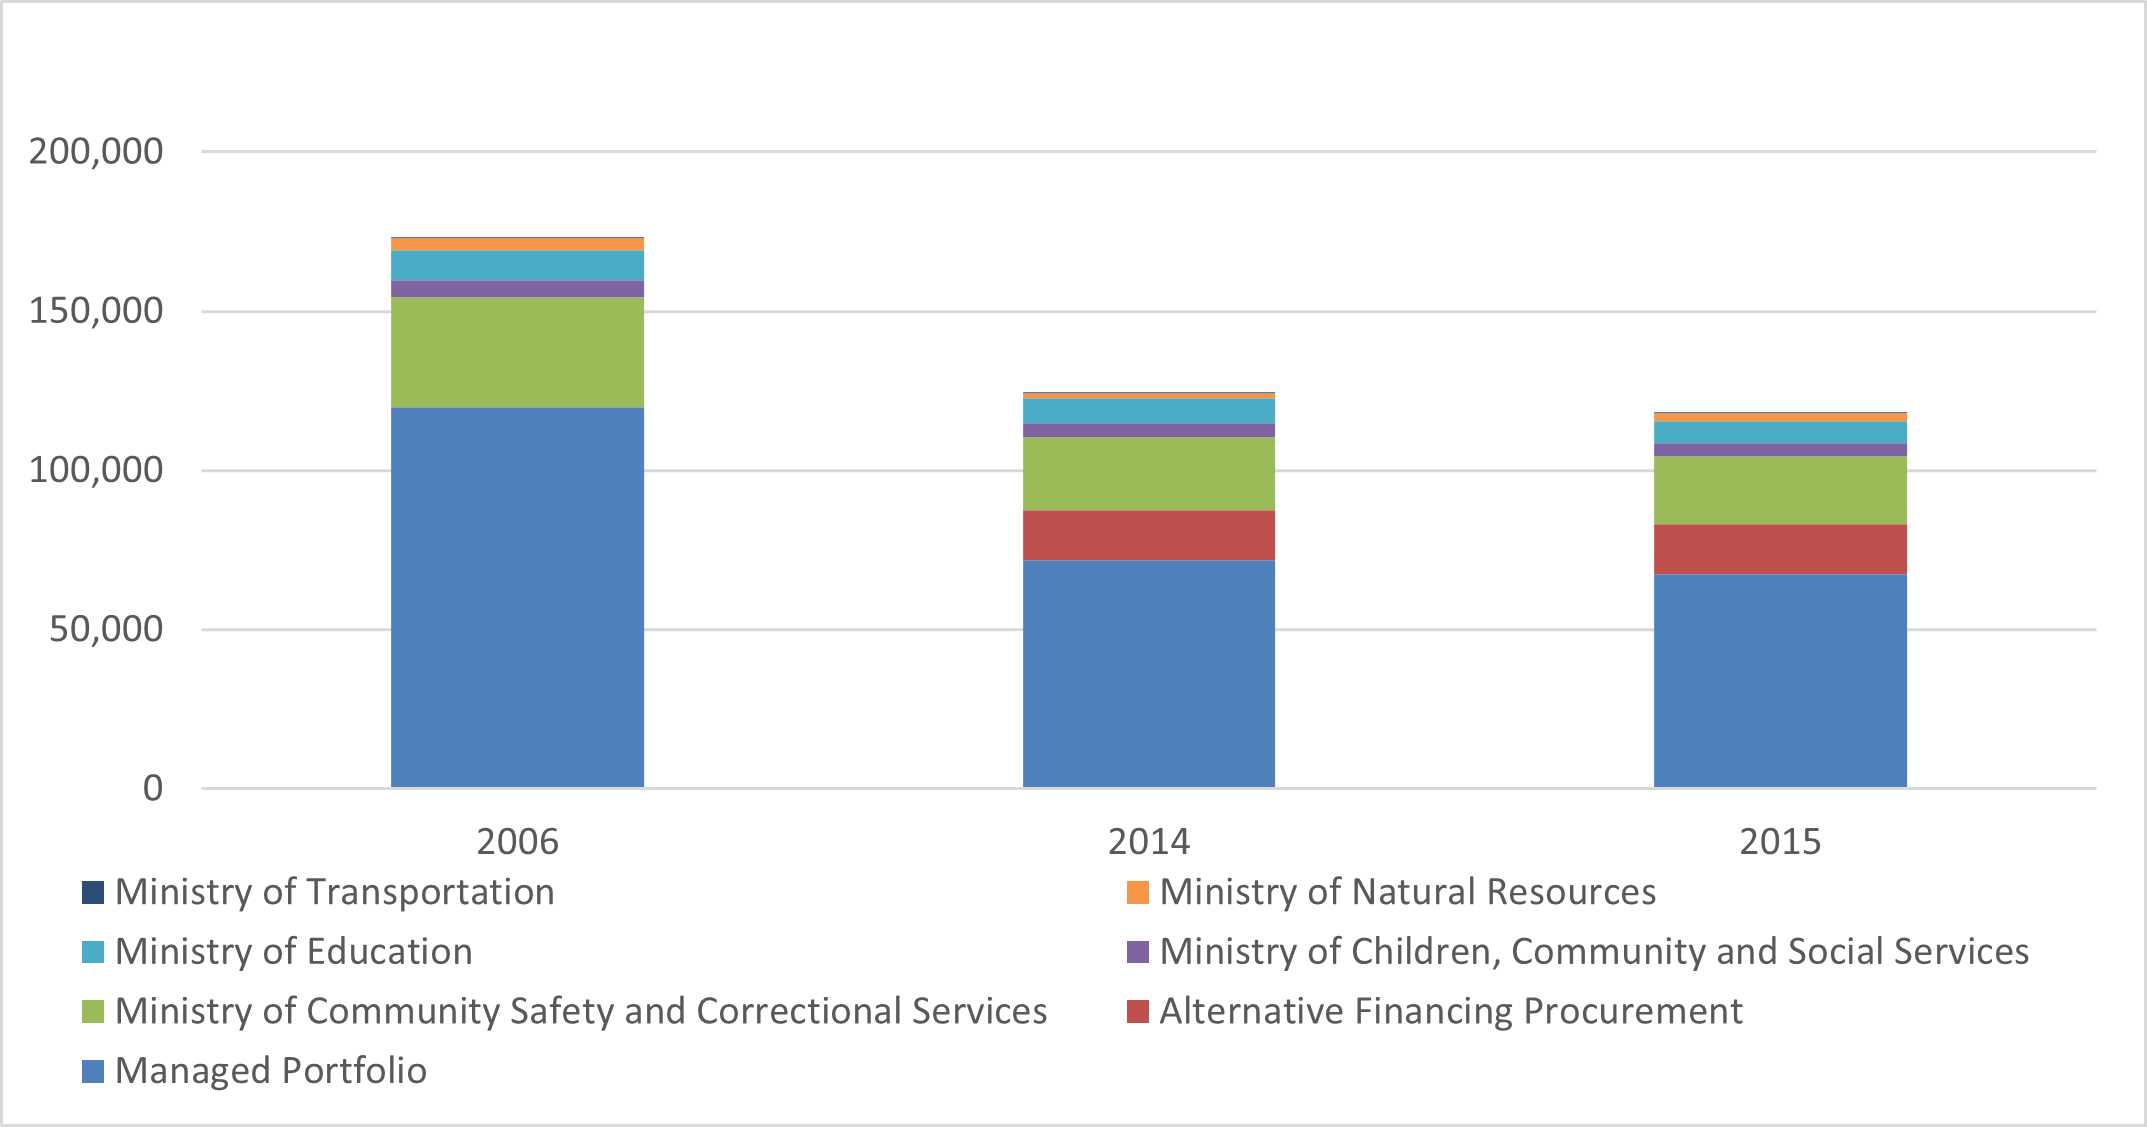
Graph 5 — Enterprise-wide GHG emissions by emitters from 2006, 2014 and 2015 (tCO2e)
Scope 1 emissions from direct fossil fuel combustion is the most significant source enterprise-wide. These are emissions due to heating needs, mainly from the combustion of natural gas, fuel oil and propane. Scope 2 emissions are from the purchase of energy sources outside the organizational boundary, mainly from: electricity and district energy (steam, hot water and chilled water).
| Organization | 2006 | 2014 | 2015 | 2006 vs. 2015 | 2006 vs. 2014 | 2014 vs. 2015 |
|---|---|---|---|---|---|---|
| IO | 119,804 | 71,818 | 67,561 | (44%) | (40%) | (6%) |
| IO-AFP | 0 | 15,668 | 15,402 | N/A | N/A | (2%) |
| MCSCS | 34,524 | 23,062 | 21,657 | (37%) | (33%) | (6%) |
| MCYS | 5,407 | 4,411 | 4,034 | (25%) | (18%) | (9%) |
| EDU | 9,486 | 7,625 | 6,728 | (29%) | (20%) | (12%) |
| MNRF | 3,770 | 1,714 | 2,694 | (29%) | (55%) | 57% |
| MTO | 255 | 119 | 123 | (52%) | (53%) | 4% |
| Total | 173,246 | 124,417 | 118,199 | (32%) | (28%) | (5%) |
Table 6 — Enterprise-wide GHG emissions for 2015, compared to 2006 baseline and 2014 (tCO2e)
Water consumption performance
CY2015 is the third year that water is being reported. Although no targets have been set for water, the province is gathering and analyzing data in anticipation of a water reduction program. Like electricity, water consumption over time fluctuates significantly depending on the occupancy of the buildings. There is, however, a general trend of decreasing water intensity compared to 2006 from the IO-managed portfolio. Office buildings and special use buildings have the largest trend of water savings with storage and warehouse facilities having an upwards trend. Water data collection tends to be inconsistent since utility invoicing is mostly quarterly and often delayed. IO is looking to work with its stakeholders to improve the data collection process and implement quality control measures for future reporting.
Updated datasets by building type are outlined in the following table. Water is tracked on an intensity basis which is more indicative of performance than just absolute values.
| Building type | 2006 | 2014 | 2015 |
|---|---|---|---|
| Assembly | 19.0 | 12.5 | 11.9 |
| Classrooms | 10.6 | 12.1 | 9.5 |
| Courthouse | 6.0 | 4.6 | 6.0 |
| Detachment | 14.9 | 10.6 | 10.5 |
| Detention | 5.6 | 6.7 | 4.9 |
| Garage-vehicle | 7.7 | 6.4 | 5.8 |
| IT facility | 0.0 | 2.8 | 2.5 |
| Jail/courthouse | - | - | 1.5 |
| Laboratory | 15.5 | 18.8 | 18.5 |
| Museum | 14.9 | 1.2 | 1.5 |
| Office A | 8.5 | 5.0 | 5.2 |
| Office B | 7.6 | 3.8 | 4.4 |
| Office C | 9.2 | 4.1 | 3.8 |
| Public info | 83.3 | 24.4 | 27.6 |
| Storage A | 0.8 | 2.9 | 2.7 |
| Warehouse | 0.0 | 4.0 | 7.3 |
Table 7 — IO-managed water consumption per gross square feet from 2006, 2014 and 2015 ((100 m3/GSF)
Challenges, risks and opportunities
Energy program funding
Drawing on lessons learned from the 2014/15 year of no funding, the IO Energy Team will continue to maximize operational opportunities and utilize alternate funding sources to ensure continued energy savings.
2020 GHG emission target uncertainty
The province achieved its 2014 GHG emission target at 33% reduction compared to the 2006 baseline (target was 19%) for Enterprise-wide. This was achieved by implementing energy efficiency equipment, energy management strategies and through the dramatic cleaning of the Ontario electricity grid with the shutting down of coal plants since 2006. The 2020 target is 27% reductions compared to the 2006 baseline. There are several factors that will influence whether that target is met, mainly any significant increases in the electricity grid emission factor due to the increased use of natural gas-fired power plants during the nuclear refurbishment process, amount of low investments into energy and GHG-saving technology into the portfolio and the risk of increased fossil fuel use for heating due to severe winter weather.
Electricity generation mix
Currently Ontario is relying on nuclear electricity generation at about 36% of its base load with the remainder made up of large-scale hydro and natural gas and some renewables. Nuclear, along with hydro, generation are essentially emissions neutral electricity sources, whereas natural gas has associated emissions due to burning of fuel. From an emissions perspective the province is benefitting from the phase out of coal and nuclear base load generation, and as a result is experiencing the lowest emissions factors in over 25 years.
In 2016/17 the province will be looking to refurbish its nuclear fleet meaning that multiple reactors will be shut down for extended periods of time. The result is that natural gas will be used as a swing resource to pick up the load of the downed nuclear. Because of the increased use of natural gas, the province can expect to have escalating emissions factors going into the 2020 target year. The grid electricity emission factor has already gone up from 2014 to 2015 (from 41gCO2e/kWh to 45.5gCO2e/kWh, as estimated by the MOE). Darlington 2 power plant is slated for scheduled refurbishment in the end of 2016, and the 2023 year has the potential to be one of the most impactful years in the refurbishment cycle with an estimated four reactors being shut down during that year in addition to the decommissioning of the Pickering 1 and 4 units in 2023.
New buildings
As new facilities are built they are added to energy and emissions reporting. As per the GHG Protocol, base year emissions are not recalculated for facilities that did not exist in the base year. Each of these new builds is added to the reporting with a baseline of zero and their energy is reported in the current year. For example, a courthouse built in 2012 would not show any savings as the 2006 baseline would be zero.
Although new builds are built to the highest standards of LEED and utilize the most modern energy management practices, the target is negatively impacted as each new build is net new added energy.
Datasets
2016 Energy Consumption and Greenhouse Gas (GHG) Emission Report
Learn more about accessing data using different formats.