2017-18 Third Quarter Finances
February 2018
The Third Quarter Financial Report contains information on Ontario's fiscal outlook for 2017-2018, as of December 31, 2017.
Introduction
The Ontario Quarterly Finances report contains updated information about Ontario’s 2017–18 fiscal outlook, including updated information about the major components of revenue and expense as set out in the 2017 Budget.
Section A: 2017–18 Fiscal Outlook
The government is continuing to project a balanced budget in 2017–18, unchanged from the 2017 Budget forecast.
New investments reported in the 2017–18 Third Quarter Finances — all accommodated within the fiscal plan — include additional funding for the Ontario Student Assistance Program (OSAP) to support higher than forecasted applications and awards, funding to make transit more affordable for commuters who use PRESTO to transfer between the Toronto Transit Commission (TTC) and GO Transit or the Union Pearson Express (UP Express), and disaster recovery support for Ontarians in Windsor and Essex County who experienced damages caused by flooding events.
Ontario’s economic outlook remains largely on track with that presented in the 2017 Ontario Economic Outlook and Fiscal Review. Private-sector forecasts, on average, estimate 2.9 per cent growth in Ontario real gross domestic product (GDP) in 2017, up from 2.4 per cent in the 2017 Budget. In 2017, 128,400 net new jobs were created, the highest number since 2003, and in recent months, the unemployment rate has declined to its lowest level since 2000.
Additional details on the Province’s fiscal performance for 2017–18 will be provided in the 2018 Budget.
| 2017–18 Budget Plan |
2017–18 Current Outlook |
2017–18 In-Year Change |
|
|---|---|---|---|
| Revenue | 150,019 | 150,134 | 115 |
| Expense – Programs | 137,173 | 137,388 | 215 |
| Expense – Interest on Debt | 12,246 | 12,246 | – |
| Total Expense | 149,419 | 149,634 | 215 |
| Surplus/(Deficit) Before Reserve | 600 | 500 | (100) |
| Reserve | 600 | 500 | (100) |
| Surplus/(Deficit) | 0 | 0 | – |
[1] Amounts reflect a presentation change for hospitals, school boards and colleges. This does not impact the Province's annual surplus/deficit results, net debt or accumulated deficit. Please see the 2017 Ontario Economic Outlook and Fiscal Review for further information.
Note: Numbers may not add due to rounding.
Revenue
The revenue outlook is unchanged from the 2017 Ontario Economic Outlook and Fiscal Review. Total revenue is projected to be $150.1 billion, $115 million higher than the 2017 Budget plan. The increase is a result of higher Government of Canada revenues and net income from Government Business Enterprises, partially offset by lower taxation revenues.
A broad range of risks could materially affect the 2017–18 revenue outlook. The government will continue to monitor economic and revenue developments and provide further details in future fiscal updates.
Expense
The 2017–18 total expense outlook is $149.6 billion, $215 million higher than the 2017 Budget forecast. Since the 2017 Ontario Economic Outlook and Fiscal Review, a number of program expense changes have been accommodated within the fiscal plan.
| 2017–18 | |
|---|---|
| Net Changes in Program Expense Reported in the 2017 Ontario Economic Outlook and Fiscal Review | 215 |
| Program Expense Changes since the 2017 Ontario Economic Outlook and Fiscal Review – Additional OSAP Funding | 118 |
| Program Expense Changes since the 2017 Ontario Economic Outlook and Fiscal Review – Supporting Children with Autism | 28 |
| Program Expense Changes since the 2017 Ontario Economic Outlook and Fiscal Review – OSAP Aid to Eligible College Students | 20 |
| Program Expense Changes since the 2017 Ontario Economic Outlook and Fiscal Review – Emergency Forest Firefighting | 18 |
| Program Expense Changes since the 2017 Ontario Economic Outlook and Fiscal Review – Disaster Recovery Assistance | 13 |
| Program Expense Changes since the 2017 Ontario Economic Outlook and Fiscal Review – Discounted Double Fare (DDF) between GO/UP and TTC | 8 |
| Program Expense Changes since the 2017 Ontario Economic Outlook and Fiscal Review – Correctional Services Transformation — Jahn Consent Order | 2 |
| Program Expense Changes since the 2017 Ontario Economic Outlook and Fiscal Review – Indigenous Youth and Community Wellness Secretariat | 1 |
| Program Expense Changes since the 2017 Ontario Economic Outlook and Fiscal Review – Pan-Canadian Public Awareness Campaign to End Violence against Indigenous Women and Girls | 1 |
| Total Program Expense Changes since the 2017 Ontario Economic Outlook and Fiscal Review | 208 |
| Less: Funds Existing in the Fiscal Framework | (208) |
| Net Program Expense Changes since the 2017 Ontario Economic Outlook and Fiscal Review | – |
| Interest on Debt | – |
| Total Expense Changes since the 2017 Budget | 215 |
Note: Numbers may not add due to rounding.
Key changes to program expense offset from the contingency funds include:
- An additional investment of $118 million for OSAP to support a higher than forecast number of applications and awards;
- An increase of $28 million to support children entering the Ontario Autism Program;
- An additional investment of $20 million to provide OSAP aid to eligible college students whose study period was extended past the normal end date due to the strike;
- An increase of $18 million to support emergency forest firefighting activities until the end of the 2017 fire season;
- An increase of $13 million through the Disaster Recovery Assistance for Ontarians program and the Municipal Disaster Recovery Assistance program to support municipalities and Ontarians for damages caused by flooding events in spring 2017;
- Funding of up to $8 million related to a fare discount for PRESTO card users who transfer between GO Transit or UP Express and the TTC;
- An increase of $2 million under Correctional Services Transformation to comply with the Jahn consent order;
- Funding of $1 million to operationalize a new temporary Indigenous Youth and Community Wellness Secretariat mandated to better coordinate the government’s response to ongoing crises in First Nation communities; and
- Funding of $1 million to support the Indigenous-led pan-Canadian public awareness campaign to end violence against Indigenous women and girls.
Other changes to program expense include the following transfers between ministries:
- A transfer of $2 million from the Ministry of Agriculture, Food and Rural Affairs to the Ministry of Energy for energy efficiency initiatives as part of the Main Street Enhancement Fund;
- A transfer of $1 million from the Ministry of the Attorney General to the Ministry of Community Safety and Correctional Services to establish an Ontario Serious Fraud Office; and
- A transfer of $1 million from the Ministry of Finance to the Ministry of Health and Long-Term Care to develop a proof-of-concept digital registration and authentication service for immunization records, which was one of the top three ideas selected for Budget Talks during consultations for the 2017 Budget.
The Province’s interest on debt expense forecast at $12.2 billion is unchanged from the 2017 Budget forecast.
Fiscal Prudence
The 2017–18 outlook maintains a $500 million reserve, $100 million lower than in the 2017 Budget. Maintaining the reserve at this level protects the fiscal outlook against adverse changes in the Province’s revenue and expense, including those resulting from changes in Ontario’s economic performance.
The current outlook also maintains contingency funds to help mitigate expense risks — particularly in cases where health and safety may be compromised or services to the most vulnerable are jeopardized — that may otherwise adversely affect Ontario’s fiscal performance.
Section B: Ontario’s Economic Outlook
Ontario’s economic growth outlook remains largely consistent with the 2017 Ontario Economic Outlook and Fiscal Review. As of January 29, 2018, private-sector forecasters, on average, project Ontario’s real GDP to increase by 2.9 per cent in 2017 and 2.3 per cent in 2018, similar to projections made at the time of the 2017 Ontario Economic Outlook and Fiscal Review.
In January, the International Monetary Fund’s World Economic Outlook Update projected growth for the world economy of 3.7 per cent in 2017, slightly stronger than the forecast at the time of the 2017 Ontario Economic Outlook and Fiscal Review. The improved outlook reflects slightly stronger growth estimates for both advanced and emerging market economies. The global growth forecast for 2018 was also revised higher to 3.9 per cent.
Downside Risks Impacting the Economic Outlook
There are a number of risks that could affect Ontario’s economic outlook. Rising interest rates and tighter mortgage borrowing requirements could cause a greater than expected slowdown in household spending and housing market activity. Potential changes to the North American Free Trade Agreement (NAFTA) could disrupt trade patterns and affect Ontario exporters. Recent tax reform in the U.S. may lessen Ontario’s competitiveness and weaken business investment.
Section C: Economic Performance
Ontario’s economy continues to grow in an uncertain global environment. Real GDP advanced by 0.3 per cent in the third quarter (July to September) of 2017, following solid gains in the first (+1.1 per cent) and second (+0.8 per cent) quarters of 2017.
The strength of Ontario’s economy has supported steady employment gains. Employment in Ontario advanced by 128,400 net new jobs (+1.8 per cent) in 2017, following a gain of 76,400 (+1.1 per cent) in 2016. The unemployment rate continues to steadily decline, reaching a 17-year low in late 2017 and remaining below the national average for 32 consecutive months.
Most key economic indicators, including retail sales, wholesale trade and manufacturing sales, posted solid gains in 2017, while housing market activity moderated following strong gains early in the year.
| Monthly 2017 October |
Monthly 2017 November |
Monthly 2017 December |
Quarterly 2017Q3 |
Quarterly 2017Q4 |
Annual 2016 |
Annual 20171 |
|
|---|---|---|---|---|---|---|---|
| Gross Domestic Product – Real GDP | N/A | N/A | N/A | 0.3 | N/A | 2.6 | N/A |
| Gross Domestic Product – Nominal GDP | N/A | N/A | N/A | 0.3 | N/A | 4.3 | N/A |
| Labour Market – Labour Force (Change in 000s) | 15.5 | 13.3 | 9.7 | 30.4 | 52.5 | 63.4 | 90.3 |
| Labour Market – Employment (Change in 000s) | 2.5 | 37.0 | 6.1 | 66.8 | 58.4 | 76.4 | 128.4 |
| Labour Market – Unemployment Rate (%) | 5.8 | 5.5 | 5.6 | 5.7 | 5.6 | 6.5 | 6.0 |
| Other Key Economic Indicators – Retail Sales | 1.0 | 0.3 | N/A | 0.7 | N/A | 7.1 | 6.9 |
| Other Key Economic Indicators – Housing Starts | (23.9) | 63.3 | (32.3) | 22.4 | (11.7) | 6.8 | 5.6 |
| Other Key Economic Indicators – MLS Home Resales | 3.1 | 7.8 | 3.3 | (11.5) | 13.6 | 9.7 | (9.5) |
| Other Key Economic Indicators – Manufacturing Sales | (2.5) | 5.8 | N/A | (5.0) | N/A | 4.0 | 2.0 |
| Other Key Economic Indicators – Wholesale Trade | 0.9 | 1.7 | N/A | 1.4 | N/A | 6.4 | 9.5 |
| Other Key Economic Indicators – Consumer Price Index2 | 1.3 | 1.9 | 1.5 | 1.5 | 1.6 | 1.8 | 1.7 |
[1] Data for retail sales, manufacturing sales and wholesale trade is calculated on a year-to-date basis up to November 2017.
[2] Per cent change from a year earlier, data not seasonally adjusted.
N/A = Data not available.
Sources: Statistics Canada, Ontario Ministry of Finance, Canada Mortgage and Housing Corporation and Canadian Real Estate Association.
Section D: Details of Ontario’s Finances
| 2017–18 Budget Plan |
2017–18 Current Outlook |
2017–18 In-Year Change |
|
|---|---|---|---|
| Taxation Revenue – Personal Income Tax | 35,032 | 33,289 | (1,743) |
| Taxation Revenue – Sales Tax2 | 26,011 | 26,308 | 297 |
| Taxation Revenue – Corporations Tax | 13,817 | 15,396 | 1,579 |
| Taxation Revenue – Education Property Tax3 | 6,002 | 5,970 | (32) |
| Taxation Revenue – Employer Health Tax | 6,117 | 6,174 | 57 |
| Taxation Revenue – Ontario Health Premium | 3,789 | 3,700 | (89) |
| Taxation Revenue – Gasoline Tax | 2,663 | 2,693 | 30 |
| Taxation Revenue – Land Transfer Tax | 3,139 | 2,869 | (270) |
| Taxation Revenue – Tobacco Tax | 1,291 | 1,230 | (61) |
| Taxation Revenue – Fuel Tax | 746 | 755 | 9 |
| Taxation Revenue – Beer and Wine Tax | 619 | 606 | (13) |
| Taxation Revenue – Electricity Payments In Lieu of Taxes | 405 | 405 | – |
| Taxation Revenue – Other Taxes | 466 | 472 | 6 |
| Total Taxation Revenue | 100,097 | 99,867 | (230) |
| Government of Canada – Canada Health Transfer | 14,340 | 14,340 | – |
| Government of Canada – Canada Social Transfer | 5,307 | 5,307 | – |
| Government of Canada – Equalization | 1,424 | 1,424 | – |
| Government of Canada – Infrastructure Programs | 2,328 | 2,328 | – |
| Government of Canada – Labour Market Programs | 977 | 977 | – |
| Government of Canada – Social Housing | 412 | 412 | – |
| Government of Canada – Other Federal Payments | 893 | 1,038 | 145 |
| Government of Canada – Direct Transfer to Broader Public Sector Organizations | 399 | 399 | - |
| Total Government of Canada | 26,080 | 26,225 | 145 |
| Government Business Enterprises – Ontario Lottery and Gaming Corporation | 2,134 | 2,334 | 200 |
| Government Business Enterprises – Liquor Control Board of Ontario | 2,137 | 2,137 | – |
| Government Business Enterprises – Ontario Power Generation Inc./Hydro One Ltd. | 617 | 617 | – |
| Total Government Business Enterprises | 4,888 | 5,088 | 200 |
| Other Non-Tax Revenue – Reimbursements | 984 | 984 | – |
| Other Non-Tax Revenue – Vehicle and Driver Registration Fees | 1,934 | 1,934 | – |
| Other Non-Tax Revenue – Electricity Debt Retirement Charge | 623 | 623 | – |
| Other Non-Tax Revenue – Power Supply Contract Recoveries | 292 | 292 | – |
| Other Non-Tax Revenue – Sales and Rentals | 3,006 | 3,006 | – |
| Other Non-Tax Revenue – Carbon Allowance Proceeds | 1,778 | 1,778 | – |
| Other Non-Tax Revenue – Other Fees and Licences | 984 | 984 | – |
| Other Non-Tax Revenue – Net Reduction of Power Purchase Contract Liability | 74 | 74 | – |
| Other Non-Tax Revenue – Royalties | 265 | 265 | – |
| Other Non-Tax Revenue – Fees, Donations and Other Revenues from Hospitals, School Boards and Colleges | 7,975 | 7,975 | – |
| Other Non-Tax Revenue – Miscellaneous Other Non-Tax Revenue | 1,039 | 1,039 | – |
| Total Other Non-Tax Revenue | 18,954 | 18,954 | – |
| Total Revenue | 150,019 | 150,134 | 115 |
[1] Amounts reflect a presentation change for hospitals, school boards and colleges. This does not impact the Province's annual surplus/deficit results, net debt or accumulated deficit. Please see the 2017 Ontario Economic Outlook and Fiscal Review for further information.
[2] Sales Tax revenue is net of the Ontario Sales Tax Credit and the energy component of the Ontario Energy and Property Tax Credit.
[3] Education Property Tax revenue is net of the property tax credit component of the Ontario Energy and Property Tax Credit and the Ontario Senior Homeowners’ Property Tax Grant.
Note: Numbers may not add due to rounding.
| Ministry Expense | 2017–18 Budget Plan |
2017–18 Current Outlook |
2017–18 In-Year Change |
|---|---|---|---|
| Accessibility Directorate of Ontario (Total) | 20.1 | 20.2 | 0.1 |
| Advanced Education and Skills Development (Total) | 10,933.3 | 11,071.7 | 138.5 |
| Agriculture, Food and Rural Affairs – Agriculture, Food and Rural Affairs (Base) | 949.1 | 987.3 | 38.2 |
| Agriculture, Food and Rural Affairs – Time-Limited Investments in Infrastructure | 77.4 | 77.4 | – |
| Agriculture, Food and Rural Affairs (Total) | 1,026.5 | 1,064.7 | 38.2 |
| Attorney General (Total) | 1,937.5 | 1,936.2 | (1.3) |
| Board of Internal Economy (Total) | 225.8 | 225.8 | – |
| Children and Youth Services (Total) | 4,443.8 | 4,473.1 | 29.3 |
| Citizenship and Immigration (Total) | 112.5 | 112.3 | (0.2) |
| Community and Social Services – Community and Social Services (Base) | 12,409.6 | 12,389.3 | (20.3) |
| Community and Social Services – Time-Limited Investments in Affordable and Supportive Housing | 9.3 | 9.3 | – |
| Community and Social Services (Total) | 12,418.9 | 12,398.6 | (20.3) |
| Community Safety and Correctional Services (Total) | 2,776.8 | 2,780.1 | 3.3 |
| Economic Development and Growth/Research, Innovation and Science (Total) | 971.0 | 978.9 | 7.9 |
| Education – Education (Base) | 27,537.9 | 27,691.1 | 153.2 |
| Education – Teachers’ Pension Plan | (531.0) | (531.0) | – |
| Education (Total) | 27,006.9 | 27,160.1 | 153.2 |
| Energy – Energy (Base) | 511.9 | 513.9 | 2.0 |
| Energy – Electricity Cost Relief Programs | 1,438.0 | 1,435.8 | (2.2) |
| Energy – Strategic Asset Management and Transformation Related to Hydro One | 100.0 | 100.0 | – |
| Energy (Total) | 2,049.9 | 2,049.7 | (0.2) |
| Environment and Climate Change (Total) | 1,023.3 | 1,114.6 | 91.3 |
| Executive Offices – Executive Offices (Base) | 56.1 | 58.5 | 2.4 |
| Executive Offices – Time-Limited Assistance | – | 4.0 | 4.0 |
| Executive Offices (Total) | 56.1 | 62.5 | 6.4 |
| Finance – Finance (Base) | 932.9 | 929.3 | (3.6) |
| Finance – Ontario Municipal Partnership Fund | 505.0 | 506.3 | 1.3 |
| Finance – Power Supply Contract Costs | 292.0 | 292.0 | – |
| Finance (Total) | 1,729.9 | 1,727.6 | (2.3) |
| Francophone Affairs (Total) | 5.3 | 6.8 | 1.4 |
| Government and Consumer Services (Total) | 593.3 | 593.3 | – |
| Health and Long-Term Care (Total) | 57,924.5 | 57,953.8 | 29.3 |
| Indigenous Relations and Reconciliation – Indigenous Relations and Reconciliation (Base) | 85.8 | 88.7 | 3.0 |
| Indigenous Relations and Reconciliation – One-Time Investments, Including Settlements | 5.0 | 21.6 | 16.6 |
| Indigenous Relations and Reconciliation (Total) | 90.8 | 110.3 | 19.6 |
| Infrastructure – Infrastructure (Base) | 173.0 | 216.7 | 43.7 |
| Infrastructure – Federal–Provincial Infrastructure Programs | 689.4 | 684.4 | (5.0) |
| Infrastructure (Total) | 862.4 | 901.1 | 38.7 |
| International Trade (Total) | 61.6 | 62.2 | 0.6 |
| Labour (Total) | 311.8 | 316.5 | 4.7 |
| Municipal Affairs/Housing – Municipal Affairs/Housing (Base) | 955.0 | 956.2 | 1.3 |
| Municipal Affairs/Housing – Time-Limited Investments | 10.0 | 22.9 | 12.9 |
| Municipal Affairs/Housing – Time-Limited Investments in Municipal, Social and Affordable Housing | 297.0 | 297.0 | – |
| Municipal Affairs/Housing (Total) | 1,262.0 | 1,276.1 | 14.1 |
| Natural Resources and Forestry – Natural Resources and Forestry (Base) | 754.6 | 775.0 | 20.5 |
| Natural Resources and Forestry – Emergency Forest Firefighting | 69.8 | 117.3 | 47.5 |
| Natural Resources and Forestry (Total) | 824.4 | 892.3 | 68.0 |
| Northern Development and Mines (Total) | 767.1 | 777.9 | 10.7 |
| Seniors Affairs (Total) | 35.3 | 35.9 | 0.6 |
| Status of Women (Total) | 25.8 | 25.8 | – |
| Tourism, Culture and Sport (Total) | 1,390.5 | 1,388.9 | (1.6) |
| Transportation – Transportation (Base) | 4,213.7 | 4,224.7 | 11.0 |
| Transportation – Time-Limited Investments in Infrastructure | 1,112.6 | 1,112.6 | – |
| Transportation (Total) | 5,326.2 | 5,337.3 | 11.0 |
| Treasury Board Secretariat – Treasury Board Secretariat (Base) | 336.8 | 335.7 | (1.1) |
| Treasury Board Secretariat – Employee and Pensioner Benefits | 1,208.0 | 1,208.0 | – |
| Treasury Board Secretariat – Operating Contingency Fund | 515.0 | 139.7 | (375.3) |
| Treasury Board Secretariat – Capital Contingency Fund | 100.0 | 49.9 | (50.1) |
| Treasury Board Secretariat (Total) | 2,159.8 | 1,733.4 | (426.4) |
| Interest on Debt2 | 12,245.6 | 12,245.6 | – |
| Year-End Savings3 | (1,200.0) | (1,200.0) | – |
| Total Expense | 149,418.8 | 149,633.5 | 214.7 |
[1] Amounts reflect a presentation change for hospitals, school boards and colleges. This does not impact the Province’s annual surplus/deficit results, net debt or accumulated deficit. Please see the 2017 Ontario Economic Outlook and Fiscal Review for further information.
[2] Interest on debt is net of interest capitalized during construction of tangible capital assets of $292 million in 2017–18.
[3] As in past years, the Year-End Savings provision reflects efficiencies through in-year expenditure management and underspending due to factors such as program management and changes in project startups and implementation plans.
Note: Numbers may not add due to rounding.
| Sector | 2017–18 Current Outlook Investment in Capital Assets1 |
2017–18 Current Outlook Transfers and Other Infrastructure Expenditures2 |
2017–18 Current Outlook Total Infrastructure Expenditures3 |
|---|---|---|---|
| Transportation – Transit | 5,440 | 1,736 | 7,176 |
| Transportation – Provincial Highways | 2,900 | 120 | 3,020 |
| Transportation – Other Transportation, Property and Planning | 172 | 183 | 355 |
| Health – Hospitals | 2,588 | 295 | 2,883 |
| Health – Other Health | 81 | 261 | 342 |
| Education | 2,636 | 53 | 2,689 |
| Postsecondary – Colleges and Other | 977 | 13 | 990 |
| Postsecondary – Universities | – | 399 | 399 |
| Social | 20 | 462 | 481 |
| Justice | 107 | 227 | 334 |
| Other Sectors4 | 651 | 960 | 1,610 |
| Total | 15,572 | 4,708 | 20,280 |
[1] Includes $292 million in interest capitalized during construction.
[2] Includes transfers to municipalities, universities and non-consolidated agencies.
[3] Includes third-party investments in hospitals, colleges and schools; and provisional federal contributions to Provincial infrastructure investments.
[4] Includes government administration, natural resources, culture and tourism sectors.
Note: Numbers may not add due to rounding.
| 2013–14 | 2014–15 | 2015–16 | Actual 2016–17 |
Current Outlook 2017–18 | |
|---|---|---|---|---|---|
| Revenue | 122,955 | 126,152 | 136,148 | 140,734 | 150,134 |
| Expense – Programs | 122,253 | 125,246 | 128,074 | 130,016 | 137,388 |
| Expense – Interest on Debt1 | 11,155 | 11,221 | 11,589 | 11,709 | 12,246 |
| Total Expense | 133,408 | 136,467 | 139,663 | 141,725 | 149,634 |
| Reserve | – | – | – | – | 500 |
| Surplus/(Deficit) | (10,453) | (10,315) | (3,515) | (991) | 0 |
| Net Debt | 267,968 | 285,403 | 295,372 | 301,648 | 311,653 |
| Accumulated Deficit | 176,634 | 187,511 | 192,029 | 193,510 | 193,510 |
| Gross Domestic Product (GDP) at Market Prices | 695,354 | 726,053 | 762,029 | 794,835 | 829,808 |
| Primary Household Income | 472,921 | 489,436 | 512,566 | 528,419 | 550,810 |
| Population – July (000s) | 13,556 | 13,680 | 13,790 | 13,976 | 14,193 |
| Net Debt per Capita (dollars) | 19,767 | 20,863 | 21,419 | 21,583 | 21,958 |
| Household Income per Capita (dollars) | 34,887 | 35,776 | 37,170 | 37,808 | 38,809 |
| Interest on Debt as a Per Cent of Revenue | 9.1% | 8.9% | 8.5% | 8.3% | 8.2% |
| Net Debt as a Per Cent of GDP | 38.5% | 39.3% | 38.8% | 38.0% | 37.6% |
| Accumulated Deficit as a Per Cent of GDP | 25.4% | 25.8% | 25.2% | 24.3% | 23.3% |
[1] Interest on debt is net of interest capitalized during construction of tangible capital assets of $134 million in 2013–14, $202 million in 2014–15, $165 million in 2015–16, $158 million in 2016–17, and $292 million in 2017–18.
Note: Numbers may not add due to rounding.
Sources: Ontario Ministry of Finance and Statistics Canada.
Section E: Ontario’s 2017–18 Borrowing Program
| 2017–18 Budget Plan |
2017–18 Current Outlook |
2017–18 In-Year Change |
|
|---|---|---|---|
| Deficit/(Surplus) | 0.0 | 0.0 | – |
| Investment in Capital Assets | 13.1 | 13.1 | – |
| Non-Cash Adjustments | (6.7) | (6.7) | – |
| Loans to Infrastructure Ontario | 0.4 | 0.4 | – |
| Other Net Loans/Investments | (0.8) | (0.7) | 0.0 |
| Debt Maturities | 17.5 | 17.4 | (0.1) |
| Debt Redemptions | 0.1 | 0.1 | – |
| Total Funding Requirement | 23.7 | 23.6 | (0.1) |
| Canada Pension Plan Borrowing | – | – | – |
| Decrease/(Increase) in Short-Term Borrowing | – | – | – |
| Increase/(Decrease) in Cash and Cash Equivalents | 6.0 | 6.0 | – |
| Pre-Borrowing from 2016–17 | (3.2) | (3.8) | (0.5) |
| Pre-Borrowing in 2017–18 for 2018–19 | – | 8.1 | 8.1 |
| Total Long-Term Public Borrowing Requirement | 26.4 | 33.9 | 7.4 |
Note: Numbers may not add due to rounding.
As of February 6, 2018, the Province had pre-borrowed $8.1 billion for 2018–19. Subject to market conditions, the Province may continue to pre-borrow over the remainder of the 2017–18 fiscal year.
Approximately 62 per cent of this year’s borrowing has been completed in Canadian dollars, with the remainder issued in U.S. dollars, euros, pound sterling, Swiss francs and Australian dollars.
| ($ Billions) | |
|---|---|
| Canadian Dollar Issues | 21.1 |
| Foreign Currency Issues | 12.8 |
| Total | 33.9 |
Ministry of Finance: www.fin.gov.on.ca
For general inquiries regarding the 2017–18 Third Quarter Finances, please call:
Toll-Free English and French inquiries:
Teletypewriter (TTY):
© Queen’s Printer for Ontario, 2018
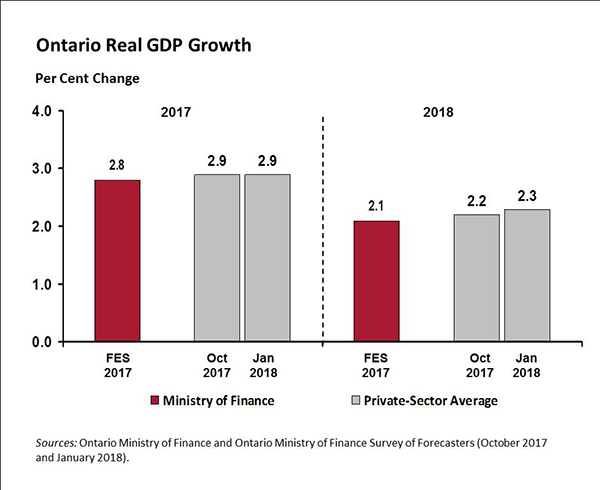
Chart Description
Chart: Ontario Real GDP Growth
This bar chart shows the 2017 Ontario Economic Outlook and Fiscal Review forecast and private-sector average forecast for Ontario real GDP growth in 2017 and 2018. The 2017 Ontario Economic Outlook and Fiscal Review projected Ontario real GDP to rise by 2.8 per cent in 2017 and 2.1 per cent in 2018. As of January 29, 2018, private-sector forecasters, on average, estimated that Ontario real GDP increased by 2.9 per cent in 2017, unchanged from the increase expected at the time of the 2017 Ontario Economic Outlook and Fiscal Review. The private-sector forecast average for Ontario real GDP growth in 2018 is 2.3 per cent, up from the 2.2 per cent increase expected at the time of the 2017 Ontario Economic Outlook and Fiscal Review.