2018-19 First Quarter Finances
August 2018
The Ontario Quarterly Finances report contains information about Ontario’s 2018–19 fiscal outlook, including information about the major components of revenue and expense as set out in the 2018 Budget.
Introduction
The 2018–19 First Quarter Finances includes information as of the end of the first quarter of the 2018–19 fiscal year (June 30, 2018), the final reporting period of the previous government.
Given that the end of the reporting period for the first quarter coincided with the swearing in of the new government, recent actions undertaken to implement its Plan for the People, including eliminating the cap and trade carbon tax, implementing immediate spending restrictions within the Ontario Public Service and making OHIP+ for children and youth more cost effective, will be reflected in subsequent fiscal updates.
The government has created the Independent Financial Commission of Inquiry. Part of the Commission's mandate is to provide advice on past accounting practices and the Province's budgetary position for the current fiscal year. The government has also begun the process of seeking outside experts to perform a line-by-line audit of all government programs and services.
Collectively, these actions will provide the government with valuable information on the state of Ontario's finances, and will inform a more comprehensive fiscal update that will be presented later this fall. As a result, the deficit projection reported in the 2018–19 First Quarter Finances is unchanged from the 2018 Budget.
Independent Financial Commission of Inquiry into Ontario's Finances
On July 17, 2018, the government established an Independent Financial Commission of Inquiry to review Ontario's past spending and accounting practices.
The Commission has a mandate to perform a retrospective assessment of government accounting practices, including pensions, electricity refinancing, and any other matters deemed relevant to inform the finalization of the 2017–18 Public Accounts of Ontario. In addition, the Commission will review, assess, and provide advice on the Province's budgetary position for 2018–19 and beyond as compared to the position presented in the 2018 Budget, in order to establish a baseline for future fiscal planning. The findings of the Commission will be provided through a final report to the government by August 30, 2018. The government has committed to making the Commission's report public.
A line-by-line review will also be undertaken to find ways to make government more efficient and effective, and ensure that all government spending is delivering results for the people of Ontario.
Collectively, these findings will help inform the government's fiscal policy moving forward.
Section A: 2018–19 Fiscal Outlook
As of June 30, 2018, the projected fiscal outlook is unchanged from the 2018 Budget forecast, with a deficit of $6.7 billion in 2018–19. The revenue and expense forecasts as of the first quarter are the same as those presented in the 2018 Budget. Policy actions and decisions undertaken by the new government to implement its Plan for the People after the end of the first quarter will be reflected in a future update.
2018–19 In-Year Fiscal Performance
| Item | 2018–19 Budget Plan | 2018–19 Outlook as of June 30 | 2018–19 In-Year Change |
|---|---|---|---|
| Revenue | 152,461 | 152,461 | – |
| Expense — Programs | 145,922 | 145,922 | – |
| Expense — Interest on Debt | 12,543 | 12,543 | – |
| Total Expense | 158,465 | 158,465 | – |
| Surplus/(Deficit) Before Reserve | (6,004) | (6,004) | – |
| Reserve | 700 | 700 | – |
| Surplus/(Deficit) | (6,704) | (6,704) | – |
Note: Numbers may not add due to rounding.
Forecasts Presented by Independent Offices of Ontario's Legislative Assembly
The 2018 Budget was released on March 28, 2018, and projected deficits of $6.7 billion in 2018–19, $6.6 billion in 2019–20, and $6.5 billion in 2020–21. The 2018 Pre-Election Report on Ontario's Finances (PER) was released concurrently with the Budget and presented the same medium-term fiscal outlook.
On April 25, 2018 the Office of the Auditor General of Ontario (OAGO) released the Review of the 2018 Pre-Election Report on Ontario's Finances. The OAGO's Review concluded that the PER outlook was not a reasonable presentation of Ontario's finances because of the understatement of expenses to pay power generators and the associated interest on the funds borrowed, as well as the understatement of pension expenses relating to the Ontario Teachers' Pension Plan and the Ontario Public Service Employees' Union Pension Plan. The OAGO estimated that the impact of these two items would increase the 2018–19 deficit outlook by $5.0 billion, resulting in a deficit projection of $11.7 billion.
| Item | 2018–19 |
|---|---|
| Payments to Power Generators and Interest on Borrowings | (2.4) |
| Unrecorded Pension Expense | (2.6) |
| Impact on 2018 Budget Surplus/(Deficit) | (5.0) |
| Surplus/(Deficit) as identified by the OAGO | (11.7) |
On May 2, 2018, the Financial Accountability Office of Ontario (FAO) released its spring 2018 Economic and Budget Outlook, which presented a forecasted deficit of $11.8 billion for 2018–19, excluding the reserve. The FAO's forecast adopted the OAGO's recommended accounting adjustments and included a $0.8 billion downward adjustment to the deficit as a result of the combined impact of lower forecasted revenue and lower interest on debt.
| Item | 2018–19 |
|---|---|
| Auditor General Recommended Adjustments | (5.0) |
| Net Impact of Lower Forecasted Revenue and Lower Forecasted Interest on Debt | (0.8) |
| Impact on 2018 Budget Surplus/(Deficit) | (5.8) |
| Surplus/(Deficit) as identified by the FAO1 | (11.8) |
[1] The FAO's fiscal projections exclude the reserve.
The Legislative Assembly's Independent Offices' forecasts are presented for illustrative purposes and do not presuppose the advice and recommendations that the Independent Financial Commission of Inquiry will provide on the Province's past accounting practices and budgetary position for 2018–19.
Revenue
As of June 30, 2018, total revenue is projected to be $152.5 billion, the same as presented in the 2018 Budget.
There are a broad range of risks – both positive and negative – that could materially affect the 2018–19 revenue outlook. Rising trade protectionism and a slower housing resale market could dampen both economic and revenue growth this year. The average private-sector forecast for Ontario 2018 real Gross Domestic Product (GDP) growth is slightly lower than at the time of the 2018 Budget, largely reflecting slower than expected economic growth during the January to March quarter. There are also risks related to the revenues being assessed through processing of 2017 Personal and Corporate Income Tax returns and revisions to entitlements under the Harmonized Sales Tax. The government will monitor these economic and revenue developments and will provide further details in future fiscal updates.
Expense
As of June 30, 2018, the 2018–19 total expense outlook is $158.5 billion, unchanged from the 2018 Budget forecast.
The Province's interest on debt expense forecast, at $12.5 billion, is unchanged from the 2018 Budget forecast.
Fiscal Prudence
The 2018 Budget included a $0.7 billion reserve in 2018–19. The reserve protects the fiscal outlook against unforeseen adverse changes in the Province's revenue and expense, including those resulting from changes in Ontario's economic performance. The 2018–19 First Quarter Finances outlook maintains the $0.7 billion reserve.
Contingency funds are also maintained to help mitigate expense risks — for example, in cases where health and safety may be compromised — that may otherwise adversely affect Ontario's fiscal performance.
Section B: Ontario's Economic Outlook
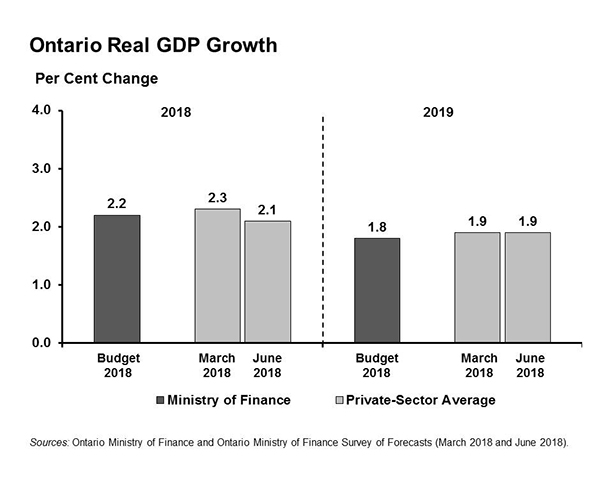
As of June 30, 2018, private-sector forecasters, on average, project Ontario's real GDP to increase by 2.1 per cent in 2018, down from 2.3 per cent at the time of the 2018 Budget. The outlook for growth in 2019 is unchanged at 1.9 per cent.
There are risks surrounding the Ontario economic outlook. Trade tensions could disrupt Ontario exports and dampen business confidence and investment. Domestically, high levels of debt have left Ontario households more sensitive to rising interest rates. At the same time, the Ontario resale housing market has weakened after a period of sharp price appreciation. During this transition, there is risk that faster-than-expected interest rate increases could lead to a more significant moderation in consumer spending growth and housing activity.
Section C: Economic Performance
Ontario's economy continues to grow at a modest pace, amidst an uncertain global environment. Real GDP advanced by 0.3 per cent in the first quarter of 2018 (January–March), following a 0.6 per cent gain in the fourth quarter of 2017. Growth in the January to March period was supported by consumer spending and gains in business investment, but was moderated by weaker exports and lower residential construction, reflecting a slowdown in home resale activity.
Ontario's economy has been supported by steady employment gains. Over the first half of 2018, employment increased by 124,900 net new jobs (+1.8 per cent) compared to the same period last year.
Most key economic indicators, including manufacturing sales, retail sales and wholesale trade, have posted gains so far in 2018. Ontario's housing market has been re-balancing over the past year, following several years of strong sales and accelerating price increases.
Ontario Key Economic Indicators
| Item | Monthly 2018 Apr | Monthly 2018 May | Monthly 2018 June | Quarterly 2018Q1 | Quarterly 2018Q2 | Annual 2017 | Year-to-date 2018 |
|---|---|---|---|---|---|---|---|
| Gross Domestic Product — Real GDP | N/A | N/A | N/A | 0.3 | N/A | 2.7 | N/A |
| Gross Domestic Product — Nominal GDP | N/A | N/A | N/A | 0.7 | N/A | 4.5 | N/A |
| Labour Market — Labour Force (Change in 000s) | 13.3 | 13.9 | 56.2 | (32.1) | 55.2 | 90.3 | 83.2 |
| Labour Market — Employment (Change in 000s) | 9.3 | 1.0 | 34.9 | (20.5) | 33.9 | 128.4 | 124.9 |
| Labour Market — Unemployment Rate (%) | 5.6 | 5.7 | 5.9 | 5.5 | 5.7 | 6.0 | 5.8 |
| Other Key Economic Indicators — Retail Sales | (1.9) | 2.6 | N/A | (0.1) | N/A | 7.7 | 3.7 |
| Other Key Economic Indicators — Housing Starts | (6.8) | (20.6) | 88.4 | 16.3 | (12.7) | 5.6 | 6.3 |
| Other Key Economic Indicators — MLS Home Resales | (4.4) | 2.8 | 8.1 | (18.2) | (0.1) | (9.9) | (22.8) |
| Other Key Economic Indicators — Manufacturing Sales | 0.3 | (0.2) | N/A | 2.2 | N/A | 1.9 | 1.3 |
| Other Key Economic Indicators — Wholesale Trade | (1.0) | (0.9) | N/A | 0.3 | N/A | 8.2 | 4.6 |
| Other Key Economic Indicators — Consumer Price Index1 | 2.1 | 2.3 | 2.4 | 2.1 | 2.3 | 1.7 | 2.2 |
[1] Per cent change from a year earlier, data not seasonally adjusted.
N/A = Data not available.
Sources: Statistics Canada, Ontario Ministry of Finance, Canada Mortgage and Housing Corporation, and Canadian Real Estate Association.
Section D: Details of Ontario's Finances
Revenue
| Item | 2018–19 Budget Plan | 2018–19 Outlook as of June 30 | 2018–19 In-Year Change |
|---|---|---|---|
| Taxation Revenue — Personal Income Tax | 35,612 | 35,612 | - |
| Taxation Revenue — Sales Tax | 26,808 | 26,808 | - |
| Taxation Revenue — Corporations Tax | 15,137 | 15,137 | - |
| Taxation Revenue — Education Property Tax | 6,076 | 6,076 | - |
| Taxation Revenue — Employer Health Tax | 6,554 | 6,554 | - |
| Taxation Revenue — Ontario Health Premium | 3,914 | 3,914 | - |
| Taxation Revenue — Gasoline Tax | 2,699 | 2,699 | - |
| Taxation Revenue — Land Transfer Tax | 3,142 | 3,142 | - |
| Taxation Revenue — Tobacco Tax | 1,250 | 1,250 | - |
| Taxation Revenue — Fuel Tax | 784 | 784 | - |
| Taxation Revenue — Beer, Wine and Spirits Taxes | 638 | 638 | - |
| Taxation Revenue — Ontario Portion of the Federal Cannabis Excise Duty | 35 | 35 | - |
| Taxation Revenue — Electricity Payments In Lieu of Taxes | 369 | 369 | - |
| Taxation Revenue — Other Taxes | 563 | 563 | - |
| Taxation Revenue — Total | 103,581 | 103,581 | - |
| Government of Canada — Canada Health Transfer | 14,934 | 14,934 | - |
| Government of Canada — Canada Social Transfer | 5,486 | 5,486 | - |
| Government of Canada — Equalization | 963 | 963 | - |
| Government of Canada — Infrastructure Programs | 1,703 | 1,703 | - |
| Government of Canada — Labour Market Programs | 998 | 998 | - |
| Government of Canada — Social Housing | 386 | 386 | - |
| Government of Canada — Other Federal Payments | 1,235 | 1,235 | - |
| Government of Canada — Direct Transfers to Broader Public-Sector Organizations | 301 | 301 | - |
| Government of Canada — Total | 26,006 | 26,006 | - |
| Income from Government Business Enterprises — Ontario Lottery and Gaming Corporation | 2,245 | 2,245 | - |
| Income from Government Business Enterprises — Liquor Control Board of Ontario | 2,234 | 2,234 | - |
| Income from Government Business Enterprises — Ontario Cannabis Retail Corporation | (40) | (40) | - |
| Income from Government Business Enterprises — Ontario Power Generation Inc./Hydro One Ltd. | 853 | 853 | - |
| Income from Government Business Enterprises — Total | 5,292 | 5,292 | - |
| Other Non-Tax Revenue — Reimbursements | 995 | 995 | - |
| Other Non-Tax Revenue — Vehicle and Driver Registration Fees | 2,003 | 2,003 | - |
| Other Non-Tax Revenue — Power Supply Contract Recoveries | 183 | 183 | - |
| Other Non-Tax Revenue — Sales and Rentals | 1,409 | 1,409 | - |
| Other Non-Tax Revenue — Carbon Allowance Proceeds | 1,979 | 1,979 | - |
| Other Non-Tax Revenue — Other Fees and Licences | 1,003 | 1,003 | - |
| Other Non-Tax Revenue — Net Reduction of Power Purchase Contract Liability | 41 | 41 | - |
| Other Non-Tax Revenue — Royalties | 295 | 295 | - |
| Other Non-Tax Revenue — Fees, Donations and Other Revenues from Hospitals, School Boards and Colleges | 8,552 | 8,552 | - |
| Other Non-Tax Revenue — Miscellaneous Other Non-Tax Revenue | 1,122 | 1,122 | - |
| Other Non-Tax Revenue — Total | 17,582 | 17,582 | - |
| Total Revenue | 152,461 | 152,461 | - |
Note: Numbers may not add due to rounding.
Total Expense
| Ministry Expense1 | 2018–19 Budget Plan | 2018–19 Outlook as of June 30 | 2018–19 In-Year Change |
|---|---|---|---|
| Accessibility Directorate of Ontario (Total) | 20.8 | 20.8 | - |
| Advanced Education and Skills Development (Total) | 11,788.5 | 11,788.5 | - |
| Agriculture, Food and Rural Affairs (Base) | 1,098.8 | 1,098.8 | - |
| Time-Limited Investments in Infrastructure | 100.0 | 100.0 | - |
| Agriculture, Food and Rural Affairs (Total) | 1,198.8 | 1,198.8 | - |
| Attorney General (Total) | 2,012.6 | 2,012.6 | - |
| Board of Internal Economy (Total) | 352.3 | 352.3 | - |
| Children and Youth Services (Total) | 4,597.7 | 4,597.7 | - |
| Citizenship and Immigration (Total) | 122.2 | 122.2 | - |
| Community and Social Services (Total) | 13,312.8 | 13,312.8 | - |
| Community Safety and Correctional Services (Total) | 3,027.0 | 3,027.0 | - |
| Economic Development and Growth/Research, Innovation and Science (Total) | 1,072.4 | 1,072.4 | - |
| Education (Base) | 29,075.3 | 29,075.3 | - |
| Teachers' Pension Plan | (861.0) | (861.0) | - |
| Education (Total) | 28,214.3 | 28,214.3 | - |
| Energy (Base) | 374.7 | 374.7 | - |
| Electricity Cost Relief Programs | 1,580.8 | 1,580.8 | - |
| Strategic Asset Management and Transformation Related to Hydro One | 35.0 | 35.0 | - |
| Energy (Total) | 1,990.5 | 1,990.5 | - |
| Environment and Climate Change (Total) | 1,326.0 | 1,326.0 | - |
| Executive Offices (Total) | 58.3 | 58.3 | - |
| Finance (Base) | 986.2 | 986.2 | - |
| Ontario Municipal Partnership Fund | 510.0 | 510.0 | - |
| Power Supply Contract Costs | 182.8 | 182.8 | - |
| Finance (Total) | 1,679.0 | 1,679.0 | - |
| Francophone Affairs, Office of (Total) | 7.8 | 7.8 | - |
| Government and Consumer Services (Total) | 585.3 | 585.3 | - |
| Health and Long-Term Care (Total) | 61,277.7 | 61,277.7 | - |
| Indigenous Relations and Reconciliation (Total) | 101.3 | 101.3 | - |
| Infrastructure (Base) | 213.3 | 213.3 | - |
| Federal–Provincial Infrastructure Programs | 603.3 | 603.3 | - |
| Infrastructure (Total) | 816.6 | 816.6 | - |
| International Trade (Total) | 61.1 | 61.1 | - |
| Labour (Total) | 330.6 | 330.6 | - |
| Municipal Affairs/Housing (Base) | 1,006.8 | 1,006.8 | - |
| Time-Limited Investments | 16.7 | 16.7 | - |
| Time-Limited Investments in Municipal, Social and Affordable Housing | 324.3 | 324.3 | - |
| Municipal Affairs/Housing (Total) | 1,347.8 | 1,347.8 | - |
| Natural Resources and Forestry (Base) | 779.9 | 779.9 | - |
| Emergency Forest Firefighting | 69.8 | 69.8 | - |
| Natural Resources and Forestry (Total) | 849.7 | 849.7 | - |
| Northern Development and Mines (Total) | 813.7 | 813.7 | - |
| Seniors Affairs (Total) | 46.5 | 46.5 | - |
| Status of Women (Total) | 37.4 | 37.4 | - |
| Tourism, Culture and Sport (Total) | 1,514.2 | 1,514.2 | - |
| Transportation (Base) | 4,678.4 | 4,678.4 | - |
| Time-Limited Investments in Infrastructure | 887.5 | 887.5 | - |
| Transportation (Total) | 5,565.9 | 5,565.9 | - |
| Treasury Board Secretariat (Base) | 346.9 | 346.9 | - |
| Employee and Pensioner Benefits | 1,271.0 | 1,271.0 | - |
| Operating Contingency Fund | 1,325.0 | 1,325.0 | - |
| Capital Contingency Fund | 275.0 | 275.0 | - |
| Treasury Board Secretariat (Total) | 3,217.9 | 3,217.9 | - |
| Interest on Debt2 | 12,542.8 | 12,542.8 | - |
| Year-End Savings3 | (1,225.0) | (1,225.0) | - |
| PRRT Savings | (200.0) | (200.0) | - |
| Total Expense | 158,464.5 | 158,464.5 | - |
[1] Reflects the Ministry structure as presented in the 2018 Budget. The impact of recently announced ministry restructuring will be reflected in future updates.
[2] Interest on debt is net of interest capitalized during construction of tangible capital assets of $456 million in 2018–19.
[3] The Year-End Savings provision reflects efficiencies through in-year expenditure management and underspending due to factors such as program management and changes in project startups and implementation plans.
Note: Numbers may not add due to rounding.
2018–19 Infrastructure Expenditures
| Sector | 2018–19 Outlook as of June 30 Investment in Capital Assets1 | 2018–19 Outlook as of June 30 Transfers and Other Infrastructure Expenditures2 | 2018–19 Outlook as of June 30 Total Infrastructure Expenditures3 |
|---|---|---|---|
| Transportation — Transit | 5,978 | 1,536 | 7,514 |
| Transportation — Provincial Highways | 2,707 | 294 | 3,000 |
| Transportation — Other Transportation, Property and Planning | 223 | 162 | 384 |
| Health — Hospitals | 2,675 | 66 | 2,741 |
| Health — Other Health | 84 | 192 | 276 |
| Education | 2,496 | 511 | 3,007 |
| Postsecondary — Colleges and Other | 783 | 10 | 793 |
| Postsecondary — Universities | – | 317 | 317 |
| Social | 14 | 475 | 489 |
| Justice | 292 | 275 | 567 |
| Other Sectors4 | 843 | 1,181 | 2,024 |
| Total | 16,094 | 5,018 | 21,112 |
[1] Includes $456 million in interest capitalized during construction.
[2] Includes transfers to municipalities, universities and non-consolidated agencies.
[3] Includes third-party investments in hospitals, colleges and schools; and federal contributions to provincial infrastructure investments.
[4] Includes government administration, natural resources, culture and tourism sectors.
Note: Numbers may not add due to rounding.
Review of Selected Financial and Economic Statistics
| Item | 2014–15 | 2015–16 | Actual 2016–17 | Interim 2017–18 | Outlook as of June 30 2018–19 |
|---|---|---|---|---|---|
| Revenue | 126,152 | 136,148 | 140,734 | 150,136 | 152,461 |
| Expense — Programs | 125,246 | 128,074 | 130,016 | 137,529 | 145,922 |
| Expense — Interest on Debt1 | 11,221 | 11,589 | 11,709 | 11,965 | 12,543 |
| Total Expense | 136,467 | 139,663 | 141,725 | 149,494 | 158,465 |
| Reserve | – | – | – | – | 700 |
| Surplus/(Deficit) | (10,315) | (3,515) | (991) | 642 | (6,704) |
| Net Debt | 285,403 | 295,372 | 301,648 | 308,203 | 325,041 |
| Accumulated Deficit | 187,511 | 192,029 | 193,510 | 192,449 | 199,153 |
| Gross Domestic Product (GDP) at Market Prices | 726,053 | 762,029 | 794,835 | 830,446 | 864,170 |
| Primary Household Income | 489,436 | 512,566 | 528,419 | 548,093 | 577,191 |
| Population – July (000s) | 13,680 | 13,790 | 13,976 | 14,193 | 14,443 |
| Net Debt per Capita (dollars) | 20,863 | 21,419 | 21,583 | 21,715 | 22,506 |
| Household Income per Capita (dollars) | 35,776 | 37,170 | 37,808 | 38,616 | 39,965 |
| Interest on Debt as a Per Cent of Revenue | 8.9% | 8.5% | 8.3% | 8.0% | 8.2% |
| Net Debt as a Per Cent of GDP | 39.3% | 38.8% | 38.0% | 37.1% | 37.6% |
| Accumulated Deficit as a Per Cent of GDP | 25.8% | 25.2% | 24.3% | 23.2% | 23.0% |
[1] Interest on debt is net of interest capitalized during construction of tangible capital assets of $202 million in 2014–15, $165 million in 2015–16, $158 million in 2016–17, $301 million in 2017–18 and $456 million in 2018–19.
Note: Numbers may not add due to rounding.
Sources: Ontario Ministry of Finance and Statistics Canada.
Section E: Ontario's 2018–19 Borrowing Program
Borrowing Program
| Item | 2018–19 Budget Plan | 2018–19 Outlook as of June 30 | 2018–19 In-Year Change |
|---|---|---|---|
| Deficit/(Surplus) | 6.7 | 6.7 | - |
| Investment in Capital Assets | 14.2 | 14.2 | - |
| Non-Cash Adjustments | (7.1) | (7.1) | - |
| Loans to Infrastructure Ontario | 0.4 | 0.4 | - |
| Other Net Loans/Investments | 1.5 | 1.5 | - |
| Debt Maturities | 21.5 | 21.5 | - |
| Debt Redemptions | 0.1 | 0.1 | - |
| Total Funding Requirement | 37.3 | 37.3 | - |
| Canada Pension Plan Borrowing | (0.0) | (0.0) | - |
| Decrease/(Increase) in Short-Term Borrowing | - | - | - |
| Increase/(Decrease) in Cash and Cash Equivalents | 6.0 | 6.0 | - |
| Preborrowing from 2017–18 | (11.5) | (11.5) | - |
| Total Long-Term Public Borrowing | 31.7 | 31.7 | - |
Note: Numbers may not add due to rounding.
The Office of the Auditor General of Ontario's Review of the 2018 Pre-Election Report on Ontario's Finances recommended that projected expense for 2018–19 be increased by a total of $5.0 billion as described in Section A of this document – OAGO's Adjustment to the 2018 Budget Surplus/(Deficit) Projection. This accounting treatment would have no impact on the province's borrowing requirement. However, if the government were to make a policy decision that the province, rather than Ontario Power Generation and the Fair Hydro Trust, would borrow in order to make payments to power generators, the Province's borrowing requirement would increase by $1.4 billion to $33.1 billion in 2018–19.
Borrowing Program Status (as at June 30, 2018)
| Item | Completed | Remaining | Total |
|---|---|---|---|
| Province | 11.3 | 19.5 | 30.6 |
| Ontario Electricity Financial Corporation | 0.4 | 0.7 | 1.1 |
| Total | 11.7 | 20.1 | 31.7 |
Note: Numbers may not add due to rounding.
Long-Term Public Borrowing completed as at June 30, 2018 totaled $11.7 billion as follows:
| Item | ($ Billions) |
|---|---|
| Canadian Dollar Issues | 9.3 |
| Foreign Currency Issues | 2.4 |
| Total | 11.7 |
As of June 30, 2018, approximately 79 per cent of this year's borrowing was completed in Canadian Dollars.
Ministry of Finance: www.fin.gov.on.ca
For general inquiries regarding the 2018–19 First Quarter Finances, please call:
Toll-free English & French inquiries:
Teletypewriter
© Queen's Printer for Ontario, 2018
Chart Description
Chart: Ontario Real GDP Growth
This bar chart shows the 2018 Budget forecast and private-sector average forecast for Ontario real GDP growth in 2018 and 2019. The 2018 Budget projected Ontario's real GDP to rise by 2.2 per cent in 2018 and 1.8 per cent in 2019. As of June 30, 2018, private-sector forecasters, on average, projected Ontario's real GDP to increase by 2.1 per cent in 2018, down from the 2.3 per cent increase expected at the time of the 2018 Budget. The private-sector forecast average for Ontario real GDP growth in 2019 is unchanged at 1.9 per cent.