2018–19 Third Quarter Finances
February 2019
The Ontario Quarterly Finances report contains information about Ontario’s 2018–19 fiscal outlook as of December 31, 2018.
Highlights
- The government of Ontario is now projecting a deficit of $13.5 billion in 2018–19. This represents an improvement of $1.0 billion from the 2018 Ontario Economic Outlook and Fiscal Review (2018 Fall Economic Statement). This improvement is the result of stronger economic growth, supported by Ontario’s open for business approach to government that is helping to increase investor confidence and foster an environment for companies to thrive and prosper.
- Ontario’s real GDP is estimated to have grown by 2.4 per cent in 2018, above the 2.0 per cent forecasted in the 2018 Fall Economic Statement.
- Employment in Ontario increased by 114,400 net new jobs in 2018 and the annual unemployment rate decreased to 5.6 per cent, the lowest since 1989.
- The government is setting Ontario down a path that will restore fiscal health and preserve critical services like health care, education and social services, while supporting business growth and helping hardworking individuals and families make ends meet.
Introduction
Since taking office in June 2018, the government’s focus has been on keeping its promises to the people, while putting Ontario back on a path to balance in order to protect healthcare, education and all other critical services that individuals and families cherish and rely upon each and every day.
Over the past several months progress has been made to reduce the provincial deficit from $15.0 billion to $13.5 billion. Despite global economic risks and uncertainty, the government continues to make Ontario open for business, and lift the chill on investment left by the fiscal and economic approach of the previous government. As a result, Ontario’s real GDP grew by 0.6 per cent in the third quarter of 2018. At the same time, the government is continuing to make services more efficient, eliminate duplication and waste, and maximize the value of government assets to ensure good value for taxpayers.
Recap of the 2018 Ontario Economic Outlook and Fiscal Review
Immediately after taking office, the government established an Independent Financial Commission of Inquiry (Commission) with a mandate to look into the previous government’s accounting practices and provide a baseline for the Province’s fiscal outlook and planning going forward.
The Commission delivered its report on August 30, 2018, and concluded that the government inherited a deficit of $15.0 billion for 2018–19 from the previous administration.
On November 15, 2018, the government published its first fiscal and economic update with the release of the 2018 Fall Economic Statement. The fiscal outlook presented in the 2018 Fall Economic Statement demonstrated the government’s immediate actions to drive efficiencies and ensure value for taxpayer dollars spent, resulting in savings of $3.2 billion, while also providing tax relief of almost $2.7 billion to families and businesses in Ontario.
The net impact of expenditure management decisions and the tax relief reported in the 2018 Fall Economic Statement reduced the deficit to $14.5 billion, or $0.5 billion less than the inherited deficit reported by the Commission.
Section A: 2018–19 Ontario’s Fiscal Outlook
The Province’s 2018–19 deficit is projected to be $13.5 billion – an improvement of $1.0 billion from the outlook published in the 2018 Fall Economic Statement, and a $1.5 billion improvement from the $15.0 billion inherited deficit identified by the Independent Financial Commission of Inquiry (Commission). This is largely due to an increase of $1.0 billion to the revenue outlook, reflecting higher household spending and stronger business profits. The outlook for total expense is $161.8 billion, mostly unchanged from the 2018 Fall Economic Statement. The 2019 Budget will provide a broader update on the government’s efforts to make every dollar count.
New funding being reported in the 2018–19 Third Quarter Finances is mostly offset by the contingency fund.
The net debt-to-GDP ratio is now projected to be 40.4 per cent in 2018–19, 0.1 percentage points lower than the 40.5 per cent forecast in the 2018 Fall Economic Statement.
| 2018–19 FES Outlook |
2018–19 Current Outlook |
2018–19 In-Year Change |
|
|---|---|---|---|
| Revenue | 148,231 | 149,230 | 999 |
| Expense — Programs | 149,232 | 149,237 | 4 |
| Expense — Interest on Debt | 12,543 | 12,543 | – |
| Total Expense | 161,775 | 161,779 | 4 |
| Surplus/(Deficit) Before Reserve | (13,544) | (12,549) | 995 |
| Reserve | 1,000 | 1,000 | – |
| Surplus/(Deficit) | (14,544) | (13,549) | 995 |
Note: Numbers may not add due to rounding.
Revenue
The 2018–19 revenue outlook is projected to be $149.2 billion, or $1.0 billion higher than forecasted in the 2018 Fall Economic Statement. The increase is due to higher Harmonized Sales Tax and Corporate Income Tax revenue arising from stronger economic growth and higher amounts from processing 2017 tax returns. This is partially offset by lower Personal Income Tax and Ontario Health Premium revenue due to lower amounts from the processing of 2017 tax returns, and lower Land Transfer Tax revenue reflecting lower-than-expected housing re-sales.
There is a $1 million decrease in Fees and Licences revenue. Lower fees for Fishing and Hunting Licences reflect the government’s decisions not to proceed with incremental fee increases that were scheduled to take effect on January 1, 2019. The government has also cancelled fee increases for vehicle, driver and carrier services that were also scheduled to take effect January 1, 2019.
Transfers from the Government of Canada have increased by approximately $4 million to provide additional resources for enforcement, disruption and prevention programs related to fighting guns and gangs across the province.
| 2018–19 | |
|---|---|
| Harmonized Sales Tax | 1,300 |
| Personal Income Tax | (700) |
| Corporate Income Tax | 600 |
| Land Transfer Tax | (300) |
| Miscellaneous Other Taxes | 120 |
| Ontario Health Premium | (25) |
| Government of Canada Transfer (Guns and Gangs Initiative) | 4 |
| Fees and Licences | (1) |
| Total In-Year Revenue Changes | 999 |
[1] Changes are shown since the 2018 Fall Economic Statement.
Note: Numbers may not add due to rounding.
The revenue changes outlined above are based on information available at the end of the third quarter. There are both upside and downside risks that could materially affect the 2018–19 revenue outlook over the rest of the fiscal year. These include economic growth performance, the finalization of results from 2017 Personal and Corporate Income Tax returns and risks related to electricity sector revenue. The government will monitor these economic and revenue developments and will provide further details in future fiscal updates.
Expense
The outlook for total expense in 2018–19 is $161.8 billion, an increase of approximately $4 million compared to the 2018 Fall Economic Statement, due to additional funding to fight guns and gangs.
| 2018–19 | |
|---|---|
| In-Year Approvals Offset by Contingency Fund — OSAP funding requirements | 208 |
| In-Year Approvals Offset by Contingency Fund — Emergency Firefighting | 42 |
| Changes to Contingency Fund to Offset In-Year Approvals | (250) |
| In-Year Approvals Offset by Federal Revenue — Guns and Gangs Initiative (Offset by Government of Canada Transfer) | 4 |
| Interest on Debt Change | – |
| Net In-Year Expense Changes | 4 |
[1] Changes are shown since the 2018 Fall Economic Statement.
Note: Numbers may not add due to rounding.
Key changes to program expense offset by the contingency fund include:
- $208 million for the Ontario Student Assistance Program (OSAP), primarily as a result of the number of people receiving financial aid increasing faster than enrolment due to the previous government’s unsustainable program design. In January 2019 the government announced it will be refocussing OSAP to ensure it remains sustainable and viable for future generations of students; and
- $42 million for 2018 emergency forest firefighting.
Other changes to program expense include:
- Approximately $4 million to provide resources for enforcement, disruption and prevention programs related to fighting guns and gangs across the province.
The Province’s interest on debt expense forecast, at $12.5 billion, is unchanged from the 2018 Fall Economic Statement.
Fiscal Prudence
Based on the Commission’s recommendation, the 2018 Fall Economic Statement included a $1.0 billion reserve in 2018–19 to protect the fiscal outlook against unforeseen adverse changes in the Province’s revenue and expense, including those resulting from changes in Ontario’s economic performance. The current fiscal outlook maintains the reserve at this level.
Contingency funds are also maintained to help mitigate expense risks — for example, in cases where health and safety may be compromised — that may otherwise adversely affect Ontario’s fiscal performance.
Section B: Ontario’s Economic Outlook
The Ministry of Finance estimates that Ontario’s real GDP grew by 2.4 per cent in 2018, above the 2.0 per cent projected in the 2018 Fall Economic Statement. As of January 23, 2019, private-sector forecasters, on average, expect growth of 1.9 per cent in 2019, unchanged from the time of the 2018 Fall Economic Statement.
There are a broad range of risks – both positive and negative – surrounding the Ontario economic outlook. Tax reform in the United States could provide greater than expected support for US growth and Ontario exports. Heightened uncertainty about protectionism and global trade arrangements has contributed to increased volatility in financial markets and weighed against exports and business investment activity. The International Monetary Fund lowered their projection for global growth in 2019 to 3.5 per cent in their January World Economic Outlook Update from 3.7 per cent published in October.
Domestically, high levels of debt have left Ontario households more sensitive to rising interest rates. Higher interest rates will raise debt service burdens which could cause reduced spending while higher Canada Pension Plan contributions and the forthcoming federal Carbon Tax could also have a more adverse impact on economic growth than reflected in current forecasts.
Section C: Ontario’s Economic Performance
The Ontario economy has performed well in recent months, with employment advancing steadily over the second half of 2018. In 2018, employment increased by 114,400 net new jobs (+1.6 per cent).
In the third quarter of 2018 (July, August, September), Ontario’s real GDP rose by 0.6 per cent. Third quarter growth was supported by continued gains in household spending. Many other key economic indicators posted gains in 2018, including manufacturing sales, retail sales and wholesale trade.
Part-time employment in the province declined by 15,900 jobs in 2018, following the increase of the minimum wage on January 1, 2018. The government has introduced one of the most generous Ontario tax cuts for low-income workers in a generation, the Low-income Individuals and Families Tax (LIFT) credit. Starting with the 2019 tax year, the LIFT credit will benefit about 1.1 million people and result in more low-income workers paying little or no Ontario Personal Income Tax.
| Monthly 2018 Oct |
Monthly 2018 Nov |
Monthly 2018 Dec |
Quarterly 2018Q3 |
Quarterly 2018Q4 |
Annual 2017 |
Annual 20181 |
|
|---|---|---|---|---|---|---|---|
| Gross Domestic Product — Real GDP | N/A | N/A | N/A | 0.6 | N/A | 2.8 | 2.42 |
| Gross Domestic Product — Nominal GDP | N/A | N/A | N/A | 1.3 | N/A | 4.1 | 3.83 |
| Labour Market — Employment (Change in 000s) | 1.1 | 16.9 | 16.1 | 40.8 | 18.4 | 128.4 | 114.4 |
| Labour Market — Unemployment Rate (%) | 5.6 | 5.6 | 5.4 | 5.7 | 5.5 | 6.0 | 5.6 |
| Other Key Economic Indicators — Retail Sales | 1.0 | (1.6) | N/A | 2.3 | N/A | 7.7 | 4.1 |
| Other Key Economic Indicators — Housing Starts | 16.8 | (6.1) | (17.6) | (8.5) | 18.6 | 5.6 | (0.5) |
| Other Key Economic Indicators — International Goods Exports | 4.4 | (0.3) | N/A | (0.6) | N/A | (3.0) | 1.8 |
| Other Key Economic Indicators — International Goods Imports | 1.5 | (1.6) | N/A | 0.4 | N/A | 4.0 | 2.1 |
| Other Key Economic Indicators — Manufacturing Sales | 0.7 | (1.1) | N/A | 0.7 | N/A | 1.9 | 3.7 |
| Other Key Economic Indicators — Wholesale Trade | 2.1 | (1.4) | N/A | 0.3 | N/A | 8.2 | 2.8 |
| Other Key Economic Indicators — Consumer Price Index4 | 2.5 | 1.8 | 2.3 | 2.8 | 2.2 | 1.7 | 2.4 |
[1] Retail Sales, Wholesale Trade, Manufacturing Sales and International Trade are expressed on a year-to-date basis.
[2], [3] 2018 GDP growth is a Ministry of Finance estimate.
[4] Per cent change from a year earlier, data not seasonally adjusted.
N/A = Data not yet available.
Sources: Statistics Canada, Ontario Ministry of Finance, Canada Mortgage and Housing Corporation, and Canadian Real Estate Association.
Section D: Details of Ontario’s Finances
| 2018–19 FES Outlook |
2018–19 Current Outlook |
2018–19 In-Year Change |
|
|---|---|---|---|
| Taxation Revenue — Personal Income Tax | 34,946 | 34,246 | (700) |
| Taxation Revenue — Sales Tax1 | 26,727 | 28,027 | 1,300 |
| Taxation Revenue — Corporations Tax | 13,766 | 14,366 | 600 |
| Taxation Revenue — Education Property Tax2 | 6,076 | 6,076 | – |
| Taxation Revenue — Employer Health Tax | 6,494 | 6,494 | – |
| Taxation Revenue — Ontario Health Premium | 3,870 | 3,845 | (25) |
| Taxation Revenue — Gasoline Tax | 2,699 | 2,699 | – |
| Taxation Revenue — Land Transfer Tax | 2,710 | 2,410 | (300) |
| Taxation Revenue — Tobacco Tax | 1,250 | 1,250 | – |
| Taxation Revenue — Fuel Tax | 784 | 784 | – |
| Taxation Revenue — Beer, Wine and Spirits Taxes | 630 | 630 | – |
| Taxation Revenue — Ontario Portion of the Federal Cannabis Excise Duty | 17 | 17 | – |
| Taxation Revenue — Electricity Payments In Lieu of Taxes | 369 | 369 | – |
| Taxation Revenue — Other Taxes | 563 | 683 | 120 |
| Taxation Revenue — Total | 100,901 | 101,897 | 996 |
| Government of Canada — Canada Health Transfer | 14,934 | 14,934 | – |
| Government of Canada — Canada Social Transfer | 5,486 | 5,486 | – |
| Government of Canada — Equalization | 963 | 963 | – |
| Government of Canada — Infrastructure Programs | 1,703 | 1,703 | – |
| Government of Canada — Labour Market Programs | 998 | 998 | – |
| Government of Canada — Social Housing Agreement | 386 | 386 | – |
| Government of Canada — Other Federal Payments | 1,235 | 1,239 | 4 |
| Government of Canada — Direct Transfers to Broader Public-Sector Organizations | 301 | 301 | – |
| Government of Canada — Total | 26,006 | 26,010 | 4 |
| Income from Government Business Enterprises — Ontario Lottery and Gaming Corporation | 2,245 | 2,245 | – |
| Income from Government Business Enterprises — Liquor Control Board of Ontario | 2,234 | 2,234 | – |
| Income from Government Business Enterprises — Ontario Cannabis Store | (25) | (25) | – |
| Income from Government Business Enterprises — Ontario Power Generation Inc./Hydro One Ltd. | 794 | 794 | – |
| Income from Government Business Enterprises — Total | 5,248 | 5,248 | – |
| Other Non-Tax Revenue — Reimbursements | 995 | 995 | – |
| Other Non-Tax Revenue — Vehicle and Driver Registration Fees | 2,001 | 2,000 | (1) |
| Other Non-Tax Revenue — Electricity Debt Retirement Charge | – | – | – |
| Other Non-Tax Revenue — Power Supply Contract Recoveries | 183 | 183 | – |
| Other Non-Tax Revenue — Sales and Rentals | 1,409 | 1,409 | – |
| Other Non-Tax Revenue — Carbon Allowance Proceeds | 472 | 472 | – |
| Other Non-Tax Revenue — Other Fees and Licences | 1,006 | 1,005 | (1) |
| Other Non-Tax Revenue — Net Reduction of Power Purchase Contracts | 41 | 41 | – |
| Other Non-Tax Revenue — Royalties | 295 | 295 | – |
| Other Non-Tax Revenue — Fees, Donations and Other Revenues from Hospitals, School Boards and Colleges | 8,552 | 8,552 | – |
| Other Non-Tax Revenue — Miscellaneous Other Non-Tax Revenue | 1,122 | 1,122 | – |
| Other Non-Tax Revenue — Total | 16,076 | 16,075 | (1) |
| Total Revenue | 148,231 | 149,230 | 999 |
[1] Sales Tax revenue is net of the Ontario Sales Tax Credit and the energy component of the Ontario Energy and Property Tax Credit.
[2] Education Property Tax revenue is net of the property tax credit component of the Ontario Energy and Property Tax Credit and the Ontario Senior Homeowners’ Property Tax Grant.
Note: Numbers may not add due to rounding.
| Ministry Expense1 | 2018–19 FES Outlook |
2018–19 Current Outlook |
2018–19 In-Year Change |
|---|---|---|---|
| Agriculture, Food and Rural Affairs (Total) | 1,177.2 | 1,177.2 | – |
| Attorney General (Total) | 1,970.7 | 1,972.3 | 1.6 |
| Board of Internal Economy (Total) | 352.3 | 352.3 | – |
| Children, Community and Social Services (Total) | 17,008.3 | 17,008.3 | – |
| Community Safety and Correctional Services (Total) | 2,906.8 | 2,909.5 | 2.7 |
| Economic Development, Job Creation and Trade (Total) | 1,025.9 | 1,025.9 | – |
| Education — Education (Base) | 29,012.0 | 29,012.2 | 0.2 |
| Education — Teachers’ Pension Plan2 | 1,725.0 | 1,725.0 | – |
| Education (Total) | 30,737.0 | 30,737.2 | 0.2 |
| Energy, Northern Development and Mines (Total) | 4,829.7 | 4,829.7 | – |
| Environment, Conservation and Parks (Total) | 975.0 | 975.0 | – |
| Executive Offices (Total) | 46.7 | 46.7 | – |
| Finance — Finance (Base) | 945.7 | 945.7 | – |
| Finance — Ontario Municipal Partnership Fund | 510.0 | 510.0 | – |
| Finance — Power Supply Contract Costs | 182.8 | 182.8 | – |
| Finance (Total) | 1,638.5 | 1,638.5 | – |
| Government and Consumer Services (Total) | 652.9 | 652.9 | – |
| Health and Long-Term Care (Total) | 61,678.2 | 61,678.2 | – |
| Indigenous Affairs (Total) | 95.3 | 95.3 | – |
| Infrastructure — Infrastructure (Base) | 112.9 | 112.9 | – |
| Infrastructure — Federal–Provincial Infrastructure Programs | 603.3 | 603.3 | – |
| Infrastructure (Total) | 716.2 | 716.2 | – |
| Labour (Total) | 319.3 | 319.3 | – |
| Municipal Affairs and Housing (Total) | 1,211.6 | 1,211.6 | – |
| Natural Resources and Forestry — Natural Resources and Forestry (Base) | 655.1 | 655.1 | – |
| Natural Resources and Forestry — Emergency Forest Firefighting | 169.8 | 211.8 | 42.0 |
| Natural Resources and Forestry (Total) | 824.9 | 866.9 | 42.0 |
| Ministry of Francophone Affairs (Total) | 6.1 | 6.1 | – |
| Seniors and Accessibility (Total) | 65.0 | 65.0 | – |
| Tourism, Culture and Sport (Total) | 1,450.2 | 1,450.2 | – |
| Training, Colleges and Universities (Total) | 11,374.2 | 11,582.2 | 208.0 |
| Transportation — Transportation (Base) | 4,373.2 | 4,373.2 | – |
| Transportation — Federal-Provincial Infrastructure Programs | 887.5 | 887.5 | – |
| Transportation (Total) | 5,260.8 | 5,260.8 | – |
| Treasury Board Secretariat — Treasury Board Secretariat (Base) | 292.9 | 292.9 | – |
| Treasury Board Secretariat — Employee and Pensioner Benefits3 | 1,335.0 | 1,335.0 | – |
| Treasury Board Secretariat — Operating Contingency Fund | 1,006.6 | 756.6 | (250.0) |
| Treasury Board Secretariat — Capital Contingency Fund | 275.0 | 275.0 | – |
| Treasury Board Secretariat (Total) | 2,909.5 | 2,659.5 | (250.0) |
| Interest on Debt4 | 12,542.8 | 12,542.8 | – |
| Year-End Savings | – | – | – |
| Total Expense | 161,775.0 | 161,779.55 | 4.56 |
[1] Numbers reflect current ministry structures that were announced on June 29, 2018.
[2], [3] Numbers reflect the pension expense that was calculated based on recommendations of the Independent Financial Commission of Inquiry, as described in Note 19 to the Consolidated Financial Statements in Public Accounts of Ontario 2017–2018.
[4] Interest on debt is net of interest capitalized during construction of tangible capital assets of $456 million in 2018–19.
[5], [6] These numbers round to $161,779 and $4 million, respectively.
Note: Numbers may not add due to rounding.
| Sector | 2018–19 Current Outlook Investment in Capital Assets1 |
2018–19 Current Outlook Transfers and Other Infrastructure Expenditures2 |
2018–19 Current Outlook Total Infrastructure Expenditures3 |
|---|---|---|---|
| Transportation — Transit | 4,725 | 1,364 | 6,088 |
| Transportation — Provincial Highways | 2,697 | 275 | 2,972 |
| Transportation — Other Transportation, Property and Planning | 217 | 75 | 292 |
| Health — Hospitals | 2,559 | 66 | 2,625 |
| Health — Other Health | 84 | 190 | 273 |
| Education | 2,476 | 511 | 2,987 |
| Postsecondary — Colleges and Other | 757 | 9 | 765 |
| Postsecondary — Universities | – | 250 | 250 |
| Social | 14 | 361 | 374 |
| Justice | 292 | 261 | 553 |
| Other Sectors4 | 816 | 1,063 | 1,879 |
| Total Infrastructure Expenditures | 14,637 | 4,422 | 19,059 |
[1] Includes $456 million in interest capitalized during construction.
[2] Includes transfers to municipalities, universities and non-consolidated agencies.
[3] Includes third-party investments in hospitals, colleges and schools; and provisional federal contributions to Provincial infrastructure investments.
[4] Includes government administration, natural resources, and culture and tourism sectors.
Note: Numbers may not add due to rounding.
| 2014–15 | 2015–16 | 2016–17 | Actual 2017–18 |
Current Outlook | |
|---|---|---|---|---|---|
| Revenue | 126,152 | 136,148 | 140,734 | 150,594 | 149,230 |
| Expense — Programs | 126,199 | 129,905 | 131,460 | 142,363 | 149,237 |
| Expense — Interest on Debt3 | 11,221 | 11,589 | 11,709 | 11,903 | 12,543 |
| Total Expense | 137,420 | 141,494 | 143,169 | 154,266 | 161,779 |
| Reserve4 | – | – | – | – | 1,000 |
| Surplus/(Deficit) | (11,268) | (5,346) | (2,435) | (3,672) | (13,549) |
| Net Debt | 294,557 | 306,357 | 314,077 | 323,834 | 346,060 |
| Accumulated Deficit | 196,665 | 203,014 | 205,939 | 209,023 | 222,572 |
| Gross Domestic Product (GDP) at Market Prices | 726,053 | 759,440 | 792,932 | 825,805 | 857,557 |
| Primary Household Income | 489,436 | 511,577 | 519,413 | 544,062 | 567,914 |
| Population – July (000s) | 13,618 | 13,707 | 13,875 | 14,071 | 14,323 |
| Net Debt per Capita (dollars) | 21,631 | 22,350 | 22,636 | 23,014 | 24,162 |
| Household Income per Capita (dollars) | 35,942 | 37,322 | 37,434 | 38,664 | 39,651 |
| Interest on Debt as a Per Cent of Revenue | 8.9% | 8.5% | 8.3% | 7.9% | 8.4% |
| Net Debt as a Per Cent of GDP | 40.6% | 40.3% | 39.6% | 39.2% | 40.4% |
| Accumulated Deficit as a Per Cent of GDP | 27.1% | 26.7% | 26.0% | 25.3% | 26.0% |
[1] Amounts reflect a change in pension expense that was calculated based on recommendations by the Independent Financial Commission of Inquiry, as described in Note 19 to the Consolidated Financial Statements, in Public Accounts of Ontario 2017–2018. Amounts for net debt and accumulated deficit also reflect this change.
[2] Revenues and expenses have been restated to reflect the following fiscally neutral changes: i) revised presentation of education property taxes to be included in the taxation revenues; ii) reclassification of certain Government Business Enterprises to other government organizations; iii) reclassification of a number of tax measures that provide a financial benefit through the tax system to be reported as expenses; and iv) change in presentation of third-party revenue for hospitals, school boards and colleges to be reported as revenue.
[3] Interest on debt is net of interest capitalized during construction of tangible capital assets of $202 million in 2014–15, $165 million in 2015–16, $159 million in 2016–17, $157 million in 2017–18 and $456 million in 2018–19.
[4] The reserve is a forecasting provision to protect the fiscal outlook against unforeseen adverse changes in the province’s revenues and expense. Once the fiscal year is complete, any unused portion of the reserve is no longer needed and is drawn down, therefore it only appears in the current year.
Note: Numbers may not add due to rounding.
Sources: Ontario Ministry of Finance and Statistics Canada.
Section E: Ontario’s 2018–19 Borrowing Program
The Province’s total funding requirement in 2018–19 is forecast to be $1.0 billion lower than anticipated in the 2018 Fall Economic Statement, reflecting the improvement in the projected deficit. As of February 5, 2019, the Province had borrowed $3.3 billion more than was required to complete the 2018–19 borrowing program. The Province will use this $3.3 billion, and all long-term borrowing issued between now and March 31, 2019, to continue to increase its cash reserves, thereby lowering next year’s borrowing requirements. As committed in the 2018 Fall Economic Statement, the Province issued its fifth Green Bond, for $950 million in January 2019.
| 2018–19 FES Outlook |
2018–19 Current Outlook |
2018–19 In-Year Change |
|
|---|---|---|---|
| Deficit/(Surplus) | 14.5 | 13.5 | (1.0) |
| Investment in Capital Assets | 12.8 | 12.8 | – |
| Non-Cash Adjustments | (7.4) | (7.4) | – |
| Loans to Infrastructure Ontario | 0.4 | 0.4 | – |
| Other Net Loans/Investments | (0.0) | (0.0) | – |
| Debt Maturities | 21.8 | 21.8 | – |
| Debt Redemptions | 0.1 | 0.1 | – |
| Total Funding Requirement | 42.1 | 41.1 | (1.0) |
| Canada Pension Plan Borrowing | (0.0) | (0.0) | – |
| Decrease/(Increase) in Short-Term Borrowing | – | – | – |
| Increase/(Decrease) in Cash and Cash Equivalents | 3.5 | 6.8 | 3.3 |
| Pre-Borrowing from 2017–18 | (12.4) | (12.4) | – |
| Total Long-Term Public Borrowing | 33.2 | 35.5 | 2.3 |
Note: Numbers may not add due to rounding.
Going back to the beginning of fiscal 2010–11, Ontario has issued $78.8 billion of bonds longer than 30 years to lock in low interest rates. As a result, the weighted-average term to maturity of long-term Provincial debt issued has been extended significantly, from 9.7 years in 2009–10 to 10.8 years for 2018–19 as of December 31, 2018.
Long-term public borrowing completed as of February 5, 2019 totaled $35.5 billion. Approximately 75 per cent of this year’s borrowing has been completed in Canadian dollars, with the remainder issued in U.S. dollars, euros and Australian dollars.
| ($ Billions) | |
|---|---|
| Canadian Dollar Issues | 26.5 |
| Foreign Currency Issues | 9.0 |
| Total | 35.5 |
Ministry of Finance
For general inquiries regarding the 2018–19 Third Quarter Finances, please call:
Toll-free English & French inquiries:
Teletypewriter (TTY):
© Queen’s Printer for Ontario, 2019
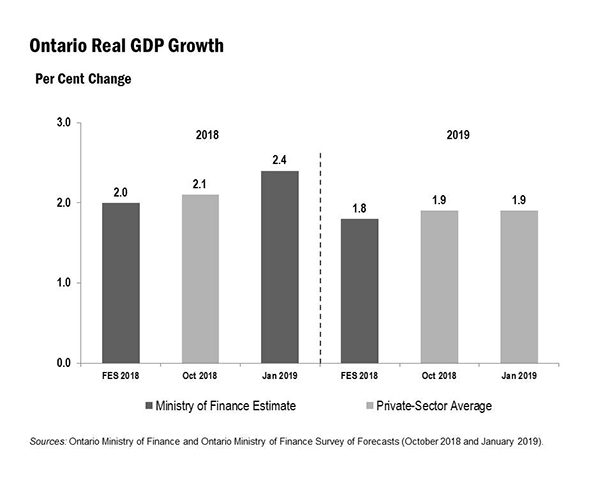
Chart Description
Chart: Ontario Real GDP Growth
This bar chart shows the 2018 Fall Economic Statement forecast and private-sector average forecast for Ontario real GDP growth in 2018 and 2019. The 2018 Fall Economic Statement projected Ontario’s real GDP to rise by 2.0 per cent in 2018 and 1.8 per cent in 2019. The Ministry of Finance estimates that Ontario’s real GDP grew by 2.4 per cent in 2018, up from the 2.0 per cent expected by the Ministry of Finance and the 2.1 per cent projected by private-sector forecasters at the time of the 2018 Fall Economic Statement. As of January 23, 2019, private-sector forecasters, on average, projected Ontario’s real GDP to increase by 1.9 per cent in 2019, unchanged from the private-sector average in the 2018 Fall Economic Statement.