Air quality inside broiler barns: Comparing straw and peat moss bedding
Learn about comparing the use of peat moss and straw bedding materials in broiler barns. This technical information is for Ontario poultry producers.
ISSN 1198-712X, Published February 2025
Introduction
This fact sheet describes an on-farm research project in Ontario that measured and evaluated the air quality inside 2 commercial broiler barns comparing the use of peat moss and straw bedding materials. The project evaluated the measured dust levels inside the barns, their impact on bird health and possible concerns for people working in this environment.
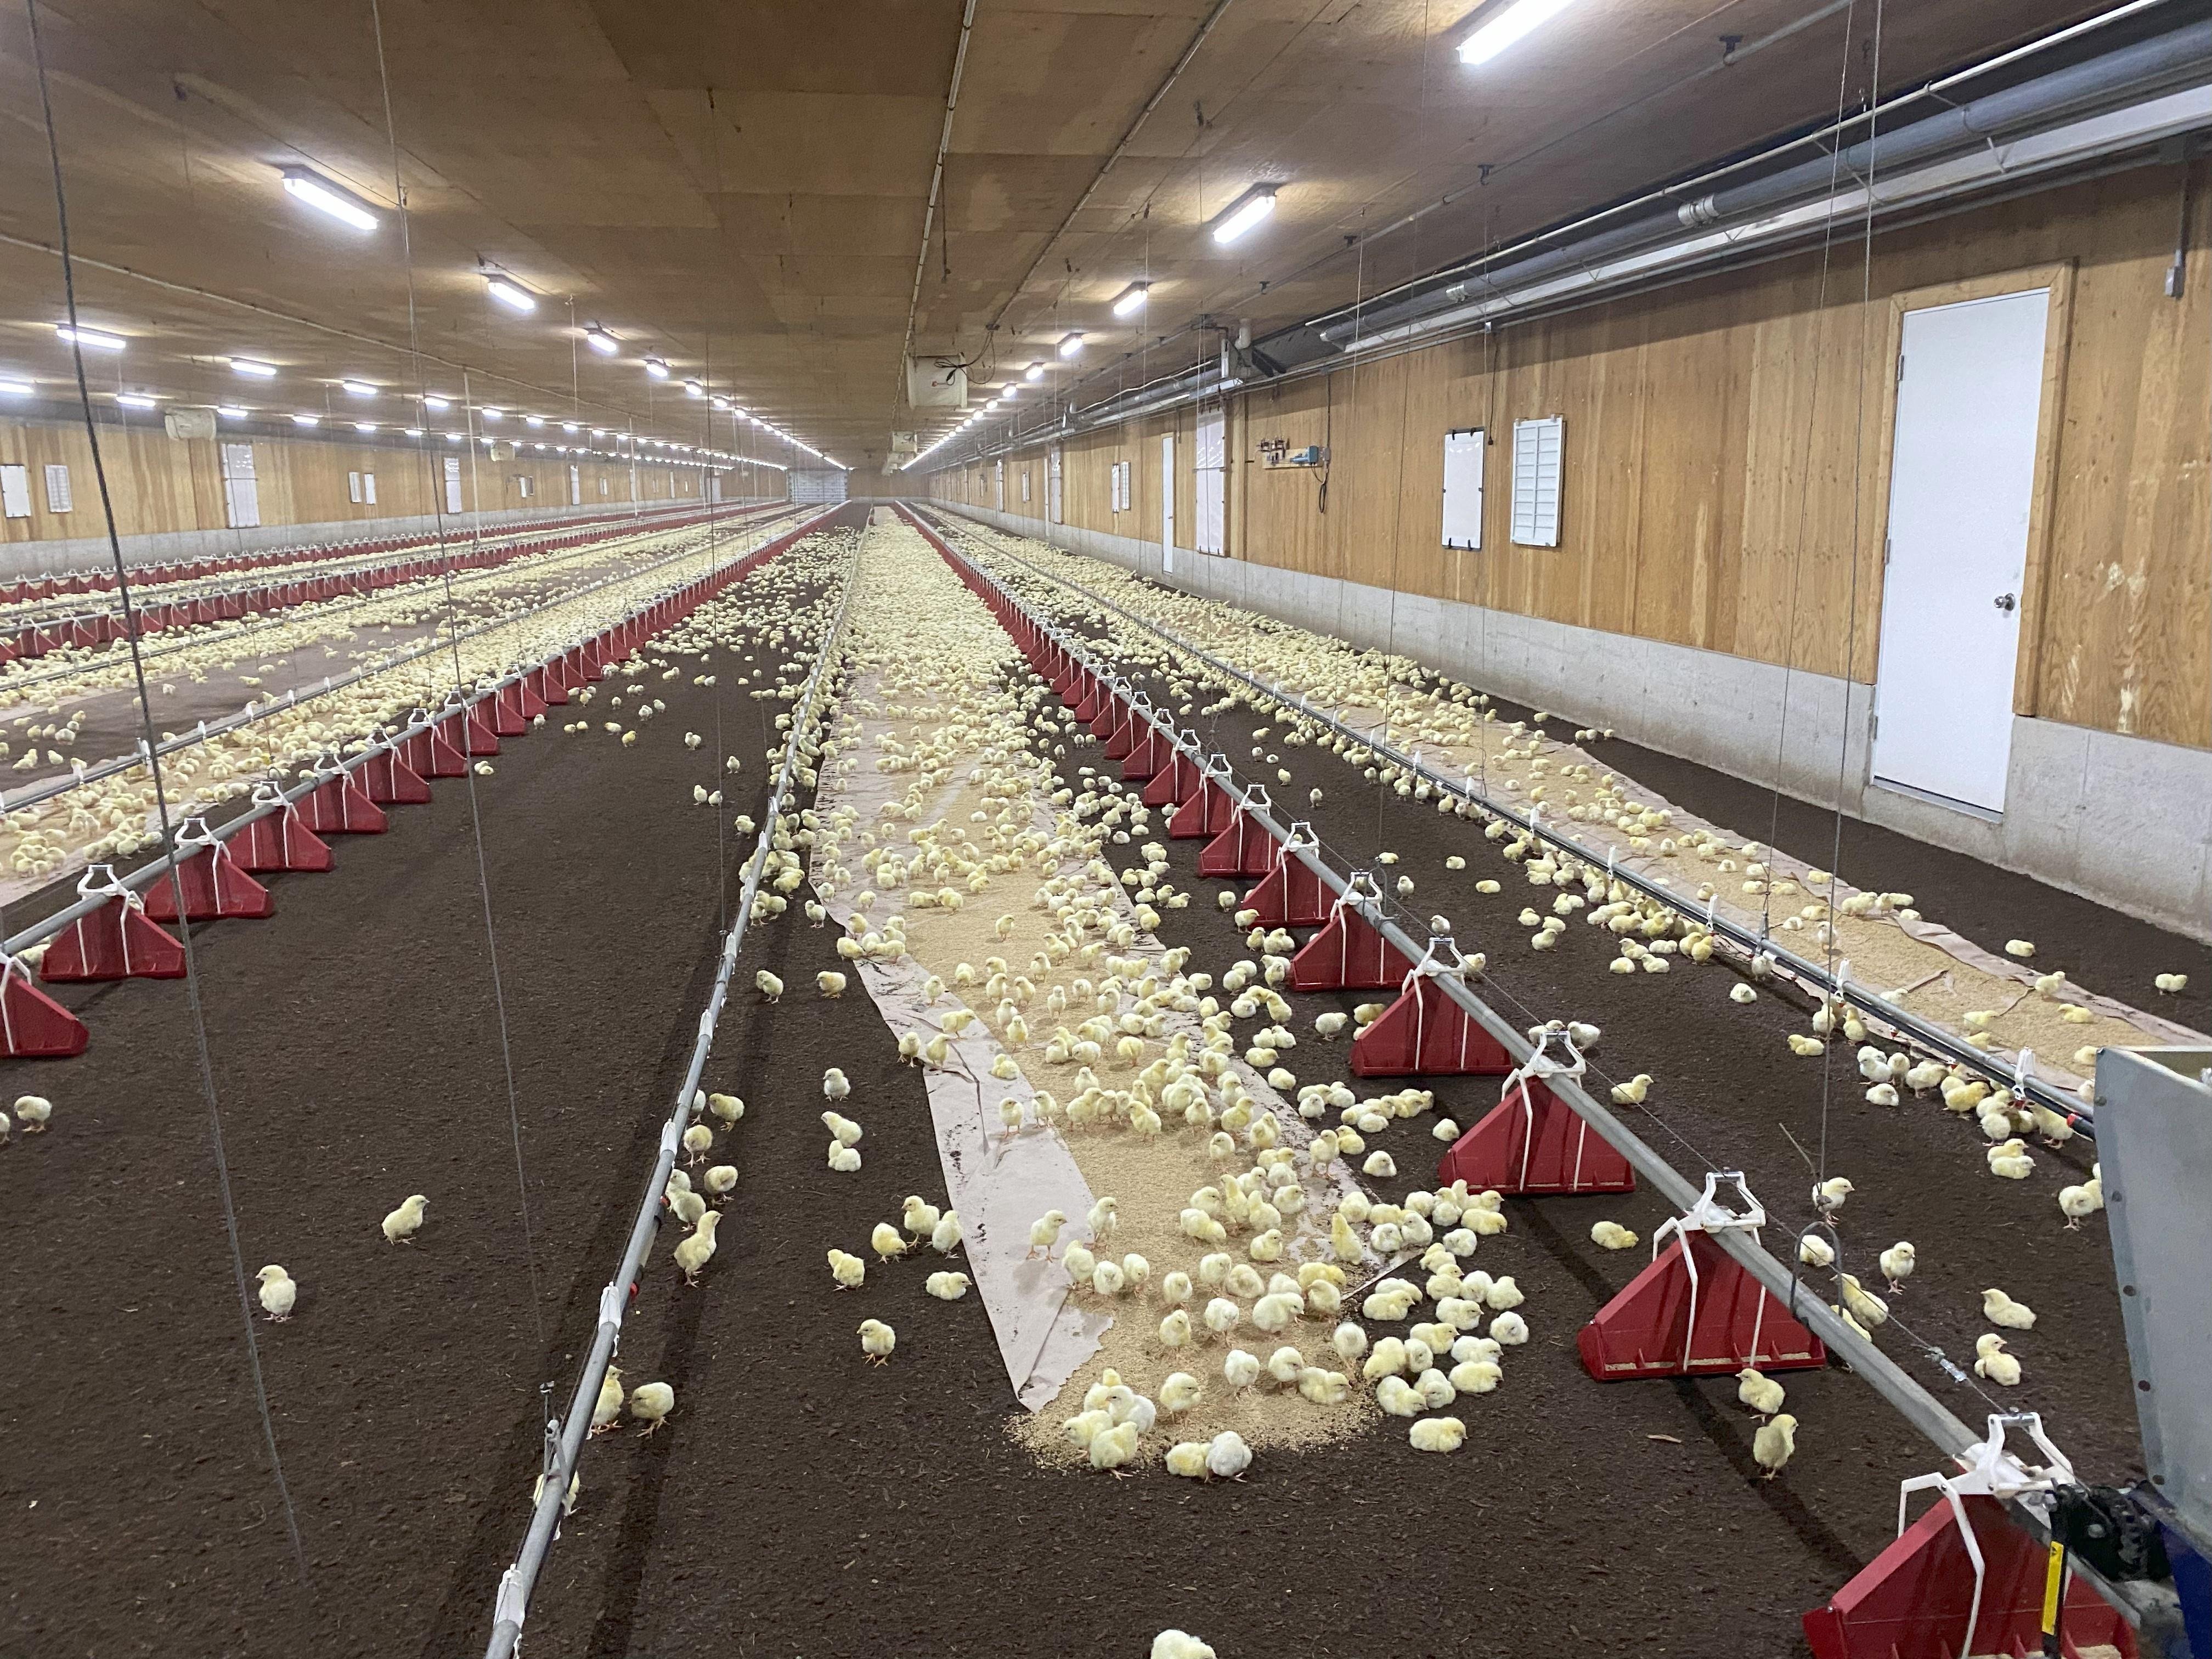
In the early 2020s, several broiler producers in Ontario began using peat moss bedding as an alternative to conventional straw or wood shavings (Figure 1). This shift was driven by the difficulty sourcing bedding materials and the idea that peat moss was a more absorbent bedding material. If the barns could be maintained in a drier state, there would be a reduced chance of ammonia production from the litter during the bird production cycle.
Shortly after the broiler sector started using peat moss bedding, several chicken-catching crews began to complain of their workers becoming ill after catching birds in these barns (shortness of breath, flu-like symptoms, eye irritation). The cause was suspected to be the peat moss bedding producing smaller dust particles than conventional bedding materials. These smaller particles were thought to bypass normal respiratory filtering mechanisms present in birds and mammals and penetrate deeper into the lungs where they were causing illness or adverse reaction. However, there was no data to confirm or disprove this theory.
Broiler production and common bedding materials
In Ontario, broiler production follows an all in/all out production pattern. When starting a new flock, a couple of inches of clean bedding material is placed on the bare concrete floor, the barn is pre-warmed up to 30–32°C, and the new chicks are delivered into the barn by hatchery staff. Birds have free access to feed and water and can move about the building. The barns have a mechanical ventilation system to introduce fresh air into the building and exhaust moisture, carbon dioxide and other air contaminants from the building. Birds are grown in the barn until they reach the target shipping weight (30–45 days) requested by the processor. At this point, chicken-catching crews arrive to catch and load the birds onto transport trucks for delivery to the processor. Once the birds have been removed from the building, the producer cleans out all the litter materials and prepares the barn for the next flock.
The bedding material (Table 1) has several important functions as it provides a layer of insulation and comfort on the floors for the chicks when they are first introduced into the barn but more importantly, it provides an absorbent material to retain moisture. Broiler production is considered a litter-based system, as the birds deposit feces throughout the building on top of the bedding material.
| Bedding type | Availability | Cost | Absorbability | Renewable resource |
|---|---|---|---|---|
| Chopped cereal straw | Yes | Reasonable | Less than peat but similar to shavings | Yes |
| Kiln-dried soft wood shavings | Harder to get in recent years | Variable | Less than peat but similar to chopped straw | Yes |
| Baled peat moss | Yes | Reasonable | Best | No |
| Pelleted straw | Yes | Higher cost option | Less than peat but similar to shavings | Yes |
If the litter is too dry, there is potential for the release of more dust into the airspace as the birds move around in the barn. If the litter becomes too wet during the grow-out period, there can be issues with the production of ammonia from the breakdown of nitrogen compounds in the airspace.
During colder times of the year, the producer operates the ventilation system to introduce fresh air into the barn and exhaust water vapour from the barn to maintain the relative humidity inside the barn below 70%. If the barn is operated at a relative humidity above 70% for an extended period or there are events like a drinker line water leak, this can result in the litter becoming wetter than desired.
In a perfect scenario, the bedding material should be absorbent enough to retain excess moisture to provide a dry surface for the birds to walk over but damp enough to minimize dust production when the birds move around. Research
Dust properties and measurement
In a broiler barn, the dust is comprised of dried fecal matter, dead skin cells, bedding material and biological contaminants. Dust is a form of particulate matter (PM). This term refers to microscopic matter suspended in air or water. Airborne particles are called aerosols. PM10 includes particles less than 10 micrometres (µm) in diameter, while PM2.5 particles are less than 2.5 µm.
In comparison, a human hair is about 100 µm wide, so 40 PM2.5 particles would be needed to produce the same width. These particles are invisible to the human eye. Another problem with these smaller particles is their ability to stay suspended in the barn air for longer periods of time.
Occupational exposure to PM2.5 is particularly concerning as these particles are so small, they can deeply penetrate the lungs. The fraction of particles that are 0.5 µm and smaller can cross over into the blood stream and result in various cardiovascular and respiratory diseases.
During the research project, size fractioned particulate matter suspended in the barn air was measured every 5 minutes during the trial for each flock using a TSI DustTrak PM analyzer. The unit was located at the mid‑point of each barn. Each PM analyzer was contained in a box suspended from the barn ceiling and had a length of sampling line hanging down to mid-barn height to collect samples of barn air.
The level of dust observed in the barns affected calibration and caused blockage of the filter unit with the PM analyzers. From previous experience collecting dust measurements inside commercial poultry barns, the site was visited twice a week to perform routine maintenance and calibration of the analyzers during flock monitoring periods to verify the units were working properly. Even with the twice weekly visits. there were several instances where the analyzers malfunctioned, and some data was not collected.
Experimental design for research trial
Farm/barn set-up
The site selected for the on-farm research trial had two single-story barns identical in terms of equipment layout (feeder lines, drinker lines, radiant tube heater location, fan location). Both barns were cross-ventilated with the same number and size of exhaust fans located on each long axis wall. The interior circulation fans for both barns used an identical pattern for air distribution. The same Genius model of ventilation controller was used to manage each barn.
To account for seasonal variation in the concentrations and emissions of particulate matter due to changing ventilation rates within the barns, a total of 4 flocks was monitored for this trial throughout the year (2022):
- flock 1 from mid-February until end of March
- flock 3 from July 1 until early August
- flock 4 from August 31 until early October
- flock 5 from November 4 until early December
Flock 2, which occurred during the April-June period, was not monitored due to the presence of high pathogenic avian influenza in Ontario, and the researchers did not want to be visiting the poultry farm during this high-risk period.
The chicks in all flocks were placed on the same day in both barns at the same stocking density, fed the same feed ration and shipped for processing on or about day 34 of the production cycle.
For each subsequent flock, the bedding type was alternated for each barn (for example, if barn 1 flock 1 used peat moss bedding, then the next flock in barn 1 would have straw bedding).
Besides PM10 and PM2.5 dust measurements, the other environmental parameters sampled during this trial included the barn temperature and relative humidity at the same 5-minute frequency.
Litter sample collection
Litter samples were collected from each barn bi‑weekly during the trial to check moisture content, pH and nutrient levels. Factors that influence the formation of gaseous ammonia from poultry manure and litter include high concentrations of ammonium (NH4+), elevated temperatures and humidity in the air, and elevated moisture content and pH in the manure/litter
Moisture
Water is a reactant required for ammonia (NH3) formation during microbial breakdown of nitrogen compounds contained in the poultry manure. Higher moisture content in the litter results in greater NH3 formation. If manure can achieve 60% dry matter content within the first 50 hours, ammonia emissions can be minimized
Flock production
Flock production parameters were also recorded for each barn during the trial. These included the average shipping weight, daily mortalities and condemnations.
Four sets of post-mortem examinations were performed for each monitored flock at the Animal Health Laboratory, University of Guelph. A total of 5 birds were collected from each barn at:
- chick placement
- 7–10 days
- 20–22 days
- shipping age
Multiple time periods were selected to assess general bird health and disease or production issues with specific emphasis on the lung health of the birds from exposure to the barn environment.
Research results
Litter
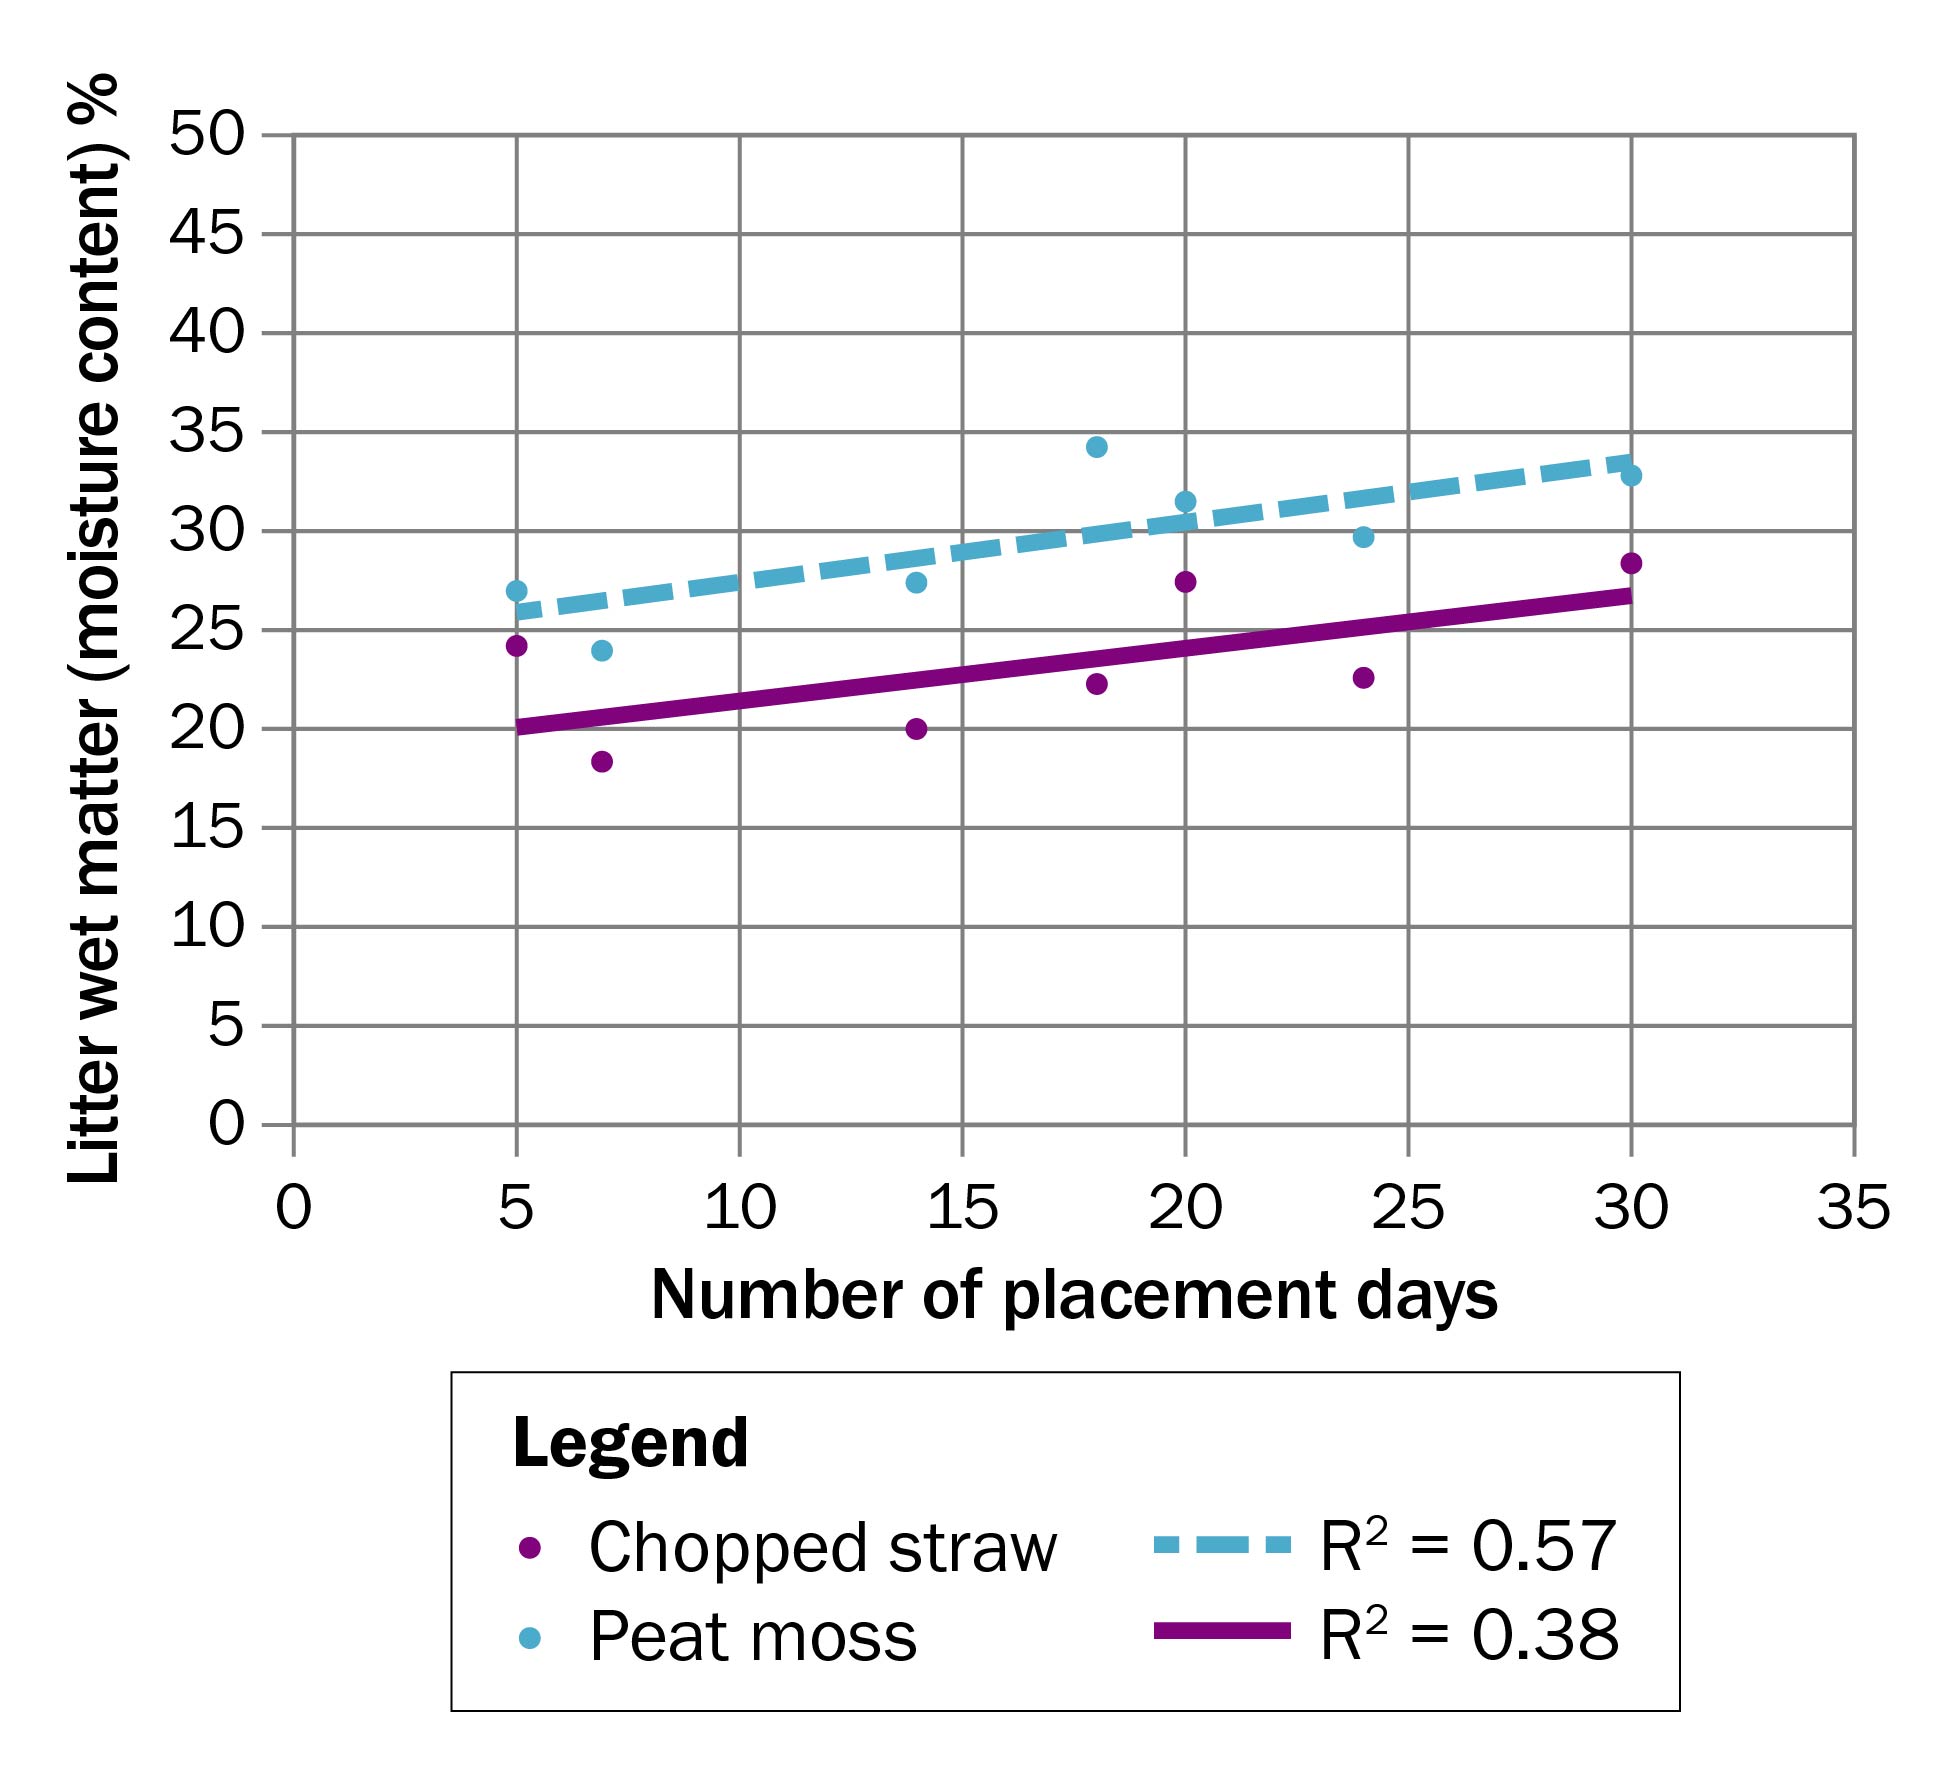
For all flocks, the litter in the peat moss bedded barn tended to be drier than litter from the chopped straw barn. The one exception to this observation was during flock 1 when the farmer used Straw Boss pellets instead of chopped straw. The litter moisture content increased during the production cycle in both barns as the birds grew (Figure 2).
Accessible description of Figure 2
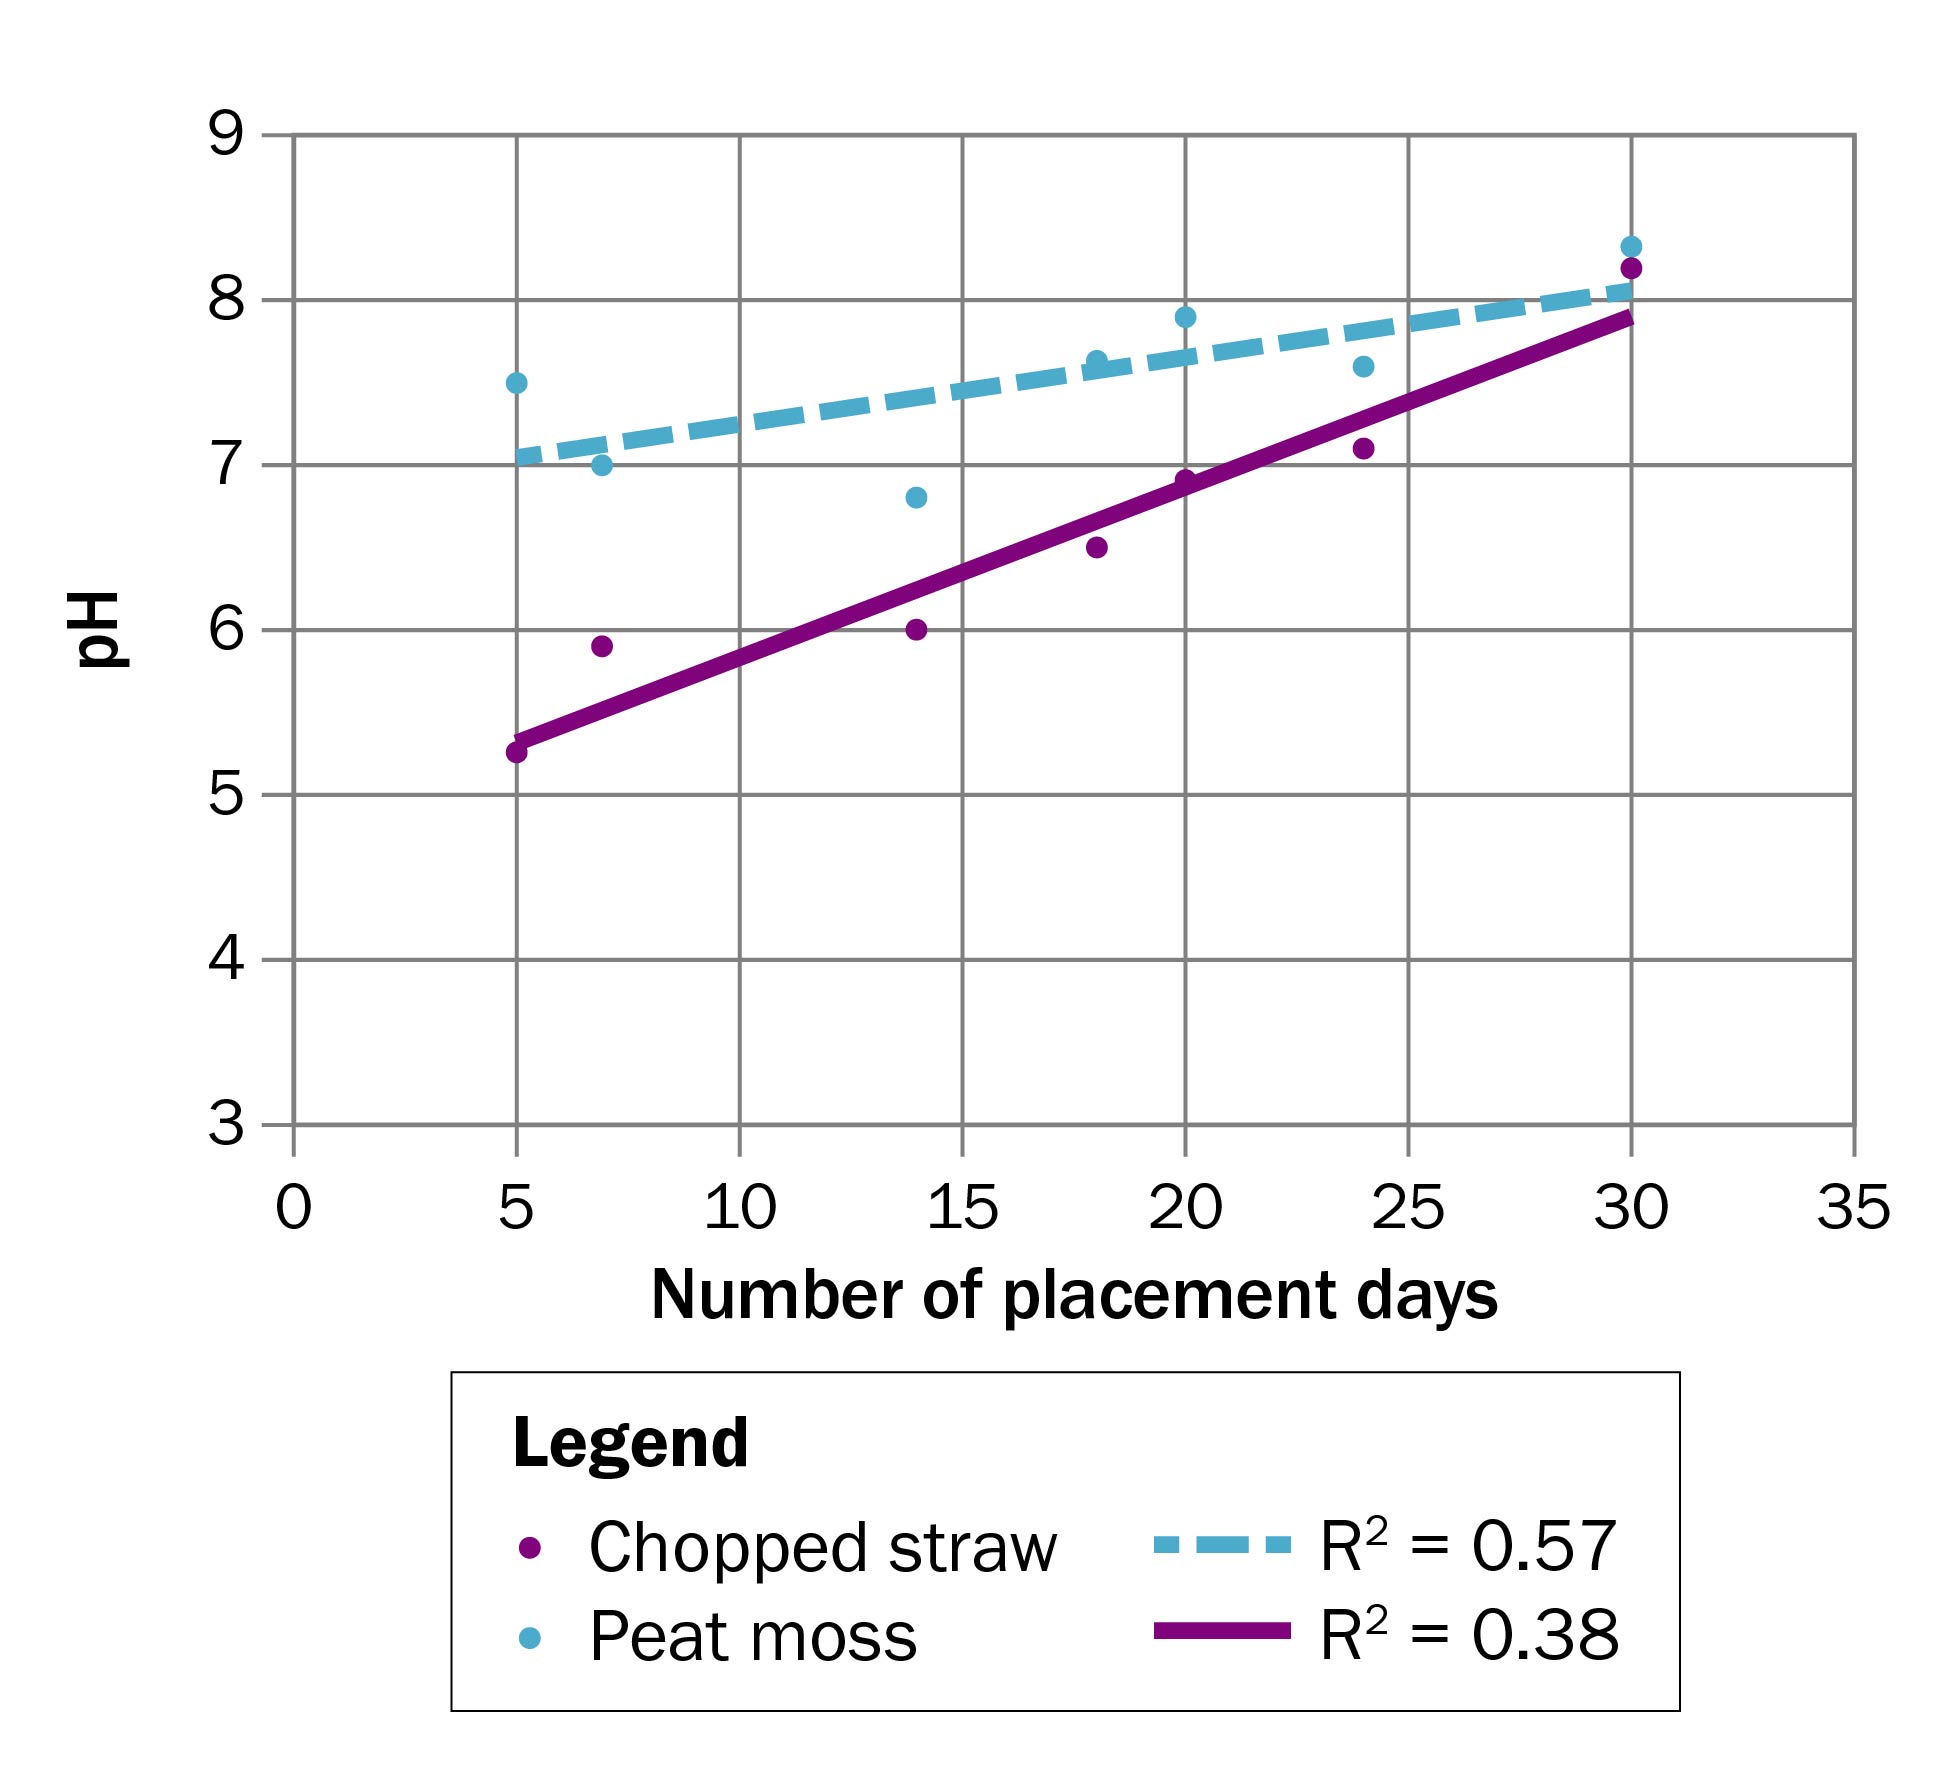
For all flocks, the peat moss bedding started with a lower pH than the straw bedding because peat moss is harvested from an acidic environment. However, during the production cycle in both barns, as the birds deposited more feces on the bedding material, the pH of the litter began to rise above neutral into the alkaline range (> pH 7) (Figure 3).
Accessible description of Figure 3
The increase for the pH across the flock was more rapid for the peat moss when compared to the chopped straw. This indicates that chopped straw was a better buffer for maintaining pH than peat moss.
Particulate matter
Each of the flock graphs showed a pattern of daily peak and valley PM measurements. Peaks normally occurred during times when the birds were actively moving around, eating and drinking (lights on) versus valley times that often occurred in the middle of the night (lights off) when birds were resting on the litter.
PM readings were always higher in the peat barn, regardless of which fraction was being measured across all four monitored flocks.
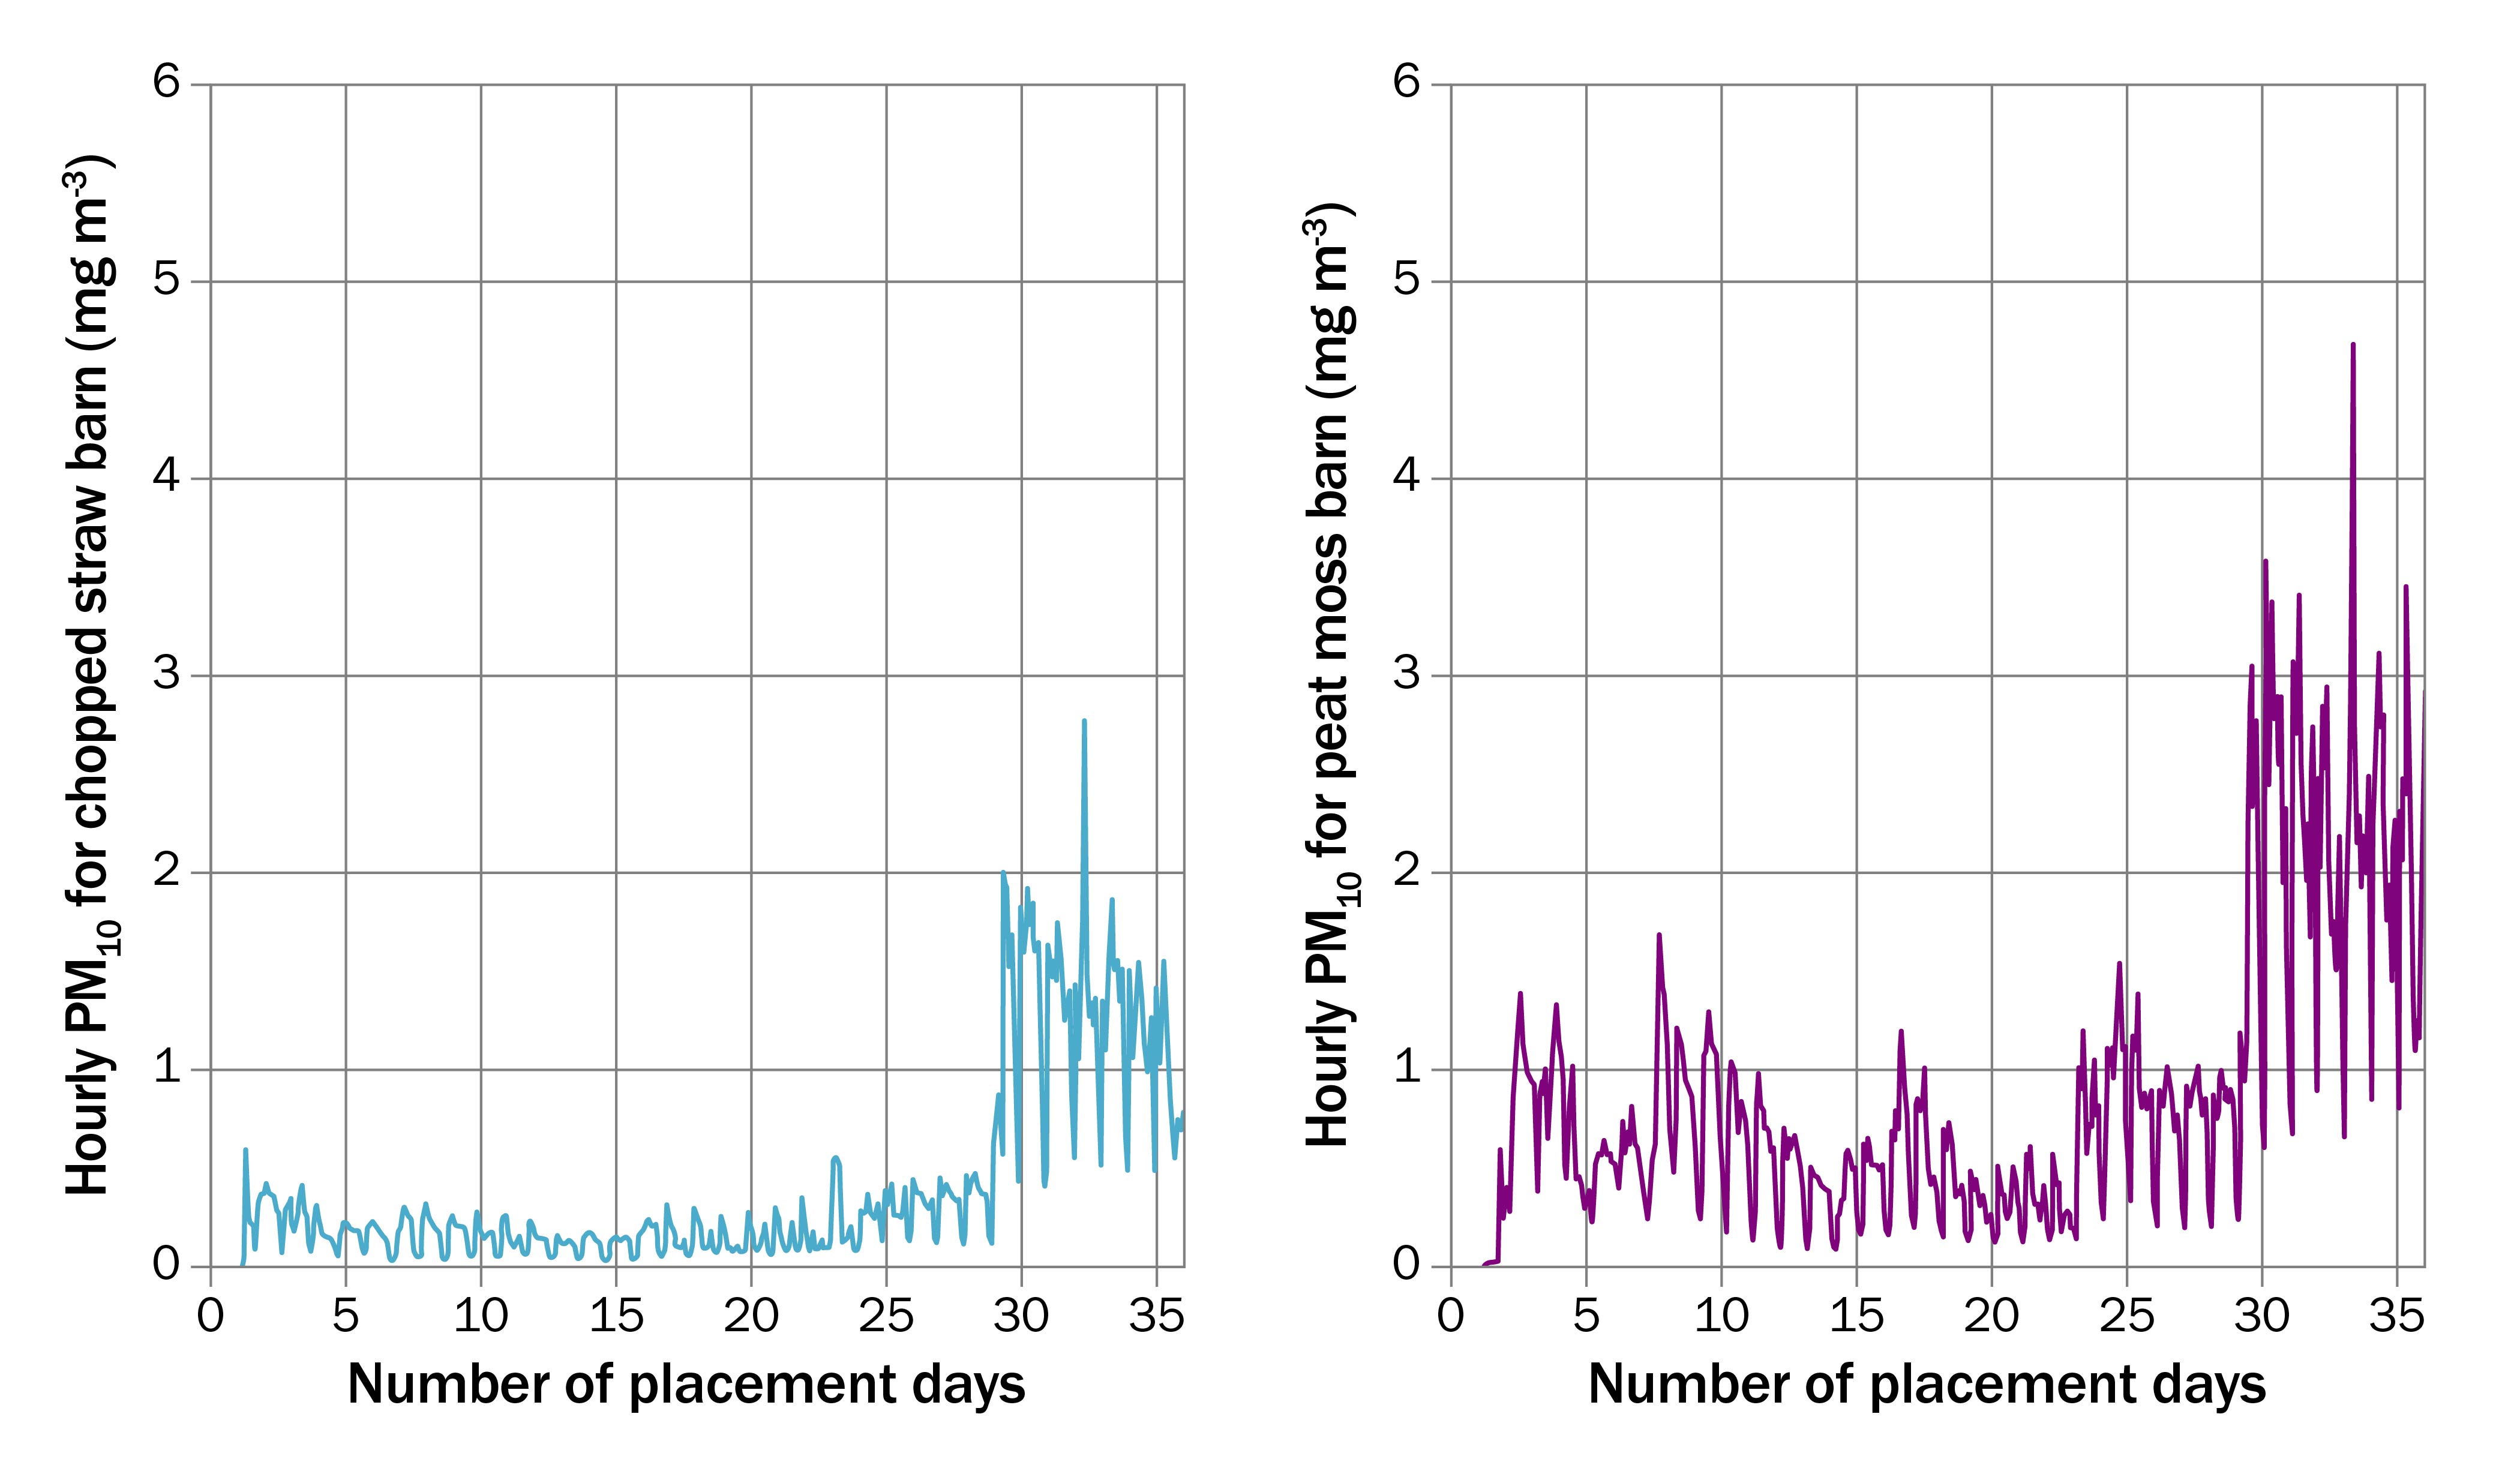
Flock 4 had the most complete data set for PM, both PM10 and PM2.5. Figures 4 and 5 are representative graphs for each type of bedding.
Accessible description of Figure 4
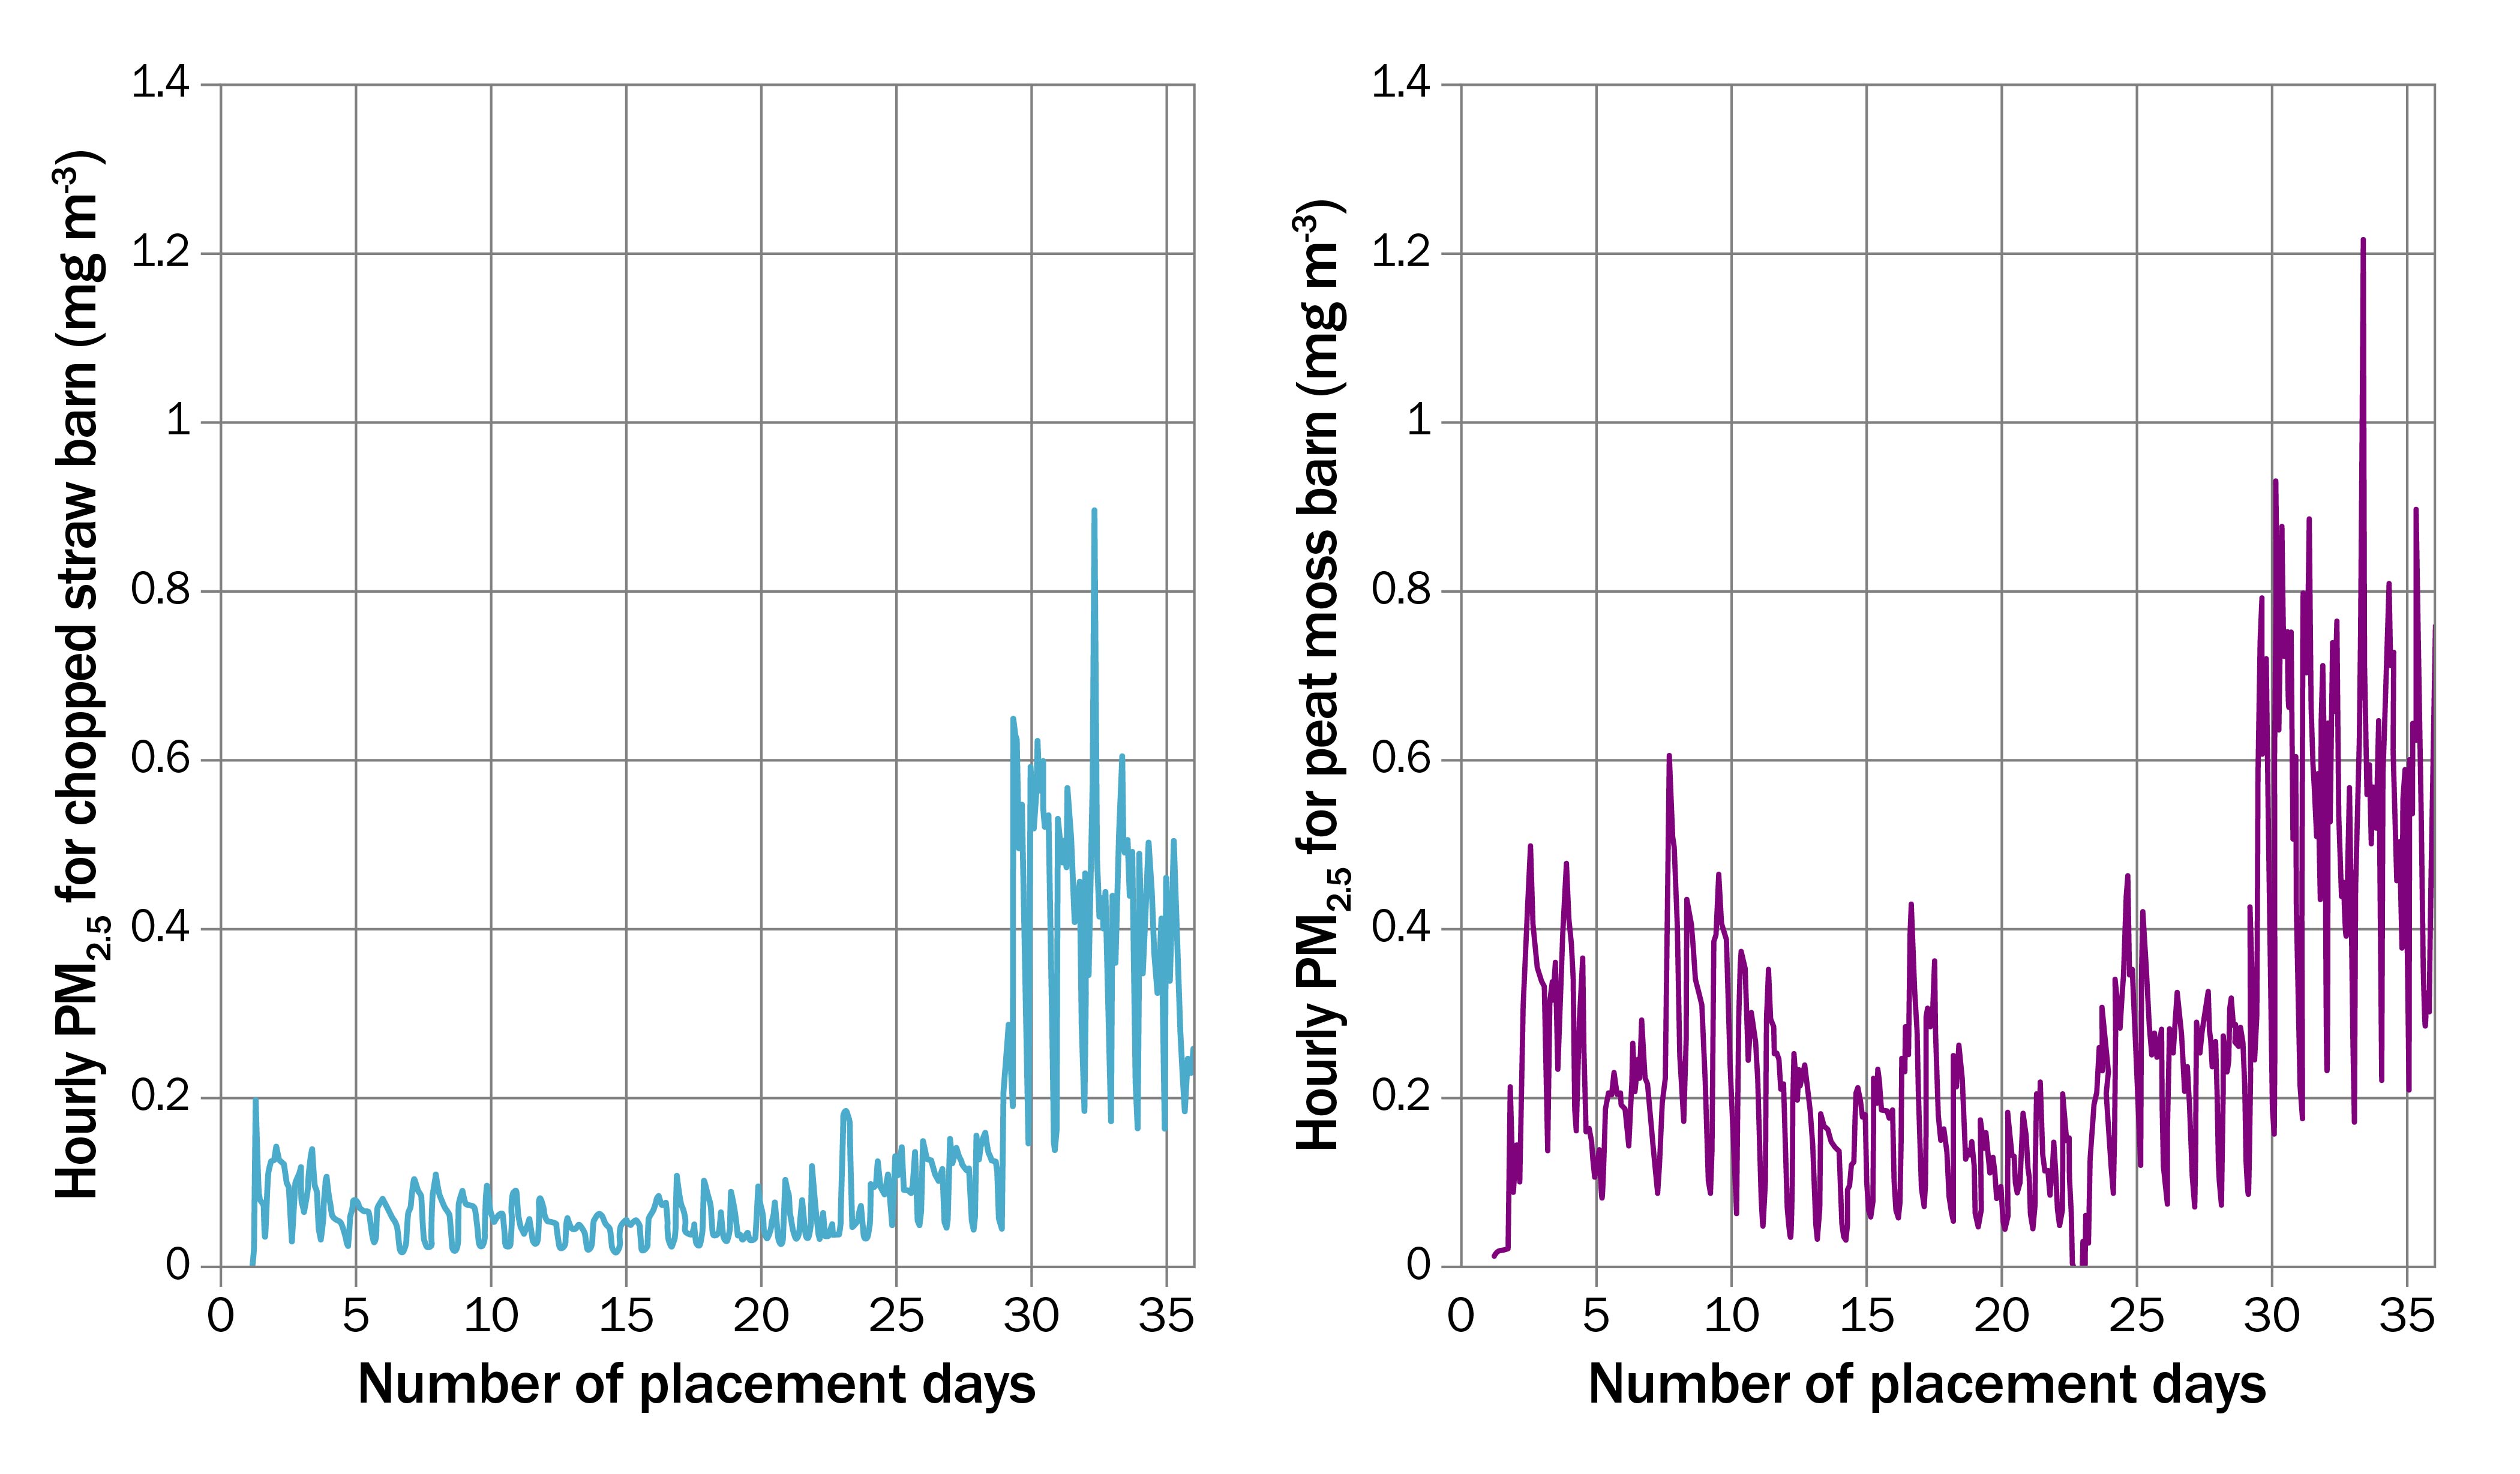
Accessible description of Figure 5
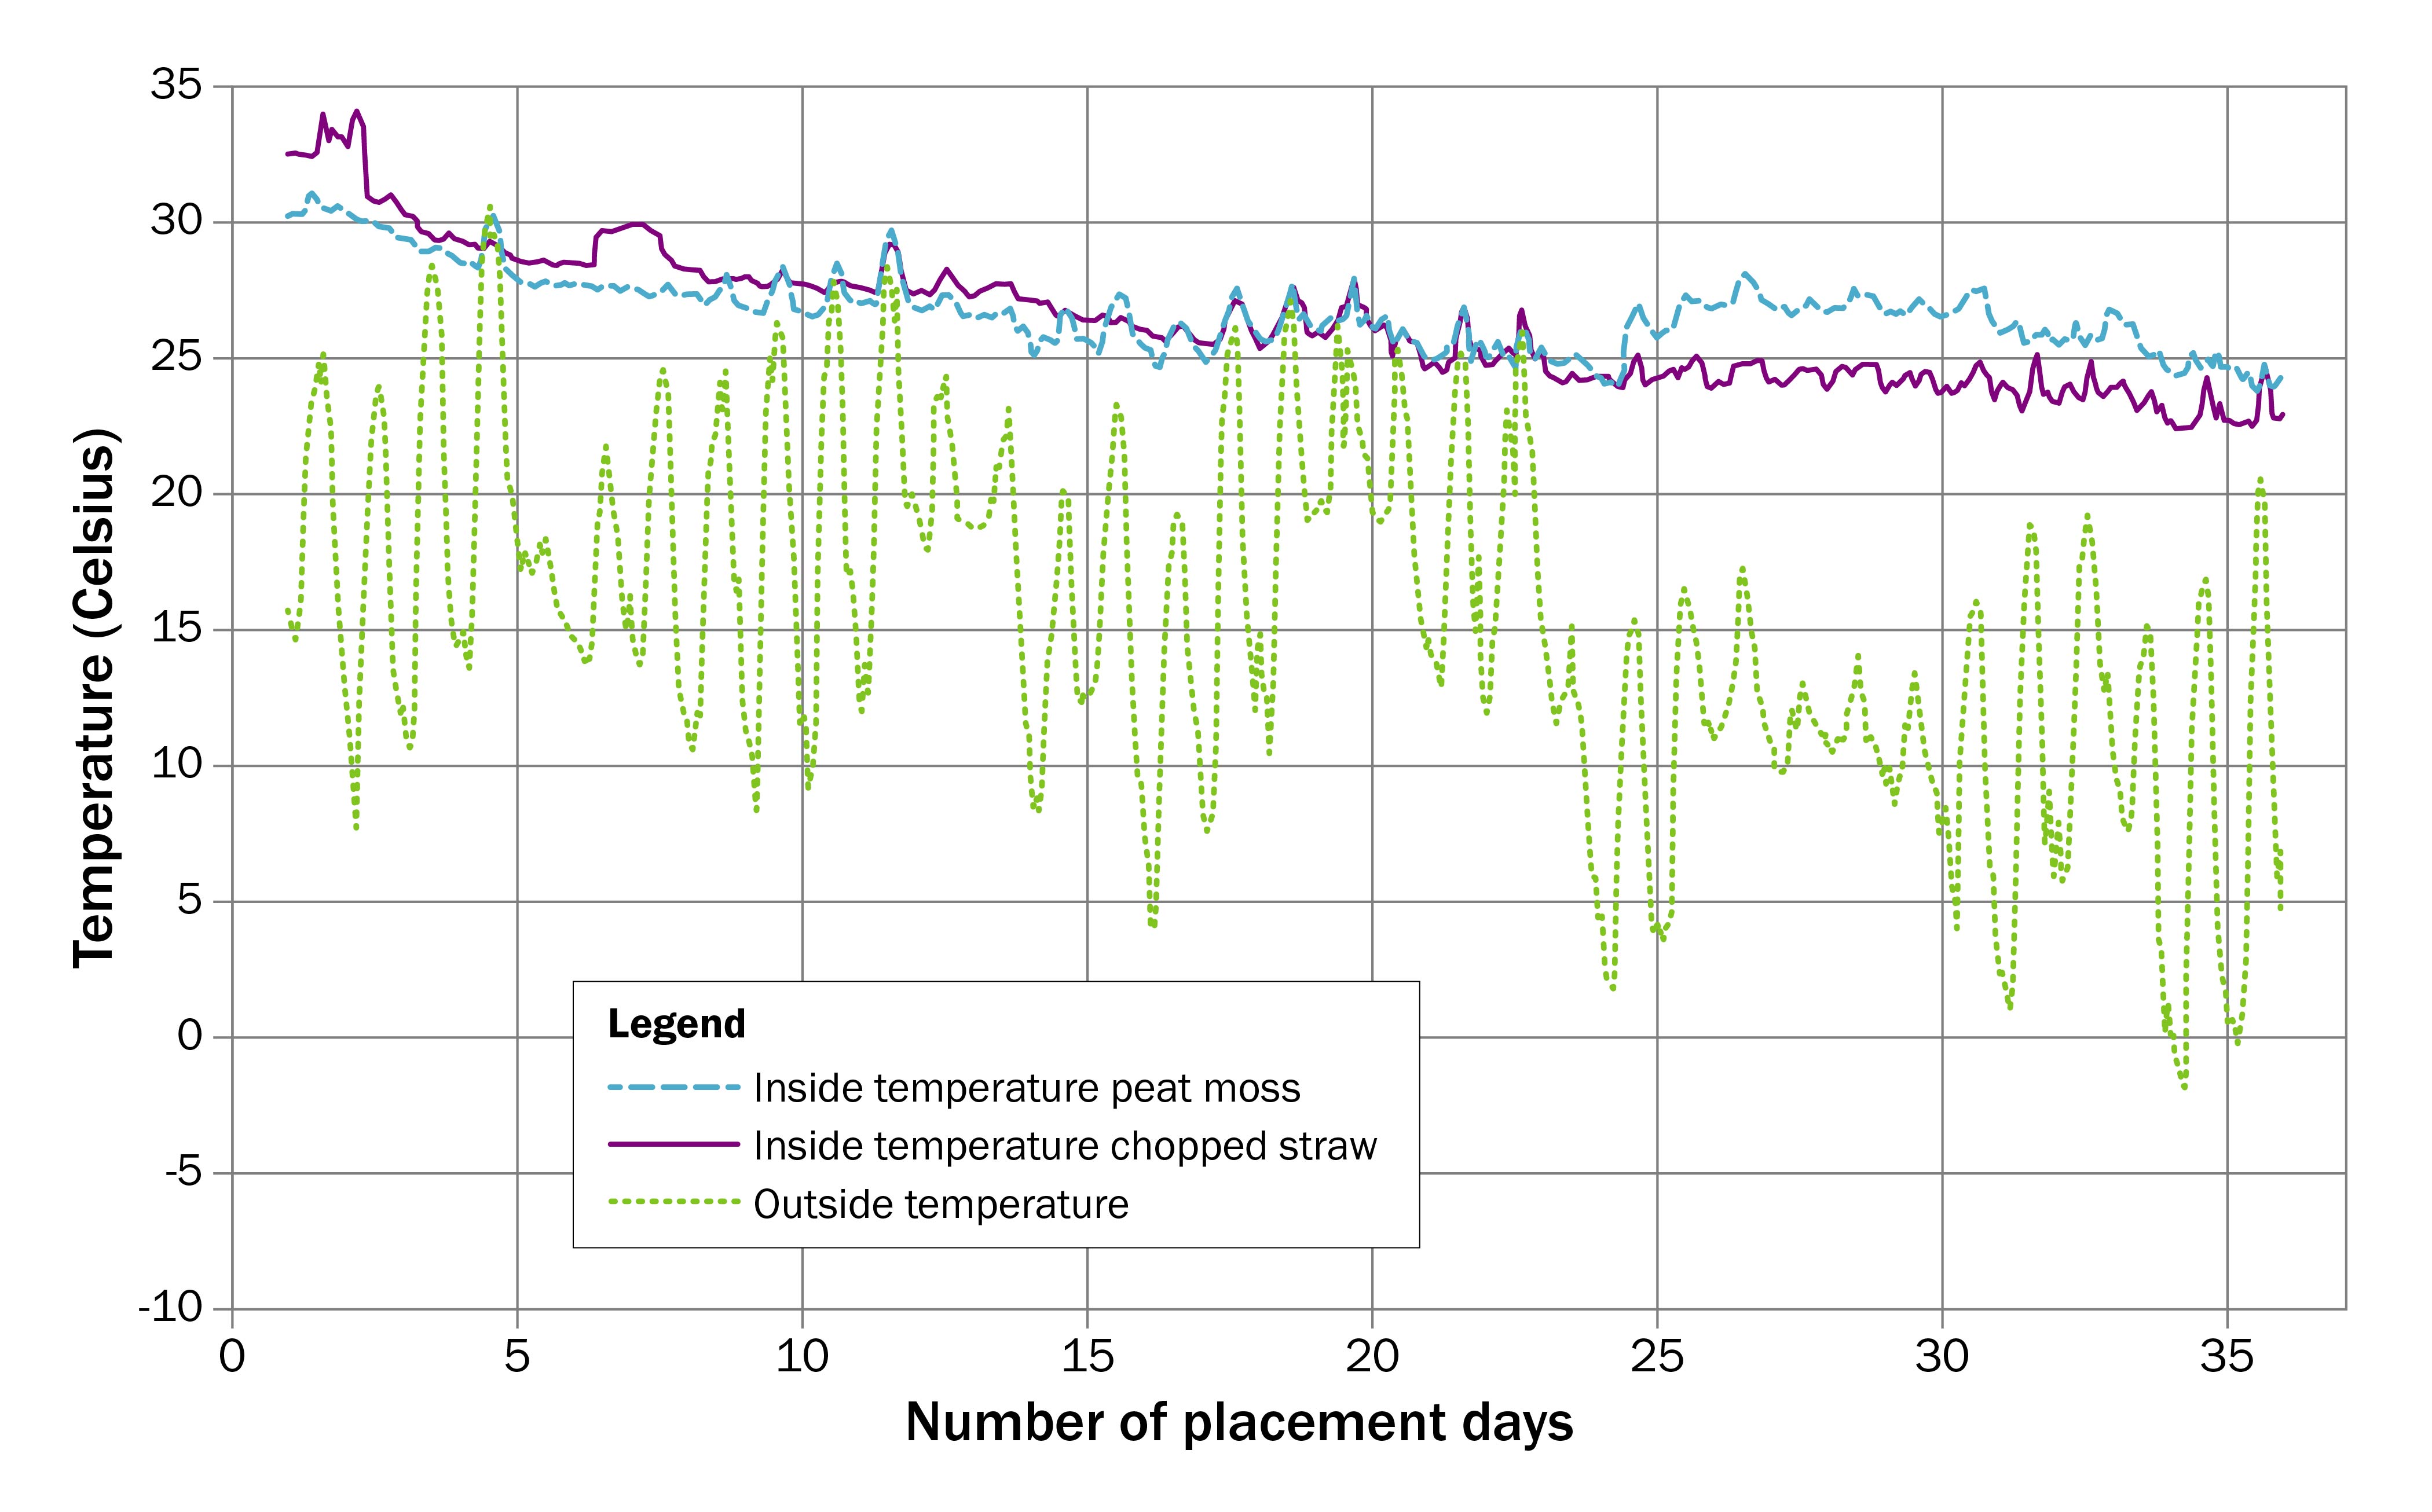
These graphs show an interesting pattern of the dust levels increasing significantly over the last 10 days for the production cycle in both barns. This corresponds with outside temperatures dropping 10–20°C below the barn setpoint temperature at certain times of the day (Figure 6). This would cause the ventilation controller to shut off several exhaust fans in each barn to maintain barn setpoint temperature, thus reducing air exchange from each barn and causing the PM levels to rise. During the first 20–25 days of the production cycle, the ambient temperatures were quite warm, sometimes matching or exceeding the barn setpoint temperature. As a result, the ventilation controller would have turned on more fans to try to prevent barn temperature from rising further. This extra fan capacity would exhaust more particulate matter from bird space, resulting in lower particulate matter readings.
Accessible description of Figure 6
The peak values of PM recorded for each flock and each barn, showing the comparison of PM10 and PM2.5, are shown in Table 2. Some datasets were not complete due to equipment problems so there may have been higher peak values that were not recorded.
| Flock | Peak PM10 straw (mg/m3) | Peak PM10 peat moss (mg/m3) | Peak PM2.5 straw (mg/m3) | Peak PM2.5 peat moss (mg/m3) |
|---|---|---|---|---|
| Flock 1 Feb 18–Mar 25 | 1.8 | 8.3 | 0.7 | 3.0 |
| Flock 3 Jul 1–Aug 6 | 0.5 | 3.7 | 0.3 | 1.0 |
| Flock 4 Aug 31–Oct 4 | 2.8 | 4.7 | 0.9 | 1.1 |
| Flock 5 Nov 4–Dec 8 | 2.1 | 5.5 | 0.7 | 1.3 |
The highest recorded values of PM during the entire on-farm research project for both PM10 and PM2.5 occurred in the peat moss bedded barn with flock 1 during the first couple of days after chick placement. This was likely due to a combination of very low ventilation rates (minimal fresh air mixing) for these young birds during the coldest time of the year and the peat bedding being very dry since frozen bales had been brought into the heated barn several days prior to chick placement to thaw prior to spreading.
Lowest recorded PM10 and PM2.5 peak levels were observed in both barns during the summer flock (flock 3). This was related to the much higher air exchange rates through the barns with all the exhaust fans operating to control barn temperature for the birds during this period of higher ambient temperatures.
Flock performance results
For recording purposes during the trial, the percentage mortality of the flock included all birds that died in the barn during trial plus any birds left behind after loading that were euthanized by the farmer. Reviewing the performance data for each flock (Table 3) revealed the following:
- in every flock, the average bird weight at shipping was higher in the peat moss bedded barn
- bird mortality was higher in the peat moss barn in 3 out of 4 monitored flocks
| Flock | Average shipping weight: barn 1 | Average shipping weight: barn 2 | % Mortality (includes birds left behind at shipping): barn 1 | % Mortality (includes birds left behind at shipping): barn 2 | % Condemnations at processing barn 1 | % Condemnations at processing barn 2 |
|---|---|---|---|---|---|---|
| Flock 1 Feb 18–Mar 25 | 2.41 kg (peat) | 2.37 kg (straw) | 7.8 (peat) | 4.1 (straw) | 1.50 (peat) | 1.50 (straw) |
| Flock 3 Jul 1–Aug 6 | 2.45 kg (straw) | 2.50 kg (peat) | 3.6 (straw) | 6.6 (peat) | 2.23 (straw) | 3.52 (peat) |
| Flock 4 Aug 31–Oct 4 | 2.32 kg (peat) | 2.30 kg (straw) | 5.6 (peat) | 6.3 (straw) | 1.84 (peat) | 3.98 (straw) |
| Flock 5 Nov 4–Dec 8 | 2.18 kg (straw) | 2.22 kg (peat) | 4.1 (straw) | 5.4 (peat) | 1.01 (straw) | 0.90 (peat) |
Health implications
For people, short- and long-term exposure to particulate matter can cause adverse health effects including asthma, chronic bronchitis, irritation to the airway, decreased respiratory function, higher incidence of lung cancer and premature death in individuals with a history of lung or heart disease
In Ontario, the Occupational Health and Safety Act, 1990, provides an exposure level for workers exposed to poultry dust in O. Reg. 833, Control of Exposure to Biological and Chemical Agents. The regulation defines the time-weighted average (TWA) limit as the time-weighted average airborne concentration of a biological or chemical agent to which a worker may be exposed in a work day or work week. The TWA level for poultry dust (total dust) is 5 mg/m3.
O. Reg. 833, Control of Exposure to Biological or Chemical Agents, has an occupational exposure limit set for particulates:
- TWA standard for the inhalable fraction of particulates at 10 mg/m3
- TWA standard for the respirable fraction of particulates at 3 mg/m3 (O. Reg. 833)
The inhalable fraction refers to PM10 and the respirable fraction refers to PM2.5.
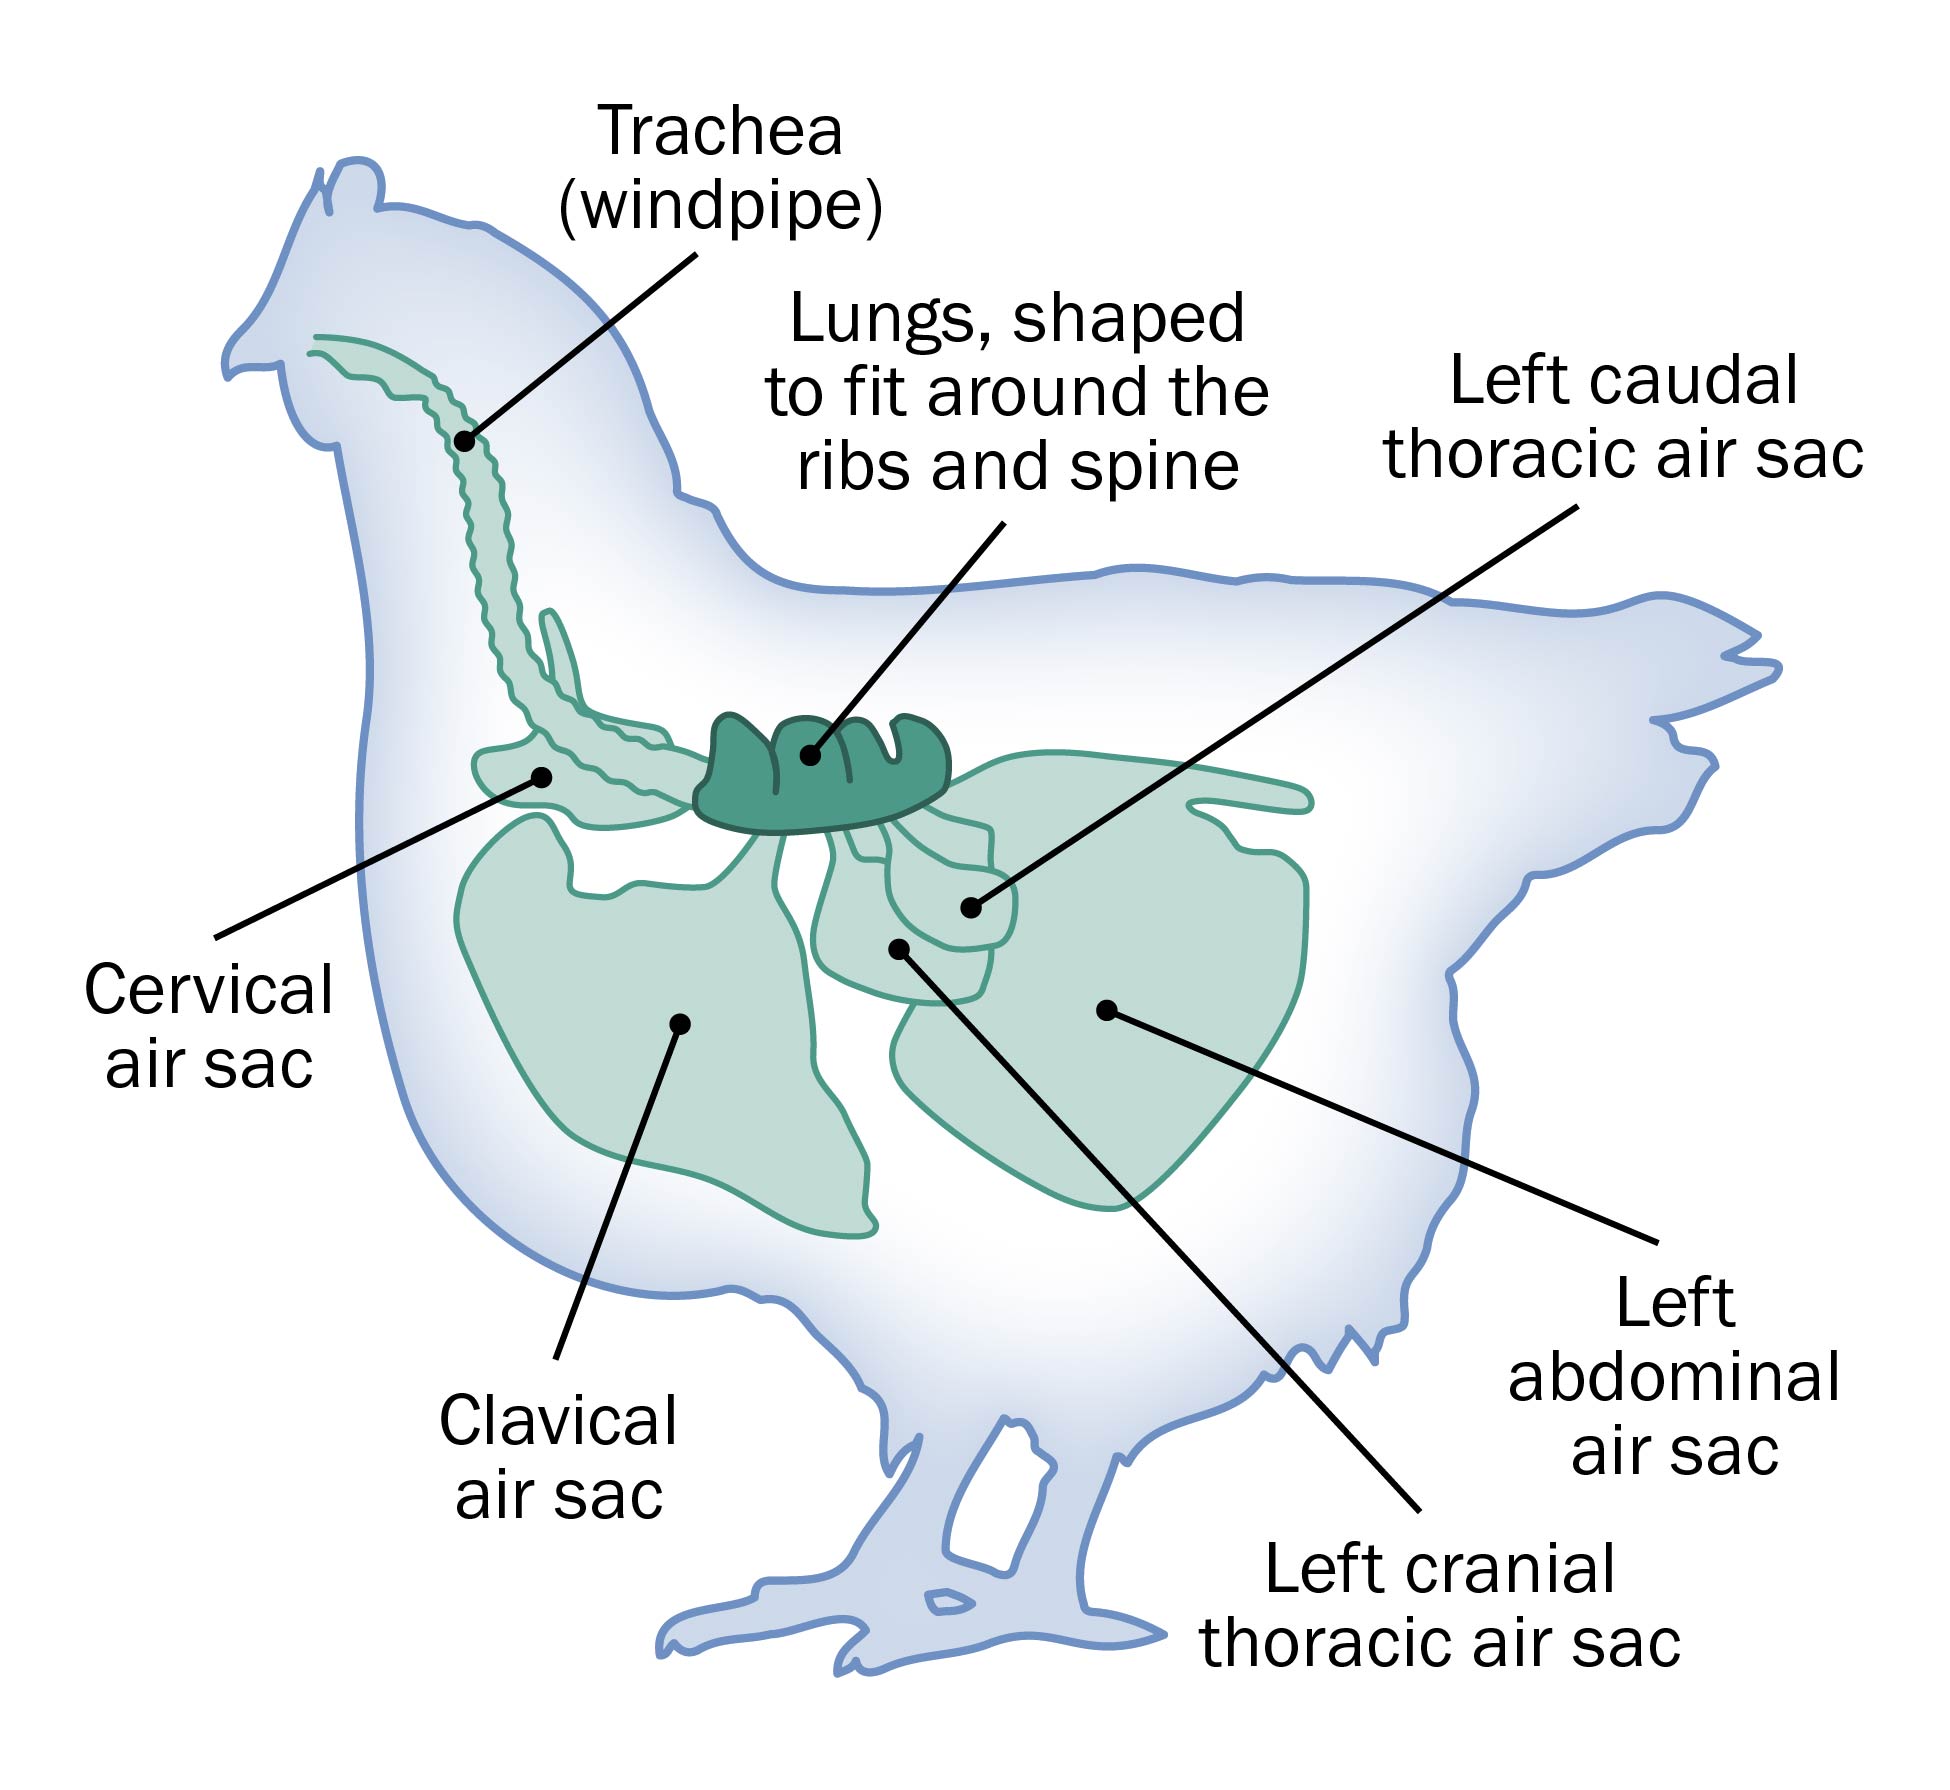
Birds are considered to have the most efficient respiratory gas exchange system of all vertebrates (Figure 7). Adaptation for flight has resulted in a more efficient air exchange system. Parabronchi (the smallest gas exchange airways in birds) are 3–10 µm in diameter compared to the smallest alveoli in mammals (35 µm, shrew). The blood-gas barrier is approximately a third of the thickness of mammals
Accessible description of Figure 7
All areas of the respiratory system (nasal sinuses, trachea, primary and secondary bronchi of the lungs) have ciliated epithelium and mucus‑producing glands. This allows capture of foreign material in the mucus layer and removal by the movement of the cilia. However, these physical barriers have their limitations. When these barriers are either bypassed or damaged, particulate matter can penetrate the respiratory system.
Inhalable particles on inspiration will reach the nasal sinuses, trachea and large bronchi. In humans, inhalable particles are <10 µm
Respirable particles can reach deep into the gas exchange areas of the lungs of both humans (alveoli, <4–5 µm) and poultry (parabronchi and air capillaries, <2.5 µm) indicating that respirable dust has a smaller diameter in birds vs. mammals
Ammonia gas can affect cilia function, slowing clearance of foreign particles, increasing the risk of inflammation and increasing the opportunity for infection. However, larger particles can penetrate deeper into the respiratory system if there is mouth breathing
Poultry barns are known to have higher concentrations of particulate matter in the air compared to pig or cattle barns. Between poultry housing systems, measured PM concentrations are higher in litter (broilers) versus cages (hens)
In the Ontario study, we compared the dust exposures of birds raised on shavings versus peat moss bedding. Plant particles infiltrated the lungs and air sacs of all birds regardless of the bedding material selected for the barn. During microscopic examination of tissue samples for all 3 time periods examined per flock (days 7–10, 20–22 and at shipping), it was more common to identify:
- increased levels of plant particles in the upper and lower respiratory system of birds from peat moss bedded barns
- embedded plant particles in the lower respiratory system of birds from peat moss bedded barns
These embedded particles are often associated with inflammation of the secondary bronchi or noted within macrophages within parabronchi. It is documented that there are health effects related to exposure to fine particulate matter (≤ 2.5 µm) that, in broilers, can induce lung inflammation and disrupt the lung microbiota
When looking at the concentration of PM in the air space of the barn, it was identified that the PM decreases in direct proportion to the height above the floor
Conclusion
Peat moss bedding resulted in slightly drier litter conditions in the broiler barn compared to straw bedding. Significantly higher dust levels were measured in the barn using peat moss bedding for all four monitored flocks.
Commercial broiler chickens used for this trial were a relatively short-lived bird as they were shipped for processing after 34 days in the grow-out barn. The health effects on a longer-lived bird, (turkeys, layers or breeders) raised on peat moss bedding is unknown. The time exposure to this environment and the bird behaviours (dust bathing) could contribute to more of a dust challenge. This would also become a human health concern for the producers and support industries (such as catchers, vaccination crews, artificial insemination crews) working in these barns for extended periods of time.
Levels of aerosols in the PM10 size range and the more dangerous PM2.5 size bordered on the TWA limits specified in O. Reg. 833. Therefore, anyone working inside this barn environment should be using a properly fitted N95 mask or respirator to protect themselves from inhaling this particulate matter.
Author credits
This fact sheet was written by Al Dam, poultry specialist, Ministry of Agriculture, Food and Rural Affairs (OMAFA), Daniel Ward, P. Eng., poultry and other livestock housing and equipment engineer, OMAFA, and Dr. Emily Martin, DVM, MSc, Diplomate ACPV, Animal Health Lab, University of Guelph. Thank you to Dr. Bill Van Heyst and his master student, Seif Ali, from the University of Guelph for conducting this research project.
Accessible image descriptions
Figure 2. Moisture content of litter for flock 5.
Figure 2 shows a line graph where horizontal axis is time expressed in days and the vertical axis is the moisture content of litter in percentage. There are two parallel lines shown on the graph increasing from lower left part of graph to higher right part of graph. This illustrates that both litter types got wetter as the birds grew. The lower red line represents peat moss bedding since it was always drier while the higher blue line represents the straw bedding.
Figure 3. pH of bedding materials for flock 5.
Figure 3 shows a line graph where horizontal axis is time expressed in days and the vertical axis is the pH of the litter on a scale from 1-14. There are two lines shown on the graph increasing from lower left part of graph to higher right part of graph. The lower red line represents peat moss bedding while the blue line represents the straw bedding. The slope of the red line is much steeper than the blue line indicating the pH of the peat moss bedded litter increased at a faster rate than the comparable straw litter.
Figure 4. PM10 data for flock 4.
Figure 4 shows two graphs side by side both graphs have a Timeline in days across the horizontal axis and Hourly Concentration of PM10 measured in milligram per cubic metre of volume on the vertical axis. Left side graph shows measurements for straw bedded barn with a continuous blue line while the right had graph shows measurements in red for peat moss bedded barn. Both graphs shows a series of peaks and valleys as dust level varies on daily basis based on bird activity. Peak occur during daylight hours when the birds are actively moving and valleys occur at night when the birds are not moving.
Figure 5. PM2.5 data for flock 4.
Figure 5 shows 2 graphs side by side both graphs have a Timeline in days across the horizontal axis and Hourly Concentration of PM2.5 measured in milligram per cubic metre of volume on the vertical axis. Left side graph shows measurements for straw bedded barn with a continuous blue line while the right had graph shows measurements in red for peat moss bedded barn. Both graphs shows a series of peaks and valleys as dust level varies on daily basis based on bird activity. Peak occur during daylight hours when the birds are actively moving and valleys occur at night when the birds are not moving.
Figure 6. Barn temperature compared to ambient temperature for flock 4.
Figure 6 shows a line graph where time is shown on the horizontal axis in days while temperature is shown on the vertical axis in degrees Celsius. There are three lines shown on the graph, the red line is temperature inside peat moss bedding barn, blue line is the temperature inside the straw bedding barn and the green line is ambient outside temperature.
The red and blue lines shows a downward progression from left to right as the barn setpoint temperature is reduced as the birds grow. The green line shows more peaks and valleys to represent day (peak and night valley) temperatures.
Figure 7. Bird respiratory system (adapted from The Poultry Site).
Figure 7 is a cross section drawing of a chicken showing the various parts of the poultry respiratory system, their location, and the relative size of each part. This includes the trachea (windpipe), cervical air sac, clavicular air sac, caudal thoracic air sac, cranial thoracic air sac, abdominal air sacs.
Footnotes
- footnote[1] Back to paragraph Carey, J.B., Lacey, R.E., & Mukhtar, S. (2004). A Review of Literature Concerning Odors, Ammonia, and Dust from Broiler Production Facilities: 2. Flock and House Management Factors. The Journal of Applied Poultry Research, 13(3), 509–513.
- footnote[2] Back to paragraph Meisinger, J.J., & Jokela, W.E. (2000). Ammonia Volatilization from Dairy and Poultry Manure. Retrieved from Natural Resource, Agriculture, and Engineering Service.
- footnote[3] Back to paragraph Groot Koerkamp, P., Metz, J., Uenk, G., Phillips, V., Holden, M., Sneath, R., Short, J.L., White, R.P.P., Hartung, J., Seedorf, J. (1998). Concentrations and emissions of ammonia in livestock buildings in Northern Europe. Journal of Agricultural Engineering Research, 70(1), 79–95.
- footnote[4] Back to paragraph Maliselo, P.S., & Nkonde, G.K. (2015). Ammonia Production in Poultry Houses and Its Effect on the Growth of Gallus Gallus Domestica (Broiler Chickens): A Case Study of a Small Scale Poultry House in Riverside, Kitwe, Zambia.International Journal of Scientific & Technology Research, 141–145.
- footnote[5] Back to paragraph Viegas, S., Faisca, V.M., Dias, H., Clérigo, A., Carolino, E., & Viegas, C. (2013). Occupational exposure to poultry dust and effects on the respiratory system in workers. Journal of Toxicology and Environmental Health, 230–239.
- footnote[6] Back to paragraph King, A.S., McLelland, J. Birds – their structure and function. London, Bailliere Tindall, 1984: 110–144.
- footnote[7] Back to paragraph Hofstetter, D., Lorenzoni, G. Poultry Dust – What You Need to Know About Impact on Bird Health. PennState Extension 2023.
- footnote[8] Back to paragraph Parkes, W.R. Aerosols: their definition and clearance. In: Occupational lung disorders, 3rd ed. Butterworths-Heinemann, London. pp. 35–49. 1994.
- footnote[9] Back to paragraph Wang, K., Shen, D., Dai, P., Li, C. Particulate Matter in Poultry House on Poultry Respiratory Disease: A Systematic Review. Poultry Science, Volume 102, Issue 4, 2023.
- footnote[10] Back to paragraph David, B., Moe, R.O., Michel, V., Lund, V., & Mejdell, C. (2015). Air Quality in Alternative Housing Systems May Have an Impact on Laying Hen Welfare. Part I-Dust. Animals: An Open Access Journal from MDPI, 5(3), 495–511. doi:10.3390/ani5030368
- footnote[11] Back to paragraph Wang, L., Cheng, H., Wang, D., Zhao, B., Zhang, J., Cheng, L., Yao, P., Di Narzo, A., Shen, Y., Yu, J., 2019. Airway microbiome is associated with respiratory functions and responses to ambient particulate matter exposure. Ecotoxicol. Environ. Saf. 167, 269–277.
- footnote[12] Back to paragraph Riddell, C., Schwean, K., & Classen, H.L. (1998). Inflammation of the Bronchi in Broiler Chickens, Associated with Barn Dust and the Influence of Barn Temperature. Avian Diseases, 42(2), 225–229.
- footnote[13] Back to paragraph Corbanie, E.A., Matthijs, M.G.R., van Eck, J.H.H., Remon, J.P., Landman, W.J.M., & Vervaet, C. (2006) Deposition of differently sized airborne microspheres in the respiratory tract of chickens. Avian Pathology, 35:6, 475–485.
- footnote[14] Back to paragraph Cambra-López, M., Aarnink, A., Zhao, Y., Calvet, S., Torres, A. Airborne particulate matter from livestock production systems: A review of an air pollution problem. Environmental Pollution, Volume 158, Issue 1, 2010, pages 1–17, ISSN 0269-491.
- footnote[15] Back to paragraph Shen, D., Guo, Z., Huang, K., Dai, P., Jin, X., Li, Y., Li, C. Inflammation-associated pulmonary microbiome and metabolome changes in broilers exposed to particulate matter in broiler houses. Journal of Hazardous Materials, Volume 421, 2022, 126710.
- footnote[16] Back to paragraph Madelin, T.M., Wathes, C.M. Air hygiene in a broiler house: Comparison of deep litter with raised netting floors. Br. Poult. Sci. 1989, 30, 23–37.