Economics information: 2008 survey of pesticide use in Ontario
2008 survey of pesticide use on field crops, fruit and vegetable crops, as well as selected other agricultural crops (nursery, sod and ginseng).
ISBN 978-1-4435-3357-7
Acknowledgements
The efforts of many people went into the production of this report. Their contributions are greatly appreciated and we wish to acknowledge the following people for their support:
- All the Ontario farmers who responded to this survey. Farmers receive many surveys during the course of the year and we appreciate them taking the time to provide their 2008 spray records for this survey. Thank you!
- Susan Kelner, Lorraine Goulty, Sara Vahey and Krista Fleming, Ontario Pesticide Education Program, University of Guelph Ridgetown Campus, who were responsible for the survey mailings and data entry.
- Siva Mailvaganam, Economic Development Policy Branch, Ontario Ministry of Agriculture, Food and Rural Affairs (OMAFRA), for designing the sample of fruit and vegetable producers selected for the survey and background analysis required for the horticultural crops segment.
- Hugh Martin, Jennifer Allen and summer students Kristen Kelderman and Alexandra Grosse, OMAFRA, for reviewing the raw data file to ensure data quality and consistency.
- Mike Cowbrough, OMAFRA, for assessing the herbicide components of the survey at various stages.
- Craig Hunter, Ontario Fruit and Vegetable Growers' Association, for providing valuable input.
- Various staff in the Agriculture Development Branch, OMAFRA, for reviewing portions of the manuscript during the course of its preparation.
- ARC Industries Chatham Ontario, who were responsible for stuffing all the envelopes for the survey mailings.
Funding for this project was provided by the Canada-Ontario Agreement Respecting the Great Lakes Basin Ecosystem and Environment Canada.
Introduction
Organic pesticides have been used in Ontario since the end of the Second World War. The concern expressed by many groups regarding the contamination of fish and wildlife resulted in the need to identify and quantify the pesticides used in the Great Lakes Watershed.
Canada and the United States signed the Great Lakes Water Quality Agreement in 1972. The International Joint Commission (IJC), acting for the two governments, oversees all activities in pursuance of this Agreement. As part of the Water Quality Agreement, the IJC established the Pollution from Land Use Activities Reference Group (PLUARG) to determine sources, quantify inputs, and assess the impact of inputs from a variety of land use activities on water quality. These activities include those involved with agriculture as well as forestry, city and urban areas, highways, and other industries. Documentation of the volume of each pesticide used in Ontario at sub-provincial levels was essential to these studies.
The PLUARG group requested in 1972 that a survey of pesticide use be carried out every five years in the province to identify and quantify the pesticides used in the Great Lakes Watershed. The data collected would be useful in estimating pesticide use in pursuance of the IJC Agreement; detecting trends in pesticide use by crop and by region in Ontario; and gauging the local and overall effectiveness of this Ministry's work in pest and weed control.
Since 1973, surveys of agricultural pesticide use have been carried out every five years by the Ontario Ministry of Agriculture, Food and Rural Affairs (OMAFRA). The statistical aspects of these surveys have been handled primarily by the Statistics unit of OMAFRA's Economic Development Policy Branch. The results appeared in Survey of pesticide use in Ontario, 1973 [1], 1978 [2], 1983 [3], 1988 [4], 1993 [5], 1998 [6] and 2003 [7]. While these reports dealt from time to time with non-agricultural use such as roadside spraying and commercial applicators, there has been a consistent focus on pesticide use in agricultural crops.
As was the case in 1998 and 2003, the 2008 Survey of pesticide use included field crops, fruit and vegetable crops, as well as selected other agricultural crops (nursery, sod and ginseng). Data on other types of applications have not been included on this survey occasion.
Survey of pesticide use on agricultural crops
Sample selection and editing
In Ontario, growers must comply with training requirements relating to pesticide use in order to purchase and apply pesticides to their crops. The list of certified producers is maintained at the University of Guelph Ridgetown Campus (Ridgetown College).
This list was used as the sampling frame for the 2008 version of the Pesticide Use Survey. The sample of farms to be randomly selected from the list was designed to ensure sufficient coverage on a crop by crop basis, as well as to be representative geographically.
The selected farmers received Pesticide Use Record Forms in the spring of 2008. They were requested to maintain these forms during the crop growing season by noting spraying details such as crops treated, chemical products and concentrations used, application rates, area grown and area sprayed. Respondents were asked to return the forms to Ridgetown College in the fall for manual editing and data entry.
About 1,300 forms were returned with useful information. No names, addresses, telephone numbers or other personal identifiers accompanied these forms - in fact, the only geographic identifier was the county. Each questionnaire was checked for consistency and completeness, and, as much as possible, appropriate adjustments were made for missing data.
Data processing, statistical analysis and tabulation of results were responsibilities of the Statistics Unit, Economic Development Policy Branch, Ontario Ministry of Agriculture, Food and Rural Affairs (OMAFRA). Quantities of active ingredients for each chemical were computed by multiplying area sprayed times concentration times application rate. To help ensure the plausibility of the results of these calculations, pesticide specialists with OMAFRA's Agriculture Development Branch scrutinized the estimates of active ingredient usage and reviewed application rates at various stages during the preparation of this report.
Expanding the sample data
In order to estimate total pesticide usage on all farms, it is necessary to raise the sample results by calculating appropriate expansion factors. The expansion factor for each crop is unique. These factors are calculated as the ratio of the total provincial area of a particular crop to the area of that same crop reported in the questionnaires returned. Please refer to Appendix I for a detailed example of this calculation.
Pesticide quantities used at the county level were derived by employing proportional area breakdowns once the estimation of the active ingredients of each specific pesticide by crop at the provincial level was complete. This method of allocation was used in order to avoid distortions due to low sample sizes in some counties. More stable results are obtained by first calculating a reliable provincial level estimate of pesticide use and then allocating to counties on the basis of area grown.
The assumption here is that crops are chemically treated in a somewhat similar fashion regardless of their location in the province.
The sample occasionally had limitations in that certain specific pesticides or crops were not adequately represented and hence, pesticide use in such instances could not be estimated. The use of a given pesticide may appear to be zero when, in reality, it is likely to have been applied. There are two main reasons for this result:
- the use of such pesticides was not detected in the sample; or
- the area grown to a particular crop, while existent, was still too small to be estimable in a county — hence, no expansion factor could be computed.
In addition, it should be noted that some chemicals which are no longer licensed may still be reported as stocks in storage diminish.
Additional notes
As with all recent versions of this survey, the scope of the 2008 Survey of Pesticide Use provides a measure of the agricultural use of pesticides on field crops as well as on field grown fruit and vegetable crops. The 1998, 2003 and 2008 surveys also include estimates of pesticide use on nursery crops, sod and ginseng (Appendix V).
Greenhouse spraying is not included. Surfactants (oils), seed treatments and other types of agricultural pesticide use such as livestock sprays and rodenticides are also excluded.
Summary of results
Presentation
The results of the survey are presented in tabular form in Appendices II through X. Specific pesticides have been listed by their common names in the tables to avoid bias towards trade names. Appendix VII lists the common names reported in the survey.
Appendix II shows the total amount of active ingredient (a.i.) of each specific pesticide used for each field crop in the Province. Breakdowns for each specific pesticide used on total fruit, total vegetables and other agricultural crops appear in Appendices III, IV and V, respectively.
Total pesticide use on all surveyed crops is summarized in Appendix VI (by crop or crop grouping), Appendix VII (by specific pesticide), and Appendix VIII (by region or county).
Appendices IX and X compare some 2008 pesticide use information highlighted for selected crops and selected pesticides with the results from previous surveys held in 1983, 1988, 1993, 1998 and 2003.
Finally, in cases where amounts of product used were low (i.e. under 200 kg a.i.), the estimates of pesticide use have been aggregated. Although reported as "other", these pesticides were still included in the total amounts used. Totals shown throughout the tables may not appear to add due to rounding.
Highlights
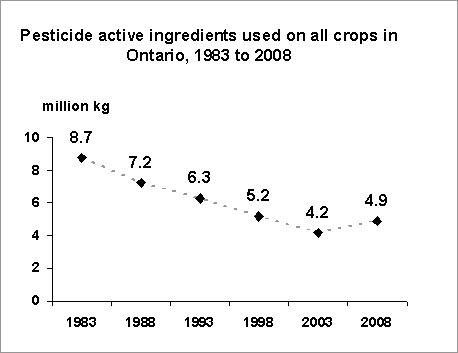
The 2008 survey shows that agricultural pesticide usage has increased by approximately 15 percent since 2003 as measured by the total active ingredient (a.i.). Previous to this survey, agricultural pesticide usage was on a continual decline. Even though there was an increase in usage from 2003 to 2008, there has been an overall reduction in pesticide usage of 45 percent over the last 25 years.
Every growing season has its unique challenges. In 2008, weather conditions were one of the contributing factors resulting in the increased use of fungicides. Many areas of Ontario experienced above normal precipitation during the 2008 growing season. The re-application of fungicides was required in some crops to manage the increased disease pressure.
There was an increase in acreage of certain crops such as wheat, soybeans, white beans, canola and hay compared to 2003, which partially accounts for the increased pesticide usage in these crops. Conversely, tobacco acreage was less compared to the 2003 growing season, which is reflected in the decreased use of nematocides in this crop.
There was an increase in glyphosate use in several crops. Total usage of glyphosate has increased by approximately 76 percent from 1,170,762 kg a.i. in 2003 to 2,062,648 kg a.i. in 2008. The increased adoption of glyphosate-tolerant crops can account for a portion of this increase.
In field corn, the use of atrazine declined by approximately 10 percent compared to 2003. However, atrazine is still an important weed management tool in field corn production as indicated by the amount that was applied to this crop (448,071 kg a.i.).
Possible explanations for other trends or changes in this survey's pesticide usage are as follows:
- The outbreak of true armyworm led to an increase in insecticides used on wheat.
- The drop in tefluthrin used in field corn is due to the increased uptake of insecticide seed treatments.
- Similarly, there is a decline in the use of dimethoate in dry beans, largely due to the new availability of a seed treatment (thiamethoxam). The seed treatment tends to reduce the need, or at least the number, of foliar applications per season for potato leafhopper control.
- Pesticides that were not previously recorded for use on certain crops may be due to new or emergency use registrations. Some examples of these new registrations are as follows:
- Propiconazole in sugarbeets (2008 emergency use registration)
- Azoxystrobin, captan and imidacloprid in ginseng
- Pendimethalin and s-metolachlor in some vegetable crops
- Oxyfluorfen in onions
- Dimethenamid in onions and grapes
- Glufosinate ammonium in some fruit crops
- Bacillus subtilis, boscalid, pyraclostrobin, pyrimethanil and trifloxystrobin in some fruit crops
Appendices
- Appendix I. Example of Methodology Used in the Estimation of Pesticide Use at the Provincial and County Levels
- Appendix II. Quantities of Specific Pesticide Active Ingredients Used on Field Crops in Ontario, 2008
- Appendix III. Quantities of Specific Pesticide Active Ingredients Used on All Fruit in Ontario, 2008
- Appendix IV. Quantities of Specific Pesticide Active Ingredients Used on All Vegetables in Ontario, 2008
- Appendix V. Quantities of Specific Pesticide Active Ingredients Used on Other Agricultural Crops in Ontario, 2008
- Appendix VI. Quantities of Active Ingredients of Each Type of Pesticide Used on All Surveyed Crops in Ontario, 2008
- Appendix VII. Quantities of Specific Pesticide Active Ingredients Used on All Surveyed Crops in Ontario, 2008
- Appendix VIII. Quantities of Active Ingredients of Each Type of Pesticide Used on All Surveyed Crops in 2008, by Region and County, Ontario
- Appendix IX. Comparison of Total Active Ingredients Used on Major Crops and for Selected Pesticide Groupings, 1983, 1988, 1993, 1998, 2003 and 2008
- Appendix X. Comparison of Total Active Ingredients Used per Hectare on Major Crops and for Selected Pesticide Groupings, 1983, 1988, 1993, 1998, 2003 and 2008
Pesticide active ingredients used on all crops in Ontario, 1983 to 2008
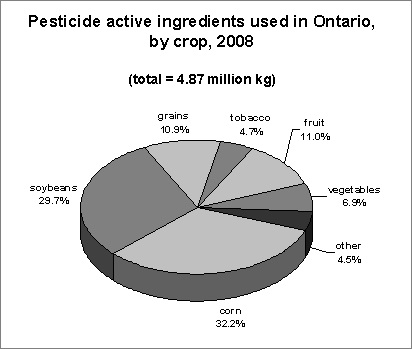
Pesticide active ingredients used in Ontario, by crop, 2008
References
- Roller, N.F. Survey of Pesticide Use in Ontario, 1973. Economics Information. Toronto: Economics Branch, Ontario Ministry of Agriculture and Food, 1975.
- Roller, N.F. Survey of Pesticide Use in Ontario, 1978. Economics Information. Toronto: Economics Branch, Ontario Ministry of Agriculture and Food, 1979.
- McGee, W.G. Survey of Pesticide Use in Ontario, 1983. Economics Information. Toronto: Economics and Policy Coordination Branch, Ontario Ministry of Agriculture and Food, 1984.
- Moxley, J. Survey of Pesticide Use in Ontario, 1988. Economics Information. Toronto: Economics and Policy Coordination Branch, Ontario Ministry of Agriculture and Food, 1989.
- Hunter, C. and McGee, W.G. Survey of Pesticide Use in Ontario, 1993. Economics Information. Toronto: Policy Analysis Branch, Ontario Ministry of Agriculture, Food and Rural Affairs, 1994.
- Hunter, C. and McGee, W.G. Survey of Pesticide Use in Ontario, 1998. Economics Information. Guelph: Policy Analysis Branch, Ontario Ministry of Agriculture, Food and Rural Affairs, 1999.
- McGee, W.G., Berges, H. and Callow, K. Survey of Pesticide Use in Ontario, 2003. Economics Information. Guelph: Policy and Programs Branch, Ontario Ministry of Agriculture, Food and Rural Affairs, 2004.
- University of Guelph Ridgetown Campus (Ridgetown College). Ontario Pesticide Education Program (database of producers certified for pesticide application). Ridgetown.
- Ontario Ministry of Agriculture, Food and Rural Affairs. Statistics Unit (2008 crop area estimates). Guelph.
- Agronomy Guide for Field Crops. Publication 811. Guelph.
- Field Crop Protection Guide. Publication 812. Guelph.
- Fruit Production Recommendations. Publication 360. Guelph.
- Vegetable Production Recommendations. Publication 363. Guelph.
- Guide to Weed Control. Publication 75. Guelph.
- Production Recommendations for Ginseng. Publication 610. Guelph.
- Nursery and Landscape Plant Production and IPM. Publication 383. Guelph.
- Turfgrass Management Recommendations. Publication 384. Guelph.
- Health Canada. Pest Management Regulatory Agency website. Ottawa.
- Statistics Canada. 2008 Fruit and Vegetable Area Survey. Ottawa.
- Statistics Canada. 2006 Census of Agriculture. No. 95F0301XIE. Ottawa.